SCENARIOS POST FORECLOSURE CRISIS IN CATALONIA: ACCUMULATION OF HOUSING BY BANKS AS THE FIRST STEP FOR THE RISE OF LARGE PRIVATE LANDLORDS
←
→
Page content transcription
If your browser does not render page correctly, please read the page content below
2021                                                                                            Vol. 75 · No. 2 · 105–120

                   SCENARIOS POST FORECLOSURE CRISIS IN CATALONIA:
                    ACCUMULATION OF HOUSING BY BANKS AS THE FIRST
                     STEP FOR THE RISE OF LARGE PRIVATE LANDLORDS

                  A ntoni Domènech, A aron Gutiérrez and Josep-M aria A rauzo-Carod
                                                With 2 figures and 6 tables
                                      Received 10 August 2020 · Accepted 3 June 2021

Summary: The article analyses the uneven geography of foreclosed housing owned by large private landlords in Catalonia.
A Negative Binomial Model is applied to identify the local determinants of the concentration patterns of 32,941 hous-
ing units in Catalan cities. Indicators of socioeconomic vulnerability, such as the percentage of foreign population or the
percentage of unemployed residents, are identified as key explanatory factors of the regional geography of housing ac-
cumulated by banks which, in turn, correspond to areas in which global corporate landlords are focusing their business for
profiteering from the rental market in the current expansionist phase of the housing cycle. Our findings demonstrate that
the concentration of properties in the most vulnerable areas was fuelled by foreclosures responsibility of banks rescued with
public funds. In tandem, we provide detailed information for the understanding of the new scenarios that have emerged
during the post-crisis phase.

Zusammenfassung: Der Artikel analysiert die ungleiche Geographie zwangsversteigerter Immobilien im Besitz großer
privater Wohnungsgesellschaften in Katalonien. Ein negatives Binomialmodell wird angewendet, um die lokalen Determi-
nanten der Konzentrationsmuster von 32.941 Wohneinheiten in katalanischen Städten zu identifizieren. Indikatoren der
sozioökonomischen Verwundbarkeit, wie der Anteil der ausländischen Bevölkerung oder der Anteil der arbeitslosen Ein-
wohner, werden als wesentliche Erklärungsfaktoren für die regionale Geographie des von Banken angesammelten Woh-
nungsbestands identifiziert, die wiederum den Bereichen entsprechen, in denen globale Vermieter ihre Schwerpunkte setzen
um in der gegenwärtigen Expansionsphase des Wohnungszyklus vom Mietmarkt zu profitieren. Unsere Ergebnisse zeigen,
dass die Konzentration von Immobilien in den am stärksten gefährdeten Gebieten durch die Zwangsvollstreckungsver-
antwortung von Banken, die mit öffentlichen Mitteln gerettet wurden, angeheizt wurde. Gleichzeitig liefern wir detaillierte
Informationen zum Verständnis neuer Szenarien, die sich in der Nachkrisenphase ergeben haben.

Keywords: foreclosures, evictions, housing crisis, corporate landlords, Catalonia

1   Introduction                                                with the highest number of mortgage foreclosures
                                                                (near to 700,000) and evictions (380,000) since 2008
    After the bursting of the property bubble fol-              (Beswick et al. 2016; Gutiérrez and Dòmenech
lowing the global financial crash in 2008, the closure          2020). The acquisition of housing stock by banks
of production facilities, the growth in unemploy-               has been a phenomenon accompanied, and even
ment and the spread of poverty and social exclusion             boosted, by the processes of restructuring and sani-
were some of the common patterns among devel-                   tising of the Spanish financial sector (A lexandri
oped countries. One of the main manifestations of               and Janoschka 2018; Vives-M iró and Gutiérrez
that situation was the proliferation of evictions via           2017). The restructuring process involved the so-
mortgage foreclosures caused by the inability of a              cialisation of losses through the rescue with public
high number of families to meet the cost of their               funds of the Spanish financial sector and the con-
mortgage loans. The burst of the bubble, there-                 version of regional saving banks into private banks
fore, brought a wave of evictions that in the first             (Gutiérrez and Vives-M iró 2018). According
years was mainly due to repossession of mortgaged               to data from the Bank of Spain, the value of di-
properties by lenders, but during the last years they           rect aid to the banking sector reached €61,000M.1)
have predominantly been the consequence of rent
arrears (K enna et al. 2016; Parreño -Castellano                    1)
                                                                      See a detailed analysis on https://www.bde.es/bde/es/
et al. 2019). Spain has been the European country               secciones/prensa/infointeres/reestructuracion/

          https://doi.org/10.3112/erdkunde.2021.02.03                    ISSN 0014-0015 (Print) · ISSN 2702-5985 (Online)
106 Vol. 75 · No. 2
However, the data provided by the Citizen Debt process known in the literature as “bulk buy-to-let”
Audit Platform indicate a much higher figure. They (Nethercorte 2019), consisting on acquiring large-
amount to €1.4 billion in the total volume of pub- volume of existing housing stock and converting it
lic money that has injected directly or indirectly to rental accommodation.
into financial institutions (Plataforma auditoría At present, around 30 SOCIMIs are dedicated
ciudadana de la deuda 2013). Meanwhile, the sani- to the management of housing rental in Spain.
tising process consisted on transferring assets from Among them, the North American investment
the property sector (land, empty/unsold/unfinished fund Blackstone stands out for being the largest
housing and housing acquired through mortgage housing landlord with more than 30,000 housing
foreclosure) to private investors, investment com- units.2) Since the impact of evictions via mortgage
panies (such as vulture funds) or to the SAREB foreclosures was not equally distributed through
(Company for the Management of Assets proceed- the country, the ongoing expansionist phase of the
ing from the Restructuring of the Banking System housing cycle dominated by the accumulation of
– Sociedad de Gestión de Activos Procedentes housing, first in hands of the banking sector and
de la Reestructuración Bancaria). The latter is the now in those of the REITs (Beswick et al. 2016;
Spanish “bad bank,” a half-publicly funded society García-L amarca 2020) it is expected to have also
set up in 2012 (Law 24/2012 and Law 1559/2012) as an uneven distribution.
part of the bank bailout with a mandate to acquire Considering this context, the main objective of
housing portfolios and loans at high risk of default this study is to unravel the socio-spatial determi-
or in arrears from banks rescued with public funds nants of the uneven geography of the accumulation
in order to sell them. The Fund for Orderly Bank of empty housing by large landlords in Catalonia in
Restructuring ( FROB), created with public funds the post-foreclosure crisis context. Following that
in 2009 (Law 9/2009) to promote the restructur- main objective, the study allows us to achieve two
ing of the Spanish financial system, is the main related specific subobjectives: to weigh the different
shareholder of SAREB with 45% of the company’s role of that each of the main Spanish banks played in
capital and contributed, in its constitution, with the previously mentioned spatial logics; and to iden-
€2,192M of public funds (Byrne 2015; Gutiérrez tify the territories that, as a consequence of the ac-
and Domènech 2017). cumulation of assets, could become protagonists in
Therefore, both banks and the SAREB have set the arrival of global investment funds looking for the
out a clear strategy involving the sale of their prop- profiteering from the rental market in the expansion-
erty portfolios to global corporate landlords. This ist phase of the housing cycle. The study is based on
transfer of assets has been accelerated by the ap- an extraction of data from the register of empty hous-
proval of laws that have given favourable fiscal con- ing units owned by large private landlords belonging
ditions to investment companies in the real estate to the Catalan Housing Agency, which is a public en-
sector (SOCIMIs, the Spanish REITs – Real Estate tity belonging to the Government of Catalonia. This
Investment Trust) ( Janoschka et al. 2019). In fact, register is the unique that exists in Spain and, at the
Law 16/2012 (on tax measures aimed at consolidat- moment of extraction (March 2016), the majority of
ing public finances and boosting economic activ- the landlords were Spanish banks, real estate compa-
ity) modified and improved the already favourable nies related to the banks and the SAREB.
conditions for these companies with respect to Law According to the aforementioned research
11/2009, through a reduction of corporation taxes. objectives, we analyse the socio-spatial logics the
Therefore, in Spain, as has happened in Ireland and housing units that, as of March 2016, were in hands
many other western countries, the introduction of of large private landlords. We assume that local het-
REITs is part of the solution to the crisis (A albers, erogeneities matter in terms of occurrence likeli-
2019; Waldron, 2018). Undervalued housing is se- hood of these phenomena. Accordingly, instead of
lectively included in a revised financial accumula- strategies followed by previous empirical contribu-
tion regime based on rental housing. Thus, the tions that analyse evictions via foreclosure only as
ongoing expansionist phase of the housing cycle is a function of individual characteristics of housing
(and will be) dominated by investment funds (also tenants, this paper focuses on territorial character-
called vulture funds) by means of the extraction of istics that may play a similar role in explaining the
profits from the rising prices of the rental market
(Byrne 2019; Fields 2018). The financialization of 2)
https://www.eldiario.es/economia/Blackstone-
the real estate has been, therefore, expanded by the controla-viviendas-alquiler-socimis_0_901160622.html2021 A. Domènech et al.:Scenarios post foreclosure crisis in Catalonia: accumulation of housing by banks ... 107
scenarios post-crisis. Obviously, we do not neglect 2010) or the falling of the housing market values
individual specific characteristics as age, income or (L in et al. 2009). Although a global phenomenon,
country of origin that have been previously identi- the impact has varied depending on the economic
fied as important determinants, but we concentrate base of each country or region. For instance, bank-
on how common characteristics existing at local dominated economies (R aya 2017) and economic
level (i.e., municipality) may also help to explain the models built on property-based debt (M éndez
accumulation of housing by large private landlords. 2018), as the Spanish, have been the most affected.
This approach is quite innovative for the Spanish The ongoing restructuring of housing markets as
case, since previous empirical evidence consists on well as the housing policies implemented after the
approaches that are descriptive (García-L amarca global financial crisis of 2008 are re-shaping cit-
2020; Gutiérrez and Vives-M iró 2018), have a ies and neighbourhoods worldwide (Fields and
geospatial dimension (Gutiérrez and Domènech Hodkinson 2018). A growing literature critically
2017; Gutiérrez and Delclòs 2016) or focus on studies the “solutions” of the financial and housing
individual characteristics (R aya 2018), but no ter- crisis adopted by most EU national governments,
ritorial econometric approach has ever been used at the USA , and international institutions and their
the local level to analyse an entire region, as we do deep impact in urban areas. These solutions imply,
here. The structure of this paper is as follows. After as mentioned previously, the socialisation of losses
this introduction, the second section introduced a through the rescue of banks with public funds, and
review of the background of the study. The third the creation of societies (“bad banks”) that allow
section details the data used and methods imple- to reintroduce liquidity to the financial system,
mented. The fourth section describes and discusses concentrate the toxic property assets, and facilitate
the main results and the fifth section concludes and the transition after the crash to the new expansive
analyses the main implications of our study. housing cycle (Byrne 2015). It is in this framework
when the global corporate landlords (mainly invest-
ment funds) could emerge as key actors in the post-
2 Background crisis scenario, by acquiring large amount of hous-
ing stock from rescued or “bad banks” (Gutiérrez
During the last decade, a significant number of and Domènech 2020).
studies have been analysing the spatiality of evic- In fact, after the crash in 2008, banks accumu-
tions and foreclosures. The USA is the country lated a huge volume of housing in working-class
with the most complete literature in this field, but neighbourhoods and played a key role in the man-
European countries such as Spain, UK or Ireland, agement of the so-called toxic or distressed real
that have faced intensively the mortgage crisis have estate assets (Byrne 2015; García-L amarca 2020).
also a large literature studying the spatial logics of Thanks to the transfer of these large housing port-
foreclosures and evictions in different territorial folios to “bad banks” as the SAREB -one of the
scales. Their results indicate that not only those biggest in Europe-, they are playing now the role
countries, regions and neighbourhoods most affect- of “market makers” and generating a framework to
ed by the wave of evictions and foreclosures were facilitate new rounds of profit in the housing mar-
most exposed to the property bubble and construc- ket ( Janoschka et al. 2019). After the creation of
tion boom (Burriel 2014), but they also were the SAREB in 2014, the track was ready for the arrival
most social and economically vulnerable (M edina and investment of global corporate landlords, pri-
et al. 2020; M éndez and P laza 2016). The evi- vate equity firms and hedge funds.
dences in these countries show that concentration The logics of these phenomena are rather ex-
of foreclosures in these areas has contributed to plored and analysed from a spatial perspective.
deepen precariousness (García-H ernández and Hence, although different studies framed in the USA
Ginés-De L a Nuez 2020 Gutiérrez and A rauzo - (Fields 2018), Australia (Pawson and M artin 2020),
Carod 2018; Parreño -Castellano et al. 2018) Greece (A lexandri and Janoschka 2018), Ireland
and has led to negative spillover effects (K im and (Byrne 2019), the United Kingdom (Beswick et
Cho 2016; L in et al. 2009) such as the deteriora- al. 2016; Byrne 2019) and Spain (Byrne 2019;
tion of public health (Wang 2020; L ibman et al. Gutiérrez and Domènech 2017; Janoschka et al.
2012), the increase in crime rates (I mmergluck and 2019) analyse the role of these new large private
Smith 2006), the intensification of social stigma- landlords in the management of the housing stock
tisation and racial segregation (Rugh and M assey after the crisis, there is a scarcity of them pinpointing108 Vol. 75 · No. 2
potential areas of action in which they are concen- cluded in this study, as it is not related to an evic-
trating its activity in the ongoing expansionist phase tion of residents due to mortgage foreclosure. The
of the housing cycle. stock of empty housing owned by banks collected
Within this context, our study aims to add new in this dataset is a sample that previous studies
empirical evidence that helps to explain the socio- estimate that covers more than 40% of the total
spatial logics of these processes in Catalonia. The number of evictions via mortgage foreclosure in
dataset used allows us to identify the specific mo- Catalonia during the period 2008-2015 (Gutiérrez
mentum in 2016, when the largest Spanish banks and Domènech 2018). It should also by noted that,
and the SAREB have accumulated a high volume as this data is a stock of empty foreclosed hous-
of empty housing acquired via foreclosures during ing in 2016, it could overrepresent the territories
years after the crash of the bubble, and prior to pro- with less profitability in the housing market. The
gressively transferring these assets to global invest- foreclosed properties in the areas with higher prof-
ment funds. itability could be sold or rented more quickly than
the others.
The second type of data about territorial char-
3 Empirical approach acteristics that may influence the accumulation of
HOB has been obtained from the Catalan Statistical
The empirical approach of this article consists of Institute ( IDESCAT ), the Catalan Cartographical
the development of an econometric analysis. In this Institute (CCI ), the Spanish Ministry of Public
section we present the data related to the dependent Works, and the Spanish Statistical Institute ( INE).3)
variable and the explanatory variables, as well as the In view that some municipality-level statistical in-
selected econometric model. formation provided by IDESCAT is only available
for those municipalities larger than 5,000 inhabit-
ants, we do not cover all Catalan municipalities but
3.1 Data only those over that threshold size (specifically, 213
out of 947). Despite this, the sample is representa-
The dataset used in this study is composed by tive of the whole population, since it accounts for
two main types of data: data about housing units in the 89.6% of the total population and the 88.3% of
hands of large private landlords acquired via mort- the HOB in Catalonia. Thus, the large private land-
gage foreclosure; and data about territorial charac- lords own a total of 32,941 housing units in these
teristics assumed to influence the accumulation of 213 municipalities.
housing in hands of large private landlords. Data on territorial characteristics has been cho-
The first type of data was obtained from the sen considering two basic assumptions. The first
register of empty housing units owned by banks one is that evictions via mortgage foreclosures are
( HOB) that was created by the Catalan Housing closely related with previous socioeconomic condi-
Agency in March 2016, after the approval of the tions and with some geographically specific attrib-
Law 14/2015 (on empty homes tax). This register utes. The second one is that actual socioeconomic
includes the number of housing units acquired via conditions and geographical attributes contribute
mortgage foreclosures that were not initially put up to hinder, for the moment being, the sale/rental
for auction and that had not yet been sold, either to of these HOB. Therefore, as indicated in Table 1,
private individuals or investment funds, when the the variables included are related to: agglomeration
register was created. It should be noted that it was economies; socioeconomic conditions; human capi-
possible to distinguish between two types of hous- tal characteristics; and real estate characteristics.
ing accumulated by banks. Firstly, there is the one Additionally, as we want to weigh the role exerted
that is of interest for our study, the owner-occupied by the Spanish banks and the SAREB in the socio-
housing with mortgages or, in other words, loans spatial logics of housing accumulation at the mu-
that fell into arrears and, consequently supposed nicipal level and we hypothesize that not all banks
an eviction. Secondly, the new housing units that behave in the same way when facing management
had never been occupied and that ended up in the of real estate business and foreclosures, we have
hands of the banks through the execution of the added a fifth vector: banks.
mortgages of the companies that owned and com-
mercialised them (construction companies and/or 3)
Explanatory variables are lagged some years in order to
property agents). This second typology was not in- control for potential endogeneity.2021 A. Domènech et al.:Scenarios post foreclosure crisis in Catalonia: accumulation of housing by banks ... 109
Tab. 1: Explanatory variables: definition and sources
Variable Definition Source
Agglomeration economies
GDP GDP per capita (2011) IDESCAT
CAPITAL Dummy variable (1 if municipality is a county capital) CCI
Socioeconomic conditions
UNEMP Unemployment rate (2011) IDESCAT
UNEMPCHG Change in unemployment rate (2001-2011) Authors’ calculations from IDESCAT
SERVICES Employed in services over active population (2011) IDESCAT
Human capital characteristics
FOREIGN Percentage of foreign residents from non-OECD countries IDESCAT
(2011)
FOR_CHG Change of residents born at foreign countries (2001-2011) Authors’ calculations from IDESCAT
YOUNG Population younger than 10 (2011) IDESCAT
Real state characteristics
TRANS Number of real estate transactions (2004-2007) Spanish Ministry of Public Works
LOANS Percentage of housing units with outstanding payments with INE
respect to the total of main housing units (2011)
Banks
BBVA Number of HOBs owned by BBVA Own elaboration with data from the
CAIXABANK Number of HOBs owned by CAIXABANK Catalan Housing Agency; Bank of
SANTANDER Number of HOBs owned by SANTANDER Spain
OTHER BANKS Number of HOBs owned by other banks
SAREB Number of HOBs owned by SAREB
Agglomeration economies include GDP per capita ants younger than 10 years old in 2011 ( YOUNG).
(GDP) and a dummy variable indicating whether These social characteristics help to indicate capac-
municipalities are county capitals (CAPITAL). It is ity of individuals to afford paying mortgage pay-
important to notice that agglomeration economies ments and exposure to home foreclosures and
are key determinants to foster economic activities mortgages. Migrants from non- OECD countries
and, consequently, they act as important market ( FOREIGN ) tend to have lower income levels and
forces. have been exposed to more abusive interest rates in
Economic conditions include unemployment rate Spain (Díaz-Serrano and R aya 2014), whilst mu-
in 2011 ( UNEMP), change in unemployment rate nicipalities with younger populations ( YOUNG) are
between 2001 and 2011 ( UNEMPCHG), and per- more prone to be involved with mortgage payments
centage of workers employed in service industries and, consequently, are more exposed to home fore-
in 2011 (SERVICES). Among previous covariates, closures (i.e., families with kids push up demand
unemployment level ( UNEMP) proxies the eco- for purchasing dwellings in the real estate markets).
nomic vulnerability of the population, since being In this regard, the variable of inhabitants younger
unemployed is associated with a lower income that, than 10 years old is used as an exposure variable to
in turn, reduces the capacity to afford mortgage control for the potential count of HOB.
payments and increases the probability of an evic- Finally, real estate characteristics include the num-
tion happening (G onzález-P érez et al. 2020). In ber of transactions during the peak (2004-2007) of
a similar way, an increase in unemployment indi- the real estate bubble ( TRANS), and a percentage
cates a worsening of the capacity to afford these of housing units with outstanding payments with
payments. As for the industry distribution of work- respect to the total of main housing units in 2011
force, it serves as control variable and there are no ( LOANS). Both variables are expected to act posi-
ex-ante expectations about their role over evictions. tively over HOB since an important percentage of
Human capital characteristics include percentage real estate transactions during the bubble period
(2011) of foreign residents born in non- OECD were artificially fostered by bubble conditions and,
countries ( FOREIGN ), change in foreign residents therefore, hazard rates linked to mortgage pay-
between 2001 and 2011 ( FOR _CHG), and inhabit- ments were quite important.110 Vol. 75 · No. 2
Tab. 2: Correlation among variables
HOB GDP CAPITAL UNEMP UNEMPCHG SERVICES FOREIGN FOR_CHG YOUNG TRANS LOANS
HOB 1.0000
GDP 0.0137 1.0000
CAPITAL 0.2770* 0.0341 1.0000
UNEMP 0.2896* -0.1229* 0.0545 1.0000
UNEMPCHG -0.0418 -0.0110 0.0682 0.1246* 1.0000
SERVICES 0.3054* -0.3141* 0.2101* -0.0107 -0.1884* 1.0000
FOREIGN 0.3246* -0.0107 0.2745* 0.3650* 0.1808* 0.1648* 1.0000
FOR_CHG 0.1097 0.0558 0.2176* 0.0846 0.2050* -0.1175* 0.2564* 1.0000
YOUNG 0.7842* 0.0984 0.2084* 0.0751 -0.1617* 0.2444* 0.1262* -0.0240 1.0000
TRANS 0.6577* -0.0646 0.1099 0.3437* -0.0232 0.3398* 0.3413* 0.0232 0.3003* 1.0000
LOANS -0.1115 0.0544 -0.3809* 0.0694 0.2651* -0.1281* -0.3768* -0.1265* -0.1304* -0.0115 1.0000
Note: Significant correlations at 10%.
Source: Own elaboration with data from the register of empty housing units acquired by banks of the Catalan Housing Agency, the
Catalan Statistical Institute (IDESCAT), the Catalan Cartographical Institute (CCI), the Spanish Ministry of Public Works, and the
Spanish Statistical Institute (INE).
In order to give a descriptive overview of the owned by large private landlords) are recorded at a
variables used in this paper, we provide a correlation highly disaggregated territorial level (e.g., munici-
table (see Tab. 2) showing that there are no major palities) as in the large dataset used in our study
problems in terms of correlation between explana- (i.e., it includes 213 Catalan municipalities). Our
tory variables. In addition, we have also controlled econometric strategy consists of two stages:
for multicollinearity (see Cameron and Trivedi • In the first stage we analyse the effects of the
2010 for details) with negative results. Based on first four dimensions over HOB (agglomeration
these results, we were able to use all the independ- economies, socioeconomic conditions, human
ent variables in the econometric estimation. capital, and real state characteristics).
Source: Own elaboration with data from the • In the second one we focus on bank specifici-
register of empty housing units acquired by banks of ties in terms of accumulation of foreclosures at
the Catalan Housing Agency, the Catalan Statistical the municipal level.
Institute ( IDESCAT ), the Catalan Cartographical
Institute (CCI ), the Spanish Ministry of Public In this paper we assume that the dependent
Works, and the Spanish Statistical Institute ( INE). variable (i.e., the number of HOB) has a random
Poisson distribution in which the parameter λ i
is related to the regressor vector xi that measures
3.2 Methods site characteristics. Concretely, we assume that the
probability of an eviction depends on the specific
According to the characteristics of our depend- characteristics of the municipality:
ent variable (i.e., HOB by municipality) the econo-
metric methodology that fits better corresponds to
-λi yi
Pr ( yi xi )= e y ! ,yi = 0, 1, 2, ..., n
λ
count data models (CDM ). This is because of the i
dependent variable has a Poisson distribution (see
Fig. 1) rather than a normal one, which makes inap- where λ i is dependent on the vector of explana-
propriate using alternative estimations procedures tory variables (municipality characteristics including
such as OLS. vectors for agglomeration economies, socioeconomic
CDM are especially useful when the events conditions, human capital characteristics and real es-
being analysed (i.e., the number of housing units tate characteristics):2021 A. Domènech et al.:Scenarios post foreclosure crisis in Catalonia: accumulation of housing by banks ... 111
20
15
percentag
10
5
0
0 500 1000 1500 2000
Housing units owned by banks
Fig. 1. Distribution of HOB. Source: own elaboration with data from the register of empty housing units belonging to
large private landlords of the Catalan Housing Agency.
lnλ i = β'xi where ε i shows some cross-sectional hetero-
geneity with exp(ε i) having a υ distribution with
and β denotes a vector of coefficients of explana- mean 1.0 and variance α. As in NBM variance is
tory variables to be estimated. An assumption of allowed to exceed the mean, then variance is as
Poisson models is that conditional mean and vari- follows:
ance functions equal λ i :
var[ y i|x i ] = E[ y i|x i ]{1 + αE[ y i|x i ]}
E[ yi|xi] = var[ yi|xi] = λ i
The traditional NBM has the same distributional
But descriptive statistics presented in Table 3, assumptions as the Poisson distribution, with the
in which are compared our sample of municipali- exception of a dispersion parameter (Hilbe, 2014).
ties (i.e., those larger than 5,000 inhabitants) and all Overall, for this particular case the existence of over-
Catalan municipalities, indicate that there is overd- dispersion as well as the results from AIC and BIC
ispersion, as standard deviation exceeds the mean. support using NBM instead of a standard Poisson
In these cases, a common solution is to use model ( PM ). Other inflated versions such as ZIP or
a Negative Binomial Model ( NBM ), a generalized ZINB are not needed in view that there is no zero
version of the Poisson model that introduces the inflation of the dependent variable.
unobserved effect into the conditional mean:
lnλ i = β' x i + ε i
Tab. 3: Descriptive statistics about HOB distribution by municipalities in Catalonia
Area Mean Standard deviation Min Max % of zeroes
Selected municipalities (213) 154.6714 297.0693 6 2349 0
All Catalan municipalities (947) 39.3981 153.9832 0 2349 22.18
Source: Own elaboration with data from the register of empty housing units acquired by banks of the Catalan Housing Agency.112 Vol. 75 · No. 2
4 Results and discussion tends to reflect the urban rank, but also the areas
most affected by the “urbanization tsunami” during
4.1 The uneven geography of housing accumu- the bubble boom years (Domènech and Gutiérrez
lated by banks in Catalonia 2018; M éndez and Plaza 2016). Thus, in the first
place, Barcelona (2,349 HOB) and its metropolitan
The geographical distribution of housing units environment, the coastal municipalities and the
owned by large private landlords is key to understand provincial capitals with their corresponding ur-
the spatial logics of the ongoing expansionist phase ban systems (Lleida -1,212-, Tarragona -1,094- and
led by structured bulk sales of bank-owned housing Girona -521-) stand out over the rest of the munici-
units to global corporate funds, that extract profits palities. Similarly, the geographical distribution of
from the rental market (Byrne 2019; Nethercorte HOB shows high values in medium-sized cities (be-
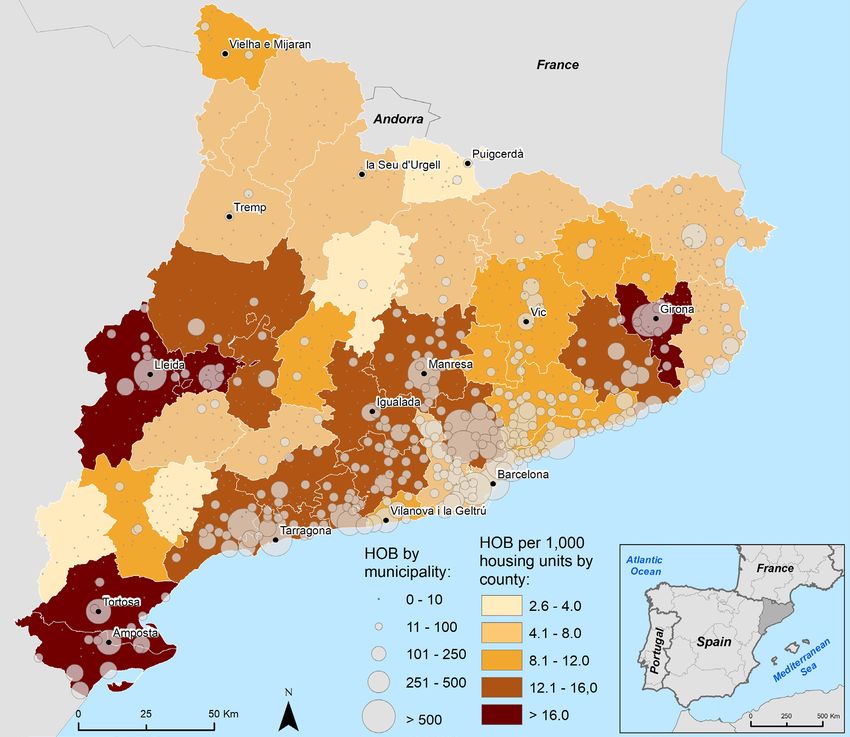
2019). Figure 2 shows the spatial distribution of tween 15,000 and 70,000 inhabitants) in the inland
HOB in Catalonia by municipalities (in absolute val- and southern parts of Catalonia, such as the county
ues) and by counties (values standardised per 1,000 capitals of Amposta (385), Balaguer (245), Figueres
housing units). In general terms, the representation (325), Manresa (585), Mollerussa (251), Tortosa (443)
in absolute values and by municipalities not only and Vic (245).
Fig. 2: Spatial distribution of HOB by municipalities (in absolute values) and by counties (values standardised per 1,000
housing units). Source: Own elaboration with data from the register of empty housing units acquired by banks from the
Catalan Housing Agency and the Catalan Cartographical Institute (CCI)2021 A. Domènech et al.:Scenarios post foreclosure crisis in Catalonia: accumulation of housing by banks ... 113
Analogously, the observation of relativised val- the percentage of housing units with outstanding
ues by county provides a clear sign of uneven geo- payments with respect to the total of main housing
graphical distribution of housing in hands of banks. units in 2011 ( LOANS), that also loses significance
These territories correspond to the areas of expan- in one specification.
sion of the metropolitan region of Barcelona to the Regarding agglomeration economies, these
inland areas of Catalonia, but also in both northern partially explain number of HOB as both variables
and southern seaside areas. These spillover effects included in this category have an unequal impact.
are also reflected in small and medium-sized inland In this sense, whilst being capital of the county
cities (county capitals such as Figueres, Igualada where the municipality is located (CAPITAL) posi-
and Manresa), but also in municipalities in their tively affects the accumulation of housing in hands
immediate surroundings. Of particular note is the of large private landlords, GDP per capita (GDP)
urban crown of the city of Lleida, where not only is only significant for the first (baseline) specifica-
other capitals of county, such as Tàrrega, Balaguer tion where HOB are hypothesized to be explained
and Mollerussa present both high relative and ab- only in terms of GDP per capita and unemploy-
solute values, but also municipalities with less than ment ( UNEMP). Then, when additional covariates
10.000 inhabitants, influenced by the dynamics of are used, previous explanatory power of GDP is
these county capitals, that were highly exposed to absorbed by these new covariates, suggesting com-
overindebtedness and were object of speculative ur- plexity of foreclosures’ phenomenon. These results
ban projects. go in line with those obtained by Gutiérrez and
However, the most intense impact is manifested Vives-M iró (2018). Specifically, they detected a
in the southern municipalities (Amposta, Deltebre, negative correlation between the values of gross
Sant Carles de la Ràpita, Tortosa and Ulldecona), disposable household income per inhabitant per
that perceived the rapid growth of construction, municipality and the ratio of HOB per 1,000 hous-
along with the tourist potential of the Ebre Delta, ing units. However, they concluded that not only
a haven for profitable investment and income gen- the GDP plays a key role but, more importantly, the
eration in a region with low economic dynamism variables related to socioeconomic vulnerability are
(Domènech and Gutiérrez 2018). the most important ones. The role of county capi-
tal is explained according to location of public and
private services in these municipalities that, in ad-
4.2 Socio-spatial logics of housing stock accu- dition to attract residents, pushes up clustering of
mulation at municipal level inequalities and increases exposure to evictions via
mortgage foreclosure.
The spatial logics of the empty housing units Economic conditions are captured by the un-
accumulated by banks and the SAREB shown in employment rate in 2011 ( UNEMP), the change
the previous section intrinsically reveal the social in unemployment between 2001 and 2011
inequalities of the region under analysis (Catalonia). ( UNEMPCHG) and the percentage of workers em-
The econometric territorial approach followed has ployed in service industries in 2011 (SERVICE).
allowed us to confirm previous expectations, as Among these variables, unemployment is the one
most of previously detailed local characteristics that has a persistent positive effect over HOB. This
(i.e., agglomeration economies, economic condi- is a logical and expected result as capacity of resi-
tions, human capital characteristics and real estate dents to afford mortgage payments is lowered in
characteristics) strongly determine the number of areas with higher unemployment levels (Gutiérrez
HOB. and Delclòs 2016; Domènech and Gutiérrez
Concretely, as can be seen in Table 4, a parsimo- 2018), as unemployment pushes available income
nious strategy was followed, in which we departed down. Nevertheless, increase in unemployment
from a baseline count data specification with only (i.e., increased unemployment rates, according to
two covariates (i.e., unemployment rate and GDP our data) does not affect significantly the number of
per capita) and then we added progressively the HOB, which may be explained because new unem-
other explanatory variables. These estimations are ployed workers are randomly distributed across all
quite robust since all the variables keep their sign municipalities in view of magnitude and geographi-
and significance across the different versions. There cal scope of recent economic crisis in Catalonia.
is only the exception of GDP per capita that loses Finally, positive effect of employment in services
significance from the second specification on, and over HOB corroborates that more unstable and ex-114 Vol. 75 · No. 2
Tab. 4: Determinants of HOB: baseline specifications
(1) (2) (3) (4) (5) (6) (7) (8) (9)
GDP 0.0242*** 0.00367 0.00461 0.00787 0.00789 -0.00281 -0.00236 -0.00290 0.000761
(0.00716) (0.00588) (0.00543) (0.00475) (0.00477) (0.00336) (0.00339) (0.00329) (0.00346)
UNEMP 29.67*** 28.36*** 22.03*** 15.36*** 14.98*** 15.64*** 15.66*** 15.18*** 16.44***
(2.767) (2.460) (2.613) (2.316) (2.381) (1.839) (1.816) (1.787) (1.800)
CAPITAL 1.132*** 0.900*** 1.128*** 1.161*** 0.563*** 0.537*** 0.490*** 0.398***
(0.163) (0.161) (0.146) (0.154) (0.119) (0.120) (0.117) (0.116)
FOREIGN 7.596*** 3.908** 4.258** 5.133*** 4.697*** 4.261*** 3.774***
(1.420) (1.210) (1.322) (1.009) (1.032) (1.021) (1.007)
TRANS 0.000160*** 0.000159*** 0.000110*** 0.000111*** 0.000118*** 0.000111***
(0.0000219) (0.0000218) (0.0000222) (0.0000225) (0.0000218) (0.0000200)
LOANS 0.434 1.877*** 1.524** 1.650** 1.502**
(0.640) (0.512) (0.555) (0.542) (0.529)
YOUNG 0.0000494*** 0.0000527*** 0.0000500*** 0.0000418***
(0.0000105) (0.0000111) (0.0000102) (0.00000848)
UNEMPCHG 0.000552 0.000335 0.000504
(0.000338) (0.000338) (0.000334)
FOR_CHG 0.0864** 0.0927**
(0.0293) (0.0291)
SERVICES 1.094**
(0.346)
Cons. 0.684 1.004** 1.055** 1.660*** 1.498*** 0.948*** 0.918** 0.816** -0.0543
(0.402) (0.348) (0.330) (0.289) (0.375) (0.288) (0.288) (0.281) (0.387)
lnalpha_cons -0.0536 -0.243** -0.364*** -0.658*** -0.659*** -1.158*** -1.169*** -1.220*** -1.267***
(0.0867) (0.0884) (0.0895) (0.0923) (0.0923) (0.0977) (0.0977) (0.0985) (0.0992)
N 213 213 213 213 213 213 213 213 213
AIC 2482.1 2434.4 2405.4 2335.5 2337.1 2226.1 2225.5 2216.7 2209.1
BIC 2495.5 2451.2 2425.6 2359.1 2364.0 2256.4 2259.1 2253.7 2249.4
Notes: a The dependent variable is the number of HOB
*** Significance at 1%, ** significance at 5% and * significance at 10%. Standard errors between brackets.
Source: Own elaboration with data from the register of empty housing units acquired by banks of the Catalan Housing
Agency, the Catalan Statistical Institute (IDESCAT), the Catalan Cartographical Institute (CCI), the Spanish Ministry of
Public Works, and the Spanish Statistical Institute (INE).
posed labour markets are those related with service gration between 2001 and 2011 ( FOR _CHG), and the
activities. In fact, although service industries are percentage of young population in 2011 ( YOUNG).
heterogeneous in terms of wages and workforce Some authors state that one of the main drivers of
stability, in general terms there is a clear speciali- the housing boom was the increment of immigration
zation towards wages and employment conditions (R aya 2018). Gonzalez and Ortega (2013) calcu-
of lower quality. Furthermore, the employment in late that the increase of immigration was responsible
service industries tends to be more seasonal than for an annual rise in housing prices of about 2% and
in manufacturing. All this considered, higher is the for a 1.2-1.5% increase in the construction of hous-
local specialization in these industries higher has ing units. However, comparing the results obtained
been the exposure of households to evictions via in this study, it seems that the percentage of foreign
mortgage foreclosure and, consequently, higher has population is more important than flows in terms of
been the accumulation of stock in hands of large their effects over HOB. Our economic intuition of
private landlords. the lower influence of change in immigration sug-
Human capital characteristics are represented gests that new immigrants go to the renting market
by the percentage of immigrants from non-OECD instead of buying a property, which is an investment
countries in 2011 ( FOREIGN), the change in immi- decision hard to take just upon arrival to the country.2021 A. Domènech et al.:Scenarios post foreclosure crisis in Catalonia: accumulation of housing by banks ... 115
In general terms, our results confirm expecta- The Spanish state-led crisis resolution cannot
tions as clustering of immigration for low-income be explained without the important role exerted by
countries and demographic structures with young the banking sector and the strategy designed to cre-
families are overexposed to evictions via mortgage ate the financial structure needed to forge the next
foreclosure in view of their lower income patterns stage of the housing cycle (García-L amarca 2020;
(Gutiérrez and Domènech 2018; Díaz-Serrano Vives-M iró and Gutiérrez 2017). Massive asset de-
and R aya 2014; Rugh and M assey 2010). In that valuation, rental law liberalisations and reformula-
sense, signs and significance are robust for all tion of REITs to be an effective property investment
specifications. tool were the three pillars of the strategy to foster
Finally, real estate characteristics are proxied the growth of the rental market via foreign capital
through number of transactions ( TRANS) at peak investments. Therefore, the acquisition of housing
period of real estate bubble (2004-2007) and the stock by banks via mortgage foreclosure has been
percentage of housing units with outstanding pay- a phenomenon boosted by the processes of restruc-
ments with respect to the total of main housing turing and sanitising of the Spanish financial sector
units in 2011 ( LOANS). Our results corroborate (A lexandri and Janoschka 2018).
previous expectations related to inflation of real In this context, we checked whether all banks
estate transactions during peak periods of bubble behaved in the same way or if contrarily those that
that included risky operations with buyers consid- were rescued with higher amounts of public funds
erably exposed to mortgage unpayments and, con- also concentrated a higher amount of HOB. This is
sequently, ulterior home evictions (Gutiérrez and a very relevant issue, as the rescue with public funds
Domènech 2017). Obviously, these results do not of the Spanish banking system totalled around
indicate that evictions are solely generated from €60,000M that were unequally distributed across
initial real estate transactions during the real estate main banks, as presented in Table 5. In addition to
bubble, but that high levels of transactions then banks, there is another main player in this process,
have had an effect some years later. the SAREB.
To sum up, the results of the econometric ap- According to official data shown in Table 5, the
proach confirm that the amount of housing units two banks that have received the highest amount
accumulated by banks via foreclosures is greater of public funds are Bankia (€24,314M.) and BBVA
in those municipalities with higher socioeconomic (€13,005M.), which accumulate 61% of the total
vulnerability (that also were highly exposed to credit public resources used for the rescue and, at the same
risk during the real estate bubble). It is important to time, accumulate 16,644 empty homes (over 50% of
notice that except GDP pc all covariates are robust the total).
to the introduction of additional explanatory varia- In order to identify whether there are bank spe-
bles, as there are no sign or significance changes.4.3. cific effects that may imply a different effect in terms
The key role of rescued banks and the SAREB of HOB accumulated in specific municipalities,
Tab. 5: Relationship between homeowners and public funds received
HOB % Official rescue (M. €) %
BBVA 10,352 41.5% 13,005 (1) 21.2%
Bankia 6,292 25.2% 24,314 (2) 39.5%
Caixabank 2,935 11.8% 6,475 (3) 10.5%
Santander 3,222 12.8% 0 0.0%
Other banks 2,163 8.7% 17,701 (4) 28.8%
Total banks 24,964 (5) 100.0% 61,495 100.0%
Note:(1) Rescue of Catalonia Bank, acquired by BBVA. (2) Rescue to Bankia and Banco Mare Nostrum, absorbed by Bankia.
(3) Aid to Banco de Valencia and Grup Banca Cívica, acquired by Caixabank. (4) Rescue of CAM, acquired by Banc de
Sabadell, and other banks (UCI Financiera, Cajas Rurales Unidas, Abanca, Credit Agricole, Caja 3, Unicaja, Liberbank, Cajasur,
Kutxabank, CGD, Targonank and Caja de Arquitectos). (5) Total banks (24,964) do not include housing units owned by SAREB
(5,757), Securization funds (1,569) and other societies (651).
Source: adapted from Gutiérrez and Vives-Miró 2018116 Vol. 75 · No. 2
Tab. 6: Determinants of HOB by municipality: banks specifications
(1) (2) (3) (4) (5)
BBVA -0.0633
(0.779)
Bankia 2.267**
(0.808)
Caixabank -5.927***
(0.765)
Santander -4.234***
(1.218)
SAREB 3.089***
(0.881)
Cons. 5.061*** 4.637*** 5.655*** 5.484*** 4.541***
(0.258) (0.155) (0.119) (0.157) (0.153)
lnalpha_cons 0.270** 0.239** 0.125 0.233** 0.225**
(0.0839) (0.0842) (0.0852) (0.0842) (0.0843)
N 213 213 213 213 213
AIC 2569.9 2561.3 2528.9 2559.4 2557.2
BIC 2580.0 2571.4 2539.0 2569.5 2567.3
Notes: The dependent variable is the number of HOB by municipality
*** Significance at 1%, ** significance at 5% and * significance at 10%. Standard errors between brackets.
Source: Own elaboration with data from the register of empty housing units acquired by banks (Catalan Housing Agency).
we selected the main four Spanish banks ( BBVA, those that tend to concentrate more HOB. Now, we
Bankia, Caixabank and Santander) plus SAREB and can add that is precisely in those areas where the
we regressed HOB controlling by these owners of rescued banks have concentrated their foreclosures.
the housing stock (see Tab. 6). Econometric results This finding could be explained by the questionable
clearly show that there is a close relationship be- loan practices of banks that finally needed to be res-
tween public funds received by rescued banks and cued with public funds and/or transfer their assets
number of HOBs, as banks or societies that received to the SAREB.
funding from Spanish government (i.e., SAREB and Moreover, this finding helps to evidence how
Bankia) are the ones that have a positive and sig- the large amount of public funds spent in the rescue
nificant effect over the number of HOBs, whilst for of financial sector have been part of the strategy
the rest of banks the effect is negative (significant of socialisation of losses and privatisation of future
for Caixabank and Santander). Results for BBVA gains. The accumulation of foreclosed housing in
are somehow unclear as this big bank acquired the deprived urban areas mainly by rescued banks
several smaller banks (most of them rescued with and the SAREB is the necessary first step for the
public funds) that had different strategies in terms next phase of the management of the crisis. This
of real estate markets and foreclosures. Our results next phase implies the recent restructuration of
show that, the greater is the presence of Bankia and the housing market and a massive sold of property
SAREB, the higher is the number of HOB in the portfolios to global corporate funds (Gutiérrez
municipality. In other words, in the previous section and Domènech, 2020; Janoschka et al. 2019;
we have identified that the most vulnerable areas are M éndez 2018).2021 A. Domènech et al.:Scenarios post foreclosure crisis in Catalonia: accumulation of housing by banks ... 117
5 Conclusions these companies would concentrate their action in
the forthcoming years. In that case, low- and mid-
5.1 Implications of our findings and main con- dle-income urban areas will be again affected, pro-
tributions ducing new evictions and forced displacements, but
this time due to the rental market bubble (Pareja-
Our study of the Catalan case not only presents Eastway and Sanchez-M artinez 2017).
new empirical evidence of the spatiality behind the
proliferation of evictions due to mortgage foreclo-
sure, but also reveals the social and economic char- 5.2 Limitations of the study and future research
acteristics of the spaces where banks and the SAREB agenda
have accumulated empty housing stock via mortgage
foreclosure. The main limitations of our study derive from
The territorial econometrical approach at mu- the data source used. As mentioned in the data
nicipal level used has not been previously applied and methods section, the information we worked
with the objective of identifying the socio-spatial with did not represent all the housing accumulated
determinants of the accumulation of stock in hands via mortgage foreclosure, but the empty housing
of large private owners. Therefore, the analysis al- stock accumulated by banks and the SAREB as of
lowed us to demonstrate and validate that those March 2016. Although it represents around 40%
municipalities in which banks and the SAREB still of the total number of evictions due to foreclosure
have a greater accumulation of empty housing share that took place in Catalonia between 2008 and 2015
common characteristics related to socioeconomical (Gutiérrez and Vives-M iró 2018). Hence, the data
vulnerability. Concretely, they are areas with a high source did not allow us to fully monitor a dynamic
concentration of people with job placement difficul- process. Nevertheless, it offered us a view of the
ties, with an important presence of foreign popula- footprint of mortgage foreclosure in Catalonia, and
tion and with a high exposure to mortgage loans. provides an insight of the urban areas that could con-
This shows that the mortgage crisis has tended to centrate the action of global corporate landlords in
deepen the existing social and spatial inequalities the forthcoming years.
(A lexandri and Janoschka 2018) and points to the The role of these new large private landlords in
emergence of new negative spillover effects (K im the management of the housing stock after the cri-
and Cho 2016) such as processes of neighbourhood sis has been deeply analysed from a theoretical per-
and municipality degradation. spective in different western countries (A lexandri
Our findings indicate that, the higher is the rela- and Janoschka 2018; Beswick et al. 2016; Byrne
tive presence of foreclosed housing owned by res- 2019; Fields, 2018; Pawson and M artin, 2020), but
cued banks -mainly, former Bankia- and the SAREB just a few of them has empirically dealt with its so-
the higher is the overall number of foreclosed prop- cioeconomic spatial logics (García-L amarca 2020,
erties in those municipalities. Conversely, the higher Gutiérrez and Domènech 2020). Hence, more re-
is the number of housing owned by non-rescued search is needed to, in the first place, identify the
banks the lower is the overall number of foreclosed areas of action of global corporate landlords along
housing. This finding, combined with the previous with further studies on business strategies and long-
one, indicates that the rescued entities have con- term objectives of the sector. And, in the second
centrated their mortgage loans and foreclosures in place, unravel the unequal impacts that rental prop-
the most precarious areas of Catalonia. Therefore, erty investment is having in disadvantaged areas
it seems reasonable to demand stricter regulations (municipalities and neighbourhoods). A recent study
about activities carried out by institutions rescued carried out by García-L amarca (2020) in the city
with public funds. In fact, the way the state-led crisis of Barcelona demonstrates that corporate landlords
resolution has been a lost opportunity to convert the such as Blackstone are offering housing in low-in-
housing stock acquired via mortgage foreclosure in come neighbourhoods at a letting price higher than
social housing, which is less than two percent of the the average surroundings with serious problems of
total housing stock in Catalonia (Trilla 2014). quality and service to their tenants. It is, therefore,
Finally, as we already know that these assets have uncertain the long-term strategy of these new global
been (or are being) sold to global corporate landlords actors. However, further research on their predomi-
(García-L amarca 2020; Janoschka et al., 2019), nant position in the housing sector as large home-
our study allows to predict some of the areas where owners should be carried out, since it may impact not118 Vol. 75 · No. 2
only the microeconomics of cities but also may have rates in Spain. In: Regional Science and Urban Econom-
global socio-economic and political urban housing ics 45, 22–32. https://doi.org/10.1016/j.regsciurbe-
effects (M éndez 2018; Moreno 2014). co.2013.12.004
Domènech, A. and Gutiérrez, A. (2018): Paisatges després de
la batalla. Geografies de la crisi immobiliària. Barcelona.
Acknowledgements Fields, D. (2018): Constructing a new asset class: property-
led financial accumulation after the Crisis. In: Economic
This research was partially funded by FEDER – Geography 94 (2), 118–140. https://doi.org/10.1080/0
Ministerio de Ciencia, Innovación y Universidades 0130095.2017.1397492
– Agencia Estatal de Investigación [ECO2017- Fields, D. and Hodkinson, S. (2018): Housing policy in
88888-P], the “Xarxa de Referència d’R+D+I crisis: an international perspective. In: Housing Policy
en Economia i Polítiques Públiques”, the SGR Debate 28 (1), 1–5. https://doi.org/10.1080/10511482
Programs [GRATET-2017- SGR-22] and [2017- .2018.1395988
SGR-159] of the Catalan Government, and the García-Hernández, J. S. and Ginés-De la Nuez, C. (2020):
Spanish Ministry of Education and Professional Geografías de la desposesión en la ciudad neoliberal:
Formation [Doctoral Research Grant FPU15/06947 ejecuciones hipotecarias y vulnerabilidad social en Santa
– Formación de Profesorado Universitario]. Cruz de Tenerife (Canarias-España). In: EURE – Re-
vista Lationoamericana de Estudios Urbano Regionales,
46 (138), 215–234. https://doi.org/10.4067/S0250-
References 71612020000200215
García-Lamarca, M. (2020): Real estate crisis resolution
Aalbers, M. B. (2019). Financial geography II: financial regimes and residential REITs: emerging socio-spatial
geographies of housing and real estate. In: Progress impacts in Barcelona. In: Housing Studies. https://doi.
in Human Geography 43 (2), 376–387. https://doi. org/10.1080/02673037.2020.1769034
org/10.1177/0309132518819503 González, L. and Ortega, F. (2013): Immigration and hous-
Alexandri, G. and Janoschka, M. (2018): Who loses and ing booms. Evidence from Spain. In: Journal of Regional
who wins in a housing crisis? Lessons from Spain and Science 53 (1), 37–59. https://doi.org/10.1111/jors.12010
Greece for a nuanced understanding of dispossession. In: González-Pérez, J. M.; Vives-Miró, S. and Rullán, O.
Housing Policy Debate 28 (1), 117–134. https://doi.org/ (2020): Evictions for unpaid rent in the judicial district
10.1080/10511482.2017.1324891 of Palma (Majorca, Spain): a metropolitan perspec-
Beswick, J.; Alexandri, G.; Byrne, M.; Vives-Miró, S., Fields, tive. In: Cities 97, 1–12. https://doi.org/10.1016/j.cit-
D.; Hodkinson, S. and Janoschka, M. (2016): Speculating ies.2019.102466
on London’s housing future. The rise of global corporate Gutiérrez, A. and Arauzo-Carod, J. M. (2018): Spatial
landlords in ‘post-crisis’ urban landscapes. In: Cities 20 analysis of clustering of foreclosures in the poorest-
(2) 321–341. https://doi.org/10.1080/13604813.2016.1 quality housing urban areas: evidence from Catalan cit-
145946 ies. In: International Journal of Geo-Information 7 (1),
Byrne, M. (2015): Bad banks: the urban implications of asset 1–23. https://doi.org/10.3390/ijgi7010023
management companies. In: Urban Research & Practice Gutiérrez, A. and Delclòs, X. (2016): The uneven distri-
8 (2), 255–266. https://doi.org/10.1080/17535069.2015 bution of evictions as new evidence of urban inequal-
.1050208 ity: a spatial analysis approach in two Catalan cities.
Byrne, M. (2019): Generating rent and the financialization In: Cities 58, 101–108. https://doi.org/10.1016/j.cit-
of housing: a comparative exploration of the growth of ies.2016.04.007
the private rental sector in Ireland, the UK and Spain. In: Gutiérrez, A. and Domènech, A. (2017): Geografía de
Housing Studies 35 (4), 743–765. https://doi.org/10.108 los desahucios por ejecución hipotecaria en las ciu-
0/02673037.2019.1632813 dades españolas: evidencias a partir de las viviendas
Burriel, E. (2014): El estallido de la burbuja inmobiliaria y sus propiedad de la SAREB. In: Revista de geografía Norte
efectos en el territorio. In Albertos, J. M. and Sánchez, Grande 67, 33–52. https://doi.org/10.4067/S0718-
J. L. (eds.), Geografía de la crisis económica en España. 34022017000200003
València. Gutiérrez, A. and Domènech, A. (2018): The mortgage
Cameron, A. C. and Trivedi, P. K. (2010): Microeconomet- crisis and evictions in Barcelona: identifying the deter-
rics using Stata. Midtown. minants of the spatial clustering of foreclosures. In: Eu-
Díaz-Serrano, L. and Raya, J. M. (2014): Mortgages, im- ropean Planning Studies 26 (10), 1939–1960. https://
migrants and discrimination: an analysis of the interest doi.org/10.1080/09654313.2018.1509945You can also read