Feasibility and effectiveness of daily temperature screening to detect COVID-19 in a prospective cohort at a large public university - BMC Public ...
←
→
Page content transcription
If your browser does not render page correctly, please read the page content below
Facente et al. BMC Public Health    (2021) 21:1693
https://doi.org/10.1186/s12889-021-11697-6

 RESEARCH                                                                                                                                            Open Access

Feasibility and effectiveness of daily
temperature screening to detect COVID-19
in a prospective cohort at a large public
university
Shelley N. Facente1,2*, Lauren A. Hunter1, Laura J. Packel1, Yi Li1, Anna Harte3, Guy Nicolette3, Shana McDevitt4,
Maya Petersen1 and Arthur L. Reingold1

  Abstract
  Background: Many persons with active SARS-CoV-2 infection experience mild or no symptoms, presenting barriers
  to COVID-19 prevention. Regular temperature screening is nonetheless used in some settings, including university
  campuses, to reduce transmission potential. We evaluated the potential impact of this strategy using a prospective
  university-affiliated cohort.
  Methods: Between June and August 2020, 2912 participants were enrolled and tested for SARS-CoV-2 by PCR at
  least once (median: 3, range: 1–9). Participants reported temperature and symptoms daily via electronic survey
  using a previously owned or study-provided thermometer. We assessed feasibility and acceptability of daily
  temperature monitoring, calculated sensitivity and specificity of various fever-based strategies for restricting campus
  access to reduce transmission, and estimated the association between measured temperature and SARS-CoV-2 test
  positivity using a longitudinal binomial mixed model.
  Results: Most participants (70.2%) did not initially have a thermometer for taking their temperature daily. Across
  5481 total person months, the average daily completion rate of temperature values was 61.6% (median: 67.6%, IQR:
  41.8–86.2%). Sensitivity for SARS-CoV-2 ranged from 0% (95% CI 0–9.7%) to 40.5% (95% CI 25.6–56.7%) across all
  strategies for self-report of possible COVID-19 symptoms on day of specimen collection, with corresponding
  specificity of 99.9% (95% CI 99.8–100%) to 95.3% (95% CI 94.7–95.9%). An increase of 0.1 °F in individual mean body
  temperature on the same day as specimen collection was associated with 1.11 increased odds of SARS-CoV-2
  positivity (95% CI 1.06–1.17).

* Correspondence: sfacente@berkeley.edu
1
 School of Public Health, Division of Epidemiology and Biostatistics,
University of California, Berkeley, 2121 Berkeley Way # 5302, Berkeley, CA
94720, USA
2
 Facente Consulting, Richmond, CA, USA
Full list of author information is available at the end of the article

                                         © The Author(s). 2021 Open Access This article is licensed under a Creative Commons Attribution 4.0 International License,
                                         which permits use, sharing, adaptation, distribution and reproduction in any medium or format, as long as you give
                                         appropriate credit to the original author(s) and the source, provide a link to the Creative Commons licence, and indicate if
                                         changes were made. The images or other third party material in this article are included in the article's Creative Commons
                                         licence, unless indicated otherwise in a credit line to the material. If material is not included in the article's Creative Commons
                                         licence and your intended use is not permitted by statutory regulation or exceeds the permitted use, you will need to obtain
                                         permission directly from the copyright holder. To view a copy of this licence, visit http://creativecommons.org/licenses/by/4.0/.
                                         The Creative Commons Public Domain Dedication waiver (http://creativecommons.org/publicdomain/zero/1.0/) applies to the
                                         data made available in this article, unless otherwise stated in a credit line to the data.
Facente et al. BMC Public Health (2021) 21:1693 Page 2 of 10 Conclusions: Our study is the first, to our knowledge, that examines the feasibility, acceptability, and effectiveness of daily temperature screening in a prospective cohort during an infectious disease outbreak, and the only study to assess these strategies in a university population. Daily temperature monitoring was feasible and acceptable; however, the majority of potentially infectious individuals were not detected by temperature monitoring, suggesting that temperature screening is insufficient as a primary means of detection to reduce transmission of SARS-CoV-2. Keywords: COVID-19, SARS-CoV-2, Fever, Temperature monitoring, Thermometer, Detection, Screening Background Nonetheless, a number of college campuses are now SARS-CoV-2 is a novel coronavirus that causes corona- implementing systems that require students, faculty, and virus disease 2019, otherwise known as COVID-19 [1]. staff to attest that they are free of symptoms, and/or are One of the most challenging features of the COVID-19 afebrile before coming to campus [17–21]. These epidemic to date is considerable pre-symptomatic [2] policies almost universally rely on dichotomous and asymptomatic transmission [3, 4], currently esti- temperature cutoffs for fever, e.g. temperature ≥ 100.4 °F, mated to comprise anywhere from 6 to 41% of infectious in alignment with the CDC guidelines [22]. Such strat- individuals [5]; many other individuals may experience egies have numerous pitfalls, including reliance on an only mild symptoms. This presents barriers to epidemic outdated sense of “normal” body temperature [23], disre- control by impeding rapid isolation of cases, and makes gard of the effect of time of day [24] and ambient it necessary to develop nuanced screening approaches temperature on body temperature [25], disregard of nu- that will both limit infectious exposure and be a useful merous studies that have found meaningful variation in trigger for SARS-CoV-2 testing. Accordingly, a strong normal body temperature between individuals [26, 27], desire to have students and employees return in person and incentives to not voluntarily disclose symptoms in to school or work has driven workplaces, businesses, and order to preserve access to work spaces and therefore colleges to look for methods to rapidly assess risk of in- safeguard career and financial stability [28]. fection and prevent entry for those who are possibly in- Given the rapid increase in reliance on temperature- fectious to others. based strategies to restrict campus access for prevention One common strategy to prevent transmission has of COVID-19 spread, we aimed to assess the feasibility, been temperature checks, which have increased in popu- acceptability, and effectiveness of temperature monitor- larity as a non-invasive measure to rapidly screen indi- ing and other fever-based strategies to prevent spread of viduals for elevated body temperature (i.e., fever). SARS-CoV-2 in a longitudinal cohort of 2916 university- Temperature screening has been used during other glo- affiliated students and employees, known as the Berkeley bal outbreaks, including the severe acute respiratory syn- COVID-19 Safe Campus Initiative. drome (SARS) outbreak in 2003, the H1N1 influenza epidemic in 2009 [6], and recent major Ebola virus dis- Methods ease outbreaks in Sub-Saharan Africa in 2014 and 2018 Study setting and population [7]. However, multiple studies have found low sensitivity Any students, faculty, or staff (including essential or specificity of temperature monitoring during these workers) who were affiliated with the University of Cali- prior epidemics [8, 9], even in cases where fever was a fornia (UC), Berkeley and were living in Berkeley or the very common symptom among people with the disease surrounding counties during the summer of 2020 were in question [6, 10, 11]. Large infrared fever screening eligible to enroll in the Safe Campus cohort. UC systems or no-contact temperature screening at building Berkeley is an elite public university in Northern Califor- entrances [12] and hospital entryways [13] and wearable nia with 42,347 students enrolled in the 2020–2021 devices to continuously monitor individual temperature school year, 30,799 of whom were undergraduates. [14] have all been widely employed in an attempt to pre- SARS-CoV-2 test positivity on campus peaked at 4.2% vent the spread of SARS-CoV-2, yet limited evidence ex- the week of June 29, 2020 during a small outbreak ists concerning the sensitivity and specificity of these among students, but from June 1 through August 18 of approaches for the current pandemic [15], especially on that year (the study period) there were 135 positive PCR a university campus. Of note, the United States Food tests out of 10,090 total tests conducted (1.3% positivity). and Drug Administration (FDA) released a statement in Students, faculty, and staff of UC Berkeley were re- June 2020 noting that non-contact temperature assess- cruited via campus email blasts and sharing via relevant ment devices “are not effective if used as the only means listservs, flyering in congregate student living situations of detecting a COVID-19 infection” [16]. (i.e. Greek housing and co-operatives), and word of
Facente et al. BMC Public Health   (2021) 21:1693                                                               Page 3 of 10

mouth from June 1st through July 17th. Interested in-          minimum of once and a maximum of 9 times during the
dividuals were sent to a study website where they              study, with a median of 3 tests per person [34]. PCR
could complete a brief screening survey to determine           tests were all conducted at UC Berkeley’s Innovative
eligibility. Enrollment was completed on a rolling             Genomics Institute.
basis during the recruitment period. This observa-
tional prospective cohort is reported here according
to STROBE guidelines [29].                                     Statistical analysis
                                                               We assessed potential impact of temperature-based
Survey measures and temperature assessment                     screening on transmission of SARS-CoV-2 through cal-
Participants provided information about thermometer            culating sensitivity, specificity, positive predictive value
availability during a baseline survey, and were told that if   (PPV), and negative predictive value (NPV) for a range
they did not already own a thermometer they would be           of strategies for detecting SARS-CoV-2 infection, includ-
provided with a digital oral thermometer when they re-         ing temperature greater than a range of thresholds for
ported to University Health Services for baseline speci-       “fever” (≥100.4 °F, ≥99.7 °F, ≥98.7 °F) on the day of speci-
men collection. Participants were instructed to measure        men collection, temperature ≥ 98.7 °F on the day of spe-
their temperature in the morning, before leaving the           cimen collection or on any day up to 3 days prior to
house (if applicable), and to follow manufacturer’s in-        collection, a qualitative assessment of “feeling feverish”
structions for their thermometer, including waiting a full     as a symptom, and being “symptomatic,” which for pur-
60 seconds before recording the temperature reading if         poses of this analysis included reporting dry cough,
using a study-provided thermometer. They were asked            coughing up mucus, fever, sweats, chills, sore throat, dif-
to report quantitative temperature and any symptoms            ficulty breathing, wheezing, shortness of breath, loss of
potentially related to COVID-19 (including “feeling fe-        sense of taste, loss of sense of smell, or at least three
verish”) on electronic daily surveys via a HIPAA-              symptoms from a list of 35 symptoms potentially associ-
compliant version of Research Electronic Data Capture          ated with COVID-19 (see Supplemental Table 1). The
(REDCap) [30, 31], from the day after they completed           range of temperature thresholds were chosen to include
the baseline survey through study close August 18th.           the CDC threshold for fever during the pandemic
Participants were prompted each morning to complete            (≥100.4 °F) [22], anything exceeding the commonly
their daily survey via e-mail or text message, depending       understood “normal” human body temperature (>
on their preference, and student participants were pro-        98.6 °F), and – as middle ground between those two –
vided with a $50 incentive for completing their baseline       anything greater than 1 °F above “normal” (≥99.7 °F).
specimen collection and 10 daily surveys in order to en-       The results of PCR testing were used as the gold stand-
courage habit formation [32, 33]. Beginning August 1st         ard for determining “true” SARS-CoV-2 positivity or
participants were sent a message requesting them to            negativity in relation to these performance measures,
complete an endline survey that included questions             and 95% confidence intervals (CIs) were calculated using
about feasibility and acceptability of recording their         the Clopper Pearson method [35] for sensitivity and spe-
temperature each day.                                          cificity and asymptotic standard logit intervals [36] for
                                                               the predictive values, using the bdpv package within R
PCR testing                                                    [37]. Adjusted logit intervals were used to compute in-
All participants were asked to come to University Health       tervals in the case where the predictive value was zero.
Services (UHS) on the UC Berkeley campus for an oral/          A Fisher’s Exact Test for independence was used to test
nasal midturbinate swab for SARS-CoV-2 polymerase              the null hypothesis that there was no difference in
chain reaction (PCR) testing at the start of the study,        SARS-CoV-2 infection for people who would have been
and participants who were students or essential workers        prohibited entry to campus as a result of screening for
were also asked to return for an endline PCR test in           fever using the strategy in question, and those who
early August. Participants were also offered PCR testing       would be permitted entry to campus.
on-demand at any time during the study, and were spe-             We used a longitudinal binomial mixed model with a
cifically asked to come to UHS for a PCR test if they re-      random intercept for each participant to examine the as-
ported a temperature of ≥100.4 °F, said they were              sociation between individually mean-centered quantita-
“feeling feverish,” reported other specific symptoms (dry      tive temperature and SARS-CoV-2 PCR result. This
cough, coughing up mucus, unusual pain or pressure in          association was assessed using a simple model with no
the chest, difficulty breathing, shortness of breath, unex-    additional covariates, as well as a model controlling for
plained trouble thinking or concentrating, or loss of          mean-centered local ambient temperature on the day
sense of taste or smell), or reported a specific potential     body temperature was recorded, and age of the
exposure to COVID-19. Participants were PCR tested a           participant.
Facente et al. BMC Public Health (2021) 21:1693 Page 4 of 10
Results forehead thermometer, 7.8% with an ear thermometer,
By the close of enrollment on July 17th, 2916 partici- 4.1% with a no-touch thermometer, and the remainder
pants had enrolled and provided a specimen for at least with other types. All participants who received a therm-
one PCR test. Recruitment was not begun for faculty ometer through the study used an oral thermometer.
and staff until much later in the study period; thus Overall, participants had a mean temperature of 97.6 °F
74.7% of participants were students. All participants with over the course of the study (IQR: 97.1–98.2 °F). This
at least one valid PCR test result who reported not hav- mean temperature was deemed reasonable, given that
ing tested positive for SARS-CoV-2 prior to enrollment participants were instructed to measure their
were included in this analysis (n = 2912). Due to rolling temperature in the morning, when mean body tempera-
enrollment with a fixed end date, participants were en- tures have been found to generally be below the typically
rolled for different lengths of time, ranging from 28 to considered “normal” temperature, 98.6 °F [23].
77 days between baseline specimen collection and Au- Participants reported their temperature measurement
gust 18th (median: 54 days, IQR: 43–64 days). a median of 67.6% (IQR: 41.8–86.2%) of the total days
they were enrolled (Fig. 1, panel A), and more than 30%
Feasibility of daily thermometer usage of participants (n = 885) recorded the temperature every
At enrollment, 70.3% of participants did not have access day they completed at least some of the daily survey
to a thermometer for daily use at home and needed to (Fig. 1, panel B).
be provided one by the study. This was particularly true
for students (76.7%), participants under age 30 (77.2%), Acceptability of daily temperature monitoring
and Black (80.4%), Asian/Pacific Islander (77.4%) and During the endline survey, participants were asked about
Latinx (76.3%) participants (Table 1). The majority the acceptability of daily temperature monitoring, and
(70.5%) of participants who had their own thermometer 92.9% reported it to be acceptable (n = 735) or totally ac-
had an oral thermometer, followed by 12.8% with a ceptable (n = 1734). Only 35 participants out of 2659
Table 1 Characteristics of study participants, by personal thermometer availability
Characteristic Total participants Needed a thermometer
# (%)
Total 2912 2026 (69.6%)
Cohort Student 2174 1646 (75.7%)
Essential worker 268 165 (61.6%)
Faculty/staff 470 215 (45.7%)
Age (years) < 21 881 730 (82.9%)
22–29 1085 787 (72.5%)
30–39 446 258 (57.8%)
40–49 195 103 (52.8%)
50+ 279 148 (53.0%)
Gender identity Womana 1634 1101 (67.4%)
Manb 1171 862 (73.6%)
Non-binary 50 37 (74.0%)
Race/Ethnicityc Black 102 82 (80.4%)
Latinx 395 301 (76.2%)
Asian/Pacific Islander 825 637 (77.2%)
Native American/American Indian 38 26 (68.4%)
White 1802 1180 (65.5%)
Other 91 68 (74.7%)
PCRd results All negative 2852 1980 (69.4%)
At least one positive 60 46 (76.7%)
a
Category likely includes some participants who are transwomen
b
Category likely includes some participants who are transmen
c
Categories are not mutually exclusive
d
PCR = Polymerase Chain ReactionFacente et al. BMC Public Health (2021) 21:1693 Page 5 of 10
Fig. 1 Participant count of the proportion of days quantitative temperature was recorded via the daily survey, per total days of enrollment (A)
and total days for which the daily survey was at least partially completed (B)
who took the endline survey (1.3%) found it to be un- taken throughout the study among those testing posi-
acceptable. When asked how likely they would be to tive. This is notable given the CDC-suggested thresh-
continue to comply with daily temperature monitoring if old of 100.4 °F as evidence of fever [22].
UC Berkeley used this study as a model for campus-wide Sensitivity for detecting SARS-CoV-2 infection ranged
practice, 1079 people (40.5%) said they were “extremely from 0% (95% CI 0.0–9.7%) to 30.6% (95% CI 16.3–
likely” to continue, and 1027 (38.6%) said they would be 48.1%) for the strategies using various thresholds for
“likely” to continue. Only 291 people (10.9%) said they fever on the same day as specimen collection, among the
were “unlikely” or “extremely unlikely” to comply with a 4330 people who recorded a temperature the same day
request to continue monitoring their temperature daily. as specimen collection (Table 2). Positive predictive
However, when asked about the “most difficult” aspect value for these temperature thresholds ranged from 0%
of their study participation at endline, daily temperature (95% CI 0.0–59.4%) to a high of 21.4% (95% CI 7.4–
monitoring was the most frequently selected study com- 48.6%), and negative predictive value was 99.2% (95% CI
ponent: 766 people (36.1%) chose daily temperature 99.1–99.3%) to 99.4% (99.2–99.5%).
monitoring, compared to 17.6% who chose having oral/ Sensitivity predictably increased as the threshold for
nasal swabs collected for PCR testing, the next most fever was lowered, with a resulting trade-off in specifi-
common answer (Supplemental Table 2). city. Self-reported qualitative symptoms (“feeling fever-
ish”) had a higher sensitivity (19.0, 95% CI 8.6–34.1%)
Effectiveness for detection of SARS-CoV-2 infection than either of the quantitative fever thresholds often
More than a third (35%) of the 60 participants in our used in practice (temperature ≥ 100.4 °F or ≥ 99.7 °F), and
study who tested positive for SARS-CoV-2 did so at comparable specificity of 99.7% (95% CI 99.5–99.8%),
their baseline collection; as a result, positive test results compared to a specificity of 99.9% (95% CI 99.8–100%)
were preceded by a median of six recorded temperatures for the ≥100.4 °F threshold and 99.7% (95% CI 99.5–
(range 1–55, IQR 2–21). In comparison, negative tests 99.9%) for the ≥99.7 °F threshold.
were preceded by a median of 13 recorded temperatures Participants also reported information about qualita-
(range 1–76, IQR 1–31). tive fever symptoms the same day as their PCR specimen
Thirty-six (60.0%) of 60 positive tests for SARS-CoV-2 collection an additional 1126 times, compared to quanti-
by PCR were preceded by a participant reported tative temperature measurements. As would be ex-
temperature the same day; 37 (61.7%) were preceded by pected, self-report of symptoms potentially indicating
at least one reported temperature in the 3 days prior to SARS-CoV-2 infection (including but not limited to
specimen collection. fever) yielded the greatest sensitivity (40.5, 95% CI 25.6–
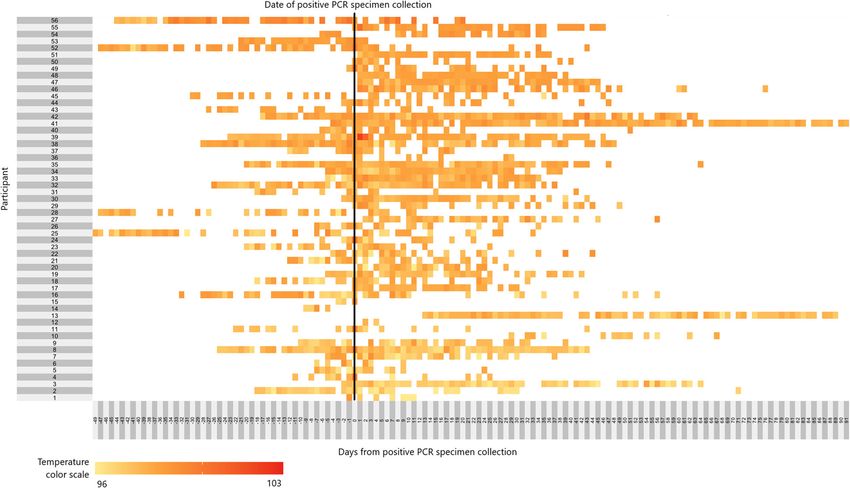
Mean temperatures among participants testing posi- 56.7%, with specificity of 95.3, 95% CI 94.7–95.9%), but
tive ranged from 96.7 °F - 99.0 °F during the study had a positive predictive value of only 6.3% (4.4–9.0%),
(Fig. 2). Among the 56 participants who tested posi- well below that of self-reported “feeling feverish” alone
tive for SARS-CoV-2 and recorded their temperature (32.0, 95% CI 17.8–50.9%).
at least once during the study period, only 4 partici- There was an association between temperature read-
pants measured at least one temperature above 100 °F ings and SARS-CoV-2 PCR result, with an increase of
at any time, and a temperature ≥ 100 °F was measured 0.1 °F above individual mean body temperature the day
only 10 times out of 1637 total measurements (0.6%) of the PCR specimen collection associated with a 1.11Facente et al. BMC Public Health (2021) 21:1693 Page 6 of 10
Fig. 2 Heat map of temperatures measured each day before and after specimen collection at which 56* participants tested PCR positive for
SARS-CoV-2. The vertical black line denotes the day that participant provided the specimen which would subsequently test positive for SARS-CoV-
2. White boxes are days that the participant did not record a temperature (including days before they had enrolled in the study), and colored
boxes range from yellow to red depending on the self-reported participant temperature, as found in the temperature color scale on the bottom
left of the figure
increased odds of SARS-CoV-2 positivity (95% CI 1.06– the extra step to take their temperature and record the
1.17), which did not change when controlling for local quantitative reading.
ambient temperature and age. We also found daily temperature monitoring to be
feasible for participants; however, almost 3 out of 4
Discussion people, particularly students, did not already own ther-
We found that daily temperature monitoring to screen mometers, and purchasing and disseminating thermom-
for SARS-CoV-2 infection was acceptable to a wide var- eters of sufficient quality during a global pandemic
iety of people affiliated with a large public university. proved nearly impossible: taken together, these ther-
While only 30.4% of participants recorded their mometers cost over $18,200 just to cover the needs of
temperature every day they completed at least some of our study participants, calling into question the feasibil-
the daily survey, on average participants completed 40 ity of this strategy on a campus-wide level. This high-
daily surveys (median: 40, IQR: 30–53) during the study lights the challenges of accessing this type of equipment
period, with 77 participants taking 70 or more daily sur- during a true public health emergency (particularly a
veys during a study period that was 78 days from day 1 global one), and underscores one of the challenges to re-
of rolling enrollment through study end. Particularly quiring self-monitoring of body temperature as a condi-
among students (who were enrolled for substantially tion of entry to a college campus, i.e. it is likely
longer than non-students on average), the number of unrealistic to expect accurate responses to required self-
surveys completed per day started to decrease in early attestations of being fever and symptom-free, especially
August (see Supplemental Figures 1 and 2). It is ex- for students.
pected that many people would eventually look for effi- Overall, the sensitivity of temperature or symptoms
ciencies in their study participation, including frequently screening in our study never rose above 40.5%, and the
completing a very brief symptoms survey without taking best-performing quantitative temperature threshold hadFacente et al. BMC Public Health (2021) 21:1693 Page 7 of 10
Table 2 Performance characteristics of potential indicators of SARS-CoV-2 infection
Temperature ≥ Temperature ≥ Temperature ≥ Temperature ≥ Self-report Self-report
100.4 °Fa same 99.7°Fb same 98.7°Fc same 99.7 °F same fever COVID-19
day as day as day as day or any of symptoms symptoms, in-
specimen specimen specimen 3 days prior to (i.e., feeling cluding feverd
collection collection collection specimen feverish) same same day as
collection day as specimen
specimen collection
collection
Number of PCR positive results with 36 36 36 37 42 42
relevant data recorded (out of 60
total)
Number of PCR negative results with 4294 4294 4294 4487 5415 5415
relevant data recorded (out of 7612
total)
Number of people with PCR positive 0 / 36 3 / 36 11 / 36 4 / 37 8 / 42 17 / 42
results who would have been
identified through this indicator
Number of people with PCR negative 4 / 4294 11 / 4294 300 / 4294 25 / 4487 17 / 5415 254 / 5415
results who would have been
“flagged” per this indicator
pt. (95% pt. (95% pt. (95% pt. (95% pt. (95% pt. (95%
est. CI) est. CI) est. CI) est. CI) est. CI) est. CI)
Sensitivity 0.0% (0.0– 8.3% (1.8– 30.6% (16.3– 10.8% (3.0– 19.0% (8.6– 40.5% (25.6–
9.7%) 22.5%) 48.1%) 25.4%) 34.1%) 56.7%)
Specificity 99.9% (99.8– 99.7% (99.5– 93.0% (92.2– 99.4% (99.2– 99.7% (99.5– 95.3% (94.7–
100%) 99.9%) 93.8%) 99.6%) 99.8%) 95.9%)
PPVe 0.0% (0.0– 21.4% (7.4– 3.5% (2.2– 13.8% (5.6– 32.0% (17.8– 6.3% (4.4–
59.4%) 48.6%) 5.8%) 30.6%) 50.9%) 9.0%)
NPVf 99.2% (99.1– 99.2% (99.1– 99.4% (99.2– 99.3% (99.2– 99.4% (99.3– 99.5% (99.4–
99.3%) 99.3%) 99.5%) 99.3%) 99.5%) 99.6%)
Fisher’s Exact testg p-value – 0.0002 < 0.0001 < 0.0001 < 0.0001 < 0.0001
a
This was the threshold used for triggering additional testing during the study
b
This is one degree above what is conventionally considered “normal” body temp
c
This is one degree above the mean temperature for our study participants over the full study period (mean = 97.6 °F)
d
For purposes of this analysis, participants were considered “symptomatic” if on their daily survey they reported dry cough, coughing up mucus, fever, sweats,
chills, sore throat, difficulty breathing, wheezing, shortness of breath, loss of sense of taste, loss of sense of smell, or at least 3 symptoms from a list of 35
symptoms associated with COVID-19 and other illnesses (see Supplemental Table 1)
e
PPV = Positive predictive value
f
NPV = Negative predictive value
g
Fisher’s Exact test for independence was used, given rare exposure and rare outcome. This tested the null hypothesis that there was no difference in SARS-CoV-
2 infection for people who would have been prohibited entry to campus as a result of screening for fever using the strategy in question, and those who would be
permitted entry to campus
a sensitivity of only 30.6%, but considered fever to be (> 93% in all cases), this study was conducted during the
anything at or above 98.7 °F, which would be considered summer months, well before the typical influenza season
normal body temperature in most settings and resulted in the San Francisco Bay Area. Specificity of temperature
in a positive predictive value of only 3.5% (95% CI 2.2– monitoring for SARS-CoV-2 can be expected to worsen
5.8%). These findings align well with recently published in the fall and winter months, when the prevalence of
results from an Australian hospital, where fever influenza-like illness for reasons other than infection
≥100.4 °F was only detected in 16 of 86 patients testing with SARS-CoV-2 is substantially increased.
positive for SARS-CoV-2 over a 2-month period (sensi- There were significant associations between measured
tivity of 19, 95% CI 11–28%), when using a variety of in- body temperature and PCR test results in longitudinal
hospital temperature measurement methods, mostly mixed models when controlling for individual variation
with temporal thermometers [38]. While their sensitivity in body temperatures; however, these regression models
using this fever threshold was higher than we observed were designed to account for within-person variation in
in this study, this is unsurprising given that these were baseline temperature that is not scalable to real-life
among hospital patients, not people who were mostly monitoring strategies, and does not apply to the most
feeling well at time of testing. While the specificity of common temperature monitoring policies, which use di-
the strategies tested in our study was reasonably good chotomous fever thresholds for permitting buildingFacente et al. BMC Public Health (2021) 21:1693 Page 8 of 10 entry or triggering symptoms-based SARS-CoV-2 test- Finally, it is possible that some participants had SARS- ing, rather than a more sophisticated and individualized CoV-2 infection that was not detected by PCR testing, algorithm. Further, the performance of self-reported and therefore our effectiveness results may be biased qualitative fever symptoms (“feeling feverish”) in this in an unpredictable direction. study suggests that daily quantitative temperature moni- toring may not offer additional protection as a screening Conclusions measure to prevent SARS-CoV-2 transmission on a col- Given the popularity of temperature monitoring as a lege campus. Research by others that has found substan- non-invasive measure for rapid screening for SARS- tial measurement error with regard to body temperature CoV-2 infection before allowing students or employees [26] bolsters the idea that qualitative self-report may be access to college campuses, workplaces, or congregate a preferable strategy. venues, our findings offer important insight into the in- Our study had a number of limitations. First, sufficiency of such methods on college campuses, despite temperature data included here could be inaccurate widespread adherence to and acceptability of daily for multiple reasons, including error using the therm- temperature monitoring strategies. ometer or reporting error, such as participants not re- In concordance with evidence from prior global pan- cording their temperature despite taking it or demics [6, 8–11], our findings suggest temperature recording the temperature incorrectly. However, such screening using dichotomous fever thresholds during the limitations also apply to any scaled, non-research COVID-19 pandemic may be little more than “security campus-level system for temperature monitoring. Sec- theater” [41]. This term, largely attributed to computer ond, while participants were asked to take their security expert Bruce Schneier, describes measures that temperature in the morning, we did not control for provide a sense of security, despite having no actual posi- time of day in this analysis, because there was substan- tive impact on security. Temperature monitoring strat- tial information bias in the daily survey timestamp (i.e. egies may be a rational response to community calls for some participants anecdotally reported taking their action, even if those demands for action are based on in- temperature in the morning as requested but complet- accurate or outdated information about the risks and ef- ing the survey at a later time). This may have made us fective strategies for COVID-19 mitigation [42, 43]. less likely to detect fevers among our participants [24]; Other strategies to disinfect or otherwise prevent fomite however, since many school or work-based transmission have also been implemented during the temperature screenings likely take place in the morn- COVID-19 pandemic, often at great cost and with ques- ing, this limitation would also apply to any scaled tionable preventative benefit [44–46]. Millions of dollars campus-level temperature screening system. Similarly, are invested in similar “security theater” measures each we did not control for differences in thermometer type year in the United States, from radio-frequency identifi- in our analysis, given that the large majority of partici- cation (RFID) ankle bracelets to prevent hospital new- pants had an oral thermometer, despite the fact that born abductions to removing shoes and prohibiting type of thermometer used is related to mean body liquids above 3.4 oz at airport security [47, 48], in order temperature measurements [39]. However, this too is to reassure the public that sufficient action is being a limitation that would apply in real-life application of taken in the face of a serious threat. Measures like this any campus-level temperature monitoring strategy. can have some benefit; namely, some individuals with Third, individual basal temperature is known to vary SARS-CoV-2 would undoubtedly be detected by by fertility cycle for women not taking hormones [40]; temperature screening measures and prevented from however, we did not collect information about birth transmitting the virus to others. Further, routine control or other hormone use during this study, so temperature monitoring can reassure members of a could not account for this in our analysis. A sensitivity campus community or workplace that those in charge analysis (not shown) stratifying our adjusted regres- care about their health and are taking the pandemic ser- sion model by sex showed nearly identical results for iously. Yet an ineffective action can be harmful, if people women compared to the overall study population, sug- believe that because temperature screening measures are gesting that this hormonal temperature variation was in effect they are safe, and therefore other measures to not an important factor. Fourth, our results related to prevent spread of SARS-CoV-2 – such as wearing a face feasibility and acceptability of temperature monitoring covering and practicing social distancing – are not taken were likely biased by the incentives provided to partic- seriously [49]. ipants to encourage daily monitoring, as well as the Further attention is needed to the benefits and draw- enthusiasm for such activities among the type of per- backs of various strategies to detect and prevent trans- son who would enroll in an intensive study of this na- mission of SARS-CoV-2 on college campuses and in ture, compared to a general campus population. similar close-knit communities, to ensure the
Facente et al. BMC Public Health          (2021) 21:1693                                                                                             Page 9 of 10

community is fully aware of the practical and behavioral                            Funding
implications of any strategies employed. Colleges may                               This study was funded through private donations from University of
                                                                                    California, Berkeley alumni and families of current students. Private donors
want to consider using qualitative measures for self-                               had no role in the design of the study, nor collection, analysis, or
report of feverishness as a symptom rather than attempt-                            interpretation of data, nor writing the manuscript.
ing quantitative temperature monitoring, and focus re-
sources on additional strategies known to prevent SARS-                             Availability of data and materials
                                                                                    The datasets used and/or analyzed during the current study are available
CoV-2 transmission, such as low-barrier access to                                   from the corresponding author on reasonable request.
SARS-CoV-2 testing without requiring disclosure of spe-
cific risks or symptoms [50], rather than relying on                                Declarations
temperature screening or self-attestations of good health
                                                                                    Ethics approval and consent to participate
as a condition of campus access.                                                    This research and all relevant protocols were approved by the UC Berkeley
                                                                                    Committee for the Protection of Human Subjects (CPHS), protocols #2020–
Abbreviations                                                                       06-13,349 (essential workers), #2020–05-13,261 (students), and #2020–04-
CI: Confidence Interval; COVID-19: Coronavirus Disease 2019;                        13,238 (faculty/staff). All methods were carried out in accordance with
CPHS: Committee for the Protection of Human Subjects; FDA: Food and                 relevant guidelines and regulations. Informed consent was obtained from all
Drug Administration; IQR: Interquartile Ratio; NPV: Negative Predictive Value;      study participants before any study procedures occurred.
PCR: Polymerase Chain Reaction; PPV: Positive Predictive Value;
REDCap: Research Electronic Data Capture; RFID: Radio-Frequency                     Consent for publication
Identification; SARS: Severe Acute Respiratory Syndrome; SARS-CoV-2: Severe         Not applicable.
Acute Respiratory Syndrome Coronavirus 2; UHS: University Health Services
                                                                                    Competing interests
                                                                                    The authors declare that they have no competing interests.
Supplementary Information
The online version contains supplementary material available at https://doi.
                                                                                    Author details
org/10.1186/s12889-021-11697-6.                                                     1
                                                                                     School of Public Health, Division of Epidemiology and Biostatistics,
                                                                                    University of California, Berkeley, 2121 Berkeley Way # 5302, Berkeley, CA
 Additional file 1: Supplemental Table 1. List of Symptoms Asked on                 94720, USA. 2Facente Consulting, Richmond, CA, USA. 3University Health
 Participant Daily Surveys. Supplemental Table 2. Answers to the                    Services, University of California Berkeley, Berkeley, CA, USA. 4Innovative
 Endline survey question “What was the most difficult or frustrating                Genomics Institute, University of California Berkeley, Berkeley, CA, USA.
 component of the study for you?”. Supplemental Figure 1. Number of
 surveys completed per day, all participants. Supplemental Figure 2.                Received: 28 April 2021 Accepted: 29 August 2021
 Number of surveys completed per day, students only (A) and faculty,
 staff, or essential workers only (B).
                                                                                    References
                                                                                    1. Lake MA. What we know so far: COVID-19 current clinical knowledge and
Acknowledgments                                                                         research. Clin Med. 2020;20(2):124–7. https://doi.org/10.7861/clinmed.2019-
This work could not have been done without our hard-working graduate                    coron.
student researchers, who worked all summer at the specimen collection site          2. Wei WE. Presymptomatic transmission of SARS-CoV-2—Singapore, January
and responded to participant questions and concerns about thermometers:                 23–march 16, 2020. Morb Mortal Wkly Rep. 2020;69(14):411–5. https://doi.
Mariah De Zuzuarregui, Darren Frank, Sarah Gomez, Ariel Muñoz, Ruben                    org/10.15585/mmwr.mm6914e1.
Prado, Lawrence Tello, Emily Wang, and Sabrina Williamson. We also wish to          3. Kimball A, Hatfield KM, Arons M, James A, Taylor J, Spicer K, et al.
thank our collaborators at UC Berkeley’s University Health Services, where              Asymptomatic and Presymptomatic SARS-CoV-2 infections in residents of a
specimen collection and thermometer pickup took place, including but not                long-term care skilled nursing facility - King County, Washington, march
limited to: Judith Sansone, Melody Heller, Holly Stern, Tyler Crooks, Desi Gal-         2020. Morb Mortal Wkly Rep. 2020;69(13):377–81. https://doi.org/10.15585/
lardo, Jeff Kreutzen, Rebecca Stephenson, Lisa Polley, and Melissa Hennings;            mmwr.mm6913e1.
and our collaborators at the Innovative Genomics Institute Testing Consor-          4. Moriarty LF, Plucinski MM, Marston BJ, Kurbatova EV, Knust B, Murray EL,
tium, including Fyodor D. Urnov, Jennifer A. Doudna, Alexandra M. Amen,                 et al. Public health responses to COVID-19 outbreaks on cruise ships -
Kerrie W. Barry, John M. Boyle, Cara E. Brook, Seunga Choo, L.T. Cornmesser,            worldwide, February-march 2020. Morb Mortal Wkly Rep. 2020;69(12):347–
David J. Dilworth, Alexander J. Ehrenberg, Indro Fedrigo, Skyler E. Friedline,          52. https://doi.org/10.15585/mmwr.mm6912e3.
Thomas G.W. Graham, Ralph Green, Jennifer R. Hamilton, Ariana Hirsh, Megan          5. Byambasuren O, Cardona M, Bell K, Clark J, McLaws M-L, Glasziou P.
L. Hochstrasser, Dirk Hockemeyer, Netravathi Krishnappa, Azra Lari, Hanqin Li,          Estimating the extent of asymptomatic COVID-19 and its potential for
Enrique Lin-Shiao, Tianlin Lu, Elijah F. Lyons, Kevin G. Mark, Lisa Argento Mar-        community transmission: systematic review and meta-analysis. MedRxiv.
tell, A. Raquel O. Martins, Patrick S. Mitchell, Erica A. Moehle, Christine Naca,       2020;2020(05):10.20097543.
Divya Nandakumar, Elizabeth O’Brien, Derek J. Pappas, Kathleen Pestal, Diana        6. Tay MR, Low YL, Zhao X, Cook AR, Lee VJ. Comparison of infrared thermal
L. Quach, Benjamin E. Rubin, Rohan Sachdeva, Elizabeth C. Stahl, Abdullah               detection systems for mass fever screening in a tropical healthcare setting.
Muhammad Syed, I-Li Tan, Amy L. Tollner, Connor A. Tsuchida, C. Kimberly                Public Health. 2015;129(11):1471–8. https://doi.org/10.1016/j.puhe.2015.07.
Tsui, Timothy K. Turkalo, M. Bryan Warf, Oscar N. Whitney, and Lea B. Wit-              023.
kowsky. Last but not least, thanks to the specialists in Supply Chain Manage-       7. Frieden TR, Damon IK. Ebola in West Africa—CDC’s role in epidemic
ment at UC Berkeley who managed to find thousands of low-cost                           detection, control, and prevention. Emerg Infect Dis. 2015;21(11):1897–905.
thermometers during a pandemic, particularly Stacey Templeman.                          https://doi.org/10.3201/eid2111.150949.
                                                                                    8. Bitar D, Goubar A, Desenclos JC. International travels and fever screening
Authors’ contributions                                                                  during epidemics: a literature review on the effectiveness and potential use
SF, LH, LP, MP, and AR led study conception and design; AH, GN, and SD                  of non-contact infrared thermometers. Euro Surveill. 2009;14(6):19115.
oversaw components of study implementation; SF led the analysis with                9. Canadian Agency for Drugs and Technologies in Health. Mass
important contributions from YL, LH, and MP; SF wrote the first manuscript              Thermography Screening for Infection and Prevention: A Review of the
draft; and SF, LH, LP, YL, GN, MP, and AR substantively revised the                     Clinical Effectiveness. Ottawa: Canadian Agency for Drugs and Technologies
manuscript. The author(s) read and approved the final manuscript.                       in Health; 2014.
Facente et al. BMC Public Health (2021) 21:1693 Page 10 of 10
10. Liu CC, Chang RE, Chang WC. Limitations of forehead infrared body 30. Harris PA, Taylor R, Thielke R, Payne J, Gonzalez N, Conde JG. Research
temperature detection for fever screening for severe acute respiratory electronic data capture (REDCap)--a metadata-driven methodology and
syndrome. Infect Control Hosp Epidemiol. 2004;25(12):1109–11. https://doi. workflow process for providing translational research informatics support. J
org/10.1086/502351. Biomed Inform. 2009;42(2):377–81. https://doi.org/10.1016/j.jbi.2008.08.010.
11. Mouchtouri VA, Christoforidou EP, An der Heiden M, et al. Exit and Entry 31. Harris PA, Taylor R, Minor BL, Elliott V, Fernandez M, O'Neal L, et al. The
Screening Practices for Infectious Diseases among Travelers at Points of REDCap consortium: Building an international community of software
Entry: Looking for Evidence on Public Health Impact. Int J Environ Res platform partners. J Biomed Inform. 2019;95:103208. https://doi.org/10.1016/
Public Health. 2019;16(23). https://doi.org/10.3390/ijerph16234638. j.jbi.2019.103208.
12. Normile D. Airport screening is largely futile, research shows. Science. 2020; 32. Gardner B. A review and analysis of the use of ‘habit’ in understanding,
367(6483):1177–8. https://doi.org/10.1126/science.367.6483.1177. predicting and influencing health-related behaviour. Health Psychol Rev.
13. Chang JC, Chen YH, Lin MC, et al. Emergency department response to 2015;9(3):277–95. https://doi.org/10.1080/17437199.2013.876238.
COVID-19 outbreak with a fever screening station and “graded approach” 33. Mantzari E, Vogt F, Shemilt I, Wei Y, Higgins JP, Marteau TM. Personal
for isolation and testing. J Chin Med Assoc. 2020;83(11):997–1003. financial incentives for changing habitual health-related behaviors: a
14. Chung YT, Yeh CY, Shu YC, et al. Continuous temperature monitoring by a systematic review and meta-analysis. Prev Med. 2015;75:75–85. https://doi.
wearable device for early detection of febrile events in the SARS-CoV-2 org/10.1016/j.ypmed.2015.03.001.
outbreak in Taiwan, 2020. J Microbiol Immunol Infect. 2020;53(3):503–4. 34. Amen AM, Barry KW, Boyle JM, et al. Blueprint for a pop-up SARS-CoV-2
https://doi.org/10.1016/j.jmii.2020.04.005. testing lab. Nat Biotechnol. 2020;38(7):791–7. https://doi.org/10.1038/s41587-
15. Bwire GM, Paulo LS. Coronavirus disease-2019: is fever an adequate 020-0583-3.
screening for the returning travelers? Trop Med Health. 2020;48(1):14. 35. Clopper CJ, Pearson ES. The use of confidence of fiducial limits illustrate in
https://doi.org/10.1186/s41182-020-00201-2. the case of the binomial. Biometrika. 1934;26(4):404–13. https://doi.org/10.1
16. U.S. Food and Drug Administration. Non-contact Temperature Assessment 093/biomet/26.4.404.
Devices During the COVID-19 Pandemic. 2020. https://www.fda.gov/medica 36. Mercaldo ND, Lau KF, Zhou XH. Confidence intervals for predictive values
l-devices/coronavirus-covid-19-and-medical-devices/non-contact-tempera with an emphasis to case-control studies. Stat Med. 2007;26(10):2170–83.
ture-assessment-devices-during-covid-19-pandemic. Accessed 7 Sept 2020. https://doi.org/10.1002/sim.2677.
17. Environmental Health & Safety, University of Washington. University of 37. Schaarschmidt F. bdpv: Inference and Design for Predictive Values in
Washington Guidance for Symptom Monitoring for COVID-19. Seattle: Diagnostic Tests. The Comprehensive R Archive Network (CRAN); 2019.
University of Washington; 2020. https://www.ehs.washington.edu/system/ 38. Mitra B, Luckhoff C, Mitchell RD, O'Reilly GM, Smit V, Cameron PA.
files/resources/guidance-symptom-monitoring-COVID-19.pdf. Accessed 10 Temperature screening has negligible value for control of COVID-19. Emerg
Oct 2020. Med Australasia. 2020;32(5):867–9. https://doi.org/10.1111/1742-6723.13578.
18. University of Pittsburgh at Greensburg. Requirements for Campus Access 39. Geneva CB II, Fazili T, Javaid W. Normal Body Temperature: A Systematic
During COVID-19. 2020. https://www.greensburg.pitt.edu/covid-19/campus- Review. Open Forum Infect Dis. 2019;6(4):ofz032.
requirements. Accessed 10 Oct 2020. 40. Stephenson LA, Kolka MA. Esophageal temperature threshold for sweating
19. Returning to Campus: Employee Self-Assessment Requirements and decreases before ovulation in premenopausal women. J Appl Physiol (1985).
Attestation. Louisville: University of Louisville; 2020. https://louisville.edu/ 1999;86(1):22–8.
research/covid19resources/employee-self-assessment-form-pdf. Accessed 10 41. Schneier B. Beyond fear: thinking sensibly about security in an uncertain
Oct 2020. world. New York: Springer; 2006.
20. New Mandate: All UCSF personnel must complete in-person or online 42. Turner BM, Schley DR. The anchor integration model: a descriptive model of
screener before entering UCSF hospitals. 2020. https://www.ucsfhealth.org/ anchoring effects. Cogn Psychol. 2016;90:1–47. https://doi.org/10.1016/j.
daily-health-screening. Accessed 10 Oct 2020. cogpsych.2016.07.003.
21. Berkeley Research. COVID-19 Research resources: before returning to 43. Quattrone GA. Overattribution and unit formation: when behavior engulfs
campus. 2020. https://vcresearch.berkeley.edu/covid19/before-returning. the person. J Pers Soc Psychol. 1982;42(4):593–607. https://doi.org/10.1037/
Accessed 10 Oct 2020. 0022-3514.42.4.593.
22. Centers for Disease Control and Prevention (CDC). Definitions of Symptoms 44. Kemper CA. Hygiene Theater. Internal Med Alert. 2020;42(18). https://www.
for Reportable Illnesses. 2020. https://www.cdc.gov/quarantine/air/reporting- reliasmedia.com/articles/146857-hygiene-theater.
deaths-illness/definitions-symptoms-reportable-illnesses.html. 45. Fisher M. Even as cases plummet, ‘hygiene theater’ persists. Wash Post.
2021:A.1.
23. Protsiv M, Ley C, Lankester J, Hastie T, Parsonnet J. Decreasing human body
46. Goldman E. Exaggerated risk of transmission of COVID-19 by fomites. Lancet
temperature in the United States since the industrial revolution. eLife. 2020;
Infect Dis. 2020;20(8):892–3. https://doi.org/10.1016/S1473-3099(20)30561-2.
9. https://doi.org/10.7554/eLife.49555.
47. Schneier B. The Psychology of Security. Berlin: Springer Berlin Heidelberg;
24. Harding C, Pompei F, Bordonaro SF, McGillicuddy DC, Burmistrov D,
2008. p. 50–79.
Sanchez LD. Fever incidence is much lower in the morning than the
48. Schneier B. In Praise of Security Theater. Wired. 2007.
evening: Boston and US National Triage Data. West J Emerg Med. 2020;
49. Hamblin J. Paging Dr. Hamblin: Everyone wants to check my temperature.
21(4):909–17. https://doi.org/10.5811/westjem.2020.3.45215.
The Atlantic. 2020.
25. Harding C, Pompei F, Bordonaro SF, McGillicuddy DC, Burmistrov D,
50. Paltiel AD, Zheng A, Walensky RP. Assessment of SARS-CoV-2 Screening
Sanchez LD. The daily, weekly, and seasonal cycles of body temperature
Strategies to Permit the Safe Reopening of College Campuses in the United
analyzed at large scale. Chronobiol Int. 2019;36(12):1646–57. https://doi.
States. JAMA Network Open. 2020;3(7):e2016818-e.
org/10.1080/07420528.2019.1663863.
26. Sund-Levander M, Grodzinsky E, Loyd D, Wahren LK. Errors in body
temperature assessment related to individual variation, measuring Publisher’s Note
technique and equipment. Int J Nurs Pract. 2004;10(5):216–23. https://doi. Springer Nature remains neutral with regard to jurisdictional claims in
org/10.1111/j.1440-172X.2004.00483.x. published maps and institutional affiliations.
27. Obermeyer Z, Samra JK, Mullainathan S. Individual differences in normal
body temperature: longitudinal big data analysis of patient records. BMJ.
2017;359:j5468. https://doi.org/10.1136/bmj.j5468.
28. Hu JC. The Dawn of the COVID self-attestation. Slate. 2020. https://slate.
com/technology/2020/05/self-attestation-covid19-symptoms-lyft.html.
29. von Elm E, Altman DG, Egger M, Pocock SJ, Gøtzsche PC, Vandenbroucke
JP. The strengthening the reporting of observational studies in
epidemiology (STROBE) statement: guidelines for reporting observational
studies. Epidemiology. 2007;18(6):800–4. https://doi.org/10.1097/EDE.0b013
e3181577654.You can also read