Fake News Reaching Young People on Social Networks: Distrust Challenging Media Literacy - MDPI
←
→
Page content transcription
If your browser does not render page correctly, please read the page content below
publications

Article
Fake News Reaching Young People on Social Networks:
Distrust Challenging Media Literacy
Ana Pérez-Escoda * , Luis Miguel Pedrero-Esteban                           , Juana Rubio-Romero              and Carlos Jiménez-Narros

                                          Department of Communication, Antonio de Nebrija University, C. de Sta. Cruz de Marcenado 27,
                                          28015 Madrid, Spain; lpedrero@nebrija.es (L.M.P.-E.); jrubio@nebrija.es (J.R.-R.); cjimenez@nebrija.es (C.J.-N.)
                                          * Correspondence: aperezes@nebrija.es

                                          Abstract: Current societies are based on huge flows of information and knowledge circulating on the
                                          Internet, created not only by traditional means but by all kinds of users becoming producers, which
                                          leads to fake news and misinformation. This situation has been exacerbated by the pandemic to an
                                          unprecedented extent through social media, with special concern among young people. This study
                                          aims to provide significant data about the youngest generation in Spain (Generation Z) regarding
                                          their media and information consumption, their social network use, and their relationship with fake
                                          news, all in relation to the feeling of reliability/trust. Focusing on a convenience sample of 408 young
                                Spanish students from Generation Z aged 18 to 22, a descriptive exploratory study is presented. Data
                                   collection was performed with an adapted questionnaire. Results show that young Spanish people
Citation: Pérez-Escoda, A.;               use networks for information, showing a surprising lack of trust in social networks as the media they
Pedrero-Esteban, L.M.;                    consume the most. The content they consume the most since the occurrence of COVID-19 is related
Rubio-Romero, J.; Jiménez-Narros, C.      to politics, entertainment, humor, and music. On the other hand, distrust of politicians, media, and
Fake News Reaching Young People           journalists is evident. The conclusion is that media literacy is still more necessary than ever, but with
on Social Networks: Distrust              the added challenge of mistrust: maybe it is time to rethink media literacy.
Challenging Media Literacy.
Publications 2021, 9, 24. https://
                                          Keywords: misinformation; fake news; social media; media; consumption; Generation Z; young
doi.org/10.3390/publications9020024
                                          people; media literacy

Academic Editors:
Belén Puebla-Martínez,
Jorge Gallardo-Camacho,
Carmen Marta-Lazo and Luis
                                          1. Introduction
Miguel Romero-Rodríguez                         Since COVID-19 was first detected in December 2019 in Wuhan (China), the entire
                                          world has struggled with an unprecedented crisis affecting all orders of human life: social
Received: 29 April 2021                   relations, economy, labor market, industry, entertainment, journalism, and education [1,2].
Accepted: 24 May 2021                     Economies around the world have been affected, and stock markets in all countries have
Published: 2 June 2021                    suffered losses. In this situation of precariousness and uncertainty, the need for information
                                          is growing disproportionately and is overwhelmed by an exponential growth of different
Publisher’s Note: MDPI stays neutral      types of disinformation flooding the networks. It is generally accepted that this situation
with regard to jurisdictional claims in   has exacerbated existing problems related to misinformation and fake news, with a new
published maps and institutional affil-   phenomenon developing that the World Health Organization (WHO) has called an “in-
iations.                                  fodemic” [3]. Current societies are based on huge flows of information and knowledge
                                          circulating on the Internet, created not only by traditional means (media communication)
                                          but by all users becoming producers [4,5]. Since social networks emerged at the beginning
                                          of the present century, the status of information and knowledge has been transformed,
Copyright: © 2021 by the authors.         experiencing a remarkable change that has implied a wider online environment enhanced
Licensee MDPI, Basel, Switzerland.        by all users. This new information ecosystem [6,7], providing more freedom in a communi-
This article is an open access article    cational manner, has presented from the beginning a major problem: allowing people to
distributed under the terms and           spread misinformation without surveillance has promoted an information disorder that is
conditions of the Creative Commons        difficult to manage and control [8,9]. The implications of these changes can be highlighted
Attribution (CC BY) license (https://
                                          from two different perspectives: (1) referring to democratic societies in terms of trust not
creativecommons.org/licenses/by/
                                          only in politicians and institutions but also in media and journalism [10] and (2) in terms
4.0/).

Publications 2021, 9, 24. https://doi.org/10.3390/publications9020024                                      https://www.mdpi.com/journal/publications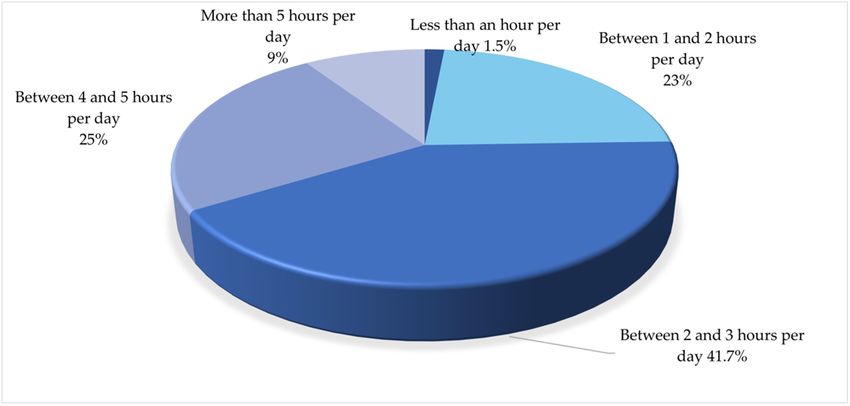
Publications 2021, 9, 24                                                                                             2 of 16

                           of digital literacy necessities that have arisen from media literacy, since the high-speed
                           information free-for-all on social media platforms and on the Internet has emerged as
                           the main environment for information to circulate [11]. On one hand, the first issue de-
                           mands specific actions from policy-makers and media outlets trying to fix the problem,
                           firstly through new regulations and secondly through the practice of trustworthy media
                           discourses engaging citizens in order to tackle distrust and democracy erosion [12]. On
                           the other hand, focusing on audiences/citizens, it seems important, more than ever, to
                           provide them with the suitable digital literacy that enables people to interpret and evaluate
                           received information.
                                 Besides this framework, of an intensive spreading of information on social networks,
                           whether it is trustworthy or not, it is important to note a generational aspect: the youngest
                           generations find their natural habitat in social media. Social networks have emerged as
                           the prevailing setting for socialization, information, and entertainment, including educa-
                           tion [13]. Their proliferation among the youngest population emerges as an unprecedented
                           social phenomenon (penetration data), so the problems arising from the growth of mis-
                           information and the lack of adequate digital literacy are further accentuated among this
                           population, which spends most of its time interacting on social networks [14].
                                 This framework justifies the main objective of the presented research: to provide
                           significant data about the youngest generation in Spain (Generation Z) concerning their
                           media and information consumption, their social network use, and their relationship with
                           fake news, all in relation to the feeling of reliability. The research aims to contribute
                           from a media literacy training perspective and a media transformation perspective, both
                           contributing to tackling the challenge of misinformation undermining democracy.

                           2. State of the Art
                           2.1. Fake News, Infodemic, Media, and Social Media
                                The concept of fake news itself is nothing new; as Burkhardt wrote in 2017 [15] (p. 5),
                           “the ability to have an impact on what people know is an asset that has been prized for
                           many centuries”. The particular issue regarding fake news in the 21st century is the large
                           possibility of impact and spread offered by social networks. This phenomenon has been
                           defined using different terms and from different perspectives: fake news, misinformation,
                           information disorder, disinformation, and post-truth. The European Commission [16]
                           defined the word “disinformation” as “false, inaccurate, or misleading information, pre-
                           sented and promoted to obtain revenue or intentionally cause public harm”, while other
                           authors [17] point out that “fake news” has been chosen as word of the year in British
                           dictionaries such as Collins and Oxford, which define it as false, often sensationalist, in-
                           formation disseminated under the guise of news. The proliferation of this type of news is
                           a problem that affects all citizens, but particularly young Spaniards, who tend to rely on
                           social networks to keep themselves informed, as indicated by Mendiguren, Pérez-Dasilva,
                           and Meso-Ayerdi [18].
                                On 31 March 2020, the Director-General of the World Health Organization (WHO),
                           Tedros Adhanom Ghebreyesus, stated “we’re not just fighting an epidemic; we’re fighting
                           an infodemic” [19], referring to news that spreads more easily and faster than the virus.
                           Although this phenomenon has usually been linked to misinformation, the concept in-
                           deed has a wider scope. The WHO has defined “infodemic” as “an excessive amount of
                           information about a problem, which makes it more difficult to identify a solution”. The
                           WHO’s definition outlines one of the major problems of misinformation: an excessive
                           amount of information, true or false, that is all equally reachable. Social networks have
                           frequently raised the level of noise, and in this sense, some studies point out that in critical
                           situations such as the current one, traditional media offer more trust and credibility [8],
                           although new digital media provide a more rapid response to information queries. The
                           digital media in which we are immersed have allowed any citizen to become a speaker of
                           current affairs, due to the great ease with which users generate and distribute content on
                           different platforms as previously studied by Adoni et al. [20]. The traditional media are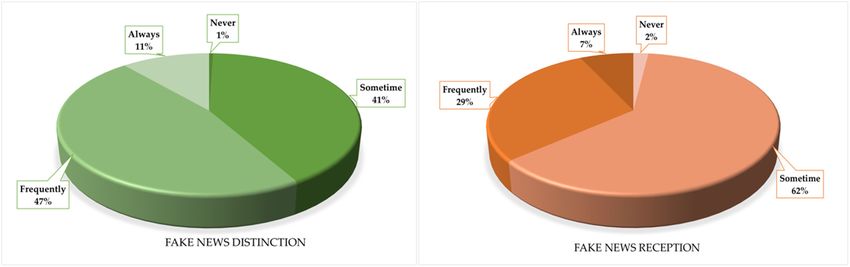
Publications 2021, 9, 24                                                                                          3 of 16

                           no longer the only channel for obtaining information [21]; social networks have become
                           perfect ally for users to quickly find the useful information they need. The consolidation of
                           the Internet and the incorporation of social networks have even modified the traditional
                           agenda-setting theory where the media were the only ones to select the most important
                           news of each day [22]. In the new digital environment, social media have entered the scene,
                           and Facebook, Twitter, or Instagram determine, in many cases, the rundown of a news item
                           or the page composition of a newspaper.
                                In this sense, social networks, due to their horizontal, multidirectional, simultaneous,
                           and unfiltered nature, pose a challenge for the traditional media, as there are now more
                           actors capable of producing and disseminating content. For the first time in history,
                           journalists and citizens have the same tools at their disposal [13,14,22].
                                According to Nielsen et al.’s report [1] from 1 January 2020 to 7 June 2020, the Spanish
                           media published 1,138,364 news items, 90.4% of which were published during the months
                           of March, April, and May. Faced with such an avalanche of information, a confused and
                           anxious society is generated, where citizens were forced to set filters that allowed them to
                           access a volume of content that was more digestible for them. However, these same filters
                           also make them potentially more vulnerable to misinformation [23,24]. Public broadcasters
                           were quick to provide a full schedule of content on the pandemic crisis, which translated
                           into public trust. The International Fact-Checkers Network (IFCN) verified more than
                           6000 fake news during this period [25], acknowledging that the biggest problem for users
                           was that they did not realize they were consuming or sharing fake news. In this regard,
                           a research study from the Washington Post, the New York Center for Social media and
                           Politics, and the Stanford Cyber Policy Center confirmed that readers had difficulties
                           identifying if news content was true or false [26].

                           2.2. Focusing on Generation Z
                                  In this framework, the previously described media consumption seems a relevant
                           issue, focusing on the youngest, who are considered the population more exposed to digital
                           media [4]. Generation Z, also known by different names (centennials, post-millenials, iGen,
                           Gen Zers) has been the subject of growing interest for some time now, mainly because
                           it is considered the authentically digital generation given that it was the first to be born
                           in a fully developed technological environment. This population niche is composed of
                           young people born between the mid-1990s and the early years of this century, although
                           demographers, sociologists, and academics do not quite agree on the years that this
                           generation exactly comprises.
                                  This generation shares many similarities with the so-called millennials (born between
                           the early 1980s and the mid-1990s). Both generations are part of globalization and the dawn
                           of the digital society. They also share the massive use of devices connected to the Internet,
                           which has affected the way they learn and access knowledge [11,27]. However, there are
                           differences between the two generations derived from the socio-economic context and
                           technological advances in which they were born and socialized [28]; changes that, according
                           to published studies, are affecting the perception of the environment, the prevalence
                           of certain values and their relationship with work. Regarding the differences between
                           millennials and centennials derived from the technological context, research points to
                           the explosion of the Internet, which occurred in 1994, as a milestone separating the two
                           generations, as it transformed the practices of digital interaction. There was an exponential
                           increase in the number of information sources, and a more flexible, shared, and mobile
                           organization and transmission of information. Millennials saw the birth of social networks
                           and some of them came of age during this period, so they are considered the first digital
                           migrants [14]. Generation Z, on the other hand, have never known a world without
                           social networks and in which mobile connectivity is the order of the day (recall that the
                           iPhone was launched in 2007). They are therefore young people “shaped” by these new
                           communication technologies and with the capacity to orient their use towards innovation
                           and the design of their professional lives.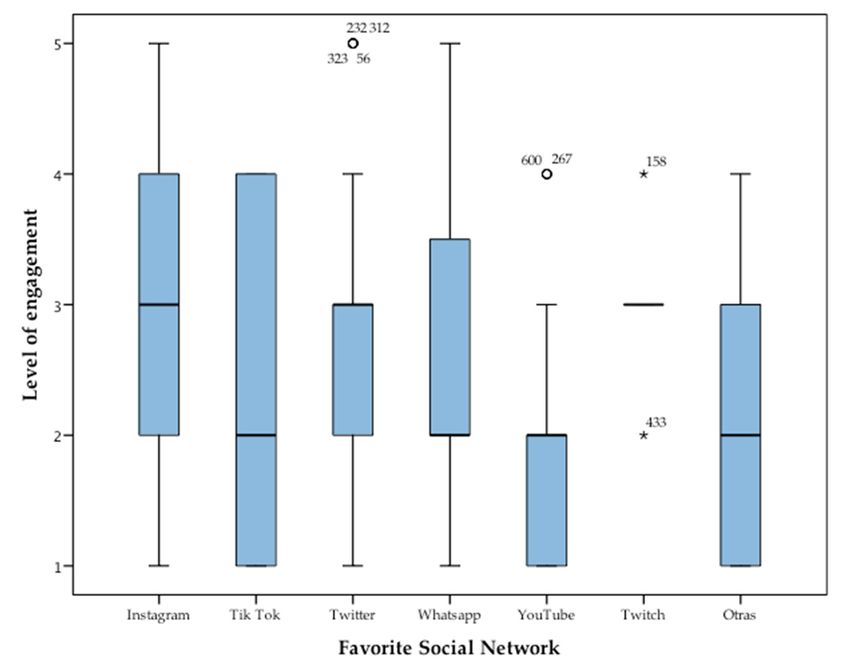
Publications 2021, 9, 24                                                                                            4 of 16

                                 Therefore, the Generation Z is the first generation to have been radically affected by
                           digitalization [29], to the point that, according to Isaac Lee, president of Univision News, it
                           has affected them more than cultural, identity, race, or language aspects, which, on the other
                           hand, makes them the most homogeneous generation of the modern era [30]. They lack a
                           pre-smartphone memory, are on social media more constantly [31], and have had Internet
                           2.0 technology embedded into their lives. Deliberately false information (fake news) is in
                           itself a source of permanent concern as it is rapidly and extensively disseminated due to
                           the strategy of provoking responses of indignation, fear, and surprise. However, it is of
                           particular concern in the case of young people; on the one hand, because they are the most
                           vulnerable and most exposed to social networks, where this type of information circulates
                           unchecked; on the other, because media literacy is part of the educational curriculum for
                           young people. Many publications have dealt with this issue [18,32,33].

                           2.3. UNESCO Media Literacy Response
                                 The United Nations Educational, Scientific, and Cultural Organization, generally
                           known as UNESCO, has been a pioneer in expanding and developing media literacy and
                           media education as a key issue in current societies. From the Gründwald Declaration (1982),
                           where the main framework was established, and then the Alexandria Declaration (2005),
                           which implied a systematization and more precise definition, through the Conference in
                           Vienna (1999), which considered the digital advances and the new communicative era
                           and, to the UNESCO Paris Agenda (2007), the UNESCO has been a pathfinder to media
                           literacy [34,35]. In 2008, the organization presented the ICT Competency Framework
                           for Teachers focusing on ICT in Education as the result of the “mainstream rollout of
                           computers in schools”, introducing Technology Literacy as an essential stage of teacher
                           development [35]. After that, in 2011, UNESCO went further with the AMI Curriculum,
                           combining media and information literacy as prerequisites in the Networked Society
                           for all citizens, but focusing on teachers as leaders in media education. The framework
                           established in the AMI Curriculum introduced nine core indicators to be developed from
                           five key elements:
                           •    Understand the role and functions of media and information in democratic societies.
                           •    Understand and access media contents and their uses, in terms of consumption.
                           •    Critically evaluate media content in the light of media reliability.
                           •    Engage with media for self-expression and democratic participation.
                           •    Review skills (including ICTs) needed to produce user-generated content
                                From the perspective of media and fake news, UNESCO provided a holistic view of
                           the different developments of misinformation with their International Programme for the
                           Development of Communication (IPDC) “encouraging optimum performance and self-
                           regulation by journalists, as an alternative to the risks of having state intervention to deal
                           with perceived problems in the freedom of expression realm” [36] (p. 11). Earlier in 2007,
                           UNESCO published the “Model Curriculum on Journalism Education” and disseminated
                           it worldwide in nine languages. This general concern continued in the publications from
                           2013, “Model Curriculum for Journalism Education: A Compendium of new Syllabus” and
                           in 2015, “Teaching Journalism for Sustainable Development: New Syllabi”. Since 2015, the
                           UNESCO asked media outlets and journalism to be aware in adapting discourses to the
                           new era, being able to [36] (p. 108):
                           1.   Understand how social media have affected the role and profile of journalism.
                           2.   Understand how social media have changed the process of news production and
                                dissemination and the relationship between journalism and audiences.
                           3.   Explore new business and entrepreneurial models for media industries.
                           4.   Discuss ethical challenges and considerations within this new media ecosystem.
                                Bringing together this state of affairs, we find the context for our study: the “infodemic
                           phenomenon” and the intensive use of social networks by young people. This study is
                           focused on providing significant data on media consumption, social network use, and fake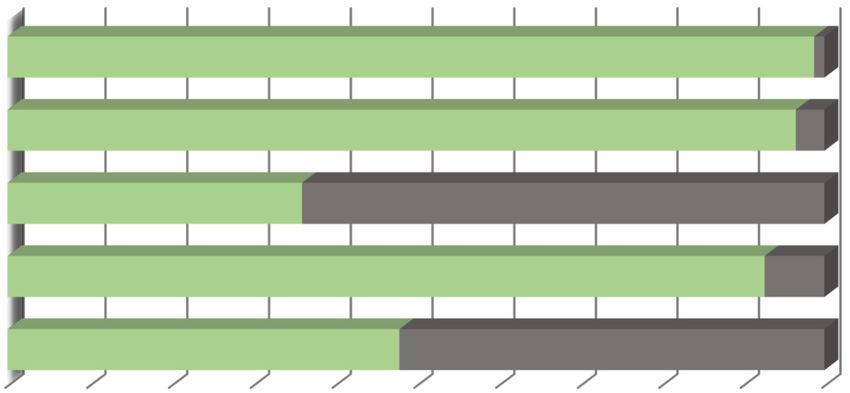
Publications 2021, 9, 24                                                                                                   5 of 16

                                news relationships associated with media reliability of the Generation Z. In this regard,
                                the following research objectives (RO) were addressed according to the media literacy key
                                elements established by the UNESCO:
                                •    RO1. Determine young Spaniard´s media and information access and consumption
                                •    RO2. Describe media and social media habits in order to discover good or bad practices.
                                •    RO3. Analyze the level of reliability awarded to media by this population.
                                •    RO4. Outline the Spanish young´s relationship with fake news in terms of reception,
                                     distinction, and perception.

                                3. Materials and Methods
                                3.1. Study Design: Variables of Study and Instrument
                                     To answer the research objectives, a quantitative, descriptive, and exploratory method-
                                ology was chosen. Data gathering was arranged with the design of an instrument adapted
                                from the report Media Use in the European Union [37] and Digital News Report.es 2020 [38],
                                both focused on media and social media consumption and fake news. The questionnaire
                                was considered as the most appropriate ad hoc design-adapted tool to collect the necessary
                                study variables [39] using the Google Forms tool for this purpose. The definition of the
                                study variables was based on three research constructs related to research questions and
                                according to the previous study by Couldry, Livingstone, and Markha [40]: (1) media
                                consumption, (2) consumption of social networks, and (3) disinformation and fake news.
                                The final questionnaire was the result of a twofold process: (1) first, the team designed
                                an adapted questionnaire in which four different blocks were established: (a) sociode-
                                mographic variables, (b) variables related to media consumption, (c) variables related to
                                social network consumption, and (d) variables related to disinformation and fake news
                                (see Table 1); and (2) second, it was sent to a panel of experts for validation (n = 5) in
                                an attempt to seek internal coherence and clarity for the studied constructs. After this
                                phase, in which seven items were eliminated and eight were rewritten, the questionnaire
                                comprised 81 items organized into the abovementioned constructs. The distribution tool
                                for the questionnaire was Google Forms, and consent was collected from each individual
                                before the survey was freely taken.

                           Table 1. Study constructs, variables, and number of items. Own elaboration.

 Study Constructs and Research Objectives (RO)                    Variables of Study                     Number of Items
                                                     V1 . Source of information                                 8
 C1. Media and information
                                                     V2 . Reliability on sources                                8
 consumption (RO1 and RO3)
                                                     V3 . Media type                                            5
                                                     V4 . Since COVID-19 information consumed                   8
                                                     V5 . Average time                                          1
                                                     V6 . Social media used                                     8
 C2. Social media consumption (RO2)
                                                     V7 . Level of engagement                                   1
                                                     V8 . Favorite social media                                 7
                                                     V9 . Since COVID-19 information received                   8
                                                     V10 . Fake news reception and distinction                  2
 C3. Misinformation and fake news (RO4)              V11 . Content more related to fake news                    8
                                                     V12 . Media spreading more fake news                       8
                                                     V13 . Source reliability                                   6

                                     Regarding the type of variables used, it is important to note that all of them were
                                qualitative and categorical, divided into ordinal and nominal ones. The ordinal ones were
                                designed with a Likert scale, with a range of responses from 1 to 5, where 1 means “none
                                or never” and 5 means “always, all, absolutely, or constantly”. The statistical analysis
                                was descriptive, based on frequencies and percentages, and conducted with the SPSS
                                package version 24. The internal consistency of the test had a high/good reliability with a
                                Cronbach’s Alpha of 0.911, 0.831, and 0.802, respectively, for each construct of the study.
designed with a Likert scale, with a range of responses from 1 to 5, where 1 means “none
or never” and 5 means “always, all, absolutely, or constantly”. The statistical analysis was
descriptive, based on frequencies and percentages, and conducted with the SPSS package
version 24. The internal consistency of the test had a high/good reliability with a
Publications 2021, 9, 24
Cronbach’s Alpha of 0.911, 0.831, and 0.802, respectively, for each construct of the 6study.of 16
According to Vilches [39], when the Alpha coefficient is >0.90, we can say that the
reliability of the instrument is excellent, and if it is >0.80, we can say that it is good.
According to Vilches [39], when the Alpha coefficient is >0.90, we can say that the reliability
of the instrument is excellent, and if it is >0.80, we can say that it is good.
3.2. Sample
The sample, conceived as the set of elements of the population that are asked to
3.2. Sample
participate in the
The sample, investigation
conceived as the[39],
set ofcorresponded
elements of the to undergraduate
population that students
are askedfrom
to
different parts of Spain as shown in Figure 1. The study did
participate in the investigation [39], corresponded to undergraduate students from not intend to be
different
representative;
parts thus, the
of Spain as shown snowball
in Figure sampling
1. The study didtechnique
not intendwas applied,
to be achieving
representative; a total
thus, the
sample of
snowball 408 students
sampling agedwas
technique between
applied,18 achieving
and 22 years oldsample
a total (M = 20.94;
of 408 SD = 3.28).
students The
aged
sample composition was as follows: 30.9% of the sample (N = 126) was male,
between 18 and 22 years old (M = 20.94; SD = 3.28). The sample composition was as follows: and 69.1%
(N = 282)
30.9% was
of the female.
sample (N The distribution
= 126) was male,was andas follows
69.1% (N =in282)
Figure
was1,female.
with most
The of the sample
distribution
being
was as from Madrid
follows (N = 1,
in Figure 145; 35.3%),
with mostValencian Community
of the sample being from(N =Madrid
60; 14.7%),
(N =and
145;Cantabria
35.3%),
(N = 56 13.7%).
Valencian Community (N = 60; 14.7%), and Cantabria (N = 56 13.7%).
Figure1.1.Sample
Figure Samplefrequency
frequencydistribution.
distribution.Own
Ownelaboration.
elaboration.
Thenon-probabilistic
The non-probabilisticsnowball
snowballmethod
methodused
usedforforthe
thesample
sampleselection
selectionwas
wasconsidered
considered
themost
the mostsuitable
suitableforforonly
onlyreaching
reachingindividuals
individualsfrom
fromGeneration
GenerationZ Z[41].[41].TheThecurrent
current
pandemic situation due to COVID-19, in which the researchers had no possibility ofof
pandemic situation due to COVID-19, in which the researchers had no possibility
mobilityand
mobility andthethestudents
studentsattended
attendedschools
schoolsfrom
fromhome,
home,made madethis
thistechnique
techniquethe themost
most
suitableone.
suitable one.TheTheresults
resultswere
weretaken
takenfrom
fromNovember
November2020 2020totoFebruary
February2021.
2021.ItItisisimportant
important
totonote
notethat
thatthe
thenature
natureofofthe
thestudy,
study,descriptive
descriptiveandandmerely
merelyobservational,
observational,was wasappropriate
appropriate
asaswell,
well,taking
takinginto
intoaccount
accountthatthatno
nosampling
samplingerror
errorcould
couldbe bedetermined
determinedand andno noinferences
inferences
could
couldbebeperformed
performed fromfrom this sampling. However,
However,ininorder
ordertotoguarantee
guaranteethe the quality
quality of of
the
the descriptive research design, the appropriate steps were taken as explained
descriptive research design, the appropriate steps were taken as explained in the previous in the
previous
section. section.
4. Results
The results will now be examined to answer research objectives, corresponding to
the three different constructs of study. It is important to note that due to the number of
data gathered within the 81 items, only some of the results obtained were analyzed. To
present the descriptive analysis results, the data distribution, means, standard deriva-
tion, frequencies, boxplots, and crosstabs are used to show the results of the descriptive-
explorative study.
4.1. Media and Information Consumption
The results found for the first construct of study—media and information consumption—
corresponding to four different variables and 29 items in our study, are presented partiallyPublications 2021, 9, 24 7 of 16
with V1 and V2 . The variables were qualitative, categorical, and ordinal with a Likert scale,
as can be observed in the following tables. Table 2 shows the results for V1 : “I usually get
informed with . . . ”, where eight different media could be chosen: radio receiver, online
radio, press, digital press, TV set, online TV, webpages, and social networks.
Table 2. Basic statistics for media normally consume to be informed by Generation Z. Own elaboration.
I Usually Get Informed with . . . Mean DT Never A Little Occasionally Frequently Always N
Radio 1.71 0.877 50.5 34.3 10.3 3.9 1 408
Online radio 1.58 0.855 61.5 23.8 10.3 4.2 0.2 408
Press 1.79 0.896 46.8 33.3 14.7 4.7 0.5 408
Digital press 3.42 1.083 4.7 14.5 32.6 30.4 17.9 408
TV 3.5 1.145 5.6 14.5 25.7 32.6 21.6 408
Online TV 2.2 1.23 39.2 23.3 21.6 9.8 6.1 408
Web pages 3.62 1.04 3.9 9.6 27.7 38 20.8 408
Social networks 4.25 0.961 1.7 4.2 13.7 27.7 52.7 408
The results for the first variable showed us the first insights about media consumption
of the Generation Z, with larger differences found for the radio, with a percentage of
50.5 (M = 1.71; DT = 0.877), and the students declaring never getting information from
this medium. The same was found for online radio, with a percentage of 61.5 (M = 1.58;
DT = 0.855) of the participants; the press, with a percentage of 46.8; and online TV, with
39.2% (M = 2.2; DT = 1.23) of the sample never getting information from it. The opposite
was found for the consumption of digital press, reaching 48.3% (M = 3.42; DT = 1.083), in
which respondents stated that they frequently or always obtained information from this
media; the same was found for webpages, with a percentage of 58.8 (M = 3.62; DT = 1.04)
and social media with the highest percentage, 80.4 (M = 4.25; DT = 0.961). It is worth noting
that the TV was the only traditional medium that was still utilized by young audiences. In
this regard, we found that 54.2% (M = 3.5; DT = 1.145) of our sample declared that they
frequently or always used it to become informed.
The second variable analyzed in this construct of study was related to the reliability of
the media used to become informed. As shown in Table 3, the results were opposite from
the results for the first variable.
Table 3. Basic statistics for reliability perception in media consumed by Generation Z. Own elaboration.
Perceived Reliability of . . . Mean DT Never A Little Occasionally Frequently Always N
Radio 3.46 0.823 1 12.3 32.4 48.3 6.1 408
Online radio 3.26 0.798 1.5 15.2 41.2 39.7 2.5 408
Press 3.59 0.879 1 11 28.4 47.1 12.5 408
Digital press 3.35 0.868 1.2 15 39.2 37 7.6 408
TV 3.28 0.976 3.2 19.9 31.1 37.7 8.1 408
Online TV 3.04 0.942 4.9 23.5 38.5 28.9 4.2 408
Web pages 2.66 0.831 4.7 41.4 38.7 13.5 1.7 408
Social networks 2.41 0.862 11.8 47.3 31.1 8.1 1.7 408
The data obtained for this variable showed that the media that was more appealing to
the Generation Z were indeed those which they considered to be less reliable. As shown in
Table 2, more than a half of the sample considered the radio (54.4%; M = 3.46; DT = 0.823)
and press (59.6%; M = 3.59; DT = 0.879) to be frequently or always reliable media, followed
by the TV (45.8%; M = 3.28; DT = 0.976), digital press (44.6%; M = 3.35; DT = 0.868), online
radio (42.2%; M = 3.26; DT = 0.798), and online TV (33.1%; M = 3.04; DT = 0.942). Lower
rates of reliability were found in the most consumed media by the Generation Z: webpages
and social networks. Only 15.2% (M = 2.66; DT = 0.831) and 9.8% (M = 2.41; DT = 0.862),
respectively, perceived these media as reliable, with these results being certainly surprising,
taking into account these were the most used for being informed. If we address these two0.823) and press (59.6%; M = 3.59; DT = 0.879) to be frequently or always reliable media,
followed by the TV (45.8%; M = 3.28; DT = 0.976), digital press (44.6%; M = 3.35; DT =
0.868), online radio (42.2%; M = 3.26; DT = 0.798), and online TV (33.1%; M = 3.04; DT =
0.942). Lower rates of reliability were found in the most consumed media by the
Generation Z: webpages and social networks. Only 15.2% (M = 2.66; DT = 0.831) and 9.8%
Publications 2021, 9, 24 8 of 16
(M = 2.41; DT = 0.862), respectively, perceived these media as reliable, with these results
being certainly surprising, taking into account these were the most used for being
informed.together
variables If we address these twodistribution,
in a graphical variables together in a graphical
the results distribution,
are very interesting as the results
shown in
are very
Figure 2. interesting as shown in Figure 2.
90
80.4
80
70
58.8
60 54.2
59.6 48.3
50 54.4
40 45.8 44.6
42.2
30
33.1
20 15.9
10 5.2 4.9 4.4 15.2
9.8
0
0 1 2 3 4 5 6 7 8 9
Press Radio receiver TV set Digital press Online radio Online TV Webpages Social Networks
Reliability Consumption
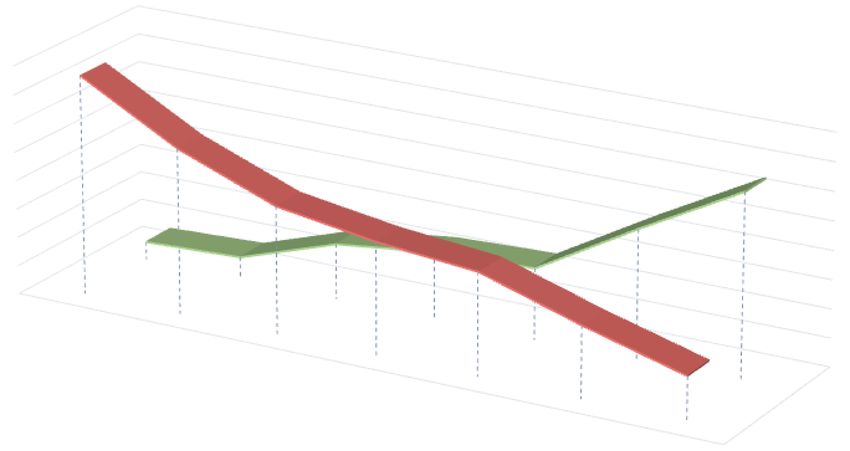
Figure 2. Graphical distribution for media consumption and media reliability for Generation Z. Own elaboration.
Figure 2. Graphical distribution for media consumption and media reliability for Generation Z. Own elaboration.
It can be observed that the less consumed media—the press, radio, and online radio—
were Itperceived
can be observed
as the that
mostthe less consumed
reliable, and on media—the
the contrary, press,
the radio,
most and online radio—
consumed media
were perceived as the most reliable, and on the contrary, the most consumed
(webpages and social networks) seemed to be perceived as the least reliable media. media
To
(webpages and social networks) seemed to be perceived as the least reliable
complete an analysis of the media consumption results, it makes sense to ask our sample media. To
complete
Publications 2021, 9, x FOR PEER REVIEW an analysis of the media consumption results, it makes sense to
which kind of information they preferred to become informed about, as observed in17ask our sample
9 of
which 3.kind of information they preferred to become informed about, as observed in
Figure
Figure 3.
80%
72.3
70% 67.1 66.4
62.8
60%
50%
40%
30.9
30%
20%
10%
0%
Textu al A ud io inform ation V id eo inform ation Im age inform ation V arios at the sam e
inform ation tim e
Figure3.3.Graphical
Figure Graphicalpercentages
percentages for preferences
for preferences intypes
in data data for
types for information
information consumption.
consumption. Own
Own elaboration.
elaboration.
The last variable in the first construct was related to what kind of information was
more The last variable
consumed in the
since the first construct
COVID-19 pandemicwasbegan.
related to results
The what kind
are asofshown
information was
in Table 4,
more consumed
as follows. since the COVID-19 pandemic began. The results are as shown in Table
4, as follows.
Table 4. Basic statistics for (V4): what kind of information have consumed the most since COVID-19 occurred? Own
elaboration.
Mean DT Never A Little Occasionally Frequently Always N
Healthcare 3.43 1.162 4.4 19.4 27.3 26.5 22.4 408
Alternative medicine and self-help 2.45 1.163 21.6 38.6 19.7 13.5 6.6 408
Politics 4.09 1.016 2.2 5.4 18 30.3 44.1 408Publications 2021, 9, 24 9 of 16
Table 4. Basic statistics for (V4 ): what kind of information have consumed the most since COVID-19 occurred? Own elaboration.
Mean DT Never A Little Occasionally Frequently Always N
Healthcare 3.43 1.162 4.4 19.4 27.3 26.5 22.4 408
Alternative medicine and self-help 2.45 1.163 21.6 38.6 19.7 13.5 6.6 408
Politics 4.09 1.016 2.2 5.4 18 30.3 44.1 408
Entertainment and Culture 3.15 1.224 7.9 27 24.8 22.6 17.7 408
Food and care 2.86 1.134 12.3 29 26.3 25.8 6.6 408
Sports 2.88 1.221 15 25.3 27.3 21.6 10.8 408
Sexuality and privacy 2.2 1.065 28.7 38.8 20.4 8.1 3.9 408
Humor 3.83 1.183 4.4 11.8 17.9 28.3 37.6 408
We found that there were two specific topics that were most consumed: politics were
always consumed by 44.1% (M = 4.09; DT = 1.016), which totals 74.4% if we consider the
responses “frequently” and “always”; the other topic with the highest results was humor,
always consumed by 37.6% (M = 3.83; DT = 1.183) of the sample and frequently and always
consumed by 65.9% of the sample.
4.2. Social Media Consumption
We now present the results for the second construct of study—social media consumption—
corresponding to four different variables and 17 items in our study. Regarding the first
variable—average time spent in social media per day—which represents one of the
Publications 2021, 9, x FOR PEER REVIEW key
10 of 17
aspects when measuring media literacy (access and use), the results are shown in Figure 4.
Figure 4. Graphical
Figure 4. Graphical representation average time
representation average time spend
spend in
in social
social networks
networks per
per day.
day. Own
Own elaboration.
elaboration.
As can be observed, 41.8% of the sample spent between 2 and 3 h per day in social social
networks, a quarter of the individuals (25%) declared surfing digital media between 4 to
5 hh per
perday
dayand
and9%9%more
morethan
than5 h5 per day.
h per TheThe
day. smallest average
smallest was was
average for “Less than an
for “Less hour
than an
per
hourday”:
per only
day”:1.5%
onlydeclared this range,
1.5% declared thiswhich indicated
range, which that virtually
indicated thatallvirtually
the individuals
all the
in the sample
individuals in spent time in
the sample the time
spent socialinnetworks. For the next
the social networks. Forvariable
the nextof study (V
variable ), we
of6study
analyzed basic statistics and correlations between the average time spent in social
(V6), we analyzed basic statistics and correlations between the average time spent in social networks
and specific
networks andsocial networks,
specific as shown in
social networks, as Table
shown5.in Table 5.
Table 5. Basic statistics for variable (V6) “Define your level of usage for social networks” and correlation with average time
of social networks use. Own elaboration.
State the
Level of Use Mean DT p Rho Never A Little Occasionally Frequently Always N
for …
Facebook 1.5 0.914 0.240 0.057 69.6 18.4 6.4 3.7 2 408
Tik Tok 2.26 1.418 0.000 * 0.222 45.3 18.4 12 13.7 10.5 408
Twitter 2.96 1.5 0.000 * 0.242 23.3 22.1 13 19.1 22.5 408
Twitch 1.47 0.905 0.459 0.037 72.1 16.4 6.4 2.9 2.2 408Publications 2021, 9, 24 10 of 16
Table 5. Basic statistics for variable (V6 ) “Define your level of usage for social networks” and correlation with average time
of social networks use. Own elaboration.
State the Level of Use for . . . Mean DT p Rho Never A Little Occasionally Frequently Always N
Facebook 1.5 0.914 0.240 0.057 69.6 18.4 6.4 3.7 2 408
Tik Tok 2.26 1.418 0.000 * 0.222 45.3 18.4 12 13.7 10.5 408
Twitter 2.96 1.5 0.000 * 0.242 23.3 22.1 13 19.1 22.5 408
Twitch 1.47 0.905 0.459 0.037 72.1 16.4 6.4 2.9 2.2 408
YouTube 3.26 1.073 0.249 0.057 2.2 25.7 31.1 25.5 15.4 408
Instagram 4.12 1.02 0.000 * 0.422 2.2 6.1 15 30.9 45.8 408
WhatsApp 4.32 0.943 0.003 * 0.349 0.2 6.6 12.3 23 57.8 408
* p < 0.05.
From Table 5, it is worth noting that Instagram and WhatsApp were the most used
among our sample, with 45.8% and 57.8%, respectively, declaring they used it “always”.
Regarding correlations between social networks that were most used and average time
spent, significant correlations (p < 0.05) were found for Tik Tok, Twitter, and Instagram.
However, it is important to point out that this correlation is weak in all cases, except for
Instagram, showing moderate results (p = 0.000; R = 0.422).
According to Voorveld, Guda, Muntinga, and Bronner [42], one of the most inter-
esting issues in the study of social networks consumption is related to engagement as a
psychological state of user’s motivation, determining different roles adopted when using
social networks. As shown in Figure 5 the level of engagement in our sample was different
Publications 2021, 9, x FOR PEER REVIEW 11 of 17
depending on the digital platform. To address this issue, five different levels of engagement
were established as defined by Barger and Labrecque [43].
Boxplot
Figure5.5.Boxplot
Figure forfor distribution
distribution of favorite
of favorite socialsocial network
network and of
and level level of engagement
engagement in social
in social
networks.Own
networks. Own elaboration.
elaboration. Small
Small circles
circles andand
starstar values
values areare outliers.
outliers. Small
Small circles,
circles, “out“out values”,
values”,
and
andstar
starones,
ones,“far
“farout
outvalues”.
values”.
TheThelevels
levelsof
of engagement
engagement werewere established
establishedasasfollows:
follows:(1)(1)I only consume
I only consume without any
without
any participation; (2) I consume and participate by sharing content that I find interestingor
participation; (2) I consume and participate by sharing content that I find interesting
orthat
thatI have created
I have created myself; (3)(3)
myself; I consume
I consumeand participate
and by by
participate sharing andand
sharing commenting;
commenting; (4) I
consume, participate by sharing, comment and seek to mention others;
(4) I consume, participate by sharing, comment and seek to mention others; and (5) I and (5) I consume,
participate
consume, by sharing,
participate by commenting, and seeking
sharing, commenting, andcontroversy/dispute.
seeking controversy/dispute.
The last variable in this construct of the study referred to social media content
consumption since COVID-19 began. The results shown in Table 6 for this variable
allowed us an in-depth understanding of the variables analyzed.
Table 6. Basic statistics for variable (V8): Social media content consumption since COVID-19 occurred. Own elaboration.
Type of Content Mean DT Never A Little Occasionally Frequently Always NPublications 2021, 9, 24 11 of 16
The last variable in this construct of the study referred to social media content con-
sumption since COVID-19 began. The results shown in Table 6 for this variable allowed us
an in-depth understanding of the variables analyzed.
Table 6. Basic statistics for variable (V8 ): Social media content consumption since COVID-19 occurred. Own elaboration.
Type of Content Mean DT Never A Little Occasionally Frequently Always N
Entertainment and culture 4.16 0.918 0.2 5.6 16.9 32.4 44.9 408
Fashion and beauty 2.91 1.407 21.1 22.3 18.6 20.1 17.9 408
Information and current issues 3.38 1.045 2.7 19.1 31.1 31.6 15.4 408
Humor and memes 3.7 1.157 4.2 13.2 21.3 30.6 30.6 408
Food and care 2.36 1.183 27.5 34.3 19.6 12.5 6.1 408
Sports 2.58 1.322 25.6 30.2 15.5 18.4 10.3 408
Trending topics 2.55 1.177 20.1 33.7 24.3 14.5 7.4 408
Music 3.69 1.179 4.2 14 22.4 27.3 32.2 408
Cars and motor 1.52 0.99 72 13.8 6.9 4.9 2.5 408
Video games and gamers 1.97 1.291 54.3 18.4 8.8 12.5 5.9 408
Politics 2.63 1.24 21.6 28 25.1 16.2 9.1 408
Challenges 1.81 0.98 47.7 32.4 13 4.7 2.2 408
Healthcare 2.53 1.199 23.3 29.2 26.3 13.8 7.4 408
Technology 2.38 1.185 28.5 29.5 22.6 14.3 5.2 408
Publications 2021, 9, x FOR PEER REVIEW 12 of 17
It is worth noting from these results that the most timely issues in social media con-
sumption for our sample (more than a quarter declared consuming it “frequently” or “al-
ways”) were “Entertainment and culture”, with 77.3%; “Humor and memes”, 61.2%; “Mu-
“Music”,
sic”, 59.5%;59.5%; “Information
“Information and current
and current issues”,issues”, 46%; “Fashion
46%; “Fashion and 38%;
and beauty”, beauty”, 38%;
“Sports”,
“Sports”,
28.7%; and28.7%; and “Politics”,
“Politics”, 25.3%. 25.3%.
4.3. Misinformation
4.3. Misinformation and
and Fake
Fake News
News
The results
The resultsinin
thethe
thirdthird
construct of study—misinformation
construct and fake and
of study—misinformation news—correspond
fake news—
with four different variables and 29 items in our study. The first
correspond with four different variables and 29 items in our study. The results addressed were
first results
related to fake
addressed werenews distinction
related and reception,
to fake news distinctionasand
shown in Figure
reception, 6.
as shown in Figure 6.
Figure 6.
Figure 6. Fake
Fake news
news distinction
distinction and
and reception.
reception. Own
Own elaboration.
elaboration.
Subsequently, these variables allowed us to analyze, on the one hand, which content
was perceived to be more related
related with
with fake
fake news
news (V 10), and, on the other hand, which
(V10
media were spreading more fakefake news
news (V 11). Topics for V10
(V11 10 were taken from responses
obtained in V8: social media content consumption since COVID-19
obtained COVID-19 began.
began. Considering
Considering
responses from “frequently” and “always”, a percentage of 38.9 showed that “Academic
content” spread fake news to some extent, and similar results were obtained for contents
such as “Sports” with 38.8%, “Beauty and fashion”
fashion” with
with 24.4%,
24.4%, “Entertainment”
“Entertainment” with
or “Videogames
33.2%, or “Videogames and
and gamers”
gamers”with
with27.3%.
27.3%.The
Theresults
resultsfor
for“Politic
“Politiccontent”,
content”,with
witha
percentage of 98, and “Humor and gossip” with 83.5%, obtained the highest averages.
Regarding variable (V11) the results were as follows in Table 7.
Table 7. Basic statistics for variable (V11): Which contents do you perceive to be more related with fake news? Own
elaboration.
Mean DT Never A Little Occasionally Frequently Always NPublications 2021, 9, 24 12 of 16
a percentage of 98, and “Humor and gossip” with 83.5%, obtained the highest averages.
Regarding variable (V11 ) the results were as follows in Table 7.
Table 7. Basic statistics for variable (V11 ): Which contents do you perceive to be more related with fake news? Own elabora-
tion.
Mean DT Never A Little Occasionally Frequently Always N
Academic 2.34 0.867 11.1 57 21.1 8.6 2.2 408
Politic 4.18 0.823 0 2 20.6 35.1 42.3 408
Humor and gossip 3.69 1.09 2.9 13.5 21.1 36.1 26.3 408
Health and diet 3 1.109 7.6 27.8 31.9 22.1 10.6 408
Fashion 2.13 0.858 20.1 55.5 17 5.7 1.7 408
Sports 2.44 0.953 12 49.1 24.8 10.6 3.4 408
Entertainment 2.27 0.933 19.4 47.4 21.9 9.8 1.5 408
Videogames and tech 2.13 0.837 21.4 51.4 20.9 5.7 0.7 408
As shown in Table 7, results coincided with the perception of distrust and reliability
studied in the first construct of the study. It is important to note that the results for Facebook
Publications 2021, 9, x FOR PEER REVIEW
and Tik Tok were not significant as they were already analyzed and our sample did 13 not
of 17
consume them. At this point, feelings associated with fake news were explored in the next
item, as shown in Figure 7.
Manipulation 94.1 1.2
Distrust 88 3.2
Entertainment 26.1 46.4
Danger 80.8 6.4
Joke/kiding 35.1 38.16
0% 10% 20% 30% 40% 50% 60% 70% 80% 90% 100%
Yes No
Figure 7. What feelings do you associate fake news with? Own elaboration.
Figure 7. What feelings do you associate fake news with? Own elaboration.
Considering the individuals from our sample, we found the following feelings related
to fakeConsidering the individuals
news: a percentage from our
of 94.1 declared thatsample, we found
they associate the following
manipulation with feelings
misin-
related to fake
formation, 88% news:
stated aassociating
percentageitof 94.1distrust,
with declaredand that80.8%
they associate
said it was manipulation
associated with with
misinformation,
danger. The next 88% step stated associating
was focused it without
on finding distrust,
if theyand 80.8%
were said
using it was associated
fact-checking as a
with danger.
specific tool to The
fightnext step was focused
disinformation and fakeon news.
finding out if they
Although thiswere using
concept is fact-checking
usually relatedas
toa journalism,
specific toolittohasfight disinformation
experienced and fake
an increasing news. Although
relevance thismedia
since social concept is usually
emerged as
relatedtotobecome
sources journalism, it has
informed experienced
among an increasing
the population, and more relevance
so since since socialbegan,
COVID-19 media
asemerged
described as by Magallón-Rosa
sources to become[44]. In this regard,
informed among we the found that 61.2%
population, and of the sample
more so since
declared
COVID-19 they did not
began, know what
as described by aMagallón-Rosa
fact-checker was, [44].and only
In this 38.8%we
regard, declared they
found that 61.2%
knew
of thewhat theydeclared
sample were. From theythis
didpercentage,
not know only what20.9% stated theywas,
a fact-checker had and
usedonly
it at least
38.8%
once. In this
declared thatregard,
they Newtral,
knew what Efe they
Verifica, andFrom
were. Maldita.es were the most
this percentage, onlyused
20.9%fact-checkers.
stated they
hadFinally,
used it asat can
leastbeonce.
observed
In thisinregard,
Figure 8, almost Efe
Newtral, 8 out of 10 young
Verifica, people absolutely
and Maldita.es were the
distrust politicians.
most used fact-checkers. Specifically, 57.7% distrust social media, and 44.4% distrust media,
only trusted by 6.1% and 7.6% respectively. Journalists did not obtain a
Finally, as can be observed in Figure 8, almost 8 out of 10 young people absolutely better perception,
with 4 outpoliticians.
distrust of 10 young people declaring
Specifically, 57.7% distrust: they were
distrust social only
media, trusted
and 44.4%bydistrust
a percentage
media,
only trusted by 6.1% and 7.6% respectively. Journalists did not obtain a better perception,
with 4 out of 10 young people declaring distrust: they were only trusted by a percentage
of 19.2%. In addition, it can be observed that scientific and international institutions were
trusted the most, with percentages of 64.7% and 45.3%, respectively.Publications 2021, 9, 24 13 of 16
Publications 2021, 9, x FOR PEER REVIEW
of 19.2%. 14 were
In addition, it can be observed that scientific and international institutions of 17
trusted the most, with percentages of 64.7% and 45.3%, respectively.
80%
70% 76.6
60%
50%
57.7
40%
30% 39.1 23.5 64.7
44.4
20% 45.3
10%
6.1 19.2 24.8
35.9
0% 7.6
Politicians
Social m ed ia
24.9
M ed ia
Journalists Tru st
15.2
Fam ily and
friend s D istru st
International
institutions
Scientifics
Figure
Figure 8.
8. Percentages
Percentages in
in trust
trust and
and distrust
distrust feelings
feelings about
about social
social agents.
agents. Own
Own elaboration.
elaboration.
5. Discussion
5. Discussion andand Conclusions
Conclusions
Misinformationand
Misinformation andfake
fakenews
newshavehavebecome
becomea agreat great global
global concern
concern since
since thethe start
start of
of the COVID-19 pandemic, affecting all citizens, as recent literature
the COVID-19 pandemic, affecting all citizens, as recent literature indicates [5,8,10,17]. indicates [5,8,10,17].
However, the
However, the manner
manner in in which
which itit is
is reaching
reaching young people is
young people is extremely
extremely concerning,
concerning, as as
shown in
shown in several
several studies
studies [18,23,30,31].
[18,23,30,31]. It It could
could be be said
said that
that misinformation
misinformation and and fake
fake news
news
have been
have been inherently
inherently human
human issues
issues since
since the
the beginning
beginning of of time
time [45],
[45], but
but the
the impact
impact andand
the easy spread of the phenomenon through social networks call
the easy spread of the phenomenon through social networks call for urgent actions from for urgent actions from
universities and
universities and stakeholders
stakeholders (media
(media andand policymakers).
policymakers). AlthoughAlthough the the present
present research
research
study does not offer a working hypothesis—as it is not intended
study does not offer a working hypothesis—as it is not intended to be an experimental to be an experimental
research study,
research study, but
but aa descriptive
descriptive one—the
one—the main main findings
findings presented
presented pointpoint to
to three
three different
different
issues related to the results obtained, not only opening new
issues related to the results obtained, not only opening new lines of research but lines of research but also
also
providing benchmarks for specific actions from media stakeholders,
providing benchmarks for specific actions from media stakeholders, policy makers, and policy makers, and
educational institutions:
educational institutions:
Firstly, regarding
Firstly, regarding mediamedia consumption
consumption in in line
line with
with other
other previous
previous and and recent
recent studies
studies
such as Couldry, Livingstone, and Markham [40]; Jones [33]; and
such as Couldry, Livingstone, and Markham [40]; Jones [33]; and Mendiguren, Pérez, and Mendiguren, Pérez, and
Meso [18], 5 out of 10 young people declared never becoming informed by consuming the
Meso [18], 5 out of 10 young people declared never becoming informed by consuming the
radio or the press, neither their analog nor online versions, while 7 out of 10 frequently or
radio or the press, neither their analog nor online versions, while 7 out of 10 frequently or
always became informed with social networks. These data coincide with previous studies
always became informed with social networks. These data coincide with previous studies
and reports, but the interesting aspect offered by this study remains in the reliability rating
and reports, but the interesting aspect offered by this study remains in the reliability rating
given by the young people to the media they consume. Although theoretical arguments
given by the young people to the media they consume. Although theoretical arguments
tell us that cognitive biases conduct us to believe what we see, before believing what we
tell us that cognitive biases conduct us to believe what we see, before believing what we
read, as assumed by Daniel Kahneman in his concept WYSIATI (What You See is All There
read, as assumed by Daniel Kahneman in his concept WYSIATI (What You See is All There
is) [46,47], our sample is highly distrustful about the media that they consume the most,
is) [46,47], our sample is highly distrustful about the media that they consume the most,
namely social networks and webpages, which tend to be more visual in nature. On the
namely social networks and webpages, which tend to be more visual in nature. On the
contrary, they truly believe in the reliability of media such as the radio or the press, which
contrary,
is highly they truly believe
interesting in the
for media reliability
outlets, as itof mediathe
shows such
needas the
for radio or the press,
new projects which
to focus on
is highly interesting for media outlets, as it shows
this unattended audience, as they once declared not consuming them. the need for new projects to focus on
this unattended audience,
Secondly, related as they
to social onceaccess
media declaredandnot consuming itthem.
consumption, is generally accepted in
the literature that people would rather rely on the information thatit is
Secondly, related to social media access and consumption, isimmediately
generally accepted in
available,
the literature that people would rather rely on the information
and the availability and the use of digital media are undeniable [5,40]. Moreover, the study that is immediately
available, and the availability and the use of digital media are undeniable [5,40].
Moreover, the study presented confirms how social media offering immediacy make them
more appealing to Generation Z; however, a novel contribution to previous studies is the
degree of awareness they showed regarding the lack of credibility of the contentPublications 2021, 9, 24 14 of 16
presented confirms how social media offering immediacy make them more appealing to
Generation Z; however, a novel contribution to previous studies is the degree of awareness
they showed regarding the lack of credibility of the content circulating through these
media. The results on social network use—three-quarters of the sample used Instagram
and WhatsApp the most—provided interesting data for media stakeholders. Perhaps in
light of these descriptive data, media stakeholders should consider promoting specific
content in these social networks to fight distrust and misinformation.
In third place, the data obtained, related to fake news, perceptions, and reception,
allowed us to conclude that the Spanish Generation Z received and recognized fake news,
but surely they did not use tools for their verification; i.e., 6 out of 10 young people in our
study did not know what a fact-checker was. This lack of knowledge has been unfortunately
confirmed by several studies [18,32] and reports [37,38]. Although they are conscious of
the lack of credibility of social networks, they consume them intensively, assuming they
constantly receive fake news that makes them feel manipulated, distrusted, and in danger.
Several aspects or actions need to be brought together to provide a response to this situation,
as highlighted by Lim and Tan [48], on the one hand, the Spanish government should
foster significant, systematic, and comprehensive training programs in media literacy
(following good practices from different countries such as Vietnam with their program
“Fake6=Fact” or the UK’s National Literacy Trust), and on the other hand, asking large
corporations to collaborate in the fight against fake news. In this regard, we recently found
that WhatsApp launched the “How WhatsApp can help you stay connected during the
coronavirus (COVID-19) pandemic” program, which includes a step-by-step guide for
users [49]. In light of the results obtained, we should add two more issues: first, media
stakeholders are aware of young people and trust them, but they do not interact with
them. They need to focus on young people as an audience, and they will pay attention
if they feel that the media are also talking to them. Secondly, there is a need, more than
ever, to reinforce media education at universities in order to promote and build up strong
critical thinking skills in students. As shown by different data, the Spanish Generation
Z does not lack media literacy skills in terms of access, use, and consumption, but the
problem goes beyond traditional media literacy. As pointed out by Buckingham [50],
rethinking media literacy should not be presented as an individual solution, as it relays
responsibility to citizens and “absolves governments from their responsibility to solve
problems” [50] (p. 230). Instead, re-thinking media literacy should be thought of as a global
solution that involves governments, media stakeholders, and education leaders at schools
and universities.
Author Contributions: Conceptualization, C.J.-N. and J.R.-R.; methodology, A.P.-E. and L.M.P.-E.;
validation, A.P.-E. and L.M.P.-E.; formal analysis, A.P.-E. and L.M.P.-E.; investigation, A.P.-E., L.M.P.-
E., C.J.-N. and J.R.-R.; writing—original draft preparation, A.P.-E.; writing—review and editing,
A.P.-E. and L.M.P.-E.; visualization, A.P.-E.; supervision, L.M.P.-E. All authors have read and agreed
to the published version of the manuscript.
Funding: This research received no external funding.
Data Availability Statement: The data presented in this study are available on request from the
corresponding author. The data are not publicly available due to it is still an ongoing research.
Conflicts of Interest: The authors declare no conflict of interest.
References
1. Nielsen, R.K.; Fletcher, R.; Newman, N.; Brennen, J.S.; Howard, P. Navigating the ‘Infodemic’: How People in Six Countries Access and
Rate News and Information about Coronavirus; Reuters Institute for the Study of Journalism: Oxford, UK, 2020.
2. EBU Intelligent Service. ECovid Crisis. PSM Audience Performance. 2020. Available online: https://www.ebu.ch/publications/
research/membersonly/report/covid-19-crisis-psm-audience-performance (accessed on 6 March 2021).
3. WHO. Managing the COVID-19 Infodemic: Promoting Healthy Behaviours and Mitigating the Harm from Misinformation and
Disinformation. Available online: https://www.who.int/news/item/23-09-2020-managingthe-covid-19-infodemic-promoting-
healthy-behaviours-and-mitigating-the-harm-from-misinformationand-disinformation (accessed on 6 March 2021).You can also read