Operando attenuated total reflection Fourier-transform infrared (ATR- FTIR) spectroscopy for water splitting - IOPscience
←
→
Page content transcription
If your browser does not render page correctly, please read the page content below

Journal of Physics D: Applied Physics

TOPICAL REVIEW • OPEN ACCESS

Operando attenuated total reflection Fourier-transform infrared (ATR-
FTIR) spectroscopy for water splitting
To cite this article: A Bieberle-Hütter et al 2021 J. Phys. D: Appl. Phys. 54 133001

View the article online for updates and enhancements.

                                This content was downloaded from IP address 46.4.80.155 on 19/10/2021 at 01:48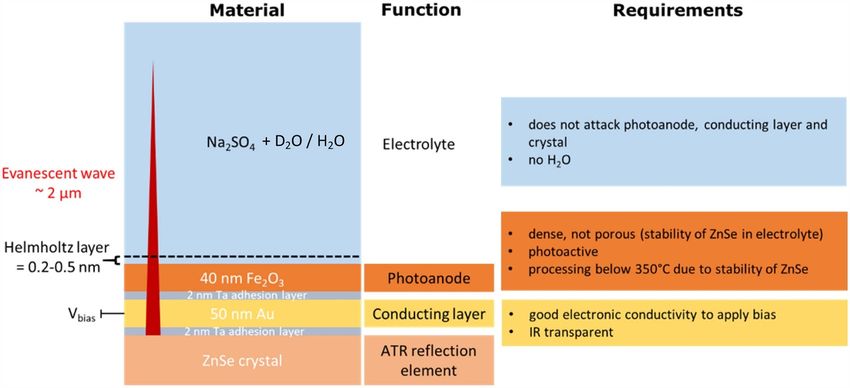
Journal of Physics D: Applied Physics
J. Phys. D: Appl. Phys. 54 (2021) 133001 (12pp) https://doi.org/10.1088/1361-6463/abd435
Topical Review
Operando attenuated total reflection
Fourier-transform infrared (ATR-FTIR)
spectroscopy for water splitting
A Bieberle-Hütter1, A C Bronneberg1, K George1 and M C M van de Sanden1,2
1
Dutch Institute for Fundamental Energy Research (DIFFER), PO Box 6336, 5600 HH Eindhoven, The
Netherlands
2
Eindhoven University of Technology, Department of Applied Physics, PO Box 513, 5600 MB
Eindhoven, The Netherlands
E-mail: a.bieberle@differ.nl
Received 24 September 2020, revised 21 November 2020
Accepted for publication 16 December 2020
Published 21 January 2021
Abstract
Operando attenuated total reflection Fourier-transform infrared (ATR-FTIR) spectroscopy is
discussed in this paper for water splitting application. The first part of the paper focuses on the
discussion of the opportunities and challenges of this method for the characterization of the
solid-liquid interface in water splitting. The second part of the paper focuses on recent
results and future perspectives. We present stable and robust operando ATR-FTIR
measurements using low temperature processing of hematite and a set-up where the functional
thin film is integrated on the ATR crystal. We find increased absorbance as a function of applied
potential at wavenumber values of 1000 cm−1 –900 cm−1 and relate this to changes in the
surface species during water oxidation. We argue that this approach has the potential to be
developed to a routine method for the characterization of interfaces in water splitting. Such
ATR-FTIR data is of crucial importance for the validation of models in microkinetic modeling.
We show some recent results of microkinetic modeling of the hematite–electrolyte interface and
explain how a combination of operando ATR-FTIR measurements and microkinetic modeling
enables the identification of the reaction mechanism in water splitting. We discuss how this
combined approach will enable designing of tailored catalysts and accelerating their
development in the future.
Keywords: water splitting, solid liquid interface, microkinetic modeling, reaction mechanism,
hematite, infrared spectroscopy
(Some figures may appear in colour only in the online journal)
1. Introduction
According to well-known national and international climate
accords [1, 2], CO2 emissions have to be reduced, alternat-
ive energy sources need to be developed, and industry has
to become circular. Hence, new, alternative, and sustainable
Original content from this work may be used under the terms
energy solutions are required. Electrochemical applications
of the Creative Commons Attribution 4.0 licence. Any fur-
ther distribution of this work must maintain attribution to the author(s) and the are promising, since they allow storing energy in chemical
title of the work, journal citation and DOI. bonds and are therefore the key for sustainable, synthetic
1361-6463/21/133001+12$33.00 1 © 2021 The Author(s). Published by IOP Publishing Ltd Printed in the UK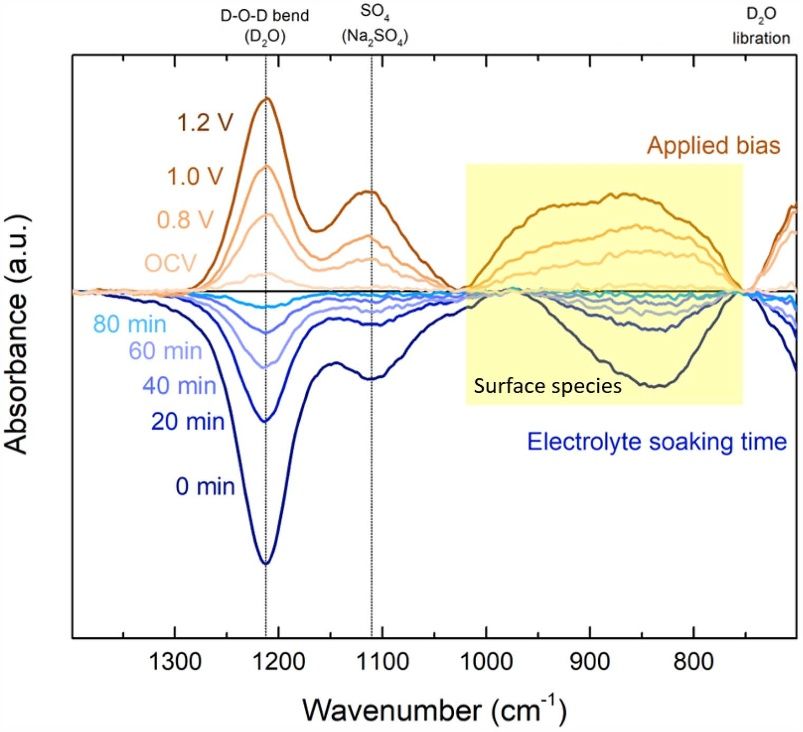
J. Phys. D: Appl. Phys. 54 (2021) 133001                                                                                     Topical Review

energy carriers. Among electrochemical applications, photo-              guaranteed whether the potential is frozen in by this method
electrochemical (PEC) water splitting is of particular interest,         and whether the ultra-thin film is stable during the entire
since it converts solar energy directly into a fuel that can be          measurement.
stored [3].                                                                  Another frequently used technique in the field is transi-
    PEC is known to suffer from low efficiency and degradation           ent absorption spectroscopy which studies the charge car-
of the performance. The main reason for this is that the limit-          rier dynamics by a pump-probe method. Various detectors
ing processes at the electrochemical interface—the heart of a            can measure different time scales so that the processes tak-
PEC device—are not identified so far because of the complex-             ing place at the interface can be identified. In [12], it was
ity of the PEC interface and a lack of methodology [4–6]. Both           found for example that the processes of electron extraction and
these shortcomings are related to the fact that the PEC inter-           electron–hole recombination at a hematite–electrolyte inter-
face is a solid–liquid interface with many species and reac-             face are completed within roughly 20 ms, while water oxida-
tions taking place during operation. It is difficult to charac-          tion is observed to occur on a timescale of hundreds of mil-
terize solid–liquid interfaces during operation, since typical           liseconds to seconds. Since the timescale of water oxidation
surface characterization tools, such as x-ray based methods              was found to be independent of the concentration of photo-
or microscopy, work usually under low pressure or even at                generated holes, it was concluded that the mechanism of water
vacuum. Hence, these methods are optimized to characterize               oxidation on hematite takes place via a sequence of single-hole
the solid–gas interface. They are usually not used to character-         oxidation steps [12]. In contrast to this study, Mesa et al [13]
ize the solid–liquid interface which is at atmospheric pressure          suggested recently a reaction mechanism that is third order in
and consists of a liquid phase. In addition, direct measurement          surface-hole density for hematite. They used a light induced
methods which can measure the species during operation and               spectro-electrochemical setup that simultaneously measures
allow to conclude about the reaction mechanism taking place              the photo-induced absorption and the transient photocurrent.
at the interface are sparse. Therefore, the research usually             The proposed mechanism involves equilibration between three
relies on indirect measurement methods where physical quant-             surface holes and M(OH)–O–M(OH) sites.
ities, such as the current in current–voltage measurements                   Another promising method to measure chemical species is
or the impedance in electrochemical impedance spectroscopy               vibrational spectroscopy. A good review on operando vibra-
(EIS), are measured and the data is related and interpreted              tional spectroscopy dedicated to CO2 conversion is given by
with a chemical or electrochemical model. Series of measure-             Heidary et al [14]. Main methods using vibrational spec-
ments are typically carried out in order to extract mechanistic          troscopy are Raman and Fourier-transform infrared (FTIR)
information and to confirm assumed models. Such analyses                 spectroscopy. For surface analysis, attenuated total reflection
lack the direct relation between the measured physical quant-            (ATR) FTIR spectroscopy, usually named ATR-FTIR spec-
ities (e.g. current, voltage) and the chemical quantities (e.g.          troscopy, is most common and allows for measuring of sur-
rate constants, surface species) that characterize the reaction          face species [15]. Since IR radiation is strongly absorbed by
mechanism.                                                               water, the confinement of the measurement to the vicinity of
    In addition, the species and intermediates to be measured            the surface in ATR-FTIR spectroscopy is of particular interest
in order to identify the reaction mechanism are often compon-            because the signal strength of the bulk liquid phase is reduced
ents of hydrogen and oxygen. This is not only the case in PEC,           in relation to the signal strength of the surface species and
but similarly in electrolyzer or fuel cell experiments. Such spe-        intermediates; therefore, the solid–liquid interface can be char-
cies are in general difficult to measure. In addition, a variety         acterized. ATR-FTIR measurements were carried out at the
of atomic combinations are possible and all have rather sim-             interface of an aqueous solution and different metal oxide sur-
ilar molecular weight so that differentiation between the spe-           faces, such as TiO2 [14, 16, 17], Co3 O4 [18] and IrO2 [19].
cies is difficult. Furthermore, the species often exist for very         Metal oxo, oxyl, hydroxo, peroxo, and superoxo species and
short times or are of intermediate nature. Therefore, very short         intermediates have been identified and their role in the cata-
timescales are required for measurements to identify species             lytic cycles has been established for different systems. It was
and intermediates.                                                       found that the intermediates bond to different catalytic sites.
    In the literature, several paths have been followed in recent            Such in situ ATR-FTIR measurements give a good over-
years in order to identify the reaction mechanism at PEC inter-          view about the surface species under steady state condition.
faces under operation. Most techniques rely on spectroscopy.             However, surface species might change and intermediate spe-
A recent overview about experimental techniques is given by              cies might develop during operation. A well-accepted reac-
Yang et al [5]. A noteworthy technique is operando- x-ray                tion mechanism for oxygen evolution reaction (OER) at metal
photoelectron spectroscopy (XPS) [7–11]. ‘Operando’ (from                oxide photoanodes from Rossmeisl et al [20] reports for
Latin, meaning ‘by operating’) denotes that measurements are             example the formation of several intermediates. The mechan-
carried out while the cell to be investigated is set to differ-          ism is believed to exist of four deprotonation steps with OH,
ent operating points. In operando XPS, a PEC cell is set to a            O, and OOH as intermediate species. This mechanism has so
certain potential and pulled out of the electrolyte while apply-         far not been experimentally confirmed. ATR-FTIR measure-
ing a potential. The surface is characterized by XPS, while              ments under operation of a PEC would be required, i.e. oper-
still a thin layer of electrolyte is sticking on the electrode and       ando ATR-FTIR measurements; hence, ATR-FTIR measure-
potential is applied. This method allows for identifying the             ments are carried out while the PEC cell is set to different
nature and the oxidation states of the surface atoms. It is not          operating points and operated under different current–voltage

                                                                     2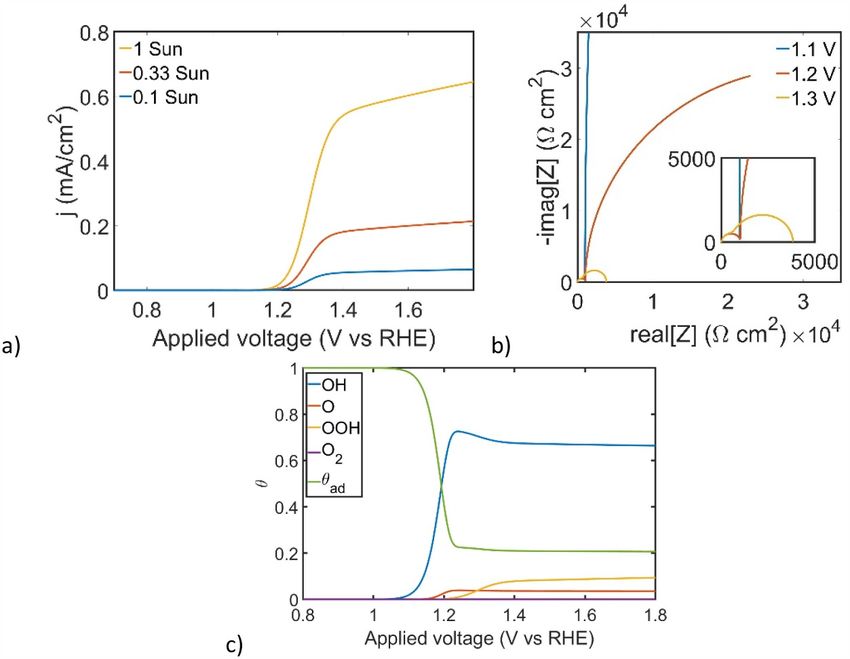
J. Phys. D: Appl. Phys. 54 (2021) 133001                                                                                                    Topical Review

                                                                                      the crystal at the opposite site of the crystal where the beam
     electrolyte                                                                      entered the crystal, and its signature is analyzed in an FTIR
       sample                                                evanescent wave          spectrometer. The data is in the first instance analyzed by fit-
                                                                                      ting and comparing peak positions to the literature.
     ATR crystal                                                                         The ATR-FTIR method as described above is a steady
   polarizer                                                                          state technique. It is used for a wide range of chemical
                          IR beam                                                     (e.g. [23, 30–32]), biological (e.g. [26, 33–35]), and phar-
                                                              IR detector
IR source                                                                             macological (e.g. [36]) applications as well as for coatings
                                                                                      and microfluidics (e.g. [37, 38]) in general. In the field of
                                                                                      electrochemistry, it is important to investigate the IR signa-
                                                                                      ture during operation of a cell, i.e. while a potential is applied.
       Figure 1. General principle of ATR-FTIR spectroscopy.
                                                                                      The reason is that the species which are measured by FTIR
                                                                                      spectroscopy, change when a potential is applied: new spe-
conditions. Zandi et al [21] and Zhang et al [22] carried out the                     cies, so-called intermediate species, can form. These interme-
first pioneering work in this direction in the field of water oxid-                   diate species are formed for limited time only and they are very
ation; Firet et al [23] studied the CO2 electroreduction over Ag                      reactive. Measuring the intermediate species allows identify-
films via operando FTIR spectroscopy.                                                 ing the mechanism that takes place at the interface.
    In the main part of the paper will focus on opportunities,
challenges, recent results, as well as future perspectives of                         2.2. Measurement set-up
operando ATR-FTIR spectroscopy.
                                                                                      For operando ATR-FIT measurements, two types of set-ups
                                                                                      are possible (figure 2). In figure 2(a), the ATR-FTIR crys-
2. Operando ATR-FTIR for water splitting                                              tal and the surface to be measured consist of two pieces; the
                                                                                      sample surface is pressed with the active surface onto the ATR-
2.1. Measurement principle                                                            FTIR crystal (usually a ZnSe crystal). This set-up is called in
ATR-FTIR spectroscopy is a sampling technique based on an                             the following a ‘separated set-up’. It was used in the first pub-
ATR crystal and infrared spectroscopy [24] (figure 1). A beam                         lications on operando ATR-FTIR studies of PEC cells by [21]
of infrared light is passed through an ATR crystal in such a                          and [22]. In figure 2(b), the surface to be measured is deposited
way that the beam is reflected at the surface between crys-                           on top of the ATR-FTIR crystal. The set-up is called in the fol-
tal and adjacent medium. Different materials can be used as                           lowing an ‘integrated set-up’. Both set-ups have their advant-
ATR crystals as summarized in [15]. Main properties to select                         ages and disadvantages with respect to design, processing, and
a specific ATR crystal material are the wavelength cutoff and                         mounting of the sample, as well as accuracy, stability, and
the refractive index of the crystal as well as its chemical stabil-                   reproducibility of the measurement. Also, the running costs
ity in different pH range [15, 25]. If the crystal is made of an                      are different. In table 1, the advantages and disadvantages of
optical material with a higher refractive index than the adja-                        both set-ups are summarized; under the section ‘challenges’
cent medium, an evanescent wave is formed. The evanescent                             we discuss some of these points in more detail.
wave extends into the adjacent medium and interacts with the
species at the surface and in the bulk. The light penetration                         2.3. State-of-the-art
depth, dp , into the sample (i.e. the distance where the strength
of the electric field decays to e−1 ) is given by equation (1)                        Only very few studies have been published on operando ATR-
[26, 27].                                                                             FTIR spectroscopy in the field of water splitting so far. In
                                                                                      specific, two studies were published on the hematite (Fe2 O3 )
                                                                                      photoanode–electrolyte system. Both studies used a separated
                                           λ                                          set-up as shown in figure 2(a).
                   dp =         (              ( )2 )0.5 ,                  (1)
                                                                                          The most seminal study is from Zandi et al [21] where the
                          2πn1 sin2 θ −         n2
                                                n1                                    water-oxidation reaction was studied in 0.2 M KCl (pH = 7).
                                                                                      A potential- and light-dependent absorption peak was found at
where λ is the wavelength of the light, n1 and n2 are the indices                     898 cm−1 and was assigned to a FeIV =O group. The assign-
of refraction of the ATR crystal and the medium to be probed,                         ment is based on a combined analysis of ATR-FTIR, PEC, and
and θ is the angle of incidence. The penetration depth is typ-                        EIS measurements including usage of hole scavengers and iso-
ically between 0.5 µm and 2 µm [26]. However, it should be                            topically labeled water, as well as comparison with density
noted that the light penetrates beyond the penetration depth                          functional theory (DFT) calculations [39]. Definitive identi-
and the value of dp . Hence, the information that is collected                        fication of the rate-determining step is not possible from these
from the sample can come from a depth that is 2–3 times dp                            steady state measurements alone. Time resolved measurement
[28, 29]. The number of reflections is determined by the length                       would be required and are an exciting potential future develop-
of the ATR crystal and the angle of incidence. The signal-to-                         ment according to Cowan [40]. Such measurements are likely
noise ratio depends on the number of reflections as well as on                        to lead to the observation of more intermediate species and to
the total length of the optical light path. The IR beam leaves                        the determination of the nature of the rate-determining step.

                                                                                  3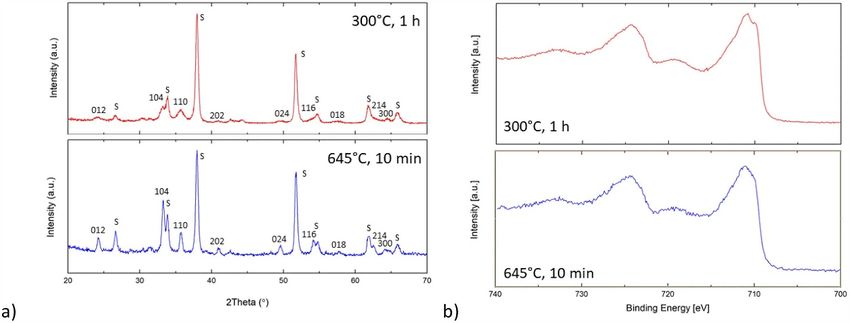
J. Phys. D: Appl. Phys. 54 (2021) 133001                                                                                       Topical Review

Figure 2. Set-ups for operando ATR-FTIR measurements: (a) separated set-up, (b) integrated set-up. The following abbreviations are used
in the sketches: WE—working electrode, CE—counter electrode, RE—reference electrode, A—amperemeter, V–voltmeter.

Table 1. Summary of advantages and disadvantages of a separated         3. Opportunities
and an integrated ATR-FTIR sample set-up.
                                           Separated   Integrated       3.1. Identifying species and reaction mechanisms
Criteria                                    set-up       set-up
                                                                        In ATR-FTIR measurements, the wavenumber which is ele-
                   Design                     o            o            ment and compound specific, is measured over a large range.
Sample             Processing                 +            −            The measured spectra can be fitted to literature data and the
                   Mounting                   −            +            analysis of the peak positions allows for determining the spe-
                                                                        cies which are present during the measurement. Alternatively,
                   Accuracy                   −            +            standard compounds are measured and the sample data is com-
Measurement        Stability                  −            +            pared to the standard. If by any of these methods the surface
                   Reproducibility            −            +
                                                                        species and the intermediate species are known in a system, the
Others             Costs                      +            −
                                                                        reaction mechanism can be identified. Currently, already for
                                                                        simple interfaces, such as the hematite-electrolyte interface,
                                                                        the reaction mechanism taking place at the interface during
                                                                        operation is not unambiguously identified and different reac-
    The second important operando ATR-FTIR study on hem-                tion mechanisms are discussed in the literature [12, 21, 22, 41].
atite was carried out by Zhang et al [22]. pH values between            Unambiguously identifying the species and the reaction mech-
8 and 13.6 were used and adjusted by different electrolytes             anism would be a significant step in identifying the limitations
consisting of 0.5 M NaClO4 as well as mixtures of NaOD and              at these interfaces.
D2 SO4 . The ATR-FTIR study was combined with the determ-
ination of the reaction order. In the near-neutral pH region, a
                                                                        3.2. Linking the chemistry at the interface with the
unity rate law in combination with a surface superoxide spe-
                                                                        electrochemical performance
cies that was bonded via hydrogen to the adjacent hydroxyl
group, was observed. Hence, a water nucleophilic attack of –            Currently, the limitations at electrochemical interfaces are
Fe=O to form an O–O bond was proposed. In highly alkaline               measured through electrochemical measurements where the
regions, the coupling of adjacent surface trapped holes on the –        performance is measured in form of current–voltage curves or
Fe=O species was suggested and related with a reaction order            EIS spectra. The current or the impedance is a measure for the
of 2.                                                                   performance and the limitations at the interface. However, the
    Both studies were carried out in different electrolytes.            output data, such as the current density or the polarization res-
Broad adsorption peaks were found and the spectra are                   istance, is not directly related to the (electro-)chemical charac-
rather noisy which can be related to overlapping features               teristic, i.e. the species or the rate constants. In particular, the
and/or to low sensitivity. The reproducibility as well as               state-of-the-art method of fitting equivalent circuit models to
long term stability of the measurements were not repor-                 the EIS data results in capacitance and resistance values which
ted. Hence, these measurements are considered as very                   are physical quantities and are not related to the chemical char-
promising first steps in identifying the reaction mech-                 acteristics. Here, ATR-FTIR spectroscopy can fill the gap: By
anism at hematite–electrolyte interfaces. However, more                 measuring the surface species and the intermediates during
detailed investigation is required in order to fully ana-               operation and at different operating conditions, a proven elec-
lyze the mechanism. Main reason for the still rather pre-               trochemical model can be derived. This can be used as input
liminary data is believed to be related to complex exper-               for simulations, such as density functional theory calculations,
imental measurements (see challenges with measurement                   which are carried out to determine potential determining step
set-up below).                                                          in water splitting, such as done for example in [20, 42]. In

                                                                    4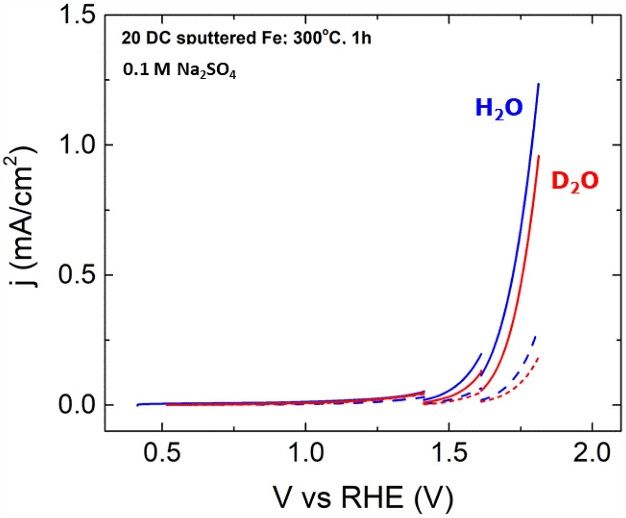
J. Phys. D: Appl. Phys. 54 (2021) 133001                                                                                   Topical Review

this way, the chemistry at the interface and the electrochem-         4. Challenges
ical performance are directly linked. This allows for determ-
ining the limitations at the interface and, in consequence,           4.1. The measurement set-up
for designing tailored interfaces with significantly higher
                                                                      As shown in figure 2, two ways exist to set-up operando ATR-
performance.
                                                                      FTIR measurements for water splitting, i.e. the separated and
                                                                      the integrated way. These two ways to set-up ATR-FTIR meas-
                                                                      urements differ with respect to the mounting of the sample and
3.3. Creating input data for microkinetic modeling and                the measurement compartment regarding size, electrical con-
validating models
                                                                      tacting, electrochemical configuration, and illumination. Each
Microkinetic modeling allows simulating electrochemical               set-up has its own challenges; measurement reproducibility is
data directly from an electrochemical model, i.e. from the            different.
reactions that take place at the interface. Hence, the same               Regarding electrical contacting, it is necessary in operando
data that is measured in experimental, electrochemical meas-          ATR-FTIR measurements to realize an electrical contact on
urements, i.e. current–voltage curves or EIS spectra, can be          the electrode material in order to apply a bias. This electrical
simulated by microkinetic modeling. Direct comparison of              contact has to be spread over the entire area of the electrode,
experiment and simulation is possible and equivalent circuit          since typical electrode materials for water splitting are not suf-
fitting is not needed. Due to these possibilities, microkin-          ficiently electronically conducting to guarantee a good and
etic modeling has recently drawn attention in the fields of           homogeneous current distribution with contacting at one side
water splitting [43–49] and fuel cells [50–56]. One main dif-         only. In addition, space has to be realized in the measurement
ficulty in microkinetic modeling is that a reaction mechan-           compartment for the electrical contact itself. Considering a
ism needs to be assumed and several input parameters for              liquid electrolyte in contact with the electrode material which
the simulations are not well known, such as the surface and           is often highly basic, the electrical contact needs to be isol-
intermediate species or the rate constants for the reactions.         ated from the electrolyte solution. This demands for tight, non-
Currently, the required input data are estimated from the lit-        porous materials adjacent to the electrical contacting layer.
erature or by fitting a model to experimental data. Operando              Regarding the electrochemical configuration, one needs to
ATR-FTIR spectroscopy offers an excellent opportunity to              be reminded that electrochemical measurements are usually
fill this gap by its ability to directly measure surface spe-         carried out in three-point configuration. Hence, the set-up con-
cies and intermediates. The electrochemical model for the             sists of a working electrode (WE) which is the surface to be
microkinetic modeling can then be derived and input para-             analyzed, a counter electrode (CE) which is often a Pt wire or
meters, such as surface species and intermediates, can be             mesh, and the reference electrode (RE) which is in most cases
determined. If ATR-FTIR results can be quantified, even the           a commercial Ag/AgCl glass electrode. Typical RE are rather
concentrations of the species can be obtained. The most real-         large in diameter; typical diameters are about 1 cm. The dia-
istic input for the modeling is provided and models can be            meters of microelectrodes are much smaller, but still in the
validated. After establishing the modeling for one mater-             mm range. RE are usually inserted several centimeters into
ial, the model can be transferred to other materials systems          the electrolyte solution. In the separated measurement set-up
and allows for fast and inexpensive materials and parameter           (figure 2(a)), however, the amount of electrolyte is limited and
screening.                                                            as few electrolyte as possible is used in order to avoid absorp-
                                                                      tion of the IR beam in the electrolyte (50 µl is used for example
                                                                      in [21]). If the electrolyte depth is in the micrometer to mil-
3.4. Realizing fast and flexible data collection                      limeter range, it is obvious that placing the RE in the elec-
                                                                      trolyte and receiving good immersion of the RE at the same
Operando ATR-FTIR analyses consist of the combination of              time is a big challenge. Small amounts of electrolyte can be
two lab-scale measurement set-ups: an ATR-FTIR spectro-               well applied in the measurement compartment using calibrated
meter and an electrochemical measurement station. The entire          pipets. However, guaranteeing a continuous and homogeneous
set-up is rather small (lab-scale) and inexpensive. These con-        film of electrolyte covering the sample surface is challenging.
ditions allow for a lot of flexibility. For example, systematic       In particular for hydrophobic surfaces, un-wetted areas are dif-
studies over longer times can be carried out. Different mater-        ficult to be avoided. Usually, a force is used to guarantee a
ials and processing conditions can be investigated. The sur-          homogenous thin layer of electrolyte which is fully in con-
face to be analyzed can be treated between measurements in            tact with the surface to be analyzed [21]; the force needs to be
order to investigate small changes in the surface and mater-          applied homogenously and sample breaking has to be avoided.
ials properties on the formation of surface species and inter-        In addition, also with very small volume of electrolyte, it is not
mediates and the reaction mechanism. In addition, sensitive           clear in the case of the separated set-up whether the IR signal
sample conditions and time sensitive measurements can be              reaches through the depth of the electrolyte to the surface of
realized and carried out due to large flexibility and lab scale       the sample considering a typical light penetration depth in the
environment.                                                          micrometer scale.

                                                                  5
J. Phys. D: Appl. Phys. 54 (2021) 133001 Topical Review
Regarding illumination, extra enclosures need to be acidic conditions [15]. Second, the electrolyte should ideally
designed in order to apply the light while guaranteeing IR radi- not absorb IR radiation in the region where features form the
ation being confined in the set-up. In addition, the illumination surface species are expected in order to avoid additional IR
has to be guaranteed to reach the foreseen intensity at the sur- signature from the electrolyte. This is a difficult requirement,
face of the sample. This might be difficult from geometrical since PEC cells are usually measured in a watery solution and
consideration depending on how the sample is positioned in water is strongly absorbing IR radiation. The usage of D2 O
the set-up and how much the light path might be interrupted instead of H2 O is a possible solution [21, 22], since D2 O is
or blocked. much less absorbing IR in the region where surface species
These challenges indicate that the design of the measure- are expected, i.e. between about 700 and 1000 cm−1 [57].
ment set-up is a crucial ingredient in guaranteeing reprodu-
cible and stable operando ATR-FTIR measurements.
4.3. Data acquisition and analysis
4.2. Sample design and materials system Data acquisition and analysis can be difficult when the
signal-to-noise ratio of the measurement is low. Small ATR
Several challenges arise in relation with the sample design and
crystals have only few reflections and therefore rather low
the materials system. In the separated measurement set-up, the
sensitivity. Increasing the size of the ATR crystal can solve this
same samples as in typical PEC measurements can be used.
issue, however, sample preparation and contacting becomes
Hence, the typical sample consists of a piece of glass covered
more challenging: First, deposition of high quality metal
with an electrical conducting FTO (F doped SnO2 ) layer. The
oxide thin films over large areas (several cm range) is chal-
photoanode material is deposited onto the FTO. In order to
lenging. Second, homogeneous contact of the surface to be
insert the CE and the RE electrodes, holes are usually drilled
analyzed with the electrolyte is difficult to be realized with
through the sample [21].
little volume of electrolyte in the case of the separated set-up
In the integrated set-up, a different sample design is
(figure 2(a)). Third, good electrical contact and current extrac-
required. Since the ATR crystal is very smooth (surface rough-
tion over the entire area of the surface of interest is chal-
ness < 2 nm), adhesion of the functional thin film is difficult
lenging in case of insulating or semiconducting metal oxide
to achieve. An adhesion layer is used. This adhesion layer
thin films.
has to be designed to be IR transparent, since the IR beam
In addition, data analysis is hampered in case of over-
needs to transmit this layer. In addition to this adhesion layer,
lapping peaks of different surface species and intermediates.
an electrical conducting layer has to be added for electric-
All expected surface species are combinations of oxygen and
ally contacting the electrode and in order to apply a bias. The
hydrogen and the signatures of the different species are IR
electrical conducting layer has to have good electrical conduct-
responsive in similar wavelength ranges. Hence, advanced fit-
ivity (sheet resistance < 15 Ω cm−2 ), needs to be IR transpar-
ting procedures and high resolution measurements with high
ent, and well-adhering to the adhesion layer without interface
signal-to-noise ratio are a paramount requirement. Also, the
reactions. The most challenging requirement for the sample
species in the electrolyte might interfere and overlap, since the
design is related to the fact that the most feasible ATR crystal
IR beam is also penetrating the electrolyte even with surface
material for this application, i.e. ZnSe which is stable in the
sensitive ATR-FTIR measurements.
required pH range and has a long wavelength cutoff of about
525 cm−1 [15], is prone to high temperature, i.e. temperatures
higher than 300 ◦ C. This requires low temperature processing
4.4. Stability of the samples
of the electrical conducting layer. The typical transparent con-
ducting oxide layer for PEC application, i.e. FTO, is therefore The stability of the entire sample has to be guaranteed under
not an option. all operating conditions and over the entire measurement
Similar criteria are valid for the electrode material: low time. Measurement times can be rather long, since operando
temperature processing of the electrode materials is a pre- ATR-FTIR measurements are carried out in small intervals
requisite as well as no interface formation or interdiffusion of applied potential and include two types of measurement,
are allowed with the electrical conducting layer. Since in PEC i.e. IR measurements and electrochemical characterization.
often metal oxide electrodes are investigated and metal oxides Longer measurement times result in general in higher resol-
are usually processed at temperatures higher than 500 ◦ C, such ution. Hence, due to the number of measurements and the res-
requirements are not trivial to fulfill. The same morphology olution, total measurement times of one sample of several days
and materials properties of electrodes deposited on an ATR are possible.
crystal substrate compared to standard FTO-glass samples are It is self-evident that the surface to be analyzed has to be
required as well. stable over time. However, sample stability means also that the
Next to the sample design and its materials system, the elec- electrolyte is not soaking into the electrode and getting in con-
trolyte has several requirements independent of the type of tact with the ATR crystal over time or attacking the electrical
measurement set-up. First, the electrolyte should not come in contact layer. Small pores in the layer of interest might lead to
contact with the ATR crystal because of the danger of degrada- electrolyte soaking and can thus lead to instability. High qual-
tion. Note that most ATR crystals do not withstand alkaline or ity, pore-free thin films are a prerequisite.
6J. Phys. D: Appl. Phys. 54 (2021) 133001 Topical Review
Figure 3. Sample design for operando ATR-FTIR measurements of water oxidation in an integrated measurement set-up as shown in
figure 2(b).
Figure 4. Low temperature processing of hematite thin films (300 ◦ C, 1 h, red curves) in comparison to standard processing (645 ◦ C,
10 min, blue curves): (a) x-ray diffraction (XRD) data (the numbers indicate the peak positions of α-Fe2 O3 according to ICDD catalogue
number: 33-064; S denotes substrate peaks); (b) XPS data. The iron oxide thin films are deposited on FTO glass substrates. The data from
standard processing, i.e. the blue curves, is the same as published in [58].
5. Recent results and future perspectives adhesion layer by sputtering. Then, a 50 nm thick Au layer
was deposited on top of the Ta thin films by sputtering. The
5.1. Developing operando ATR-FTIR spectroscopy as a Au layer acts as IR transparent electrical contacting layer. The
routine characterization method for water splitting functional layer was made from a sputtered, 20 nm thick Fe
All state-of-the-art studies in the literature were carried out in thin film which was annealed at 300 ◦ C for 1 h. X-ray dif-
a so-called separated set-up as discussed in figure 2(a). Due to fraction (XRD) and XPS analyses evidenced that crystalline
shortcomings with this type of set-up regarding to mounting iron oxide thin films of hematite were obtained (figure 4). The
of the sample, accuracy, and reproducibility of the measure- similarity of the XRD and XPS results of low temperature
ment, we recently designed an alternative set-up, namely the annealing (red curves) and standard annealing at 645 ◦ C for
integrated set-up (figure 2(b)). One main difference is that the 10 min (blue curves) proves that low temperature processing
surface to be analyzed is directly integrated on the ATR crys- of hematite thin films is a feasible route to obtain hematite.
tal. This set-up design has strong impact on the sample design The materials selection, their function in the sample, as well
as already mentioned in the previous chapters. as the requirements for achieving stable and high performing
In a recent effort, we have designed a sample architec- measurements are summarized in figure 3.
ture for measuring operando ATR-FTIR data using an integ- For the operando measurements, a custom-made compart-
rated set-up (figure 2(b)). The sample is designed as follows ment was built in-house. It was made from black Teflon
(figure 3): The ZnSe ATR crystal (72 mm × 10 mm × 6 mm, in order to avoid any light reflection and it was fitted to
45◦ beveled edge) was first coated with a ~2 nm thick Ta the overhead ATR unit accessory. The ZnSe ATR crystal is
7J. Phys. D: Appl. Phys. 54 (2021) 133001 Topical Review
Figure 5. Current–voltage curves of hematite (40 nm)/Ag
(50 nm)/Ta (2 nm)/ATR crystal in 0.1 M Na2 SO4 in H2 O (blue) and
D2 O (red) solution for dark (dashed line) and illuminated
(continuous line) conditions, respectively. The discontinuities in the
curves arise from measurements at fixed potential.
Figure 6. ATR-FTIR spectrum of hematite (40 nm)/Ag (50 nm)/Ta
mounted from the bottom. A Kalrez O-ring ensures that the (2 nm)/ATR crystal in 0.1 M Na2 SO4 with D2 O under applied bias
and as a function of electrolyte soaking time.
cell is leak tight and it defines the electrode area as 3.07 cm2 .
The electrolyte reservoir has a volume of 6.45 cm3 . The top
of the cell is open, which allows illumination of the sample
and access for CE and RE. Operando electrochemical meas- V applied = 0 V) (blue color); on the positive y direction, vari-
urements were performed using a SP-150 potentiostat from ations in applied potential (0 V−1.2 V vs. RHE) are plotted.
Biologic using a Pt wire CE and a leak-free Ag/AgCl micro- All spectra are normalized to a soaking time of 100 min. Soak-
RE (Warner Instruments). The experiments were performed in ing time refers to the time that the sample is mounted in the
0.1 M Na2 SO4 in H2 O and D2 O (99.9%, Sigma Aldrich). D2 O compartment and the electrolyte can penetrate into the func-
was used instead of H2 O in order to avoid overlap of features tional thin film. The data on the negative y axis shows that the
in the absorption spectra from surface species and from D2 O IR absorbance decreases as a function of soaking time over
libration [43] (see ‘sample design and materials system’). A the entire wavelength range. Shortly after starting the meas-
455 nm LED with an output power of ~1000 mW was used urement (0 min to 40 min), the difference in IR absorbance
as light source. This is an ideal wavelength to stimulate oxy- between consecutive measurements is rather strong, whereas
gen evolution reaction at a hematite surface (bandgap around the difference becomes small after about 60 min. We related
2.1 eV) even with losses due to overpotential. these effects to electrolyte diffusing into the microstructure of
Figure 5 shows the current–voltage curves in H2 O (blue) the functional layer due to porosity. This diffusion of elec-
and D2 O (red) for dark (dashed line) and illuminated (con- trolyte into the hematite increases the amount of electrolyte
tinuous line) conditions, respectively. Comparing the dark and that is measured and, therefore, in normalized representa-
the illuminated condition shows that the hematite layer is pho- tion to longest soaking time, the absorbance is decreasing.
toactive both in H2 O as well as in D2 O. This is an important A good compromise between stable measurement conditions
observation regarding the fact that the hematite thin films were and reasonable measurement times is realized by using a soak-
annealed at a temperature of 300 ◦ C only. The onset potential ing time of 100 min. For further studies, it is advised to fab-
under illumination is around 1.3 V vs. RHE (reversible hydro- ricate functional layers with as low porosity as possible so
gen electrode). The discontinuities in the curves arise from that soaking and equilibration time can be minimized. Pores
measurements at constant potential for 30 min. Only small in the functional layer can be avoided by changing the thin
discontinuities are found which indicates that the samples are film deposition process. Quantitative analyses of all individual
stable over time. contributions to the IR data is recommended then with these
The ATR-FTIR measurements were performed using a measurements.
Bruker Vertex 70 FTIR spectrometer equipped with an over- In all spectra, four main features are identified: a rather
head ATR unit (A537) and a liquid nitrogen cooled MCT narrow peak around 1200 cm−1 which is related to D–O–
detector. The IR spectra were recorded at 4 cm−1 resolution D bending [59]. A peak around 1100 cm−1 which is related
in a spectral range from 3900 cm−1 to 600 cm−1 . Steady-state to SO4 2− species in the electrolyte [60]. A broad peak at
spectra are averaged over 500 scans. wavenumber values between 1000 cm−1 and 750 cm−1 which
ATR spectra measured in the integrated set-up are shown is attributed to adsorbed surface species [21, 22]. And finally, a
in figure 6. On the negative y axis, the ATR-FTIR spectra feature below 750 cm−1 which is attributed to libration of D2 O
are plotted as a function of soaking time (0 min to 80 min; [29, 61, 62].
8J. Phys. D: Appl. Phys. 54 (2021) 133001 Topical Review
Focusing now on the ATR-FTIR spectra as a function of 5.2. Identifying the reaction mechanism at electrochemical
applied bias (shown on the positive y axis), one finds an interfaces in combination with microkinetic modeling
increase in absorbance with an increase in applied bias in the
entire wavenumber range. We relate this overall increase in Operando ATR-FTIR measurements allow measuring the
absorbance to near-surface molecules which re-orient under chemical nature of surface species and the intermediates at
an applied potential and therefore result in a stronger signa- the same operating conditions as the electrochemical data is
ture [63]. In the region where surface species are expected, i.e. measured. However, as discussed before the measurements are
between 1000 cm−1 and 750 cm−1 (see yellow shaded area rather challenging and the unambiguous determination of the
in figure 6), a broadening of the feature around 900 cm−1 – species and their concentrations are not always possible due
1000 cm−1 is found. Since this feature does not change in the to overlapping peaks in the ATR-FTIR measurements. Hence,
soaking curves (negative y axis), it is a clear indication that ATR-FTIR measurements are a great tool to advance in identi-
intermediates are produced as a function of applied potential. fying the reaction mechanism at the electrochemical inter-
It should be noted that rather small values for the applied bias face; however, complementation by other techniques might
were used here and—compared to the current–voltage curve be necessary for full identification. We suggest a combination
in figure 5—the applied bias of 1.2 V is just at the begin- with microkinetic modeling.
ning of the onset of photocurrent. This operating condition As mentioned earlier, microkinetic modeling has recently
was used, since the samples have some pores as seen in the evolved as an alternative method to identify the reaction mech-
soaking experiments and there was danger of detachment of anism at electrochemical interfaces [44–52]. In our recent
the thin films at higher potentials. microkinetic modeling studies of the hematite–electrolyte
In the literature, Zandi et al [21] also identified a peak interface [44, 45], the typical model for OER from Ross-
around 898 cm−1 and assigned it to R–FeIV =O. The features meisl et al [20] was assumed, i.e. a model with four consecut-
found by Zhang et al [22] were found around 1096 cm−1 and ive deprotonation steps with the intermediate species OH, O,
attributed it to R–FeIII –O–H–O–O–FeIII –R. This peak is over- and OOH. This electrochemical model was implemented in a
lapping with the peak at 1100 cm−1 in our data which was MATLAB code together with the Gerischer theory for charge
related to SO4 2− species according to the used electrolyte transfer and the charge carrier dynamics within the semicon-
[60] (see above). From this comparison to the literature, we ductor so that the electrochemical behavior at the interface was
cannot unambiguously assign the feature around 900 cm−1 – simulated [45]. Figures 7(a) and (b) show typical, simulated
1000 cm−1 to a specific intermediate species. Detailed fitting current–voltage curves and EIS spectra as a function of illu-
is required as well as more detailed investigation of this fea- mination and applied potential, respectively. A flat band poten-
ture as a function of potential and electrolyte composition for tial of 0.6 V vs. RHE is used in the simulations here. Accord-
example. Compared to the data in [21] and [22], the spectra ing to figure 7(a), the current density increases strongly after
in figure 6 are smoother and more consistent as a function of the onset potential of around 1.2 V vs. RHE (figure 7(a)). The
applied potential. We attribute this to a more stable electrode impedance decreases correspondingly (figure 7(b)), mainly
configuration (RE, CE, WE) in a larger volume of electrolyte based on a strong decrease of the low frequency arc. The low
and is therefore related to the integrated measurement set-up frequency arc is usually attributed to the intermediates at the
that is used for the first time for these kind of measurements interface [64] and the decrease of the impedance can be related
in the current study. to oxygen evolution reaction taking place. This effect is also
The above results illustrate that the integrated measurement seen in figure 7(c) where the coverages of the adsorbed spe-
set-up is a viable alternative to the separated set-up that is usu- cies, OH, O, and OOH, are plotted as a function of potential
ally used in the literature for these kind of measurements. It is together with the coverage of adsorbed O2 and the total sur-
seen that the sample design is a critical and challenging step face coverage. Around the onset potential, the amount of free
for realizing easy and reproducible measurements in the integ- surface sites decreases, while the amount of adsorbed OH is
rated set-up. The measured data is more stable and reprodu- increasing around the onset potential. The coverage of OH
cible compared to the separated set-up. Regarding costs, it is stays high for all applied voltages after the onset potential. This
required to establish a refurbishing process for the ATR crys- indicates that the step where OH is used in the mechanism, i.e.
tals in order to re-use the crystals after one measurement. the O formation step, is limiting here, since OH is not used up.
For the future, it is important to develop an easy to The current density and impedance data simulated from the
use platform for operando ATR-FTIR measurements. At the electrochemical model with input from atomistic calculations
moment, both measurement set-ups have advantages and dis- [42] are comparable to experimental results (refer also to sim-
advantages and need to be developed further in order to ilar simulations in [44, 45]).
develop towards a standard characterization tool for identify- The present intermediate species in the microkinetic mod-
ing surface species and intermediates during operation. This eling come straightforward from the assumed electrochemical
would be very important for daily characterization, mater- model, i.e. the assumed reactions taking place at the interface.
ials scanning, and identification of the reaction mechanism Currently, the reaction mechanism of Rossmeisl et al [20] is
as a function of sample morphology, surface finish, and the most widely accepted reaction mechanism to take place
stoichiometry. at metal oxide electrodes for water splitting. However, all of
9J. Phys. D: Appl. Phys. 54 (2021) 133001 Topical Review
Figure 7. Simulated electrochemical data by microkinetic modeling: (a) current–voltage curves as a function of the illumination, (b)
Nyquist EIS spectra as a function of applied potential, and (c) surface coverages of intermediate species adsorbed on the hematite surface as
a function of applied potential. θ is the fractional ratio of free adsorption sites available, and θi is the fractional coverage of intermediate
species i. The concentration of species O2 (θO2 ) is not visible as the coverage is small compared to the other species. Figures (b) and (c) are
simulated for an illumination of 1 sun.
these intermediate species have still not been confirmed yet. first instance. Materials specific input data, such as rate con-
Therefore, the microkinetic modeling results strongly depend stants, will be estimated from the literature and with the help
on the correctness of this model. ATR-FTIR measurements can of atomistic modeling [42]. Then, the new materials system
prove the surface species and intermediates and by this valid- will be simulated and experiments will be carried out. A step-
ate the model used in microkinetic modeling. wise approach will finally lead to the identification of the new
In contrast, ATR-FTIR measurements can mainly identify materials systems.
the species; it is hard to quantify this data and identify the By identification of more and more materials systems and
mechanism. Here, in turn, microkinetic modeling can step in electrochemical interfaces, it might be possible to find pat-
by investigating different possible mechanisms with the same terns and general rules in properties and features of electro-
intermediate species and simulate electrochemical data. If the chemical interfaces and their reaction mechanisms. This will
data is comparable to experimental data, then the electrochem- allow for designing improved catalysts with tailored proper-
ical model is correct. ties. In addition, a significant set of data will also enable to
Hence, a combination of ATR-FTIR measurements and approach the challenge of identifying the reaction mechan-
microkinetic modeling can allow for fully identifying the reac- isms at electrochemical interfaces from the other side: since
tion mechanism at the interface and for identifying the limiting operando ATR-FTIR measurements are not yet developed to a
process at the electrochemical interface. routine and fast materials characterization tool, small changes
in the materials system, for example, are related with a lot
5.3. Designing catalysts with tailored properties of experimental afford. Microkinetic modeling could be used
here to avoid time consuming series of experiments. Microkin-
When for one system microkinetic modeling and operando etic modeling codes can be developed further to enable to pre-
ATR-FTIR spectroscopy have allowed to determine the reac- dict ATR-FTIR spectra. Then, only some specific experiments
tion mechanism, then other materials systems can be studied would be required in order to control the identification pro-
as well. The same sample platform and sample processing can cedure. ATR-FTIR spectra could be simulated as a function
be used for other materials systems in the ATR-FTIR meas- of stoichiometry, morphology, defects, etc. This will allow
urements. For the microkinetic modeling, the same electro- for scanning for materials, properties, and operating condi-
chemical model and the same MATLAB code will be used in tions as well as their effects on the output data. This will save
10J. Phys. D: Appl. Phys. 54 (2021) 133001 Topical Review
time and costs and will accelerate the identification and design ORCID iDs
of new, high performing catalysts with tailored properties
significantly. A Bieberle-Hütter https://orcid.org/0000-0001-8794-9312
K George https://orcid.org/0000-0003-2242-8190
M C M van de Sanden https://orcid.org/0000-0002-4119-
6. Summary and conclusions 9971
The great potential of operando ATR-FTIR measurements for
the identification of reaction mechanisms was discussed in this
paper. Operando ATR-FTIR spectroscopy allows measuring References
surface species and intermediates during operation, i.e. while
[1] United Nations Framework Convention on Climate Change
a potential is applied and electrochemical data is recorded. 2020: The Paris Agreement (available at:
Hence, information about the species involved in the electro- https://unfccc.int/process-and-meetings/the-paris-
chemical reactions at the interface can be gained and can lead agreement/the-paris-agreement)
to full identification of the reaction mechanism at these elec- [2] Wiebes E 2019 Dutch climate agreement (Den Hague: The
trochemical interfaces. Netherlands) (available at: www.klimaataccord.nl)
[3] van de Krol R and Grätzel M 2012 Photoelectrochemical
Two types of set-ups were discussed as well as opportunit- Hydrogen Production (Berlin: Springer)
ies and challenges of operando ATR-FTIR measurements. We [4] Hu C, Zhang L and Gong J 2019 Energy Environ. Sci.
presented new results with an integrated ATR-FTIR measure- 12 2620–45
ment set-up which has the advantage of high quality, stabil- [5] Yang W, Ramanujam R, Tan J, Tilley S D and Moon J 2019
ity, and reproducibility of the measurement data. Based on Chem. Soc. Rev. 48 4979–5015
[6] Song J, Wei C, Huang Z-F, Liu C, Zen L, Wang Z and Xu Z J
these results, we derive several promising future perspect- 2020 Chem. Soc. Rev. 49 2196–214
ives: (a) development of operando ATR-FTIR spectroscopy [7] Lichterman M F et al 2015 Energy Environ. Sci. 8 2409–16
as a routine and robust measurement method for water split- [8] Lewerenz H et al 2016 Electrochim. Acta 211 711–9
ting, (b) combination of operando ATR-FTIR measurements [9] Stoerzinger K A, Favaro M, Ross P N, Hussain Z, Liu Z,
with microkinetic modeling for model validation and identi- Yano J and Crumlin E J 2018 Top. Catal. 61 2152–60
[10] Favaro M, Drisdell W S, Marcus M A, Gregoire J M,
fication of reaction mechanisms at electrochemical interfaces, Crumlin E J, Haber J A and Yano J 2017 ACS Catal.
(c) designing of tailored catalysts and accelerating catalyst 7 1248–58
development by predicting of spectroscopic data through a [11] Novotny Z et al 2020 Rev. Sci. Instrum. 91 023103
combination of ATR-FTIR measurements and microkinetic [12] Pendlebury S R, Cowan A J, Barroso M, Sivula K, Ye J,
modeling. Grätzel M, Klug D R, Tang J and Durrant J R 2012 Energy
Environ. Sci. 5 6304–12
In conclusion, we can state that operando ATR-FTIR meas- [13] Mesa C A et al 2020 Nat. Chem. 12 82–89
urements offer high potential to bring the field of solid–liquid [14] Heidary N, Ly K H and Kornienko N 2019 Nano Lett.
electrochemical interfaces a significant step forward. In partic- 19 4817–26
ular, this technique can enable to identify the reaction mech- [15] Mudunkotuwa I A, Minshid A A and Grassian V H 2014
anism at such interfaces. This was shown with the example Analyst 139 870.14
[16] Nakamura R, Imanishi A, Murakoshi K and Nakato Y 2003 J.
of PEC water splitting. However, the ATR-FTIR approach Am. Chem. Soc. 125 7443–50
itself as well as ATR-FTIR spectroscopy in combination with [17] Nakamura R and Nakato R 2004 J. Am. Chem. Soc.
microkinetic modeling, is generic and can be used for other 126 1290–8
systems as well. [18] Zhang M, de Respinis M and Frei H 2014 Nat. Chem. 6 362–7
[19] Sivasankar N, Weare W W and Frei H 2011 J. Am. Chem. Soc.
133 12976–9
[20] Rossmeisl J, Qu Z-W, Zhu H, Kroes G-J and Norskov J K
Acknowledgments 2007 J. Electroanal. Chem. 607 83–89
[21] Zandi O and Hamann T W 2016 Nat. Chem. 8 778–83
Dr A Bronneberg thanks funding in the frame of the Marie [22] Zhang Y, Zhang H, Liu A, Chen C, Song W and Zhao J 2018
J. Am. Chem. Soc. 140 3264–9
Skłodowska-Curie action of H2020 (project ‘IRS-PEC’ no. [23] Firet N J and Smith W A 2017 ACS Catal. 7 606–12
708874). Dr A Bieberle-Hütter and Professor MCM van de [24] Ramer G and Lendl B 2013 Encyclopedia of Analytical
Sanden acknowledge funding from NWO (FOM program nr. Chemistry: Attenuated Total Reflection Fourier Transform
147 ‘CO2 neutral fuels’). In addition, Dr A Bieberle-Hütter Infrared Spectroscopy (New York: Wiley)
and K George acknowledge funding from the Shell- [25] Hind A R and Bhargava S K 2001 Adv. Colloid Interface Sci.
93 91
NWO/FOM ‘Computational Sciences for Energy Research’ [26] Kazarian S G and Chan K L A 2013 Analyst 138 1940–51
PhD program (CSER-PhD; no. i32; project no. 15CSER021) [27] Mirabella F M Jr. 1993 Internal Reflection Spectroscopy:
and from M-ERA.NET (project ‘MuMo4PEC’ no. 4089). Theory and Applications (Practical Spectroscopy Series)
Dr E Zoethout, DIFFER, is thanked for experimental support (New York: Marcel Dekker) pp 17–52
in materials characterization. Dr R Sinha, Dr M van Berkel, [28] Mirabella F M 1983 J. Polym. Sci. Polym. Phys. Ed.
21 2403–17
Dr Q Ong, and Dr E Langereis, DIFFER, as well as [29] Chan K L A and Kazarian S G 2007 Appl. Spectrosc. 61 48–54
Dr R Lavrijsen, TU/e, are thanked for stimulating and fruitful [30] Lewiner F, Klein J P, Puel F and Févotte G 2001 Chem. Eng.
discussions. Sci. 56 2069–84
11J. Phys. D: Appl. Phys. 54 (2021) 133001 Topical Review
[31] Agarwal S, Takano A, van de Sanden M C M, Maroudas D and [48] Exner K S, Sohrabnejad-Eskan I and Over H 2018 ACS Catal.
Aydil E S 2002 J. Chem. Phys. 117 10805 8 1864–79
[32] Leewis C M, Kessels W M M, van de Sanden M C M and [49] Garcia-Osorio D A, Jaimes R, Vazquez-Arenas J, Lara R H
Niemantsverdriet J W 2006 J. Vac. Sci. Technol. A 24 296 and Alvarez-Ramirez J 2017 J. Electrochem. Soc.
[33] Tiernan H, Byrne B and Kazarian S G 2020 Spectrochim. Acta 164 E3321–28
A 241 118636 [50] Mitterdorfer A and Gauckler L J 1999 Solid State Ion.
[34] Naseer K, Ali A and Qazi J 2020 Appl. Spectrosc. Rev. 117 203–17
(https://doi.org/10.1080/05704928.2020.1738453) [51] Mitterdorfer A and Gauckler L J 1999 Solid State Ion.
[35] Liu H and Webster T J 2007 Biomaterials 28 354 117 187–202
[36] Pinkerneil P, Güldenhaupt J, Gerwert K and Kötting C 2012 [52] Bieberle A and Gauckler L J 2002 Solid State Ion. 146 23–41
ChemPhysChem 12 2649–53 [53] Vogler M, Bieberle-Hütter A, Gauckler L, Warnatz J and
[37] Carter C F, Lange H, Ley S V, Baxendale I R, Wittkamp B, Bessler W G 2009 J. Electrochem. Soc. 156 B663–72
Goode J G and Gaunt N L 2010 Org. Process Res. Dev. [54] Bessler W G 2005 Solid State Ion. 176 997–1011
14 393–404 [55] Rochoux M, Guo Y, Schuurman Y and Farrusseng D 2015
[38] Chan K L A, Gulati S, Edel J B, de Mello A J and Phys. Chem. Chem. Phys. 17 1469–81
Kazarian S G 2009 Lab Chip 9 2909–13 [56] Ferreira de Morais R, Sautet P, Loffreda D and Franco A A
[39] Yatom N, Neufeld O and Toroker M C 2015 J. Phys. Chem. C 2011 Electrochim. Acta 56 10842–56
119 24789 [57] Marechal Y 2011 J. Mol. Struct. 1004 146–55
[40] Cowan A J 2016 Nat. Chem. 8 740–1 [58] Sinha R, Lavrijsen R, Verheijen M A, Zoethout E, Genuit H,
[41] Zhang X Q and Bieberle-Hütter A 2016 ChemSusChem van de Sanden M C M and Bieberle-Hütter A 2019 ACS
9 1223–42 Omega 4 9262–70
[42] Zhang X, Klaver P, van Santen R, van de Sanden M C M and [59] Falk M 1990 J. Raman Spectrosc. 21 563–7
Bieberle-Hütter A 2016 J. Phys. Chem. C 120 18201–8 [60] Periasamy A, Muruganaud S and Palaniswamy M 2009
[43] Gaiduk V I, Nielsen O F and Perova T S 2002 J. Mol. Liq. Rasayan J. Chem. 2 981–9
95 1–25 [61] Zasetsky A Y and Gaiduk V I 2007 J. Phys. Chem. A
[44] George K, van Berkel M, Zhang X, Sinha R and 111 5599–06
Bieberle-Hütter A 2019 J. Phys. Chem. C 123 9981–92 [62] Silvestrelli P L, Bernasconi M and Parinello M 1997 Chem.
[45] George K, Khachatrjan T, van Berkel M, Sinha V and Phys. Lett. 277 478–82
Bieberle-Hütter A 2020 ACS Catal. 10 14649–60 [63] Bockris J O M, Reddy A K N and Gamboa-Aldeco M 2000
[46] Dickens C F, Kirk C and Nørskov J K 2019 J. Phys. Chem. C Modern Electrochemistry Vol. 2A, Fundamentals of
123 18960–77 Electrodics 2nd edn (New York: Kluwer Academic
[47] Hansen H A, Viswanathan V and Nørskov J K 2014 J. Phys. Publishers)
Chem. C 118 6706–18 [64] Iandolo B and Hellman A 2014 Angew. Chem. 126 13622
12You can also read