Temporal resource partitioning of wildebeest carcasses by scavengers after riverine mass mortality events
←
→
Page content transcription
If your browser does not render page correctly, please read the page content below
Temporal resource partitioning of wildebeest carcasses by
            scavengers after riverine mass mortality events
              KATHERINE S. HANDLER ,1 AMANDA L. SUBALUSKY ,1,2, CORINNE J. KENDALL                                ,3,4
                   CHRISTOPHER L. DUTTON ,1,2 EMMA J. ROSI ,5 AND DAVID M. POST 1
               1
                   Department of Ecology and Evolutionary Biology, Yale University, New Haven, Connecticut 06511 USA
                              2
                                Department of Biology, University of Florida, Gainesville, Florida 32611 USA
                                        3
                                          North Carolina Zoo, Asheboro, North Carolina 27205 USA
                                  4
                                    North Carolina State University, Raleigh, North Carolina 27607 USA
                                  5
                                    Cary Institute of Ecosystem Studies, Millbrook, New York 12545 USA

  Citation: Handler, K. S., A. L. Subalusky, C. J. Kendall, C. L. Dutton, E. J. Rosi, and D. M. Post. 2021. Temporal resource
  partitioning of wildebeest carcasses by scavengers after riverine mass mortality events. Ecosphere 12(1):e03326. 10.1002/
  ecs2.3326

  Abstract. Scavengers play an important role in nutrient recycling and disease control, and this role may be
  particularly critical after mass mortality events, such as those caused by epidemics, culling, or natural disas-
  ters. Current work on scavenger ecology has focused on use of single carcasses, but behaviors are likely to be
  different at mass mortality events, in which high resource abundance can prolong the spatial and temporal
  availability of carcasses. Little is currently known about how scavengers respond to large die-offs and under-
  standing scavenger use and succession patterns at mass mortality events has important implications for dis-
  ease ecology. We used photographic time series and river-side surveys of scavengers using carcasses to
  investigate scavenger use and succession on wildebeest carcasses that resulted from annual mass drownings
  in the Mara River, Kenya. In addition, we used telemetry data for tagged avian scavengers to assess individ-
  ual use of mass drownings. Density of avian scavengers per carcass was almost two orders of magnitude
  lower at mass drownings than has been documented previously for single carcasses on land. Scavengers
  demonstrated patterns of temporal resource partitioning, with large-bodied avian scavengers more common
  initially, followed by small-bodied avian scavengers, and then by insectivorous birds and non-avian scav-
  engers. Avian scavengers also differed in daily activity patterns, with marabou storks more common in the
  morning and late afternoon and white-backed and Ru        € ppell’s vultures more common mid-day. Telemetry
  data indicated that approximately half of tagged vultures used mass drowning events but only spent a small
  proportion of their time there, suggesting that competition still plays an important role in scavenger dynam-
  ics at mass mortality events and that the rewards of such abundant resources may be offset by the risk of for-
  aging in the river. Further research on scavenger behavior during mass mortality events is needed to better
  understand the role of scavengers in decomposition of carcasses and disease control during these events.

  Key words: carrion use; decomposition; Mara Serengeti; marabou stork; mass mortality; river; scavenger; succession;
  vulture; wildebeest.

  Received 31 January 2020; revised 9 July 2020; accepted 17 July 2020; final version received 21 October 2020.
  Corresponding Editor: Robert R. Parmenter.
  Copyright: © 2021 The Authors. This is an open access article under the terms of the Creative Commons Attribution
  License, which permits use, distribution and reproduction in any medium, provided the original work is properly cited.
   E-mail : asubalusky@ufl.edu

INTRODUCTION                                                          of energy throughout food webs, and controlling
                                                                      the spread of disease (DeVault et al. 2003, Wilson
  Scavengers play critical roles in ecosystem pro-                    and Wolkovich 2011, Ogada et al. 2012a). How-
cesses by recycling nutrients, promoting the flow                      ever, studies of scavengers are under-represented

                    v www.esajournals.org                         1             January 2021   v Volume 12(1) v Article e03326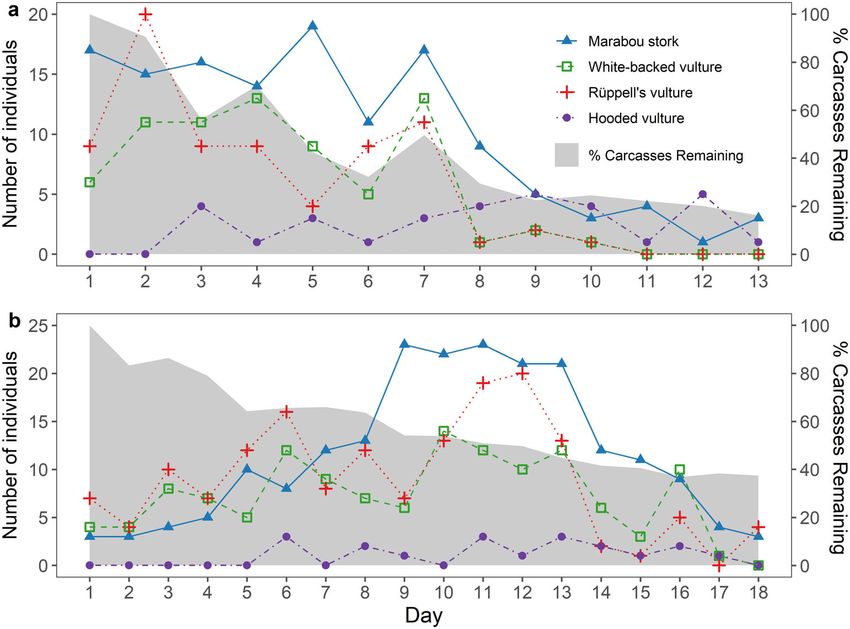
HANDLER ET AL.

in ecological literature (DeVault et al. 2003, Ken-          of the season because individuals are able to
dall et al. 2014), and scavengers tend to be an              move large distances, responding to influxes in
over-looked link in food webs around the world.              carrion abundance (Kendall 2013).
Most food webs focus on predator–prey relation-                 Most scavenger literature focuses on competi-
ships and ignore the complexity of added detrital            tive scavenger interactions at the single carcass
and scavenger pathways (Moore et al. 2004),                  level (Wallace and Temple 1987, Hunter et al.
although scavenging processes can be involved                2007, Ogada et al. 2012b). Such carcasses typi-
in almost half of all food web linkages (Wilson              cally do not last for longer than a day, and thus,
and Wolkovich 2011) and may be critically                    current studies are confined to scavenger succes-
important to ecosystem function and health                   sion patterns on a resource of extremely limited
(DeVault et al. 2003, Buechley and Sß ekercio    glu        quantity and temporal availability. Mass mortal-
2016).                                                       ity events can lead to the occurrence of many car-
   Avian scavengers are unique and important                 casses on the landscape (Fey et al. 2015), which
components of the scavenger community                        can provide the opportunity to study scavenger
because their ability to fly paired with acute                succession at longer time scales and upon less
vision and olfactory senses allow them to access             limited resources. Mass mortality events can
carcasses quickly over a large spatial extent                result from natural disasters, extreme weather
(DeVault et al. 2003). Carcasses tend to be unpre-           events, culling associated with management
dictable in time and space, and more unpre-                  actions, disease epidemics, or as part of regular
dictable resources increase biodiversity and                 seasonal movements or breeding behaviors
maintain functionality of the scavenger guild                (Newton 2007, Fey et al. 2015, Subalusky et al.
(Wilmers et al. 2003, Cortes-Avizanda et al.                2017). These events lead to a large amount of car-
2012). Vulture scavenging abilities decrease the             cass biomass on the landscape, which can
time it takes carcasses to decompose and there-              become an important part of the diet of many
fore can decrease disease transmission between               scavengers and alter food web dynamics (Hew-
mammalian species by reducing the opportunity                son 1995, 2002, Shardlow and Hyatt 2013,
for contact (Ogada et al. 2012b). However, the               Tomberlin et al. 2017, Baruzzi et al. 2018, Lashley
majority of vulture species are in danger of                 et al. 2018b, Fey et al. 2019). The longer duration
extinction (Ogada et al. 2012a). Understanding               of carrion availability associated with mass mor-
factors that allow coexistence among scavenger               tality events may lead to different scavenger suc-
species can be important for understanding the               cessional patterns than those typically seen in
impact of changing resource availability on scav-            consumption of a single carcass over one day
enger community dynamics.                                    and may be informative in understanding the
   High diversity of avian scavenger species                 impact of scavengers on disease dynamics dur-
within a single ecosystem suggests the need for              ing an epidemic.
spatial and temporal partitioning of carrion                    The Serengeti Mara Ecosystem (SME) is home
resources (Kendall 2013). Scavenger dominance                to the largest remaining overland migration of
creates succession patterns in the use of carrion            1.3 million wildebeest (Connochaetes taurinus;
with interspecific dominance determined par-                  Hopcraft et al. 2013). Approximately 200,000
tially by body mass (Wallace and Temple 1987).               wildebeest die each year during the migration
Smaller, solitary avian scavengers, such as Bate-            (Mduma et al. 1999), and these carcasses provide
leurs (Terathopius ecaudatus), assist in locating car-       an important resource to avian scavengers
rion (Kendall 2013). Small-bodied vultures                   throughout the region (Houston 1974, Kendall
depend on the presence of large-bodied vultures              et al. 2012). One cause of mortality is through
to facilitate feeding by opening up carcasses                mass drownings that occur on a nearly annual
(Hunter et al. 2007). Scavenger species that nest            basis as the wildebeest cross the Mara River
further away from carcass sites, particularly                while moving between dry season feeding
those relying on cliff-nests, may take longer to             grounds (Subalusky et al. 2017). These drown-
arrive at carrion resources than closer-dwelling,            ings contribute a mean of 6,250 wildebeest car-
tree-nesting species (Kendall 2014). Overall,                casses every year into the Mara River, which
interspecific competition remains high regardless             likely provide an important resource for a range

               v www.esajournals.org                     2            January 2021   v Volume 12(1) v Article e03326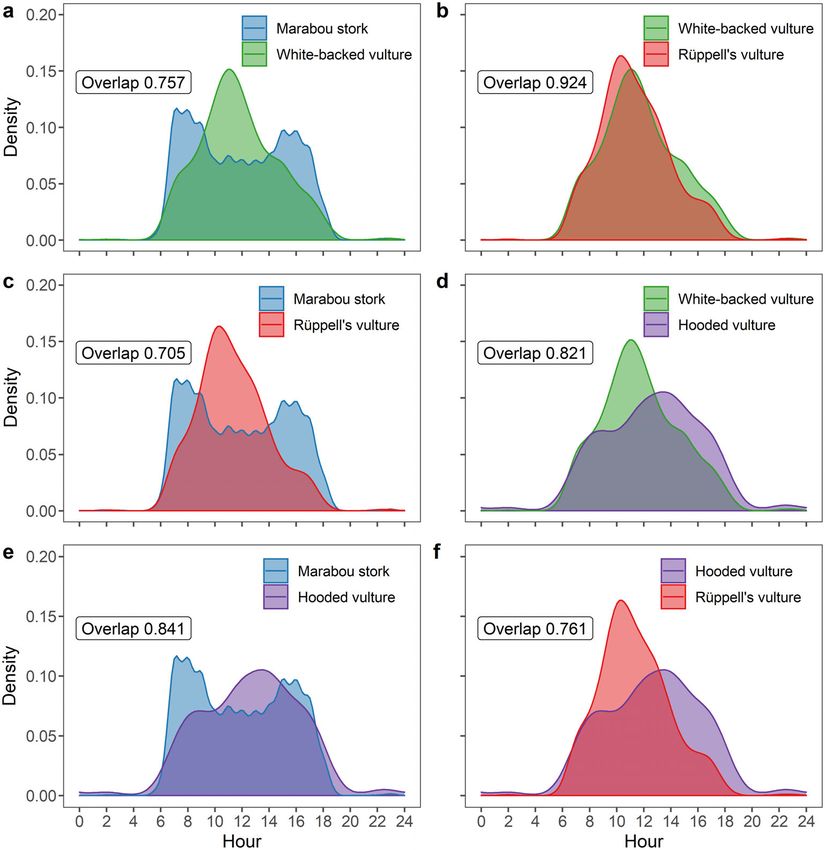
HANDLER ET AL.

of scavenger species in the ecosystem. These car-         Camera trap photographs
cass inputs occur in large pulses, with a mean of            We counted scavengers on carcass aggrega-
4.6 drowning events per year and a mean of                tions using an automated camera trap (Trophy
1,360 carcasses per drowning. The magnitude of            Cam HD Max Black LED, Bushnell, Kansas City,
these events suggest avian scavenger communi-             Missouri, USA) placed on two different aggrega-
ties might respond differently than to single car-        tions of wildebeest carcasses after drownings. In
casses on the landscape. The location of carcasses        2012, there was a drowning of an estimated
in the river may also influence the avian scav-            3,100 wildebeest on 5 November followed by a
enger response, as foraging in the river poses            drowning of 400 wildebeest on 13 November.
risks for avian scavengers, including getting their       An average wildebeest carcass is 175 kg (wet
feathers wet (which limits their ability to fly),          mass; Subalusky et al. 2017); thus, these drown-
drowning, or being predated by Nile crocodiles            ings contributed 612,500 kg of carcass biomass
(Crocodylus niloticus). Access for scavengers to          to the river. The camera trap was deployed on
the meat within a given carcass in the river may          an aggregation of 16 carcasses (2800 kg carcass
also be more limited than when the carcass is on          biomass) on 18 November 2012, which was 13 d
land, due to orientation of the carcass among the         after the first drowning and 5 d after fresh car-
rocks and in the water, which could affect how            casses entered the river. In 2013, there was a ser-
these resources are used by scavengers.                   ies of drownings of an estimated 2110
   Here we quantify the avian scavenger commu-            wildebeest on 25 September, 1850 wildebeest on
nity composition on wildebeest carcasses in the           26 September, and 1500 wildebeest on 27
Mara River after multiple mass drownings and              September (a total of 955,500 kg carcass bio-
analyze temporal resource partitioning at both            mass). The camera trap was deployed on an
daily time scales and throughout the decomposi-           aggregation of 39 carcasses (6825 kg) on 1 Octo-
tion period. We use detailed surveys of photo-            ber 2013, which was 4–6 d after fresh carcasses
graphic time series from camera traps at the river,       entered the river. In both years, the camera was
visual surveys at the river reach scale (100–200 m        programmed to take a picture every 15 min,
of river length), and GSM-GPS telemetry of three          and species identification and number of indi-
different vulture species to count avian and non-         viduals were recorded every hour from Novem-
avian scavengers using carcasses after mass               ber 18 to 30 in 2012 (days 5–17 after the last
drownings and to quantify succession patterns in          drowning occurred; 1273 photographs) and
the scavenger community during these events.              from October 1 to 18 in 2013 (days 4–21 after
                                                          the last drowning occurred; 1802 photographs;
METHODS                                                   Fig. 2). The camera was removed once carcasses
                                                          had decomposed to an advanced stage.
Study site                                                   For each picture analyzed, we identified and
   This research was conducted on the Mara                counted both avian and non-avian scavenger
River in the Maasai Mara National Reserve                 species present. The majority of scavengers were
(MMNR) in Kenya, which is in the northern por-            avian, and the most common species observed
tion of the Serengeti Mara Ecosystem (SME;                were marabou storks (Leptoptilos crumenifer),
Fig. 1). Wildebeest cross the Mara River fre-             white-backed vultures (Gyps africanus), Ru € ppell’s
quently during movements between dry season               vultures (Gyps rueppellii), and hooded vultures
feeding grounds while in the northern portion of          (Necrosyrtes monachus). Changes in lighting
their range. There are 11 major crossing sites            throughout the day made some species identifi-
located along the Mara River, and mass drown-             cations difficult, particularly differentiation of
ings have been documented at four of these sites          juvenile white-backed vultures and Ru      € ppell’s
(Subalusky et al. 2017). Data from this study             vultures, which have similar coloring and mark-
span four different drowning events across four           ings. Vultures that could not be identified to spe-
years, which occurred at two different sites on           cies were counted as unknown vultures.
the Mara River–Serena Lunch Spot (1.538583° S,            Individuals of these 4 species accounted for 87%
35.028681° E) and Cul de Sac Crossing                     of all species (avian and non-avian) observed in
(1.374229° S, 34.996873° E).                              2012 and 88% in 2013. A preliminary data

              v www.esajournals.org                   3            January 2021   v Volume 12(1) v Article e03326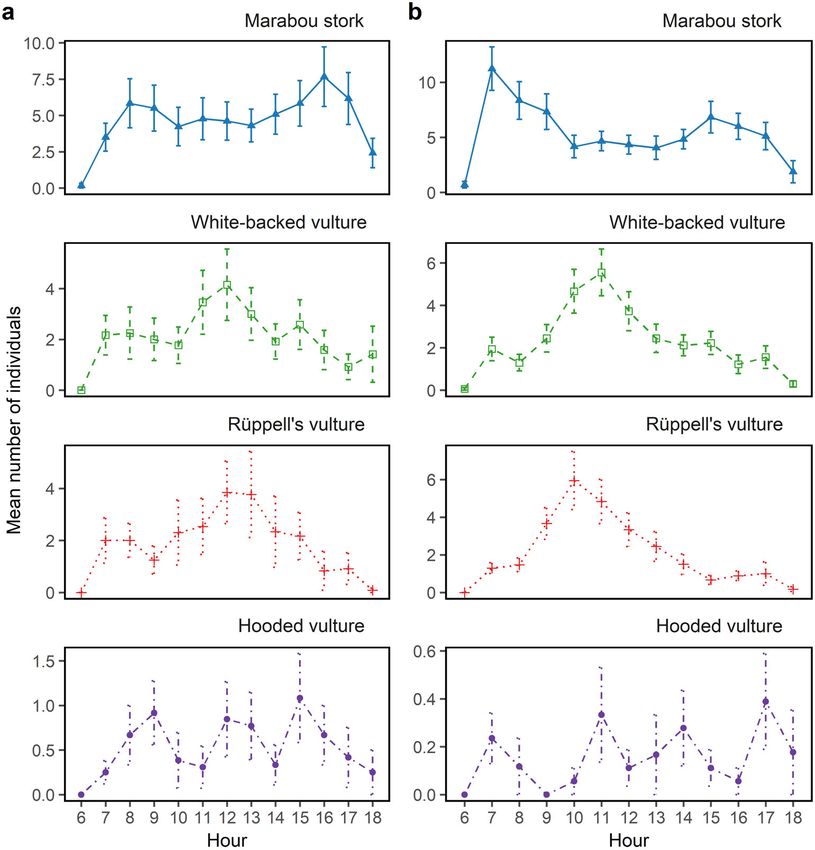
HANDLER ET AL.

  Fig. 1. A map of the Mara River inside the Maasai Mara National Reserve showing the location of wildebeest (C.
taurinus) drowning sites, focal surveys with camera traps and river reach-scale surveys with visual observations.

analysis conducted on the first two days of the                We analyzed the correlations through time
photograph series showed there was little varia-           between carcass availability and scavenger spe-
tion in the species and number of common scav-             cies. We quantified the relative surface area of
engers counted every fifteen minutes as                     carcass material available in one photograph for
compared to every hour. Thus, we only counted              each day throughout the time series, or when the
the four most common avian species in pho-                 number of carcasses changed for any reason. We
tographs taken on the hour for every hour of the           analyzed images in ImageJ (Schneider et al.
photograph series. Less common avian species               2012), and we calculated the total area of visible
[lappet-faced vultures (Torgos tracheliotos), Afri-        carcass material in pixels using the freehand
can sacred ibis (Threskiornis aethiopicus) and hel-        selection tool. We calculated the relative change
meted guinea fowl (Numida meleagris)] and non-             in carcass surface area over time by dividing the
avian species [crocodile (Crocodylus niloticus),           measure of area on each day by the measure of
Nile monitor (Varanus niloticus), banded mon-              area on the first day of the photograph series. We
goose (Mungos mungo), dwarf mongoose (Helo-                calculated the daily maximum number (the max-
gale parvula), slender mongoose (Galerella                 imum number of individuals counted at any sin-
sanguinea), and spotted hyena (Crocuta crocuta)]           gle time point on a given day) of each avian and
were counted in every picture in which they                non-avian species, and analyzed changes in the
appeared. Hippopotamus (Hippopotamus amphi-                scavenger community over the duration of the
bius) were observed in several photographs but             photograph series by conducting a correlation
were not observed using the carcasses, so they             analysis in the corrplot package in R (Wei and
were not counted.                                          Simko 2017). We analyzed correlations between

               v www.esajournals.org                   4            January 2021   v Volume 12(1) v Article e03326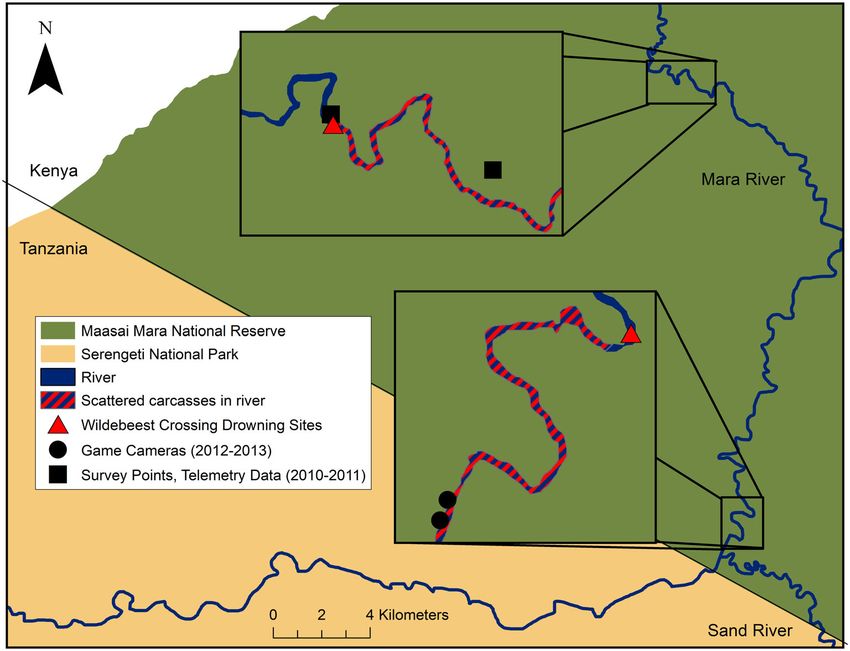
HANDLER ET AL.
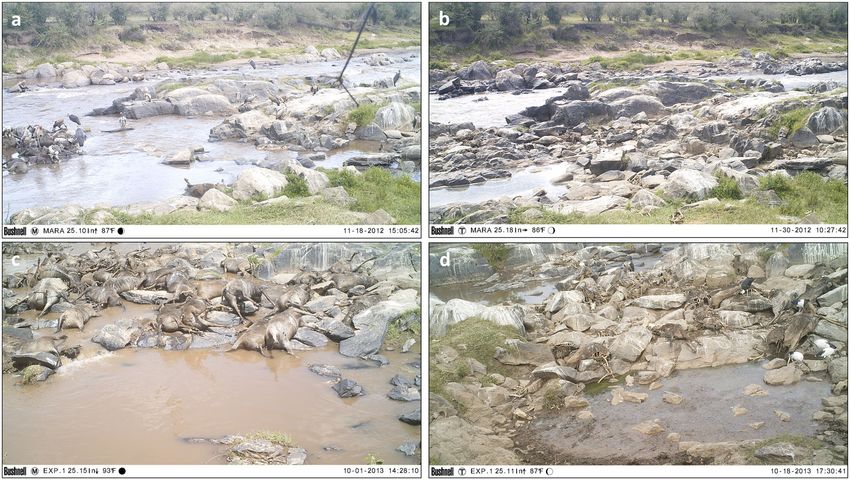
Fig. 2. Sample camera trap photographs of wildebeest carcass aggregations on the Mara River from the first
and last day of the photograph series in 2012 and 2013: (a) 18 November 2012, (b) 30 November 2012, (c) 1 Octo-
ber 2013, and (d) 18 October 2013.
carcass availability and abundance of marabou develop probability density functions for each
storks, white-backed vultures, Ru € ppell’s vul- species, and we analyzed the degree of overlap
tures, hooded vultures, sacred ibis, and non- in activity curves using the overlap package in R
avian scavengers. We used a < 0.05 to indicate (Ridout and Linkie 2009, Lashley et al. 2018a).
statistical significance. We calculated a coefficient of overlap (using the
We calculated the proportion of each avian k4 estimator for larger datasets), which is a con-
scavenger species (Marabou storks and vultures) tinuous variable between 0 and 1, where 1 indi-
directly using the carcasses as the maximum cates identical curves. All analyses were
number of individuals of a given species counted conducted in R version 3.6.1 (R Core Team 2018),
at any one time over the duration of the pho- and data and R code are provided in the Mende-
tograph series divided by the sum of the maxi- ley Data Repository.
mum count for all taxa. This approach
minimized double counting of individuals and Scavenger counts
allowed comparison of carcass use by species We conducted river reach-scale surveys of
that may peak in numbers on different days. avian scavengers at wildebeest drowning sites at
These proportions were compared to estimates multiple time points after a drowning occurred
from the literature for observations of avian scav- in both 2010 (6 time points) and 2011 (4 time
engers on single carcasses. points). We selected a vantage point with a clear
We examined daily carcass use by the four view of the wildebeest carcasses in the river, and
most common avian scavenger species by calcu- we counted all the carcasses and avian scav-
lating the mean number of individuals counted engers within a 200 m radius of the river, includ-
at each hour over the duration of the photograph ing the river and riparian area. We counted all
series in 2012 and 2013. We analyzed daily activ- individuals of the following species: marabou
ity curves by using the data across all days to storks, white-backed vultures, € ppell’s
Ru
v www.esajournals.org 5 January 2021 v Volume 12(1) v Article e03326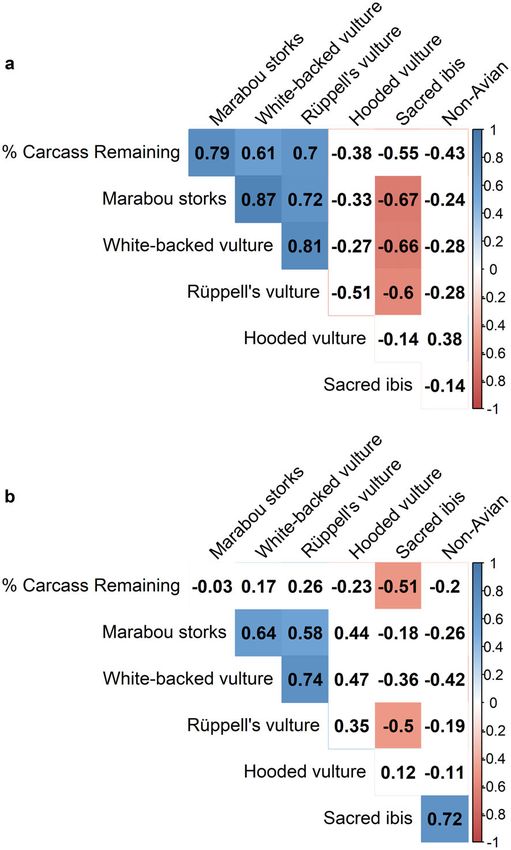
HANDLER ET AL.

vultures, hooded vultures, and lappet-faced vul-           species across the two events. Some individuals
tures. We examined the number of individuals of            used both drowning events and were thus
each avian scavenger species over time, although           included twice. To determine the proportion of
we did not know the exact date of either drown-            individuals of a given species using mass drown-
ing event. These data are of limited temporal res-         ings, we divided the number of tracked individu-
olution, but they complement the camera trap               als of a given species that used the drowning for
photographs in characterizing community pat-               either the first or second event by the total num-
terns over time since drowning by providing a              ber of individuals of that species being tracked
larger spatial scale perspective on scavenger use          for either the first or second drowning event.
of carcasses.                                              These data provide us with an understanding of
                                                           landscape-level choices vultures are making in
GSM-GPS telemetry                                          their foraging behavior as they provide informa-
   As part of a larger study on vulture movement           tion on both which species are at the wildebeest
patterns in the region (see Kendall et al. 2014 for        carcasses along the river and how an individual
more details on study and unit attachment meth-            used the mass mortality event over time.
ods used), 18 vultures were being tracked with
GSM-GPS tags (Africa Wildlife Tracking, Preto-             RESULTS
ria, South Africa and Savannah Tracking, Nair-
obi, Kenya) during the time when the migration             Camera trap photographs
was near the Mara River in 2010–2011. These                   Carcasses decomposed substantially over the
included 6 white-backed vultures, 8 Ru     € ppell’s       period of the study. There were 8–16 carcasses
vultures and 4 lappet-faced vultures. During this          throughout the period of observation in 2012,
tracking period, there were two mass drowning              with changing numbers caused by carcasses
events. We examined vulture use of the river               floating downstream in or out of view of the
region in which drownings were observed to                 camera trap, and carcass loss through decompo-
occur during those two events. We assumed an               sition. On day 1 of the photograph series, there
individual was using a mass drowning if they               were both fresh carcasses from the drowning that
were located within 2 km of the river along the            occurred 5 d prior and some partially decom-
river section where drownings were observed to             posed carcasses from an earlier drowning that
occur and within 30 d of when the drowning                 occurred 13 d prior. By day 4 of the photograph
occurred. Four to six locations were recorded              series, rib bones were showing on fresh car-
every day for each individual, so these criteria           casses. Carcasses were almost entirely skeletal by
were designed to include individuals that may              the end of the photograph series, with 16% of the
be using the drowning but for which a location             initial surface area remaining (Fig. 2a). There
was not captured at the precise moment they                were 30–40 carcasses throughout the period of
were at the river. This approach could have                observation in 2013. On day 1 of the photograph
resulted in the inclusion of individuals located           series, all carcasses were fresh from the recent
near the river but not using the carcasses, or the         series of drownings that had occurred 4–6 d
exclusion of individuals that used the carcasses           prior. Rib bones began showing at day 11 of the
for a brief period before relocating >2 km away.           photograph series. At the end of the photograph
   We assessed individual vulture use of mass              series, some carcass material was still present,
drowning sites by looking at the behavior of               with 37% of the initial surface area remaining
tagged vultures. Data coverage during a given              (Fig. 2b).
drowning period was not complete for all indi-                The majority of individuals observed in both
viduals, so we calculated the total number of              photograph series were avian, which accounted
days each individual was tracked during a given            for 95% of individuals in 2012 and 98% of indi-
drowning period. We then quantified the propor-             viduals in 2013. The number of avian scavengers
tion of time a given individual used the drown-            changed over time as the carcasses decomposed
ing as the number of days they were at the river           (Fig. 3). In 2012, the number of marabou storks
divided by the number of days tracked during a             and vultures was high at the beginning of the
drowning event and took an average for each                photograph series and declined in concert with

              v www.esajournals.org                    6             January 2021   v Volume 12(1) v Article e03326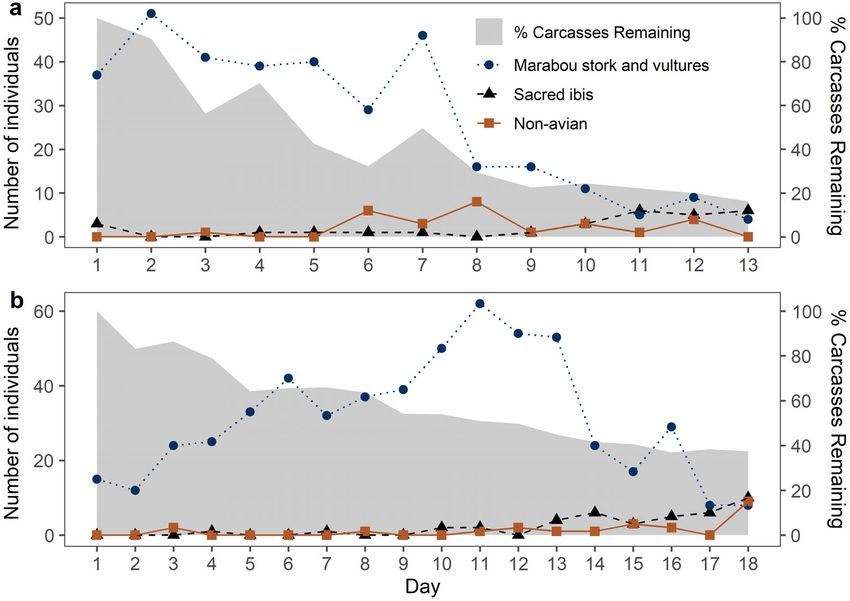
HANDLER ET AL.

carcass availability (Fig. 3a). The ratio of mara-        crocodile, and banded mongoose) more abun-
bou storks and vultures (based on the maximum             dant later (Fig. 4). In 2012, marabou storks,
number per species per day) to carcasses was              white-backed vultures, and Ru    € ppell’s vultures
1.7  1.0 (mean  SD) over the entire period of           were significantly positively correlated with %
observation, and it ranged from 0.3 to 3.3. In            carcass remaining and with one another
2013, the number of marabou storks and vultures           (Fig. 5a). Hooded vultures, sacred ibis, and non-
did not peak until the middle of the photograph           avian scavengers were negatively correlated with
series and declined before carcasses reached the          percentage of carcass remaining, and with mara-
same stage of decomposition (Fig. 3b). The ratio          bou storks, white-backed vultures and Ru   € ppell’s
of vultures to carcasses was 1.0  0.6 over the           vultures, although only the negative correlation
entire period of observation, and it varied               between sacred ibis and the other birds was sig-
between 0.3 and 2.1.                                      nificant. In 2013, marabou storks, white-backed
   Scavenger community composition changed                vultures, and Ru€ ppell’s vultures again were sig-
through time in both years, with larger-bodied            nificantly positively correlated with one another,
avian scavengers (marabou storks, white-backed            although the correlation with percentage of car-
vultures, and Ru€ ppell’s vultures) more abundant         cass remaining was much less strong (Fig. 5b).
in the early to middle portion of the photograph          Hooded vultures were still negatively correlated
series and smaller-bodied avian scavengers                with percentage of carcass remaining, but they
(hooded vultures), sacred ibis (which feed on             were positively correlated with the marabou
insects that colonize the carcasses), and non-            storks and Gyps vultures. Sacred ibis and non-
avian scavengers (primarily spotted hyena, Nile           avian scavengers were negatively correlated with

   Fig. 3. The percentage of carcass remaining (in terms of relative surface area) and the maximum number per
day of observation of the four most common avian scavengers surveyed from camera trap images on an aggrega-
tion of (a) 16 wildebeest carcasses in November 2012 and (b) 39 carcasses in October 2013 after mass drownings
in the Mara River, Kenya.

               v www.esajournals.org                  7            January 2021   v Volume 12(1) v Article e03326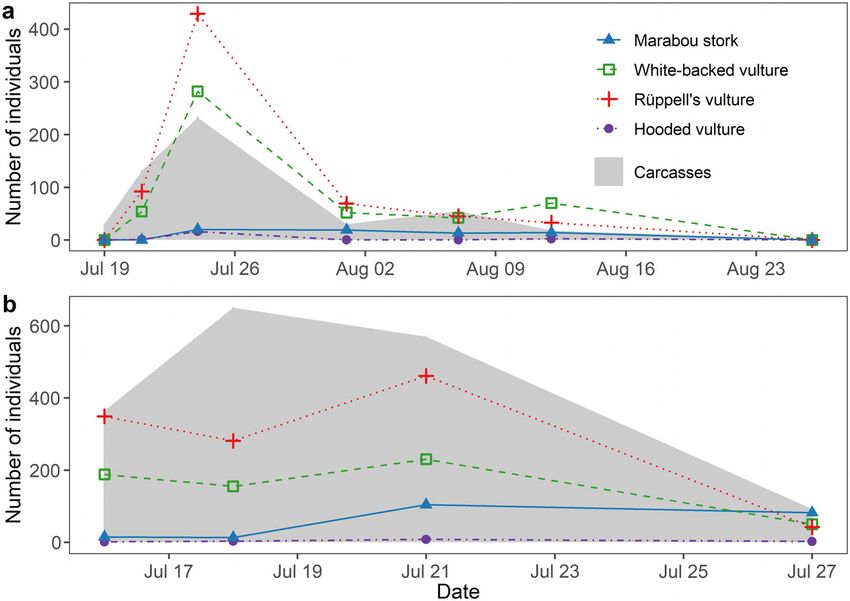
HANDLER ET AL.

percentage of carcass remaining, marabou storks,             combined data for each species across years and
and Gyps vultures, although most correlations                compared overlap values between species pairs
were not significant.                                         (Fig. 7). White-backed and Ru   € ppell’s vultures,
   Marabou storks were the most common avian                 which both used the carcasses more in mid-day
scavenger species observed in both 2012 and                  (10:00–13:00), had high overlap in activity curves
2013, comprising 30–34% of all avian scavengers,             (k = 0.924). They both had relatively low overlap
followed by Ru   € ppell’s vultures (29–32%) and             with marabou storks (0.757 and 0.705, respec-
white-backed vultures (21%; Table 1). This pat-              tively), which used the carcasses more frequently
tern was very different than that observed for               in the morning (7:00–9:00) and late afternoon
single carcasses in terrestrial habitats, in which           (15:00–17:00). Hooded vultures were observed
marabou storks only comprised 2–4% of total                  throughout the day and had intermediate over-
avian scavengers. Unknown vultures only                      lap values with the other species (0.761–0.841),
accounted for 4–5% of total avian scavenger spe-             although hooded vultures were less commonly
cies. In both years, lappet-faced vultures were              observed compared to other species.
only seen four times at the carcass sites.
   The dominant avian scavengers showed varia-               Scavenger counts
tion in their daily use of carcasses that was con-             At the river reach scale, the number of vultures
sistent in 2012 and 2013 (Fig. 6). Species’ activity         generally followed the same pattern as the num-
curves in 2012 had high overlap values with                  ber of carcasses during 2010 and 2011 (Fig. 8).
curves in 2013: marabou storks, k = 0.869; white-            We could not quantify the number of days since
backed vultures, k = 0.881; Ru   € ppell’s vultures,         the drowning for these observations, but obser-
k = 0.772; hooded vultures, k = 0.854. Thus, we              vations from the 2010 drowning likely began on

  Fig. 4. The percentage of carcass remaining (in terms of relative surface area) and the maximum number per
day of observation of marabou storks (L. crumenifer) and vultures, sacred ibis (T. aethiopicus), and non-avian scav-
engers, surveyed from camera trap images on (a) 16 wildebeest carcasses in November 2012 and (b) 39 carcasses
in October 2013 after mass drownings in the Mara River, Kenya.

                v www.esajournals.org                    8            January 2021   v Volume 12(1) v Article e03326
HANDLER ET AL.

                                                                2011 the number of carcasses increased to a max-
                                                                imum of 650 carcasses on day 2 of observation
                                                                (Fig. 8b). The total number of vultures increased
                                                                in the first week of observation and then declined
                                                                rapidly by the second week of observation in
                                                                both 2010 and 2011. After approximately three
                                                                weeks, both vultures and carcasses disappeared.
                                                                The ratio of marabou storks and vultures to car-
                                                                casses was 2.5  2.5 in 2010 and 1.4  0.5 in
                                                                2011, similar to what we observed from the pho-
                                                                tograph time series.
                                                                   The composition of avian scavengers utilizing
                                                                wildebeest carcasses was similar in 2010 and
                                                                2011. In 2010, Ru € ppell’s and white-backed vul-
                                                                tures were most common, and there were very
                                                                few hooded vultures and no lappet-faced vul-
                                                                tures. Marabou storks were present but only at
                                                                very low numbers (never more than 20 individu-
                                                                als on any given day). In 2011, again Ru  € ppell’s
                                                                and white-backed vultures were most common,
                                                                and there were fewer hooded vultures. There
                                                                were, however, a number of lappet-faced vul-
                                                                tures and many more marabou storks (a maxi-
                                                                mum of >100 on day 5) present in 2011 than in
                                                                2010.

                                                                GSM-GPS telemetry
                                                                  Vulture use of the river during mass drown-
                                                                ings varied greatly by species and individual
                                                                (Table 2). Vultures used the river during mass
                                                                drownings a mean of 14% of the time they
  Fig. 5. Correlation matrix for percentage of carcass          were being tracked, with white-backed vul-
remaining (in terms of relative surface area) and the           tures and Ru  € ppell’s vultures using the drown-
maximum number per day of observation of marabou                ings a similar amount of time (18–19%), and
storks (L. crumenifer), white-backed vultures (G. africa-       lappet-faced vultures scarcely using the drown-
       € ppell’s vultures (G. rueppelli), hooded vultures
nus), Ru                                                        ings at all (1%).
(N. monachus), sacred ibis (T. aethiopicus), and non-             There was a great deal of individual variability
avian scavengers surveyed from camera trap images               within each species regarding use of the drown-
on wildebeest carcasses in (a) November 2012 and (b)            ings. Sixty percent of the white-backed vultures
October 2013 after mass drownings in the Mara River,            used the drowning, and those that visited the
Kenya.                                                          drowning used it on 30  32% of the days they
                                                                were tracked. Similarly, 64% of the Ru€ ppell’s vul-
                                                                tures using the drowning, and those that visited
a date near the actual drowning event, and                      the drowning used it on 30  18% of the days on
observations from the 2011 drowning likely                      which they were tracked. Lappet-faced vultures
began slightly after the actual drowning event, as              used drownings much less frequently, with only
carcass and vulture numbers were already high                   25% of individuals using drownings on only
on the first day of observation. In 2010, the num-               5  2% of the days they were tracked. Vultures
ber of carcasses increased from 30 to 232 within                that were tracked during drowning events but
the first week of observation as carcasses floated                did not use the river were located a mean dis-
and aggregated downstream (Fig. 8a), and in                     tance of 28 km from the river.

                v www.esajournals.org                       9            January 2021   v Volume 12(1) v Article e03326
HANDLER ET AL.
Table 1. Proportion of avian scavenger species at mass mortality events (MME) (data from this study) and indi-
vidual carcasses (data from the literature).
Marabou storks White-backed R€
uppell’s Hooded vulture Lappet-faced
(Leptoptilos vulture (Gyps vulture (Gyps (Necrosyrtes vulture (Torgos
Study crumenifer) africanus) ruppellii) monachus) tracheliotos)
2012 wildebeest MME (this 0.30 0.21 0.32 0.08 0.02
study; Mara)
2013 wildebeest MME (this 0.34 0.21 0.29 0.04 0.03
study; Mara)
Single wildebeest carcass 0.03 0.75 0.11 0.09 0.02
(Anderson and Horwitz
1979; Amboseli)
Single wildebeest or zebra 0.02 0.57 0.32 0.02 0.08
carcass (Kendall unpublished
data; Mara)
Single, small (HANDLER ET AL.
Fig. 6. Diel activity patterns (mean SE number of individuals per hour) of the four most common species of
avian scavenger on wildebeest carcasses after mass drownings in the Mara River in (a) 2012 and (b) 2013.
resulting in 1,500 carcasses in the river, and all have limited ability to tear meat, sometimes rely-
occurred more than a month prior. ing on vultures to pull off pieces of meat that the
At the focal carcass sites monitored with cam- storks then steal (Attwell 1963, Houston 1975),
era traps, the most common avian scavengers and the longer period of carcass decomposition
were marabou storks, comprising 30–34% of in water may benefit marabou storks in their
individuals, which likely reflects their enhanced feeding style. In contrast, in surveys along river
ability to forage in aquatic habitats (Kahl 1966). reaches near the mass drownings, the most com-
Marabou storks typically are not included in sur- mon avian scavengers were white-backed and
veys of avian scavengers feeding on terrestrial Ru€ ppell’s vultures, suggesting these species con-
carcasses due to their low abundance, as they gregate in higher numbers along the riverbanks.
comprise only 3–4% of individuals (Table 1), The large number of Gyps vulture individuals
suggesting the habitat in which mortality occurs (up to several hundred) resting along the river-
is of fundamental importance in determining its banks between feeding bouts may be due to the
attendant scavenger community. Marabou storks need to dry out wings after feeding in the river,
v www.esajournals.org 11 January 2021 v Volume 12(1) v Article e03326HANDLER ET AL.
Fig. 7. Overlap plots of the combined activity curves from 2012 and 2013 of (a) marabou storks and white-
backed vultures (k = 0.757), (b) white-backed vultures and Ru € ppell’s vultures (k = 0.924), (c) marabou storks
and Ru € ppell’s vultures (k = 0.705), (d) white-backed vultures and hooded vultures (k = 0.821), (e) marabou
storks and hooded vultures (k = 0.841), and (f) hooded vultures and Ru € ppell’s vultures (k = 0.761) on wildebeest
carcasses in the Mara River, Kenya.
or to other social or behavioral reasons. These (Table 1), suggesting mechanisms that enable
riparian aggregations have implications for their coexistence may apply across a range of car-
nutrient transport to riparian zones as well as cass availability (Kendall et al. 2012). However,
intra- and interspecific social interactions. Such the number of individuals per carcass was far
waiting or resting behavior is seen when vultures lower in this study, again suggesting the impor-
feed at single carcasses on land, but it occurs at a tance of carcass location, that is, in the water as
much larger scale after mass drownings. White- opposed to on land (Kendall et al. 2012, Kendall
backed and Ru € ppell’s vultures were also the 2014). Lappet-faced vultures were rarely docu-
most common avian scavenger species and were mented in this study, although they were docu-
highly associated with one another in studies of mented in greater numbers at the river reach
vulture use of single carcasses in this region scale. Differences in their foraging ecology, with
v www.esajournals.org 12 January 2021 v Volume 12(1) v Article e03326HANDLER ET AL.
Fig. 8. The number of carcasses and the total number of the four most common avian scavengers surveyed
during visual observations of wildebeest carcasses at a section of the Mara River, Kenya, in (a) July 2010 and (b)
July 2011.
Table 2. Vulture use of the Mara River following two wildebeest mass drownings in 2010 for three different spe-
cies, as indicated by tracking with GSM-GPS tags.
No. days at No. days Percentage of time Mean distance from
Species Age river tracked tracked at river river (km)
White-backed vulture (Gyps 3 J, 3 A 3.6 (4.9) 17.6 (13.2) 18.0 (28.7) 26.9 (13.9)
africanus)
Lappet-faced vulture 2 J, 3 A 0.4 (0.7) 15.6 (12.9) 1.3 (2.5) 28.7 (14.2)
(Torgos tracheliotos)
R€uppell’s vulture (Gyps 1 J, 7 A 3.8 (4.5) 19.4 (11.6) 19.2 (20.5) 45.0 (52.7)
ruppellii)
Note: Age is given as number of juveniles (J) and adults (A). Means are presented with SD in parentheses.
a preference for smaller carrion sources, need to on the carcasses, and sacred ibis, which forage
reduce competition with white-backed and on insects that have colonized the carcasses.
Ru€ ppell’s vultures, and preference for feeding in Non-avian scavengers, including hyenas, croco-
smaller aggregations, may explain the low num- diles, and mongoose, also increased during the
ber of lappet-faced vultures around large carcass later stages of decomposition. These changes in
aggregations (Houston 1976, Kendall et al. 2014). community composition likely reflect both inter-
The larger-bodied avian scavengers declined specific competition and resource partitioning.
as carcass decomposition progressed. In concert Smaller-bodied vultures like hooded vultures are
with this decline, smaller-bodied avian species often dependent on larger-bodied vultures to
increased, such as hooded vultures, which forage tear open carcasses and make them available for
v www.esajournals.org 13 January 2021 v Volume 12(1) v Article e03326HANDLER ET AL. consumption, and they also may be out-com- nesting behavior (Kendall 2014). Ru € ppell’s vul- peted by larger-bodied vultures during preferred tures nest on cliff ledges during this time of year, feeding times due to their small body size (Ken- and some of these are located >100 km away dall 2013). Sacred ibis and mongoose preferen- from the Serengeti Mara Ecosystem, suggesting tially feed on smaller-bodied prey such as insects they make more frequent long-distance flights to and are therefore likely responding to the large take advantage of carcass resources and would number of insect larvae available on the car- not arrive at the river until mid-afternoon. This casses. These larvae may be more accessible in behavior also suggests Ru € ppell’s vultures are later decomposition stages due to increased likely transporting carcass resources back to their access to the inner portions of carcasses and nest sites, which could result in nutrient trans- decreased activity by larger-bodied avian scav- port from the river to distant terrestrial ecosys- engers (Baruzzi et al. 2018, Lashley et al. 2018b). tems. White-backed vultures, which nest locally This feeding guild is not likely to benefit as sub- in trees and have higher search efficiency (Virani stantially from single carcasses, which are largely et al. 2010, Kendall 2013), typically arrive at car- consumed within a 24-hour period and leave lit- casses in the early morning to maximize foraging tle material to host insect larvae. The increased ability, which is what was observed on single car- presence of crocodiles later in the decomposition casses on land (Kendall 2014). However, the stage reflects their preferred use of rotten tissue, large availability of carcasses in the river may which is easier to manipulate with their jaws. have made early morning foraging less impor- Their relatively low numbers in our surveys sup- tant than under normal conditions. It is also pos- port earlier estimates that crocodiles consume a sible that risks due to foraging in the river made small number of carcasses from mass drownings it preferable to wait until later in the day when (Subalusky et al. 2017). Use of carcasses by ter- air temperatures were higher and vultures could restrial scavengers, including mongoose and hye- dry their wings more quickly. Marabou storks nas, was largely limited to carcasses located next may have been more active in the mornings and to the riverbank, and falling water levels late afternoons, which are normally preferable throughout both camera photograph series made activity times due to cooler temperatures, these carcasses more accessible to terrestrial scav- because their adaptation to feeding in aquatic engers in the later stages. Thus, carcass availabil- habitats allowed them to take advantage of this ity and decomposition stage were confounded temporal niche (Kahl 1966). Thus, marabou through time, and it is possible that hyenas storks may have a competitive advantage in the would have been more abundant early in the case of drowning deaths that they do not nor- time series if low water levels had allowed them mally have for carcasses on land. easier access to carcasses. However, hyenas’ Despite the large number of avian scavengers unique ability to use the carcass bones as a observed at the carcasses, telemetry results sug- resource may make them less sensitive to decom- gest many vultures in the area do not use car- position stage (Wambuguh 2008). This study did casses from mass drownings and that the time not address carcass use by aquatic consumers, each individual spent at a mass drowning sites such as aquatic macroinvertebrates and fishes, was limited. For both white-backed and although other research has suggested the car- Ru€ ppell’s vultures, approximately two-thirds of casses might provide a substantial resource for individuals being tracked used the carcasses dur- them (Subalusky et al. 2017, 2020). ing one-third of their time. Only one-quarter of We also observed diel patterns in avian scav- lappet-faced vultures used the drownings at all, enger carrion use. Marabou storks used the car- and those only visited the river during 5% of casses more frequently in the morning and late their time. Given the majority of individuals afternoon, while both white-backed and were within a sufficiently close range (
HANDLER ET AL.

or make limited use of the available carrion. The          proportion of individuals and low proportion of
low use of carcasses may be due to the riskiness           time that avian scavengers spent near the river
of foraging in the river, difficulty accessing float-        after mass drownings suggest the challenges
ing carcasses, competition for accessible car-             associated with foraging in the river do not out-
casses, and/or the prevalence of other carcasses           weigh the benefits of abundant resources; how-
in preferable habitats on the landscape during             ever, mass drownings may provide an important
this time. Combined with the low number of                 resource pulse during a time when most avian
individuals observed per carcass, these data sug-          scavenger species are nesting. The general
gest that local enhancement is less important for          decline of large migrations and associated mass
mass mortality events than for a single carcass            mortality events could negatively influence scav-
(Jackson et al. 2008). These data also support             enger species in other parts of the world. The rel-
findings from earlier studies on both landscape-            ative predictability of mass drownings in the
scale movements of vultures and the influence of            Mara River allows us to study the influence of
supplemental feeding stations (i.e., vulture               these mass drownings on scavenger succession
restaurants) that food availability is not the only        patterns, which can inform our understanding of
factor mediating vulture foraging behavior                 other mass mortality events that may result from
(Cortes-Avizanda et al. 2009, Phipps et al. 2013,         starvation during drought, disease mortality dur-
Kendall et al. 2014). This variation in use of the         ing anthrax or brucellosis outbreaks, or culling
river and associated carcasses may further reflect          during management interventions. Our research
differences in carcass and habitat use exhibited           suggests the location of carcasses and life history
by vulture species that helps to mediate their             and behavioral characteristics of available scav-
coexistence (Kendall et al. 2014). For instance,           enger species are critical determinants of carcass
Ru€ ppell’s vultures occurred at similar propor-           utilization by scavengers.
tions at mass drownings and single large terres-
trial carcasses whereas white-backed vultures              ACKNOWLEDGMENTS
had lower prevalence at mass drownings. Similar
to what has been found at vulture restaurants,                We thank Brian Heath, Mara Conservancy rangers
larger aggregations of carrion may benefit domi-            and Paul Geemi for assistance with camera surveys
nant species, such as Ru€ ppell’s vultures, who can        in the field; Laban Njoroge and our colleagues at
                                                           National Museums of Kenya for facilitating this
more effectively monopolize known food sources
                                                           research; Munir Virani, Simon Thomsett, and Keith
(Cortes-Avizanda et al. 2012).
                                                           Bildstein for their assistance in trapping vultures;
   This research shows that a suite of scavenger           and Deborah Day for providing additional guidance
species responds to carcasses from mass drown-             through the Amity High School Scientific Research
ings, but the abundance of carcasses in conjunc-           Program. Funding: Camera surveys were conducted
tion with their location in the river influence             with funding to David Post from the National Geo-
scavenger use and succession patterns. Scaven-             graphic Society Committee for Research and Explo-
ger use of wildebeest mass drownings likely                ration (#9253-13) and the National Science
plays an important role in nutrient cycling and            Foundation (DEB1354053 and 1753727), and funding
transport from these events. The declining popu-           to Emma Rosi from the National Science Foundation
lations of most African vulture species suggest            (DEB 1354062). Vulture tagging and scavenger
                                                           counts were conducted with funding to Corinne J.
carrion from mass mortalities such as these may
                                                           Kendall from Princeton University, The Peregrine
persist for even longer on the landscape and not
                                                           Fund and Hawk Mountain Sanctuary. Permits: Cam-
be transported away from mortality hotspots.               era surveys were conducted in affiliation with the
Furthermore, the longer persistence of carcasses           National Museums of Kenya under research permit
on the landscape could increase the abundance              number NCST/RCD/12B/012/36 from the Kenya
of and contact between facultative mammalian               National Commission for Science, Technology and
scavengers, which could increase potential for             Innovation. Vulture tagging and scavenger counts
disease transmission (Ogada et al. 2012a, b). It is        were conducted as part of Corinne J. Kendall’s PhD
unclear the degree to which these scavenger spe-           dissertation under Kenyan research permit NCST/5/
cies rely upon mass drownings to supplement                002/R/448 and were approved by IACUC for Prince-
their annual energy budget. The relatively low             ton University under protocol number 1751. All

              v www.esajournals.org                   15            January 2021   v Volume 12(1) v Article e03326
HANDLER ET AL.
applicable institutional and/or national guidelines mass mortality events. Proceedings of the National
for the care and use of animals were followed. Academy of Sciences of the United States of Amer-
Author contributions: All authors conceived the ica 112:1083–1088.
idea. Katherine S. Handler, Amanda Subalusky, Hewson, R. 1995. Use of salmonid carcasses by verte-
Christopher Dutton, and Corinne J. Kendall col- brate scavengers. Journal of Zoology 235:53–65.
lected and analyzed the data. Katherine S. Handler, Hewson, R. 2002. Scavenging by birds upon salmon
Amanda Subalusky, and Corinne J. Kendall wrote carcasses during the spawning season. Scottish
the paper; other authors provided editorial advice. Birds 23:27–31.
Data availability: All data and analysis code has Hopcraft, J. G. C., A. R. E. Sinclair, R. M. Holdo, E.
been deposited in the Mendeley Data Repository Mwangomo, S. Mduma, S. Thirgood, M. Borner, J.
and be accessed at http://dx.doi.org/10.17632/g9z8vc M. Fryxell, and H. Olff. 2013. Why are wildebeest
km5y.1. the most abundant herbivore in the Serengeti
ecosystem? in A. R. E. Sinclair, K. L. Metzger, S. A.
LITERATURE CITED R. Mduma, and J. M. Fryxell, editors. Serengeti IV:
sustaining biodiversity in a coupled human-natural
Anderson, D. J., and R. J. Horwitz. 1979. Competitive system. University of Chicago Press, Chicago, Illi-
interactions among vultures and their avian com- nois, USA.
petitors. Ibis 121:505–509. Houston, D. C. 1974. The role of griffon vultures Gyps
Attwell, R. I. G. 1963. Some observations on feeding africanus and Gyps ruppellii as scavengers. Journal
habits, behavior, and inter-relationships of North- of Zoology 172:35–46.
ern Rhodesian vultures. Ostrich 34:235–247. Houston, D. C. 1975. Ecological isolation of African
Baruzzi, C., D. Mason, B. Barton, and M. Lashley. scavenging birds. Ardea 63:55–64.
2018. Effects of increasing carrion biomass on food Houston, D. C. 1976. Breeding of the white-backed
webs. Food Webs 17:e00096. and Ruppell’s Griffon vultures, Gyps Africanus and
Buechley, E. R., and C ß . H. Sßekercio
glu. 2016. The avian G. Rueppellii. Ibis 118:14–40.
scavenger crisis: looming extinctions, trophic cas- Hunter, J. S., S. M. Durant, and T. M. Caro. 2007. Pat-
cades, and loss of critical ecosystem functions. Bio- terns of scavenger arrival at cheetah kills in Seren-
logical Conservation 198:220–228. geti National Park Tanzania. African Journal of
Cortes-Avizanda, A., M. Carrete, D. Serrano, and J. A. Ecology 45:275–281.
Donazar. 2009. Carcasses increase the probability Jackson, A. L., G. D. Ruxton, and D. C. Houston. 2008.
of predation of ground-nesting birds: a caveat The effect of social facilitation on foraging success
regarding the conservation value of vulture restau- in vultures: a modelling study. Biology Letters
rants. Animal Conservation 12:85–88. 4:311–313.
Cortes-Avizanda, A., R. Jovani, M. Carrete, and J. A. Kahl, M. P. 1966. A contribution to the ecology and
Donazar. 2012. Resource unpredictability promotes reproductive biology of the Marabou stork (Leptop-
species diversity and coexistence in an avian scav- tilos crumeniferus) in East Africa. Journal of Zoology
enger guild: a field experiment. Ecology 93:2570– 148:289–311.
2579. Kendall, C. J. 2013. Alternative strategies in avian scav-
Cortes-Avizanda, A., R. Jovani, J. A. Don azar, and V. engers: how subordinate species foil the despotic
Grimm. 2014. Bird sky networks: how do avian distribution. Behavioral Ecology and Sociobiology
scavengers use social information to find carrion? 67:383–393.
Ecology 95:1799–1808. Kendall, C. J. 2014. The early bird gets the carcass:
DeVault, T. L., O. E. Jr Rhodes, and J. A. Shivik. 2003. temporal segregation and its effects on forag-
Scavenging by vertebrates: behavioral, ecological, ing success in avian scavengers. The Auk 131:12–
and evolutionary perspectives on an important 19.
energy transfer pathway in terrestrial ecosystems. Kendall, C. J., M. Z. Virani, J. G. C. Hopcraft, K. L.
Oikos 102:225–234. Bildstein, and D. I. Rubenstein. 2014. African vul-
Fey, S. B., J. P. Gibert, and A. M. Siepielski. 2019. The tures don’t follow migratory herds: scavenger habi-
consequences of mass mortality events for the tat use is not mediated by prey abundance. PLOS
structure and dynamics of biological communities. ONE 9:e83470.
Oikos 128:1679–1690. Kendall, C., M. Z. Virani, P. Kirui, S. Thomsett, and M.
Fey, S. B., A. M. Siepielski, S. Nussle, K. Cervantes- Githiru. 2012. Mechanisms of coexistence in vul-
Yoshida, J. L. Hwan, E. R. Huber, M. J. Fey, A. ture: understanding the patterns of vulture abun-
Catenazzi, and S. M. Carlson. 2015. Recent shifts in dance at carcsses in Masai Mara National Reserve,
the occurrence, cause, and magnitude of animal Kenya. Condor 114:523–531.
v www.esajournals.org 16 January 2021 v Volume 12(1) v Article e03326HANDLER ET AL.
Lashley, M. A., M. V. Cove, M. C. Chitwood, G. Shardlow, T. F., and K. D. Hyatt. 2013. Quantifying
Penido, B. Gardner, C. S. DePerno, and C. E. Moor- associations of large vertebrates with salmon in
man. 2018a. Estimating wildlife activity curves: riparian areas of British Columbia streams by
comparison of methods and sample size. Scientific means of camera-traps, bait stations, and hair sam-
Reports 8:4173. ples. Ecological Indicators 27:97–107.
Lashley, M. A., H. R. Jordan, J. K. Tomberlin, and B. T. Subalusky, A. L., C. L. Dutton, E. J. Rosi, and D. M.
Barton. 2018b. Indirect effects of larval dispersal Post. 2017. Annual mass drownings of the
following mass mortality events. Ecology 99:491– Serengeti wildebeest migration influence nutrient
493. cycling and storage in the Mara River. Proceedings
Mduma, S. A. R., A. R. E. Sinclair, and R. Hilborn. of the National Academy of Sciences of the United
1999. Food regulates the Serengeti wildebeest: a 40- States of America 114:7647–7652.
year record. Journal of Animal Ecology 68:1101– Subalusky, A. L., C. L. Dutton, E. J. Rosi, L. M. Puth,
1122. and D. M. Post. 2020. A river of bones: Wildebeest
Moore, J. C., et al. 2004. Detritus, trophic dynamics skeletons leave a legacy of mass mortality in the
and biodiversity. Ecology Letters 7:584–600. Mara River, Kenya. Frontiers in Ecology and Evo-
Newton, I. 2007. Weather-related mass-mortality events lution 8:1–17.
in migrants. Ibis 149:453–467. Tomberlin, J. K., B. T. Barton, M. A. Lashley, and H. R.
Ogada, D. L., F. Keesing, and M. Z. Virani. 2012a. Jordan. 2017. Mass mortality events and the role of
Dropping dead: causes and consequences of vul- necrophagous invertebrates. Current Opinion in
ture population declines worldwide. Annals of the Insect Science 23:7–12.
New York Academy of Sciences 1249:57–71. Virani, M., P. Kirui, A. Monadjem, S. Thomsett, and M.
Ogada, D. L., M. E. Torchin, M. F. Kinnaird, and V. O. Githiru. 2010. Nesting status of African White-
Ezenwa. 2012b. Effects of vulture declines on facul- backed Vultures Gyps africanus in the Masai Mara
tative scavengers and potential implications for National Reserve, Kenya. Ostrich 81:205–209.
mammalian disease transmission. Conservation Wallace, M. P., and S. A. Temple. 1987. Competitive
Biology 26:453–460. interactions within and between species in a guild
Phipps, W. L., S. G. Willis, K. Wolter, and V. Naidoo. of avian scavengers. The Auk 104:290–295.
2013. Foraging ranges of immature African white- Wambuguh, O. 2008. Dry wildebeest carcasses in the
backed vultures (Gyps africanus) and their use of African savannah: the utilization of a unique
protected areas in southern Africa. PLOS ONE 8: resource. African Journal of Ecology 46:515–522.
e52813. Wei, T., and V. Simko. 2017. R package “corrplot”: visu-
R Core Team. 2018. R: a language and environment for alization of a correlation matrix (Version 0.84).
statistical computing. R Foundation for Statistical https://github.com/taiyun/corrplot
Computing, Vienna, Austria. Wilmers, C. C., R. L. Crabtree, D. W. Smith, K. M. Mur-
Ridout, M. S., and M. Linkie. 2009. Estimating overlap phy, and W. M. Getz. 2003. Trophic facilitation by
of daily activity patterns from camera trap data. introduced top predators: grey wolf subsidies to
Journal of Agricultural, Biological, and Environ- scavengers in Yellowstone National Park. Journal
mental Statistics 14:322–337. of Animal Ecology 72:909–916.
Schneider, C. A., W. S. Rasband, and K. W. Eliceiri. Wilson, E. E., and E. M. Wolkovich. 2011. Scavenging:
2012. NIH Image to ImageJ: 25 years of image anal- how carnivores and carrion structure communities.
ysis. Nature Methods 9:671–675. Trends in Ecology & Evolution 26:129–135.
v www.esajournals.org 17 January 2021 v Volume 12(1) v Article e03326You can also read