Spencer Stuart Board Index - 2020 Canada
←
→
Page content transcription
If your browser does not render page correctly, please read the page content below

SPENCER S TUAR T PER SPEC TIVE

                2020 Canada
                Spencer Stuart
                Board Index
2020 C ANADA SPENCER S TUAR T B OARD INDE X   1
About       Spencer
SPENCER S TUAR T PER SPEC TIVEStuart board services

At Spencer Stuart, we know how much leadership matters. We are trusted by organizations around
the world to help them make the senior-level leadership decisions that have a lasting impact on their
enterprises. Through our executive search, board and leadership advisory services, we help build and
enhance high-performing teams for select clients ranging from major multinationals to emerging com-
panies to nonprofit institutions.

Privately held since 1956, we focus on delivering knowledge, insight and results through the collabo-
rative efforts of a team of experts — now spanning more than 70 offices, over 30 countries and more
than 50 practice specialties. In 1978, Spencer Stuart became the first global executive search firm to
enter the Canadian market with the founding of our office in Toronto, since expanding to Montréal and
Calgary. Boards and leaders consistently turn to Spencer Stuart to help address their evolving leader-
ship needs in areas such as senior-level executive search, board recruitment, board effectiveness, suc-
cession planning, in-depth senior management assessment, employee engagement and many other
facets of organizational effectiveness.

For more than 30 years, our Board Practice has helped boards around the world identify and recruit
independent directors and provided advice to board chairs, CEOs and nominating committees on
important governance issues. We serve a range of organizations across geographies and scale, from
leading multinationals to smaller organizations. In the past year alone, we conducted more than 1,100
director searches worldwide, and in North America almost two-thirds of those assignments were for
companies with revenues under $1 billion.

Our global team of board experts works together to ensure that our clients have unrivaled access to
the best existing and potential director talent, and regularly assists boards in increasing the diversity of
their composition. We have helped place women in more than 2,600 board director roles and recruited
more than 900 minority executives around the world.

In addition to our work with clients, Spencer Stuart has long played an active role in corporate gov-
ernance by exploring — both on our own and with other prestigious institutions — key concerns of
boards and innovative solutions to the challenges facing them. Publishing the Canada Spencer Stuart
Board Index (CSSBI), now in its 25th year, is just one of our many ongoing efforts. Each year, we sponsor
and participate in several acclaimed director education programs, including:

»   Next-Gen Board Leaders (NGBL), an initiative designed to foster a community of current and aspiring
    directors to spark discussion around the challenges, opportunities and contributions of a younger
    generation in today’s boardrooms
»   The Global Institutes, sponsored by the WomenCorporateDirectors (WCD) Foundation
»   The Corporate Governance Conference at Northwestern University’s Kellogg School of Management
»   The New Directors Program, a unique two-year development program designed to provide first-time,
    non-executive directors with an exclusive forum for peer dialogue on key issues and “unwritten rules” of
    corporate boards, produced in partnership with the Boston Consulting Group, Frederic W. Cook & Co.,
    Davis Polk, Lazard and PricewaterhouseCoopers

Social Media @ Spencer Stuart
Stay up to date on the trends and topics that are relevant to your business and career.
                         @Spencer Stuart
© 2021 Spencer Stuart. All rights reserved.
2For information about copying, distributing and displaying this work, contact: permissions@spencerstuart.com.   SPENCER S TUAR T
Contents

1    About the Canada Spencer Stuart Board Index
3    Spencer Stuart Perspective
11   Board Composition
     11 Board turnover and non-executive director appointment trends
     14 Appointments of non-executive directors with CEO experience
     14 Board representation for women, Indigenous peoples and minorities
     18 Appointments of first-time public company directors
     18 Non-executive directors recruited from outside Canada
     20 Appointments of active (non-CEO) executives
     20 Board chair backgrounds, independence and succession
     22 Tenures and ages of non-executive directors and board chairs
     23 Board independence
24 Board Compensation
   24 Non-executive director compensation in 2020: Pay practices, components and benchmarks
   25 Growth trends in non-executive director compensation
   26 Total non-executive director compensation by industry
   27 Annual non-executive director retainers
   28 Committee member retainers
   28 Board and committee meeting fees
   29 Board chair compensation
   30 Growth trends in board chair compensation
   31 Lead director compensation
   31 Committee chair compensation
   32 Compensation for special board work and travel
33   Board Organization, Process and Policies
     33 Board size
     34 Board committees
     35 Board and committee meetings
     35 Attendance at board and committee meetings
     36 Board and non-executive director performance evaluations
     37 Share ownership requirements for non-executive directors
     37 Majority voting for non-executive directors
     38 Policies for interlocking directorships and limits on board service
     38 Retirement practices for non-executive directors
     39 Shareholder advisory votes on executive compensation
42 Comparative Board Data
About the Canada Spencer Stuart Board Index
For 25 years, Spencer Stuart has been analyzing the governance practices of a representative sample of 100
of Canada’s largest publicly traded companies, with annual revenues exceeding $CAD $1 billion. The
Canada Spencer Stuart Board Index continues to provide benchmarks, insights and trends for board
composition, non-executive director compensation and board process and organization for this index of
“blue chip” Canadian companies, referred to as the CSSBI 100.

Methodological notes
Certain terms were abbreviated as follows throughout the CSSBI:

»   Canadian dollars: $CAD
»   U.S. dollars: $U.S.
»   Canada Spencer Stuart Board Index: “CSSBI”
»   Deferred stock units: “DSUs”
»   Environment, health & safety committee: “EH&S”
»   Governance and nominations committee: “Gov/NomCo”
»   Human resources and compensation committee: “HRCC”
»   Management information circular: “Information Circular”
»   Non-executive director: “NXD”

Selection of the CSSBI 100 index of companies
Published company rankings and S&P Capital IQ were used to create the 2020 CSSBI 100 index of
companies. Each of the 100 companies included had revenues of at least $CAD 1 billion, were listed on the
Toronto Stock Exchange and headquartered in Canada.

Sources used to produce the 2020 CSSBI
»   Primary Board Information: Information Circulars, Annual Information Forms and Annual Financial
    Statements, filed with SEDAR (www.sedar.com) from December 2019 to September 2020.
»   Market Data: S&P Capital IQ (www.spglobal.com/en/).

1                                                                                             SPENCER S TUAR T
AB OUT THE C ANADA SPENCER S TUAR T B OARD INDE X

Comparisons between larger and smaller CSSBI 100 companies
To make appropriate comparisons, CSSBI 100 companies were categorized based on revenue: the 57
companies with revenue $CAD 5 billion and higher (referred to as the “larger CSSBI 100”) and the 43
companies with revenues ranging from $CAD 1 billion to $CAD 5 billion (referred to as the “smaller
CSSBI 100”).

Board composition
NXD appointments for the CSSBI 100 were tracked for a twelve-month period (September 1, 2019 to August
31, 2020). Changes in board composition, coming after August 31, 2020, were not reflected in the analyses
presented throughout the CSSBI.

Board representation for women, Indigenous peoples and minorities
Analyses presented in the CSSBI focused on three “designated groups” (women, Aboriginal peoples and
minorities), as defined in the Employment Equity Act of Canada.

Board representation by persons with disabilities could not be measured owing to the lack of data
and disclosure.

Board compensation
All figures appear in $CAD except where noted. Certain board compensation analyses included the value of
equity compensation (e.g., common shares, DSUs). The dollar value of equity, when not disclosed, was
valued using the appropriate market prices for the underlying shares. Board compensation specified and/or
paid in U.S. dollars, which applied to 26 CSSBI 100 companies in 2020, was converted using official
exchange rates for the dates under review.

Editor’s note
While Spencer Stuart makes all reasonable and good-faith efforts to verify and reference the sources of the
information contained in the CSSBI, we do not and cannot guarantee, represent or warrant that the
information provided is complete, accurate or error-free. The information and opinions contained in the
CSSBI have been compiled or arrived at from sources we believe to be reliable, but are made available
without warranty, whether expressed or implied, of any kind. Spencer Stuart shall have no liability of any
type whatsoever to any individual or entity on account of any incompleteness or inaccuracies in the
information used and incorporated into the CSSBI.

2020 C ANADA SPENCER S TUAR T B OARD INDE X                                                                   2

Spencer Stuart Perspective

    A quarter century of the CSSBI
    For 25 years, Spencer Stuart has published the CSSBI, providing in-
    depth analyses and insights on the governance practices of Canada’s
    largest public companies. Over the years, the CSSBI has explored
    topics of critical importance to boards. More recently: CEO
    performance and succession (2017), board chair succession (2017),
    board gender diversity (2013), in addition to highlighting and tracking
    emerging trends in board composition, structure and compensation.
    The insights shared are the product of Spencer Stuart’s decades of
    board advisory, and from the firm’s active thought leadership and
    involvements in the governance arena.

    Spencer Stuart has witnessed the high grading of boards in terms of
    skills and experience and the evolving professionalization of the NXD
    role. The CSSBI has identified fundamental changes in the way boards
    are composed and organized, highlighting what we now regard as
    well-established best practices. Many of the noted improvements and
    innovations originated from inside the board room, with a host of
    external stakeholders providing active impetus and thinking for sound
    and progressive board governance practices.

    2020 was a challenging year…
    Spencer Stuart’s 2020 CSSBI is presented during an extremely
    challenging time for boards and the companies they govern. On what
    would otherwise be an occasion to celebrate and reflect on the 25 years
    of the CSSBI, we would be remiss in not applauding boards and
    management teams for their effectiveness during the ongoing
    pandemic. With the rapid onset and severity of the pandemic, boards in
    Canada (as those globally) were thrust into an unfamiliar crisis role,
    helping management ensure the safe continuity of business operations
    and delivery of essential products and services. Many sectors and
    companies moved rapidly to protect workplaces and operations,
    pivoted quickly to online operations and services, while others re-tooled
    to produce vital medical equipment and safety gear. In sectors hardest
    hit by the lock downs, forced closures and COVID outbreaks, boards
    and management together, continue to address their operations under
    prevailing conditions and plan for the future.

3                                                               SPENCER S TUAR T
SPENCER S TUAR T PER SPEC TIVE

Board work over the year surely increased in volume and complexity as it
moved to a virtual setting, in which directors seemed to be more
frequently “on call.” There were more special or ad hoc meetings to
address the dimensions and impacts of the evolving pandemic — these
added to “normal” board workloads, committee work and ongoing
board and company business. The setting and pace of board work
changed with the shift to virtual meetings and the immediacy of
enhanced communication and video platforms. These helped boards
interface regularly with management, provide required oversight, track
critical files and advance board-led initiatives, notably CEO succession,
wider leadership development and board succession and renewal.

Despite the challenges imposed by the pandemic, reflecting on the
findings from the 2020 CSSBI, boards continued to execute board
renewal initiatives, increase gender diversification, while facing loud
calls for more representative diversity by Indigenous peoples and
minorities in boardrooms and management teams.

Board succession and renewal continued at a
normal pace
Boards did not hit pause on board succession and renewal activities
amid the disruption caused by the pandemic. There were certainly
delays, but board turnover in the CSSBI 100 remained steady at about
10% and new NXD appointments (95 in 2020) were consistent with
totals in the past five years (see pg. 12). Additionally, a consistent
number of boards in the index (24% in 2020) appointed multiple
NXDs. Cross-border (i.e., non-resident) NXD recruitment was higher
year-to-year (see pg. 19), despite the travel restrictions imposed by the
pandemic. Committee chair rotation progressed, as did board chair
succession at a normal clip, with the selection of mostly internal
successors (see pg. 22).

Boards largely succeeded by adapting and enhancing critical parts of
the board recruitment process. Candidate vetting, assessment and
onboarding, normally focused around in-person committee and board
interviews and other one-on-one engagement, pivoted to a virtual,
online format. In some respects, the virtual platform accelerated parts
of the typical process, but put greater emphasis on the quality of a
board’s candidate assessment (e.g., the depth of referencing,
confidential third-party input) in the absence of normal face-to-face
interaction with candidate prospects.

2020 C ANADA SPENCER S TUAR T B OARD INDE X                                 4
SPENCER S TUAR T PER SPEC TIVE

How to ensure an effective virtual board recruitment process
1. Initial candidate engagement (pre-planning)          2. Initial candidate assessment (format
                                                        and mechanics)
»   Recognize that momentum can build quickly           »   Use more time and different formats (1:1,
    in virtual board recruiting with less                   small panels) to build two-way attraction.
    scheduling delays.                                  »   For committee interviews, prepare questions
»   Capitalize on the opportunity to move quickly,          in advance to structure discussions.
    particularly with high-demand candidates.           »   Appoint moderator to direct Q&A.
»   Assemble and share a comprehensive                  »   Pre-test video to ensure optimal quality
    information package with candidates.                    of interaction.
»   Review public or company videos (where              »   Create a separate communications link between
    available), to gain a sense of candidates’              the committee members to facilitate private
    style before interviews.                                interaction during interview (e.g., text, IM).
»   Stage video meetings with candidates to             »   Consider using a culture diagnostic tool (e.g.,
    prepare for interviews, field questions,                Spencer Stuart’s proprietary suite of assessment
    provide details on the interview format,                tools) to assess candidate fit with board culture.
    insights on participants.

3. Final assessment (building rapport,                  4. Onboarding (integration, ensuring a
enhanced due diligence)                                 lasting fit)
»   Maintain momentum for highest                       »   Share key documents (e.g., strategic
    priority candidates.                                    plans, financials).
»   Appoint smaller groups to conduct                   »   Schedule 1:1 video call with each member of
    deeper assessments.                                     the executive team and other key constituents.
»   Involve CEO in interviews.                          »   Appoint a senior board member to help
»   Prepare candidate specific questions                    accelerate onboarding and mentor new
    in advance.                                             director (e.g., prepare before and debrief
                                                            after each board meeting).
»   Identify concerns or potential recruitment
    issues to explore during subsequent interviews      »   Consider external cohort program for
    and referencing with third parties.                     continued learning (e.g., Spencer Stuart’s
                                                            New Director Program).
»   Continue to assess for board culture fit while
    also cultivating candidates and building rapport,
    chemistry (e.g., virtual social event).

5                                                                                                   SPENCER S TUAR T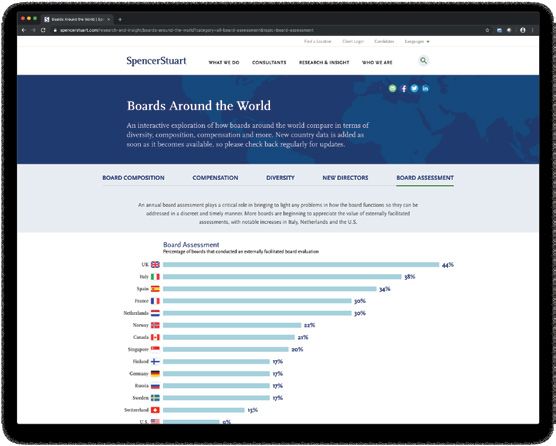
SPENCER S TUAR T PER SPEC TIVE

Board succession in constant motion
Board succession planning requires a careful balance and consideration of needs. Boards need the right mix
of skills and experiences, diversity of backgrounds and perspectives and the enterprise knowledge that comes
from more tenured directors. The market is constantly looking for evidence of ongoing renewal, diversification
— in the broadest sense — and engaged board members. The succession process is in constant motion as
directors retire and company strategies evolve, while recognizing that new director specifications need to
“work harder” across a board’s skills matrix. In other words, new board members should be able to contribute
beyond a narrow function or area of expertise, given the limited size of boards and the breadth required to
handle the complexities of committee work.

Over the past five years, when CSSBI 100 boards turned over by about half, incoming directors were roughly
balanced between industry experts and those from other industries. Within these numbers, there has been
consistent emphasis on CEO and C-level leadership, financial expertise and international experience. Our
2020 analyses also show a steady demand for board members with cutting-edge technology and digital
capabilities, often to support a transformation strategy. (see pg. 13). This is further evidence of boards
adapting, while their companies undergo rapid change or face disruptive, technology-driven competition. Our
analyses also show a continued openness to first-time public company directors, with many new NXD recruits
being active executives and less seasoned functional experts. However, we are yet to see an influx of younger
(
SPENCER S TUAR T PER SPEC TIVE

                                 Expanding board diversity for Indigenous
                                 peoples and minorities
                                 Diversity and inclusion (“D&I”) hit the board agenda in Canada in
                                 2020. Events south of the border moved north, sparking calls for
                                 action and change. Without exception, the boards of Canadian
                                 companies are being encouraged to be more representative of the
                                 Canadian population, company employees, target customers and
                                 community stakeholders.

                                 Data and analyses from this year’s CSSBI underlines the opportunity.
                                 In 2020, 7% of all CSSBI 100 directorships were held by Indigenous
                                 peoples and/or minorities. Many of these directors, based on Spencer
                                 Stuart’s in-depth analysis of designated groups in Canada1 were
                                 concentrated on a smaller number of boards, leaving many in the
                                 CSSBI 100 index without such diverse representation. The overall total
                                 is consistent with recent NXD appointment trends, where less than
                                 10% of incoming NXDs were Indigenous peoples and/or minorities.
                                 Interestingly, nearly 60% of these NXD appointments, in the past five
                                 years, were non-residents of Canada (see pg. 18). Additionally, board
                                 targets for these designated groups, like those used by over half of
                                 boards in the CSSBI 100 index to increase gender diversity, are still
                                 emerging as a stated board succession practice.

                                 Heightened scrutiny, the potential for forced quotas, has clearly
                                 elevated the opportunity with boards and the committees responsible
                                 for board succession. The priority is certainly being emphasized in our
                                 work with boards, especially for specifications calling for “made in
                                 Canada” solutions, and with a lens on younger profiles, entrepreneurs
                                 and prospects outside of mainstream networks.

                                 In our work with boards, we encourage a pragmatic approach,
                                 factoring board requirements, Canadian demographics and prospect
                                 availability, amid a competitive market. At times, boards may need to
                                 expand their functional criteria and embrace non-typical and/or
                                 younger, less seasoned candidates. Some may be skeptical of a board
                                 role, and will want to understand how they fit the specification and the
                                 contribution expected. Having a clear and compelling for reason for
                                 the approach is paramount.

                                 1
                                     See explanatory note on pg. 2.

7                                                                                            SPENCER S TUAR T
SPENCER S TUAR T PER SPEC TIVE
To help ensure that different perspectives are integrated into the boardroom, here are six actionable steps
boards can take to begin the process of becoming more diverse and inclusive (adapted for Canadian boards
from Spencer Stuart’s U.S. Board Diversity Snapshot):
1. Diversity is more than a numbers game — create and promote an inclusive culture
in the boardroom
Boards should ensure boardroom policies and procedures reflect an inclusive culture of trust, belonging and
respect for all perspectives by creating an environment in which all directors are encouraged to participate and
suggest ideas. To help create this environment, boards can provide a robust onboarding program for all first-
time directors to help them get comfortable in the new role.
» Ask: How does the board define its culture and is it where it needs to be in terms of inclusiveness?
» Ask: Who is our board culture going to attract?
» Ask: What is the board’s working definition of inclusiveness?
2. Use the annual assessment process to evaluate the board’s contribution, drive
refreshment and to raise performance
Having the right diverse group of directors on the board is the single most important factor in good
governance. Boards should continually consider whether they have the optimum composition given the
company’s strategic direction, and regularly evaluate the contributions of individual directors as part of the
board effectiveness assessment. The annual assessment process serves as a mechanism for surfacing and
addressing issues and can be a catalyst for refreshing the board as new needs arise.
» Ask: What are the costs of our status quo?
» Ask: What skill sets are we missing given our future strategy?
» Ask: Does the annual assessment include an evaluation of diversity on elements beyond skills and
qualifications? Is it also about gender, race/ethnicity?
3. Elect board leadership who understand how to and want to drive diversity
and inclusion
Every board member influences the progress of D&I in the boardroom; however board chairs and Gov/
NomCo/HRCC chairs have the most direct impact given their role and influence on future board
composition, serving as champions for greater diversity and to provide the appropriate oversight over D&I
in the organization.
» Ask: Do we embrace the importance of board refreshment?
» Ask: Is our board and committee aligned on the prioritization of having diverse directors?
» Ask: Is board composition a high priority for our chair?
2020 C ANADA SPENCER S TUAR T B OARD INDE X 8SPENCER S TUAR T PER SPEC TIVE
4. Accountability is key: What isn’t measured, isn’t managed
Just as they hold the CEO and management team accountable for developing and measuring the progress
of D&I initiatives throughout the entire organization, boards can also take concrete measures to set the
tone at the top by improving their own reporting. They should expect that investors, regulators and
governance and diversity advocates will continue to press for more disclosure about the diversity of the
board. Boards can get ahead of the curve by telling their diversity story affirmatively with all its multi-
dimensional nuances.
» Ask: Is the board disclosing its diversity metrics fully to investors?
» Ask: Are we overseeing D&I metrics throughout the whole organization?
» Ask: How can we enhance our oversight of D&I metrics?
5. Reassess search approaches and criteria
Boards should recognize the potential weaknesses in traditional networking as a recruiting strategy and
seek opinions and recommendations from a wide range of stakeholders. In addition, since fewer executives
from designated groups are in typical C-suite roles, boards should be open to candidates with other
backgrounds, such as entrepreneurs and professionals. Moreover, having a disciplined research-based
approach to board identification and a longer recruiting timeline will allow boards to develop a more
thorough approach to pipeline talent mapping, improving coverage of newer networks beyond the board
itself.
» Ask: Are we engaging outside help to expand our reach and ability to increase our diverse
candidate pool?
» Ask: Are we developing a pipeline?
» Ask: What diverse members of the management team can we get to know better?
» Ask: Are members of the board engaging directly with investors?
6. Avoid defining seats as “diverse”
As boards begin and continue to diversify, it is important for all directors to recognize their own biases and
avoid viewing diversity as a check-the-box response to external pressure or as filling the gaps. Building and
maintaining a diverse board is an ongoing initiative. Boards that are most successful will embrace a
mindset that views every director search as an opportunity to enhance boardroom diversity and commit to
considering a qualified diverse slate of candidates for every search, rather than viewing diversity in terms of
one or two seats.
» Ask: What are we doing to ensure that diversity is always included as a core part of board refreshment?
» Ask: How will we define diversity for our board?
9 SPENCER S TUAR TSPENCER S TUAR T PER SPEC TIVE
Boards can influence change beyond the boardroom by
providing oversight over management’s diversity efforts
In its oversight role, the board can make sure it understands the CEO’s
vision for D&I at the company, including the diversity of the leadership
pipeline across all dimensions, gender, all designated groups, and
sexual orientation, and the inclusivity of the culture. This includes
having data on the current makeup of the workforce, and which D&I
programs are in place, including employee resource groups and affinity
groups. Board members should understand how the company is
viewed by customers, suppliers, employees, shareholders and the
communities in which it operates, and the degree to which the
management team reflects the diversity of its stakeholders. Directors
also can consider whether compensation plans should include
diversity metrics or goals.
» Ask: What does diversity mean for the company and
what does it mean for us as directors?
» Ask: Are we overseeing D&I metrics throughout the
whole organization?
» Ask: How can we enhance our oversight of D&I metrics?
» Ask: Could including diversity metrics or goals in compensation
plans help us make progress in D&I?
Spencer Stuart has helped boards increase the diversity of perspectives
and backgrounds in the boardroom. We will continue to track trends in
board composition as boards evolve to respond to the changing
demands of their business. With thoughtful intention to increasing
diversity and creating a more inclusive board culture, boards will be
able to shift their composition over time, while ensuring they have the
skills and experience that align with the company’s long-term strategy.
Absent intent, however, no change will happen.
2020 C ANADA SPENCER S TUAR T B OARD INDE X 10Board Composition
Spencer Stuart presents its annual board composition analysis for the CSSBI 100. This analysis highlights
trends in board turnover, the executive and functional experience of incoming NXDs, in addition to
measuring progress boards are making on gender, Indigenous peoples and minority diversity. The
nationalities, age and tenure of CSSBI 100 board members are also explored.
2020 snapshot
95 new NXDs were
appointed in 2020 — a normal
37 %
of NXDs were
non-residents of
influx for the CSSBI 100 Canada, up from
31% in 2019
48 %
of incoming NXDs were
7
of incoming NXDs were
%
women — virtual gender parity either Indigenous peoples
for two consecutive years or minorities
Board turnover and non-executive director appointment trends
Board succession and renewal continued at a normal pace
» Despite the obstacles presented by the global pandemic, CSSBI 100 board recruitment and turnover for
2020 was much the same as prior years. Ninety-five new NXDs were appointed to CSSBI 100 boards
during the twelve months of tracking (one higher than the same period in 2019), and turnover remained
at close to 10% across the CSSBI 100 (factoring an average board size of 11).
» New NXDs were appointed by 59 different CSSBI 100 boards in 2020, mostly as replacements for retiring
board members on a one-to-one basis. Close to half of these boards appointed two or more new NXDs.
11 SPENCER S TUAR TB OARD COMP OSITION
» CSSBI boards succeeded in their ongoing board recruitment and succession activities by adjusting critical
parts of the board recruitment process in response to the travel bans imposed by the global pandemic.
Candidate vetting, assessment and onboarding, normally structured around in-person board and
committee level interviews and other one-on-one engagement, switched to a virtual, online format.
Annual NXD Appointments to Boards of CSSBI 100 Companies (2016 to 2020)
2020 95
2019 94
2018 98
2017 95
2016 93
Average 95
Boards continued to refresh
» Two or more NXDs were appointed by nearly one-quarter (24%) of CSSBI 100 boards, as many continued
to refresh their ranks — mostly as part of planned board succession and renewal initiatives.
» The number of boards in the CSSBI 100 appointing multiple directors has remained at about 25% of the
index in the past five years.
Boards of CSSBI 100 Companies that Appointed Multiple NXDs (2016 to 2020)
2020 2019 2018 2017 2016 Average
2 NXDs appointed 15 13 23 16 18 17
3 NXDs appointed 7 11 2 6 5 6
4 or more NXDs appointed 2 0 3 2 2 2
Total 24 24 28 25 25 25
2020 C ANADA SPENCER S TUAR T B OARD INDE X 12B OARD COMP OSITION
Boards continued to bulk up on financial expertise in 2020; NXDs with technology
backgrounds were about level year-to-year
» In 2020, 46% of all incoming NXDs had financial backgrounds (relevant functional experience and/or
credentials), up from 41% in 2019. New recruits with financial expertise have consistently represented a
large portion of new board members (40%, on average, over the past five years), given the financial
skills required by the boards of CSSBI 100 companies to address challenging markets, emerging
transactions, company investments, stringent financial oversight requirements and, presently, the
impact of the ongoing global pandemic.
» Audit committee leadership succession also underlies the consistently high demand for new NXDs with
financial expertise.
» Incoming NXDs with core backgrounds in technology (e.g., AI, cyber security, data analytics, enterprise
applications, IT platforms) were about level with the total in 2019.
Core Functional Backgrounds of NXDs Appointed to the Boards of CSSBI 100 Companies
(2016 to 2020)
Functional background 2020 2019 2018 2017 2016
Financial 46% 41% 38% 39% 36%
Operations 27% 17% 29% 32% 26%
Legal/regulatory 8% 12% 17% 6% 19%
Sales & marketing 8% 10% 9% 15% 2%
Technology 7% 9% 6% 4% 6%
Human resources 2% 3% 0% 1% 3%
Other 0% 3% 1% 3% 8%
Boards continued to emphasize related industry experience in NXD specifications
» In 2020, 74% (or almost three in four) of new NXDs appointed by CSSBI 100 boards had related
industry experience (i.e., experience in the company’s industry or an allied sector).
» In the last two years, CSSBI Boards added more related industry experience, after a period (2016 to 2018)
when appointments were almost balanced with new NXDs with backgrounds in a different industry.
Appointments of NXDs with Related and Different Industry Experience
(as a % of all NXDs appointed, 2016 to 2020)
2020 2019 2018 2017 2016 Average
Related industry experience 74% 67% 55% 54% 49% 60%
Different industry experience 26% 33% 45% 46% 51% 40%
13 SPENCER S TUAR TB OARD COMP OSITION
Appointments of non-executive directors with CEO experience
Steady influx of recruits with CEO experience; portion from Canada reached
a five-year low
» In 2020, 36% of all NXDs appointed by CSSBI 100 boards had CEO experience (i.e., with a public
company or other organization of some scale).
» The portion resident in Canada reached a five-year low in 2020, as non-residents comprised a large
(41%) proportion of new NXDs with CEO experience.
» The limited domestic supply of available prospects with CEO experience (especially those in active
public company roles), and the interest by CSSBI 100 boards in other backgrounds, helps to explain the
totals in recent years.
Appointments of NXDs with CEO Experience to the Boards of CSSBI 100 Companies
(as a percentage of all NXDs appointed, 2016 to 2020)
2020 2019 2018 2017 2016 Average
Overall 36% 31% 33% 35% 44% 36%
% Non-residents of Canada 41% 21% 38% 39% 37% 35%
Board representation for women, Indigenous peoples and minorities
Appointments of women and men were virtually equal in 2020; more women were
recruited from outside Canada
» Women comprised 48% of all NXD appointments in 2020 — virtual gender parity for the second
consecutive year. Notably, 10 CSSBI 100 boards appointed multiple women in 2020, which was double
the norm.
» These results stem from the prioritized and sustained efforts of many CSSBI 100 boards to identify and
recruit more women, including a sizable portion each year (approximately one-third on average) from
outside Canada.
» In 2020, the portion of women not resident in Canada (37%) reached a five-year high.
Women NXDs Appointed by CSSBI 100 Boards
(as a percentage of all NXDs appointed, 2016 to 2020)
2020 2019 2018 2017 2016 Average
Overall 48% 49% 30% 40% 41% 42%
% Non-residents of Canada 37% 28% 31% 32% 32% 32%
Number of CSSBI 100 boards that
10 5 3 6 5 5
appointed multiple women
2020 C ANADA SPENCER S TUAR T B OARD INDE X 14B OARD COMP OSITION
Smaller age difference between recently appointed men and women NXDs
» The age gap between newly appointed women and men has narrowed in the last two years. In 2020 and
2019, the gap was one-to-two years, as CSSBI 100 boards appointed more seasoned women. The age
gap was three years from 2016 to 2018.
Average Ages of Incoming NXDs to the Boards of CSSBI 100 Companies
(men compared to women, 2016 to 2020)
2020 2019 2018 2017 2016 Average
Men 59 59 59 58 58 59
Women 57 58 56 55 55 56
Women board representation continued to tick higher
» In 2020, women held close to one-third (31%) of total CSSBI 100 board directorships, for an average of
close to three women per board across the entire CSSBI 100. The total increases to 35% excluding
management directors.
» Compared to 2014, the total share of directorships held by women in 2020 was close to 50% higher, as
more women joined the ranks of CSSBI 100 boards.
» The gap in women director representation between the larger and smaller CSSBI 100 (as much as five
percentage points in 2018) has narrowed to two percentage points in the past two years.
Percentage all CSSBI 100 Board Directorships Held by Women (2014 to 2020)
2020 2019 2018 2017 2016 2015 2014 CAGR
Overall 31% 30% 27% 27% 25% 23% 21% 6.71%
More than $5 billion 32% 30% 29% 29% 26% 24% 22% 6.44%
$1 billion to $5 billion 30% 28% 24% 25% 23% 21% 19% 7.91%
Scale tipping toward more gender balanced boards among Canada’s “blue chips”
» In 2020, women held at least 30% of directorships at close to two-thirds (62%) of the boards in the
CSSBI 100 index, over four times more than in 2014.
» Two CSSBI 100 boards were gender balanced (50% men and 50% women) in 2020 and 18 others were
one-to-two additional women from reaching that level.
15 SPENCER S TUAR TB OARD COMP OSITION
Percentage of Women on Boards of CSSBI 100 Companies (2020 compared to 2014)
CSSBI 100 boards in this range
% of women on board 2020 2014
0% 0% 10%
1% to 9% 1% 5%
10% to 19% 8% 41%
20% to 29% 29% 30%
30% to 39% 42% 12%
40% to 49% 18% 2%
50% 2% 0%
Transportation and financial services boards were the most gender diverse
» Boards of CSSBI 100 companies in the transportation and financial services sectors were the most gender
diverse in 2020 — both groups were nearing a 40% sector average for women board representation.
CSSBI 100 Board Gender Diversity by Industry
Average representation Number of companies with
CSSBI 100 industry groups
of women 30% or more women on board
Transportation (n=7) 35% 6
Financial services (n=15) 35% 11
Energy (n=18) 33% 12
Industrials (n=24) 31% 15
Communications, media and technology (n=15) 29% 7
Consumer (n=14) 28% 7
Mining and metals (n=7) 28% 4
Board gender diversity targets were common; most existing targets were achieved or
surpassed as of 2020
» As of August 2020, just over half (51) of CSSBI 100 boards had established a minimum gender diversity
target (an increase of 10 boards compared to 2017). Targets ranged from 20% to 50% with 30% being
the most common by a wide margin.
» For most boards (40 of 51), the target applied to the full board; for the other 11 boards, the target applied
to independent/non-executive board members.
» Most (73%) of the boards with targets had either achieved or surpassed them as of August 31, 2020.
2020 C ANADA SPENCER S TUAR T B OARD INDE X 16B OARD COMP OSITION
Board Gender Diversity Targets in the CSSBI 100
Number of CSSBI 100 boards Board gender diversity target
4 20%
4 25%
1 27%
32 30%
5 33.3%
3 40%
2 50%
Women landing more board leadership positions
» In 2020, women held a total of 143 board leadership positions (board chair or vice chair, lead director
and/or committee chair), close to 60 more than in 2016.
» Compared to 2016, there were more than double the number of women serving in the highest board
leadership positions (board chair, vice-chair, lead director). Given active chair rotation practices, there
were also large increases in the number of women chairing other core standing committees (e.g., Audit,
Gov/NomCo, HRCC).
Women Serving in Board Leadership Roles on CSSBI 100 Boards (2016 to 2020)
2020 2019 2018 2017 2016
Board chairs, vice-chairs and
17 15 14 8 7
lead directors
Audit chairs 30 29 28 20 22
Gov/NomCo chairs 35 28 24 20 20
HRCC chairs 29 30 25 14 20
EH&S chairs 13 12 10 4 7
Other committee chairs 19 13 10 10 9
Totals 143 127 111 71 85
Expanding board diversity for Indigenous peoples and minorities
» Without exception, the boards of CSSBI 100 companies are being encouraged to be more representative
of the Canadian population, company employees, target customers and/or broader business and
community stakeholders.
» In 2020, 7% of all CSSBI 100 directorships were held by either Indigenous peoples or minorities,
following definitions in the Employment Equity Act of Canada for designated groups.1 The overall total is
also consistent with NXD appointment trends over the past five years, based on Spencer Stuart’s in-
depth analysis.
» Interestingly, close to 60% (on average) of the NXDs from these designated groups were non-residents
of Canada.
1 See explanatory note on pg. 2.
17 SPENCER S TUAR TB OARD COMP OSITION
Appointments of Indigenous Peoples and Minorities to the Boards of CSSBI 100 Companies (as a
percentage of all NXDs appointed, 2016 to 2020)
2020 2019 2018 2017 2016 Average
Overall 7% 4% 9% 7% 5% 7%
% Non-residents of Canada 63% 50% 75% 43% 60% 58%
Appointments of first-time public company directors
Continued openness to prospects without prior public company board experience
» First-time public company directors comprised almost one-third (32%) of incoming NXDs to CSSBI 100
boards in 2020. The total was the same as in 2019 and consistent with recent trends.
» Effective onboarding, development and mentorship by the board chair and other seasoned directors take
on even greater importance with a “first-time” director and/or a less seasoned executive.
Appointments of First-Time, Public Company Directors to the Boards of CSSBI 100 Companies
(as a percentage of all NXDs appointed, 2016 to 2020)
2020 32%
2019 32%
2018 28%
2017 33%
2016 34%
Average 32%
Non-executive directors recruited from outside Canada
Cross-border director recruitment rebounded in 2020
» The number of cross-border recruits (i.e., non-residents of Canada) returned to a normal level in 2020,
after dipping in 2019. Despite the travel restrictions imposed by the global pandemic, non-residents of
Canada comprised 37% of all NXDs appointed by CSSBI 100 boards, up from 31% in 2019.
» CSSBI 100 boards have been fulfilling many of their functional and industry requirements by recruiting
board members from outside Canada. Most (89%) of these directors were recruited from the U.S., given
the market’s importance, proximity and the depth of prospects.
2020 C ANADA SPENCER S TUAR T B OARD INDE X 18B OARD COMP OSITION
Non-Residents of Canada appointed to the Boards of CSSBI 100 Companies
(as a percentage all NXDs appointed annually, 2016 to 2020)
2020 37%
2019 31%
2018 42%
2017 39%
2016 37%
Average 37%
Total board seats held by non-residents hovering around 30%
» In 2020, close to 30% of all CSSBI 100 directorships were held by non-residents of Canada. The total has
been hovering around the one-third mark, after ticking up steadily from 21% in 2011.
Total CSSBI 100 Board Directorships Held by Non-Residents of Canada (2011 to 2020)
60%
40%
29% 30% 28%
25% 25% 26% 27%
22 % 23%
21%
20%
0%
2011 2012 2013 2014 2015 2016 2017 2018 2019 2020
19 SPENCER S TUAR TB OARD COMP OSITION
Appointments of active (non-CEO) executives
Supply constraints for active C-level executives for board roles
» Active C-level (non-CEO) executives have typically represented a smaller proportion of new NXDs
appointed by CSSBI 100 boards. The total in 2020 (14%) was the lowest total in five years.
» Boards are often interested in this “next-gen” pool of directors; however, not all are ready, free of
conflict or have clearance to serve on a public company board, making this a challenging pool from
which to recruit.
» Also, CSSBI boards expect their NXDs to serve a normal tenure (approximately 10 years) and are
mindful when considering younger, active executives who could be forced to retire earlier than desired
should their work/company circumstances change.
Active (Non-CEO) Executives Appointed to the Boards of CSSBI 100 Companies
(as a percentage of all NXDs appointed, 2016 to 2020)
2020 14%
2019 15%
2018 23%
2017 17%
2016 23%
Average 18%
Board chair backgrounds, independence and succession
Board chairs credentials
» CSSBI 100 board chairs, upon selection to their roles, often had prior large company CEO and board
chair experience. In addition, many had prior career/executive experience in the company’s industry.
» Most (84%) of the board chairs were Canadians and residents of Canada, given that knowledge of, and
presence in, the domestic market is a prerequisite for most boards.
2020 C ANADA SPENCER S TUAR T B OARD INDE X 20B OARD COMP OSITION
Backgrounds of Board Chairs of CSSBI 100 Companies in 2020*
84%
55% 59%
47 %
Prior Large Prior Large Experience Canadian
Company Company Board in the Company’s and Resident
CEO Experience Chair Experience Industry in Canada
*
Analysis consists of 64 non-executive board chairs; excludes those serving as CEO or executive chair and company founders and/or former CEOs.
More independent board chairs in 2020
» Most (85%) of CSSBI 100 companies separated the roles of board chair and CEO, a long-standing
governance practice among Canada’s large public companies.
» Almost three-quarters (72%) of the non-executive board chairs were independent in 2020, an increase of
six percentage points compared to 2015.
Independence of Non-Executive Board Chairs at CSSBI 100 Companies
2020 (n=85) 2015 (n=88)
Independent 72% 66%
Non-independent 28% 34%
Internal board chair successors still the clear choice
» Board chair transitions in the CSSBI (12 in 2020) returned to an average level, after a five-year high of 17
in 2019.
» Internal successors (as in prior years) were chosen in most (10 of 12) of the transitions in 2020, a clear
sign that boards of Canada’s largest companies emphasize company knowledge and board continuity.
» Internal successors had an average of six years of tenure before assuming the role (typically as part of
an internal succession and assessment process), and most had prior committee chair experience, either
with the board or that of a different public company.
» In the past five years, well over half (59) of CSSBI 100 boards selected a new board chair, representing
substantial change in this critical board leadership role.
» Term limits for board chairs were disclosed by eight CSSBI 100 boards in 2020. The limits (either five or
eight years) were typically applied regardless of age, length of tenure or term on the board as director,
and could be renewed at the board’s discretion.
21 SPENCER S TUAR TB OARD COMP OSITION
Board Chair Transitions at CSSBI 100 Companies (2016 to 2020)
2020 2019 2018 2017 2016 Total Average
Annual total 12 17 12 14 4 59 12
Internal successors 10 of 12 14 of 17 9 of 12 12 of 14 4 of 4 49 of 59 10 (83%)
Tenures and ages of non-executive directors and board chairs
Significant board turnover in past five years
» Over half (52%) of NXDs serving on the CSSBI 100 in 2020 had five or less years of tenure, a clear sign
of active board succession and substantial board refreshment.
» Board leadership in the CSSBI 100 has also been refreshed to a large degree. Close to 60% of CSSBI 100
board chairs had five or less years of tenure serving in the role.
Tenures of CSSBI 100 NXDs and Board Chairs (2020)
0 to 5 years 6 to 10 years 11 to 15 years More than 15 years
All non-executive board directors 52% 25% 13% 10%
Board chairs *
56% 23% 10% 11%
*
Tenure serving in the role; excludes those also serving in CEO or executive chair roles.
Seasoned executives still held the vast number of board seats
» Close to three-quarters (71%) of all NXDs in the CSSBI 100 were in the 60 to 79 age range.
» The total in the 30 to 49 age range was still small, as CSSBI 100 boards continued to select more
seasoned candidates for NXD roles.
Ages of CSSBI 100 NXDs and Board Chairs
30 to 39 40 to 49 50 to 59 60 to 69 70 to 79 80+
2020 2016 2020 2016 2020 2016 2020 2016 2020 2016 2020 2016
Non-executive
1% 0% 3% 5% 24% 29% 53% 43% 18% 16% 2% 2%
board directors
Board chairs,
1% 0% 2% 1% 11% 16% 57% 47% 23% 32% 6% 4%
non-executive
2020 C ANADA SPENCER S TUAR T B OARD INDE X 22B OARD COMP OSITION
Board independence
Board independence increased in 2020, more boards with just a single
non-independent
» The vast majority (81%) of CSSBI 100 board members were independent in 2020, consistent with overall
totals in recent years.
» Over half (52%) of the CSSBI 100 boards had one non-independent director (typically the CEO), an
increase of five boards over 2019, and 23 others had two non-independents, an increase of four boards
over 2019.
» Higher concentrations of non-independent directors (ranging from three to seven members) could be
found on the boards of 25 (often closely held) CSSBI 100 companies.
Non-Independent Directors on the Boards of CSSBI 100 Companies
Number of boards
Number of non-independent directors *
2020 2019
One 52 47
Two 23 27
Three 10 10
Four 5 6
Five 4 5
Six 3 3
Seven 3 2
*
As defined by the Canadian Securities Administrators (CSA).
23 SPENCER S TUAR TBoard Compensation
Spencer Stuart presents its annual review of board compensation and related practices at CSSBI 100
companies. Benchmarks and trends are provided for director retainers, chair compensation, fees for
meetings, committees and equity compensation. All figures are in $CAD unless otherwise noted.
2020 snapshot
$227,000
Total NXD compensation
$400,000
Total Board Chair
(median, including equity) compensation (median,
including equity)
3.8% increase over
2019 (on a constant
1.4% increase over
2019 (on a constant
company basis) company basis)
Mining and metals
22 %
of CSSBI 100
industry led all sectors
in total NXD compensation:
companies paid per
meeting fees, down
from 50% in 2016
$273,729
(median, including equity)
Non-executive director compensation in 2020: Pay practices, components
and benchmarks
Reviewing and setting annual NXD compensation
» Based on disclosure, CSSBI 100 boards generally review board compensation every one-to-two years.
In 2020, almost every CSSBI 100 company disclosed the peer-group that was used to develop and
to set compensation levels for the board. The peer groups were often the same for executive and
board compensation.
2020 C ANADA SPENCER S TUAR T B OARD INDE X 24B OARD COMPENSATION
Currency Pay Practices Used by CSSBI 100 in 2020
Currency pay practices Number of CSSBI 100 companies
Board compensation specified and paid in $CAD 55
Board compensation specified and/or paid in $U.S. 26
Nominal compensation practice (e.g., NXDs not resident in Canada paid in
19
$U.S., based on a one-for-one exchange rate of $CAD to $U.S.)
Components of CSSBI 100 NXD Compensation in 2020
Annual NXD retainer Committee member
Board meeting fee Committee meeting fee
(including equity) retainer
Median $200,000 $7,500 $2,000 per meeting $2,000 per meeting
Percentage of companies
N/A 57% 21% 22%*
paying retainer/fee
*
One CSSBI company paid fees exclusively for committee meetings.
Median Total CSSBI 100 NXD Compensation in 2020
Overall More than $5 billion (n=57) $1 billion to $5 billion (n=43)
Median total compensation $227,000 $245,000 $174,500
Equity 50% 50% 50%
Cash 50% 50% 50%
Range of Total CSSBI 100 NXD Compensation in 2020
Percentile Total director compensation
1st Percentile $91,286
25th Percentile $157,831
50th Percentile $235,815
75th Percentile $272,153
99th Percentile $468,696
Growth trends in non-executive director compensation
Slow growth period for board compensation; pandemic prompted some pay
cuts in 2020
» Median total NXD compensation (for the constant set of 86 CSSBI 100 companies) increased by 3.8%
over 2019. The year-to-year increase was in line with compensation growth seen since 2016.
» Notably, some boards announced temporary cuts to NXD compensation (one board by as much as
50%) as part of its pandemic response. Most director compensation plans, however, were finalized and/
or disclosed to the market before the full effects of pandemic were felt; further reductions in NXD
compensation could be announced in 2021.
25 SPENCER S TUAR TB OARD COMPENSATION
Median Total NXD Compensation for the Constant Set of 86 CSSBI Companies (2016 to 2020)*
2020 2019 2018 2017 2016 CAGR
$216,000 $208,000 $201,000 $197,000 $185,000 3.95%
*
Figures for this analysis were sourced from S&P Capital IQ. Annual totals were based on nominal $CAD and $U.S. to remove the effect of
fluctuating exchange rates over the time period. Includes all forms of director compensation (including equity and applicable dividends,
compensation for travel) and excludes amounts paid to board chairs and lead directors. The total for 2020 reflects changes (increases or
decreases) made by individual CSSBI 100 companies, as disclosed in Information Circulars or disclosed confidentially to Spencer Stuart as part of a
data validation process.
Compensation growth slightly higher at larger companies
» Since 2016, annual compensation growth was approximately one percentage point higher at the larger
CSSBI 100 companies (4.35% compared to 3.32% for the smaller set of companies, as measured
annually in the constant set of 86 CSSBI 100 companies).
Median Total NXD Compensation for the Constant Set of 86 CSSBI Companies
(smaller compared to larger companies, 2016 to 2020)*
Number of companies 2020 2019 2018 2017 2016 CAGR
$1 billion to $5 billion 35 $196,000 $195,000 $189,000 $184,000 $172,000 3.32%
More than $5 billion 51 $230,000 $217,000 $210,000 $206,000 $194,000 4.35%
*
Figures for this analysis were sourced from S&P Capital IQ. Annual totals were based on nominal $CAD and $U.S. to remove the effect of
fluctuating exchange rates over the time period. Includes all forms of director compensation (including equity and applicable dividends,
compensation for travel) and excludes amounts paid to board chairs and lead directors. The total for 2020 reflects changes (increases or
decreases) made by individual CSSBI 100 companies, as disclosed in Information Circulars or disclosed confidentially to Spencer Stuart as part of a
data validation process.
Total non-executive director compensation by industry
Increases in NXD compensation varied across industries
» Increases in annual board compensation (by industry) ranged from a high of 7.6% for boards in the
energy sector (encompassing utilities and oil & gas) to a low of 1.1% in the industrials group.
» In 2020, median total NXD compensation in the mining and metals industry was the highest by a
large margin.
Median Total CSSBI 100 NXD Compensation by Industry
Median total compensation (2020) % change from 2019
Mining and metals $273,729 5.2%
Energy $238,535 7.6%
Financial services $235,846 4.6%
Communications, media and technology $232,447 1.8%
Transportation $199,630 1.5%
Consumer $188,282 6.6%
Industrials $182,990 1.1%
2020 C ANADA SPENCER S TUAR T B OARD INDE X 26B OARD COMPENSATION
Annual non-executive director retainers
Annual NXD retainers balanced equally with cash and equity
» In 2020, median annual NXD retainers were balanced equally with cash and equity, irrespective of
company size.
» Most annual NXD retainers (86%) in CSSBI 100 were paid with a mix of cash and long-term equity.
Equity portions ranged from a low of 10% to a high of 100% of the annual director retainer.
» It was also common for NXD compensation to be paid in equity until the company’s minimum share
ownership requirement had been met.
Median CSSBI 100 NXD Retainers in 2020
Median retainer Equity Cash
Overall $200,000 50% 50%
More than $5 billion (n=57) $220,000 50% 50%
$1 billion to $5 billion (n=43) $170,000 50% 50%
Distribution of Annual CSSBI 100 NXD Retainers in 2020 (including equity)
Percentile Annual director retainer
1st Percentile $63,176
25th Percentile $137,500
50th Percentile $200,000
75th Percentile $230,000
99th Percentile $369,857
Equity Compensation Practices for NXDs of CSSBI 100 companies
» 86 CSSBI 100 companies required their NXDs to accept some form of equity (typically common shares
and/or DSUs, with long-term holding requirements) as part of their annual compensation.
» 77 granted equity based on a pre-set fraction of the overall retainer.
» 9 granted equity at market value (e.g., 2,000 common shares issued on a certain day).
» None granted share options, as part of a regular annual board compensation schedule.
» 93 permitted NXDs to elect equity in lieu of cash compensation.
27 SPENCER S TUAR TB OARD COMPENSATION
Committee member retainers
Committee retainers were still common, audit members often received higher amounts
» Additional retainers for committee memberships were paid by 57% of CSSBI 100 companies in 2020,
nine less compared to 2016.
» Over half of these companies (34) paid a uniform retainer and a slightly lower number (22) paid a
variable amount for service on different committees. Higher amounts continued to be paid to audit
committee members.
» At one company, only audit committee members received a retainer. This continued to be an uncommon
practice amongst CSSBI 100 companies.
Committee Member Compensation Practices for the CSSBI 100 (2020 compared to 2016)
2020 2016
Companies that pay committee retainers 57 66
Uniform committee member retainer 34 34
Variable committee member retainers 22 28
Audit members only 1 4
Committee Member Retainers for the CSSBI 100 (2020 compared to 2016)
2020 2016
Committee Median Range Median Range
Audit $10,000 $2,000 to $55,000 $6,000 $1,085 to $55,000
Gov/NomCo $7,500 $2,000 to $55,000 $5,000 $1,085 to $55,000
HRCC $7,500 $2,000 to $55,000 $5,000 $1,500 to $55,000
Board and committee meeting fees
Meeting fees continued to be phased out in favour of flat fee model
» Meeting fees were paid by less than one-quarter (22%) of CSSBI 100 companies in 2020, a steep drop
from 2016 when 51% of the index still followed the practice.
» An increasing number of CSSBI 100 companies have been adopting a simpler flat fee model that is
inclusive of meetings.
» Median per meeting fees, when paid, were slightly higher in 2020 compared to 2016.
2020 C ANADA SPENCER S TUAR T B OARD INDE X 28You can also read