Policy brief 76 July 6, 2020 - Firm liquidity and solvency under the Covid-19 lockdown in France - l'OFCE
←
→
Page content transcription
If your browser does not render page correctly, please read the page content below
policy brief
                                                                                                   76 ⎜July 6, 2020

Firm liquidity and solvency under the Covid-19
lockdown in France
Mattia Guerini, Lionel Nesta, Xavier Ragot, Stefano Schiavo
Sciences Po, OFCE

M. Guerini : GREDEG, CNRS &
University Côte d'Azur. Sciences Po,
                                        We simulate the impact of the Covid-19 crisis on corporate solvency using a sample
OFCE.                                   of around one million French nonfinancial companies, assuming they minimize
L. Nesta : GREDEG, CNRS &               their production costs in the context of a sharp drop in demand.
University Côte d'Azur. Sciences Po,
OFCE. SKEMA Business School.
                                        We find that the lockdown triggers an unprecedented increase in the share of
X. Ragot : Sciences Po, OFCE &
CNRS.                                   illiquid and insolvent firms, with the former more than doubling relative to a No-
S. Schiavo : University of Trento,      Covid scenario (growing from 3.8% to more than 10%) and insolvencies increasing
Italy & Sciences Po, OFCE.
                                        by 80% (from 1.8% to 3.2%).
                                        The crisis has a heterogeneous effect across sectors, firm size, and region. Sectors
                                        such as hotels and restaurants, household services, and construction are the most
OFCE thanks GREDEG (CNRS, Uni-          vulnerable, while wholesale and retail trade, and manufacturing are more resilient.
versité Côte d'Azur) and SKEMA Busi-
ness School for their support. Access   Micro-firms and large businesses are more likely to face solvency issues, whereas
to confidential firm-level data, on     SMEs and medium-large firms display lower insolvency rates.
which this work is based, has been
made possible within a secure envi-
ronment offered by CASD - Centre
                                        The furlough scheme put forward by the government (activité partielle) has been
d'accès sécurisé aux données (Ref.      very effective in limiting the number of insolvencies, reducing it by more than
ANR-10-EQPX-17). Mattia Guerini
acknowledges funding from the EU
                                        1 percentage point (approximately 12,000 firms in our sample).
Horizon2020 program in the context
of the Marie Sklodowska-Curie pro-      This crisis will also have an impact on the overall efficiency of the French economic
ject N. 799412 (ACEPOL).                system, as market selection appears to be less efficient during crisis periods relative
Mattia Guerini has received funding
from the European Union's Horizon       to “normal times”: in fact, the fraction of very productive firms that are insolvent
2020 research and innovation            significantly increases in the aftermath of the lockdown. This provides a rationale
programme under the Marie
Sklodowska-Curie grant agreement        for policy interventions aimed at supporting efficient, viable, yet illiquid firms
No 799412 (ACEPOL).                     weathering the storm. We evaluate the cost of such a scheme aimed at strength-
                                        ening firms' financial health to around 8 billion euros.
2
1. Introduction
The Covid-19 crisis represents an unprecedented shock to the French and to the world
economy. The strict containment measures to limit the pandemic, the subsequent
gradual re-opening, and the ensuing fall in consumption and investment represent a
simultaneous demand and supply shock.
The fall in GDP during the eight weeks of confinement alone is evaluated by OFCE
(2020) to cost 120 billion euros. While the impact on household disposable income is
(at least partly) offset by public measures, such as the partial employment scheme and
the solidarity fund, which nevertheless will lead to a significant increase of public debt,
compensation for loss of business activity is more limited. The loss in added value for
non-financial companies is estimated to go beyond 30% of their pre-shock level.
The subject of this policy brief is to study the impact of the recession induced by the
Covid-19 pandemic on the French productive system. We simulate the impact of the
lockdown on the balance sheet of French non-financial firms, focusing on the emer-
gence of liquidity and solvency issues. Moreover, we document the extent to which
market selection is efficient, that is, the proportion of highly productive firms that
become illiquid and insolvent.
This study does not capture all the problems associated with the lockdown. The fall in
investment in both physical capital and R&D due to uncertainty, or the potential loss of
skills through layoffs can permanently reduce potential GDP, irrespective of number of
firm exits. Similarly, the reduction in the value of companies can have further negative
feedback loops via the financial market. These (longer-term) effects are ignored in this
study, but are by no means irrelevant.
Our work is based on a microsimulation of firms' liquidity and solvency position based
1.
on confidential balance sheet data contained in the FARE dataset.1 Using a sample
FARE contains individual accounting
data (balance sheet and income comprising one a million French non-financial firms, we simulate the impact of sectoral
statement) coming from companies'
tax reports collected by the Ministry
demand shocks on firms' balance sheets in order to estimate the share of companies
of Finance and the French National facing liquidity or solvency issues.
Statistical Institute (INSEE).
2. Firm bankruptcy and economic growth
2.1. The financial health of French firms
Before simulating the effect of the Covid-19 pandemic on firms' balance sheets, it is
worth considering the financial situation of French companies before the crisis. On the
one hand, the amount of liquidity (cash, deposits and money market instruments) has
increased significantly since 2007, almost doubling over the last decade, and it
accounted for more than 700 billion euros at the end of 2019. On the other hand,
short-term corporate debt has also increased sharply since the global financial crisis and
it now stands at over one trillion euros.
OFCE Policy brief ■ 76 ■ July 6, 20203
The ratio of short-term assets to short-term liabilities is more than 10 percentage points
higher than that before the financial crisis (68% in the last quarter of 2019 compared to
55% in late 2007), suggesting that non-financial corporations have entered the lock-
down period with more liquidity than 13 years ago.
This increase in corporate liquidity is common to many countries. The French
singularity is the simultaneous increase in debt and cash held by companies. Several
reasons have been put forward to understand this phenomenon: from very low interest 2.
rates, which reduce the cost of debt, to uncertainty over demand and investment For a review of the literature on the
subject, see Cruz, Limura and
opportunities.2 Sobreiro, “What Do We Know About
Corporate Cash Holdings? A System-
atic Analysis”, The Journal of Corpo-
Figure 1. Short-term assets and liabilities for French non-financial firms rate Accounting and Finance, January
2019 and Cunha and Pollet “Why Do
In billions euros Firms Hold Cash? Evidence from
800 Demographic Demand Shifts”, The
Review of Financial Studies, 2019, for
recent analysis.
400
0
-400
Current account deposit
-800 Money market funds
Short-term debt securities
Short term liabilities
-1200
1995 1997 1999 2001 2003 2005 2007 2009 2011 2013 2015 2017 2019
Q4 Q4
Source: Banque de France.
Figure 1 shows the aggregate dynamics of the financial position of French companies
over the long term. From the graph it is also clear that if the ratio of short-term assets to
short-term liabilities has improved, the net financial position has deteriorated, moving
from -310 billion euros at the end of 2007 to -350 billion in 2019. As a result, adequate
refinancing of short-term loans remains an important operating condition for French
non-financial firms.
Another, less favorable, reading of these data suggests that the total debt of French
firms has increased by 83% between 2007 and 2019, as shown in Figure 2. This
phenomenon, which is more pronounced for large companies, has been taking place at
the same time as an increase in the liquidity and capitalization (net equity) of firms. As a
result, leverage (defined here as the company's debt on equity) has remained roughly
constant in recent years. It is therefore difficult to conclude that there is a general and
significant financial fragility in the French economy, although there is surely a strong
reliance of the French productive system on short-term bank financing.
These elements are important for understanding the simulations, as the high amount of
liquidity held by many French companies has cushioned the effect of the economic
slowdown triggered by the pandemic. Yet, highly indebted firms face higher (financial)
fixed costs and are thus more likely to suffer liquidity and insolvency issues.
OFCE Policy brief ■ 76 ■ July 6, 20204
Figure 2. Short- and long-term assets and liabilities for French non-financial firms
In billions euros
800
400
0
-400
-800
-1200
-1600
-2000
-2400
Short-term debt securities
-2800 Money market funds
Current account deposit
-3200 Liabilities
Long term liabilities
-3600 Short term liabilities
-4000
1995 1997 1999 2001 2003 2005 2007 2009 2011 2013 2015 2017 2019
Q4 Q4
Source: Banque de France.
2.2. Liquidity and solvency: definitions and measures
Businesses fail when they can no longer cope with payments due, such as wages, finan-
cial charges or payments to suppliers. This situation does not necessarily lead to firm
exit. Liquidation indicates, instead, a closure of the business. This legal definition of
default can span several phenomena, such as short-term liquidity problems or long-
term solvency issues. Therefore, following the literature, we adopt two complementary
metrics to assess the impact of the lockdown on the economic system.
■ A first indicator is the notion of illiquid, that is companies with negative liquidity.
These firms are not necessarily in default because short-term financing is still
possible. This criterion is used by the OECD and is similar to that of Gourinchas
et al. (2020), who define illiquid firms as those for which cash holding and oper-
ating cash flows are lower than fixed costs.3
■ The second definition is insolvency, which is defined here as the situation in
which net debt is larger than a firm's equity (i.e., when net equity is negative).
This last definition technically corresponds to firm bankruptcy.
3. 2.3. On the role of bankruptcy in economic growth
Gourinchas, P. O., Kalemli-Özcan S.,
Penciakova, V. et N. Sander, 2020, Bankruptcies are part of the functioning of market economies and must be considered
COVID-19 and Business Failures, the normal outcome of unexpected falls in demand or inadequate entrepreneurial
mimeo, june.
4. choices (e.g. technology choices among the others). The bankruptcy and business
See Caballero et Hammour, “The creation processes are indeed essential parts of the Schumpeterian dynamic of creative
Cleansing Effect of Recessions”,
American Economic Review, 84(5),
destruction in capitalistic market economies.
december 1994, pp. 1350-1368,
and Osotimehin et Pappada, “Credit
Should a policymaker setup policies against bankruptcies? The literature presents two
Frictions and the Cleansing Effect of contrasted arguments. The first argument considers that a government shall not inter-
Recessions”, Banque de France
Working Paper, n° 583. International vene to limit the number of bankruptcies because it is the expression of an efficient
comparisons in resource allocation market selection process, which screens out inefficient businesses. Bankruptcies free
has been analysed in Hsieh et
Klenow, “Misallocation and Manu- resources, such as capital or skills, to be reallocated towards other, more profitable,
facturing TFP in China and India”, businesses.4 This cleansing effect argument assumes that market mechanisms are effec-
The Quarterly Journal of Economics,
124(4), November 2009, pp. 1403- tive in identifying insolvent companies and in providing the liquidity necessary for the
1448 growth of others.
OFCE Policy brief ■ 76 ■ July 6, 20205
A second approach to bankruptcies during a recession, which we will call new-
Keynesian, claims instead that the number of bankruptcies is typically far too high
during the recession phases due to market inefficiencies, which prevent the supply of
liquidity to solvent, and possibly efficient, companies. A fall in aggregate demand, asso-
ciated with funding constraints, leads to a sub-optimal number of bankruptcies as they
affect businesses that are nevertheless efficient.
This debate is not purely theoretical and, on the contrary, should guide empirical study
and recommendations for economic policy. A simple empirical measure of the market
efficiency is to measure whether there are productive enterprises that go bankrupt. If
the market mechanism works well, only the least productive companies should go
bankrupt. If market selection is instead inefficient, the correlation between productivity
level and probability of not going bankrupt should be weak and firms exiting the
market might also belong to top productivity quartiles.
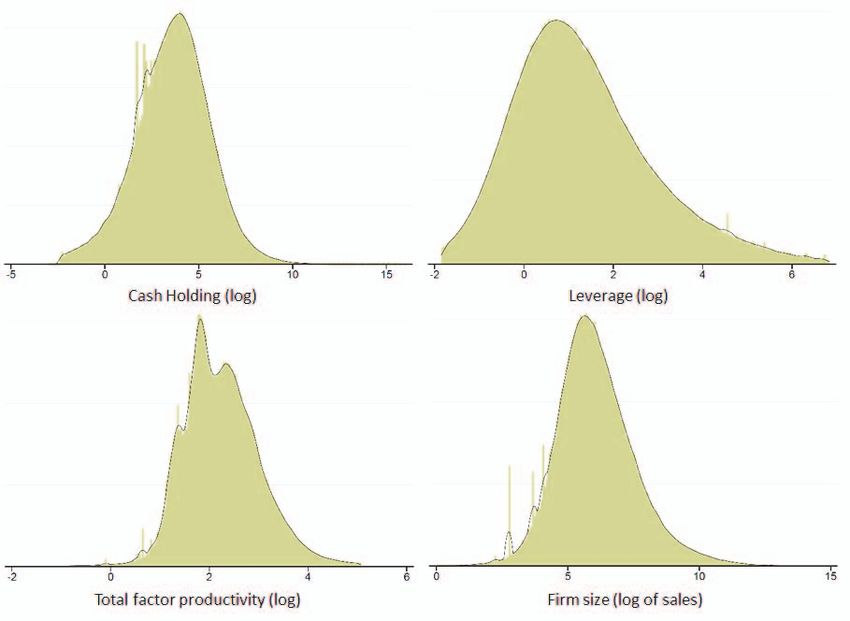
Figure 3 reproduces four essential distributions characterizing French businesses. Distri-
butions are based on almost a million firms, representing over 80% of the value added
of non-financial corporations The area of each distribution is normalized to 1, so that
only their shape matters.
The first distribution is the distribution of businesses' cash holdings (in logarithm for
easier reading). The companies with the lowest cash flow are the companies that are in
the left tail of the cash distribution. It immediately appears that there are a significant
number of companies with low cash flow. The second distribution is that of leverage,
defined as the total debt on equity. In this case, the most leveraged companies are the
companies with the highest values of leverage, which are therefore in the right tail of
the leverage distribution. The third distribution displays that of productivity, measured
by total factor productivity (TFP). The least productive firms are the firms in the left tail.
The final distribution is the size distribution. We observe that the distribution is very
symmetrical with a few threshold effects to the left of the distribution of firm size.
Figure 3. Distribution of the key dimensions affecting firm solvency
Source: FARE data.
OFCE Policy brief ■ 76 ■ July 6, 20206
Empirically, companies combine these various dimensions in a complex way. Highly
indebted companies may results from productive inefficiency, which should eventually
lead them to market exit. On the contrary, the debt level of a company can be the
result of significant investment, therefore of high expected productive efficiency and
significant growth in its market share. If the market mechanism works properly, only
the least productive firms should show go bankrupt. In this case, the productivity distri-
bution is the only relevant one to predict the long-run survival — or bankruptcy — of a
business. If, on the contrary, market selection is inefficient, companies with a low cash
flow or a high debt might go bankrupt, regardless of whether or not these are efficient.
Thus, the characterization of the functioning of the market mechanism mentioned in
this simulation exercise will be based on the market's ability to select the most produc-
tive companies at the expense of the least productive ones, which instead should be
filtered out.
3. Impact of the Covid-19 pandemic on firms:
main simulation results
This exercise consists in a microsimulation of the impact of the economic shock due to
the Covid-19 pandemic on French firms, over a period ranging between March 2020
and April 2021, considering different scenarios. The simulation strategy is described in
Box 1 and, more formally, in Appendix 1.
Box 1. Simulating firm liquidity and solvency
The exercise consists in providing companies with rules of behavior in the presence of nega-
tive or positive demand shocks. Each company then adapts its factors' requirements to meet
the new demand.
Two simulation strategies are used in the literature. The first models the behavior of the
company by limiting its ability to adapt the use of its resources to the evolution of its sales. In
these so-called partial adjustment models (Schivardi and Romano, 2020; OECD, 2020),
following the sudden and massive demand shock following the confinement, companies
reduce their demand for factors, but the rigidities inherent in factors' markets imply that there
Schivardi, F., et G. Romano, 2020, A is a less than proportional reduction with respect to the fall in sales. These rigidities lead to an
simple method to compute liquidity inequality between the reduction in revenues from output sales and the reduction in input-
shortfalls during the COVID-19 crisis
related expenditures. Such inequality potentially leads to negative profits. The very simple
with an application to Italy, mimeo.
model is essentially mechanical, and does not model the company's decision in any way.
OCDE, 2020, « Corporate sector
vulnerabilities during the Covid-19 The second strategy, in the spirit of Gourinchas et al. (2020), starts from the opposite
outbreak: Assessment and policy
responses », Tackling Coronavirus
hypothesis. Rather than facing an excess of resources, companies are rationed on their labor
Series.. demand due to confinement, leading them to make sub-optimal allocation choices that
Gourinchas, P. O., Kalemli-Özcan S., penalize their liquidity. This model thus explains the company's choice of factor consump-
Penciakova, V. et N. Sander, 2020,
tion in an environment very strongly disturbed by three negative shocks: (i) a negative
COVID-19 and Business Failures,
mimeo, june. demand shock; (ii) rationing of the labor factor supply due to confinement; (iii) a reduction
in productivity following telework.
The model proposed here combines the partial adjustment specific to the first strategy
(Schivardi and Romano, 2020; OECD, 2020) with an explicit modeling of the choice of
enterprise specific to Gourinchas et al. (2020). The model is based on the assumption that in
a disturbed environment, the objective of companies is to minimize their production costs
while meeting the demand they receive. However, companies can only partially adjust their
OFCE Policy brief ■ 76 ■ July 6, 20207
factors (as in the partial adjustment model). The model includes the partial employment
scheme (see Box 2). The latter allows companies to directly reach the optimal level of work
quantity. We therefore make the assumption of a rapid adjustment of the work factor, unlike
the intermediate consumptions which, themselves, adjust slowly.
The simulation exercise uses the FARE 2017 database, which amounts to assuming that the
accounting statement of French companies in March 2020 corresponds to that of December
2017. FARE 2017 includes more than 4 million companies (4,089,046). We exclude from the
analysis companies with incomplete information as well as firms in Agriculture (AZ), Finance
and Insurance (KZ) and Public Administration, Education, Human Health and Social Action
(OQ) sectors. We also exclude legal persons and organizations subject to administrative law
and self-entrepreneurs and craftsmen. This last category deserves special attention, but the
rules of decision on the factors of production do not strictly speaking fall within the logic of
the model presented. However, the exploited base includes 975,142 companies (or 23.8%
of FARE's legal units), concerns 10.8 million jobs (10,857,851 jobs, or 83.6% of FARE jobs),
and corresponds to 966 billion euros of added value in 2017 (i.e. 83.2% of FARE and 81.8%
of added value of non-financial companies). This simulation work is based on the notion of
legal units, and not on profiled companies. In this sense, we do not address the questions of
cash transfer between parent companies and subsidiaries capable of modifying the level of
liquidity of companies.
We refer the reader to Appendix 1 for a more formal presentation of the model. Appendix 2
presents the sensitivity of the results to the modeling choices.
The performance of firms, and the overall response of the French economy to the
shock, depends on the macroeconomic scenario prevailing in the coming months. We
simulate the dynamics of firm liquidity, and the ensuing solvency issues, using four
different assumptions about the post-lockdown phase. Figure 4 displays the time profile
of the shock and the return to “normal” economic activity. The first scenario is a No-
Covid environment that serves as a counterfactual and is characterized by steady
growth (1.5% annualized GDP growth). The other three scenarios differ in terms of the
recovery phase: although they seem very close to each other, they lead to very different
unemployment rates. A permanent drop in the level of economic activity leads to a fall
of almost 3% in the hours worked by the end of 2020, potentially pushing unemploy-
ment up by the same amount (unless the partial employment scheme is extended
beyond December 2020).
Box 2. Partial employment scheme
The partial employment scheme (Dispositif d'activité partielle in French) is a simple
change in working conditions, and does not constitute a modification of the work contract.
In this scheme, the employment contract is suspended, but the employee remains an
employee of the company and as such, some of his rights are preserved. In order to avoid a
rise in unemployment resulting from the drop in activity — as in the context of the Covid-19
pandemic — the partial employment scheme has been substantially modified. The allow-
ance paid by the State is now equal to 70% of the gross salary (84% of the net salary) of
employees placed in partial activity, up to 4.5 times the minimum wage. This scheme has
been revised downwards to 60% of the gross salary since June 1, 2020.
In our simulation, the partial employment scheme is introduced by allowing firms to
directly reach the optimal level of labor, with no partial adjustment costs associated to it.
OFCE Policy brief ■ 76 ■ July 6, 20208
Figure 4. Macroeconomic scenarios
Base 1 in February 2020
1.05
1
0.95
0.90
0.85
0.80
No Covid-19
Transitory shock scenario
0.75 Median scenario
Permanent schock scenario
0.70
0.65
0.60
0
0
0
0
0
0
0
0
0
0
0
1
1
1
1
02
02
02
02
02
02
02
02
02
02
02
02
02
02
02
/2
/2
/2
/2
/2
/2
/2
/2
/2
/2
/2
/2
/2
/2
/2
02
03
04
05
06
07
08
09
10
11
12
01
02
03
04
Source: OFCE.
The results discussed below are based on the relatively favorable hypothesis of a
“median” transitory shock (red curve in Figure 4). We will not explicitly discuss results
for the other scenarios because, even if they significantly affect unemployment, they
differ little in terms of the liquidity and solvency of firms. In fact, the partial employ-
ment scheme decouples the dynamics of bankruptcies from medium-term
macroeconomic fluctuations. Indeed, the bulk of liquidity and solvency issues builds up
in the first few weeks after the lockdown.
We start by presenting the broad trends emerging from the simulations, discussing first
the dynamic of firm liquidity and then moving to solvency problems.
The pandemic has a sudden, brutal and sizable impact on the liquidity of French
companies. The drastic drop in revenues determined by containment measures, the
presence of friction in the markets for factors of production and of fixed costs that do
not adjust to the level of production (or adjust very slowly, as it is the case for utility
bills, rents, financial expenses such as loans or mortgage payments) drain the liquidity
of non-financial firms. The fraction of companies experiencing liquidity issues (i.e., a
situation where the negative cash flow from current operations completely dries up
liquid assets such as cash reserves, deposits and money market instruments) jumps to
7.5% within two weeks, further increases to 12% after two months, and then climbs up
to 14% in the first quarter of 2021. This contrasts with a rate of around 4% at the
beginning of 2021 under the baseline No-Covid scenario.
Figure 5 provides two additional insights. The first one concerns the impact of the
partial employment scheme on firm liquidity, which is large and positive. By relaxing
the short-term work contract rigidities, the measure considerably reduces the number
of illiquid companies, reducing it from 9.7% to 6.8% in mid-April, and from 13.8% to
less than 10.1% at the end of 2020. The second lesson is that a number of firms face
liquidity issues irrespective of the pandemic. In fact, 4% of companies experience
liquidity problems in the No-Covid scenario, implying that they are unprofitable even
when the economy is growing and suggesting they are inefficient. These companies
are generally smaller, less productive, more indebted and have a lower level of liquidity
than the others.
OFCE Policy brief ■ 76 ■ July 6, 20209
Figure 5. Cumulative share of illiquid businesses
In %
16
Covid-19 without partial employment
14
12
Covid-19 with partial employment
10
8
6
No Covid-19
4
2
0
20
20
20
20
20
20
20
20
20
20
21
21
21
20
20
20
20
20
20
20
20
20
20
20
20
20
3/
8/
4/
5/
6/
7/
9/
0/
1/
2/
1/
2/
3/
/0
/0
/0
/0
/0
/1
/1
/0
/0
/0
/0
/0
/1
01
01
01
01
01
01
01
01
01
01
01
01
01
Sources: OFCE simulations, FARE data.
The OECD has recently published a report investigating the impact of the pandemic on
the liquidity of firms in 16 European countries. The study predicts that one month after
the lockdown, 20% of companies will face liquidity problems; the share would then
climb to 30% after two months, and peak at around 38% after three months. There are
several explanations for these differences. First of all, the OECD assumes a complete
stop to any economic activity in a number of sectors such as transportation equipment,
recreation and entertainment, real estate and other services, while we use sectoral fore-
casts about the French economy provided by OFCE. Secondly, the OECD study
employs a sample of French companies that, if it allows for an international compar-
ison, is about 10 times smaller than the number of firms we use. It is very likely that the
characteristics of companies differ significantly between the two databases..
While temporary liquidity shocks can be overcome once economic activity resumes, an
extended period of low revenues can ultimately trigger solvency problems. The No-
Covid scenario is associated with a very low exit rate, which reaches 1.8% at the end of
December 2020. The impact of the pandemic is again very significant, although slightly
less brutal than in the case of liquidity. The partial employment scheme considerably
reduces the share of insolvent companies: the exit rate is one full percentage point
lower after the first two months from the crisis, and this gap persists throughout the
simulation. In March 2021, the expected exit rate is 3.4% (compared to 2% for the No-
Covid scenario).
Without the partial employment scheme, the story would have been substantially
different. The share of companies experiencing solvency problems would quickly reach
0.7% in the immediate aftermath of the crisis, and quickly climb to 3% by mid-May.
Failures would reach 4% in September, 4.4% in January 2021 and 4.6% a year after the
lockdown, a value more than twice as large as the one expected without the crisis. We
estimate that the number of firms that remain solvent thanks to the partial employment
scheme amounts to nearly 12,000 (out of the 1 million firms in the sample).
OFCE Policy brief ■ 76 ■ July 6, 202010
Figure 6. Cumulative share of insolvent companies
In %
5.0
4.5 Covid-19 without partial employment
4.0
3.5 Covid-19 with partial employment
3.0
2.5
2.0 No Covid-19
1.5
1.0
0.5
0.0
20
20
20
20
20
20
20
20
20
20
21
21
21
20
20
20
20
20
20
20
20
20
20
20
20
20
3/
4/
5/
6/
7/
8/
9/
0/
1/
2/
1/
2/
3/
/0
/0
/0
/0
/0
/0
/0
/1
/1
/1
/0
/0
/0
01
01
01
01
01
01
01
01
01
01
01
01
01
Sources: OFCE simulations, FARE data.
4. Heterogeneous effects of the shock:
sectors, firm size and regions
The simulations highlight important heterogeneity in the impact of the shock across
sectors and firm categories. Focusing on differences across sectors, Figure 7 shows that
companies experiencing liquidity problems (at January 1, 2021) varies between a
minimum of 0.7% (commerce) to a maximum of 42% (hotels and restaurants). The
two sectors most affected are hotels and restaurants on the one hand and household
services on the other hand, the latter featuring almost 26% of illiquid firms at the end of
the year. Constructions and information and communication follow with a share of
firms facing liquidity issue ranging between 8 and 9%, whereas other sectors (including
manufacturing) display rates below 5%. Shifting to solvency problems delivers a very
similar classification. Accommodation, food and household services are still at the top
of the list, with around 12% and 9% of insolvent firms. Information and communica-
tion, and construction follow at a distance, with only 2 or 3% of companies facing
solvency problems.
We conclude that exposure to bankruptcy as a result of Covid-19 reflects sector-specific
factors. It may be important for public authorities to design actions to support firms
according to the sector to which they belong. It is worth noting that liquidity and
solvency issues do not simply reflect the magnitude of the shock, but result from the
interaction between the latter, other sector characteristics such as technology (which
determines the intensity of factors) and firm-specific feature such as initial liquidity and
leverage. Indeed, the correlation between the initial shock and the rate of illiquidity and
insolvency is positive, but far from one, ranging between 0.64 for illiquidity and 0.48
for insolvency. Furthermore, this correlation fades as the economy returns to its initial
level of activity.
OFCE Policy brief ■ 76 ■ July 6, 202011
Figure 7. Effets sectoriels du choc de la Covid-19
Hotels and restaurants
Household services
Construction
Information – Communication
Real estate activities
Utilities
Food and beverages
Business services
Capital goods
Other manufacturing
Illiquidity
Transportation
Insolvvency
Transportation materials
Wholesale and retail trade
0% 5% 10% 15% 20% 25% 30% 35% 40% 45%
Sources: OFCE simulations, FARE data.
To better understand the relationship between the magnitude of the shock and the
share of insolvent firms in each sector, we examine the number of insolvent firms in the
No-Covid scenario. We observe that certain sectors display a (relatively) large number
of companies facing troubles irrespective of the pandemic. This is the case, for
example, for household services or the information and communication sector. In fact,
this exercise singles out hotels and restaurants, construction and, to a lesser extent,
transportation, as the sectors that experience the most significant increase in insolvency
(and illiquidity) rates.
Let us now focus on differences across categories: micro firms, small and medium
enterprises, mid-size firms and large firms.5 Figure 8 shows the share of illiquid and
insolvent companies on January 1, 2021. We immediately notice a polarization of the 5.
Firm types are defined in terms of the
risk of default on small and large companies: approximately 11% and 13% of micro number of employees, turnover, and
and large firms will face liquidity problems. For SMEs, this number drops to 7%. A total assets. For more information,
please refer to the website of the
similar pattern emerges for insolvency: while around 4% of micro and large firms are French National Statistical Institute
insolvent at the end of the year, only 2% of mid-sized firms and 1% of SMEs are likely to (INSEE) https://www.insee.fr/fr/in-
formation/1730869#:~:text=Le%
become insolvent. This result seems all the more robust since: (i) it is also present in the 20d%C3%A9cret%202008%
2D1354%20de,interm %C3%
No-Covid scenario, so that large and micro firms are those with the highest rates of A9diaire% 20et% 20les% 20grandes
insolvency also without Covid-19; (ii) it does not reflect an disproportionate presence of %20entreprises.
large companies in highly-impacted sectors.6 6.
In the sectors hotels and restaurants
This “U-shape” is surprising, as one would have expected a concentration of liquidity and household services, large com-
panies represent 0.4 and 0.3% of
problems on smaller companies. In fact, when we compare the insolvency rate under firms respectively, whereas they
account for almost 4% of firm
the Covid-19 scenario to the one occurring in the No-Covid case, we find that micro population in less exposed sectors
firms are the most affected (+83% increase) while the other three categories all experi- such as manufacturing of transport
equipment.
ence an increase of around 40%. Thus, one might think that the underlying reasons for
insolvency of small and large companies are substantially different: small businesses
may go in distress because of scarce liquidity, while large firms because of higher debt
levels, or a higher reliance on leverage.
OFCE Policy brief ■ 76 ■ July 6, 202012
Figure 8. Effect of the Covid-19 shock by size of business
Micro firms
Small-medium firms
Medium-large firms
Illiquidity
Insolvency
Large firms
0% 2% 4% 6% 8% 10% 12% 14%
Sources: OFCE simulations, FARE data.
5. Market selection
When analyzing the impact of lockdown measures on firm liquidity and solvency,
which may lead to an increase in exits, an important question relates to the ability of
the market to properly select firms, pushing only the least productive out of the market.
After all, if selection operates correctly, a chief policy recommendation would be to
foster creative destruction by promoting the reallocation of (human, technical, finan-
cial) resources towards more profitable activities. On the contrary, if the selection
mechanism performs poorly by pushing viable and efficient companies out of the
market, policy makers may wish to support efficient businesses afloat.
Figures 9 and 10 show the share of insolvent firms (by sector and firm type) coming
from the top quartile of the TFP distribution, comparing the baseline No-Covid scenario
with a situation where the shock hits and firms can resort to the partial employment
scheme. If market selection works properly, this share should be close to zero.
We see that selection works well in a situation of regular growth (No-Covid). For most
sectors (Figure 9), the share of insolvent firms in the top productivity quartile remains
below 3%, with the exception of real estate and business services. After the lockdown,
on the other hand, the selection mechanism is much less efficient and we observe a
systematic increase in the share of productive companies among those facing solvency
issues. This increase can be seen in the hotel and restaurant industry, where the share is
multiplied by 10, and in construction, where efficient companies represent 10% of
insolvent companies. In other words, among the businesses exposed to bankruptcy risk
there are economically viable businesses, whose fragility most probably depends on
high leverage, which results in large fixed (financial) costs, or on low cash holdings
before the crisis.
OFCE Policy brief ■ 76 ■ July 6, 202013
Figure 9. Share of insolvent firms in the top quartile of productivity (by sector)
Food and beverages
Capital goods Covid-19 with PES
No Covid-19
Transportation materials
Other manufacturing
Utilities
Construction
Wholesale and retail trade
Transportation
Hotels and restaurants
Information – Communication
Real estate activities
Business services
Household services
0 2 4 6 8 10 12
Sources: OFCE simulations, FARE data.
Figure 10 corroborates these findings about a systematic deterioration of the quality of
market selection in times of crisis, and it also shows that the impact is different by firm
size.7 For microenterprises, and to a lesser extent SMEs, the market largely selects on
the basis of productivity. In the No-Covid scenario, the share of highly productive 7.
These observations echo the results
microenterprises among the insolvent ones is 1.5%, while 85% of firms in default come by Bellone et al., 2008, and suggest
from the bottom quartile of productivity. In times of crisis this selection weakens but the existence of a dual market struc-
ture, whereby competition between
remains by and large operational. For mid-sized and large firms, on the other hand, large firms penalizes the productive
efficiency of young firms. See
selection seems to operate on other criteria, since the share of productive but insolvent Bellone, F., Musso, P., Quéré, M. and
companies reaches almost 15% in the No-Covid scenario, and jumps to 25% during L. Nesta, 2008, “Market Selection
Along the Firm Life Cycle”, Industrial
the Covid-19 crisis. This difference in treatment between small and large companies and Corporate Change, 17(4):
can be attributed to imperfect financial markets that, by limiting small firms' ability to 753-777.
access external resources such as bank loans, make them less vulnerable to the sort of
problems that are modeled in the simulation. In addition, the short-termism of lenders
and financial markets may reward short-run performance over longer-term efficiency,
with negative effects on the overall competitiveness of the economic system. Likewise,
many large firms facing solvency issues comes from the top quartile of productivity
suggests that selection is not only based on efficiency but may reflect market power in
the factor or product markets.
This crisis will therefore also have an impact on the overall efficiency of the French
economic system, possibly leading to a hysteresis effect. The weakening of market
selection provides a rationale for public intervention aimed at sustaining viable but
illiquid/insolvent firms during the crisis. The practical difficulties come from the fact
that policymakers may not be better equipped than the market to discriminate among
“good” and “bad” firms.
OFCE Policy brief ■ 76 ■ July 6, 202014
Figure 10. Share of insolvent businesses in the top quartile of productivity
(by business category)
In %
Micro firms
No Covid-19
Covid-19 with PES
Small-medium firms
Medium-large firms
Large firms
0% 5% 10% 15% 20% 25% 30%
Sources: OFCE simulations, FARE data.
6. Which public policies?
The unprecedented shock to the economic activity of the Covid-19 crisis was in part
absorbed by the partial employment scheme since the number of insolvent companies
would have increased in 2020 from 3.2% to 4.5% without this policy. However, this
system is not well-suited for the forthcoming dynamics as it may also reduce the firms'
incentives to return to full employment.
The targeting of the policy for companies shall be based on two contradicting princi-
ples: (i) the aim of the device must not be to protect business owners unconditionally
from the entrepreneurial risk; (ii) the provision of public financial resources must be
targeted to efficient firms exclusively. A too broad targeting can transfer resources to
companies that do not need them, increasing the cost to the state. Likewise, a broad
targeting can unduly help companies which would have gone bankrupt due to inap-
propriate technical choices, if the market would have been efficient. Conversely, and as
the simulations reveal, a lack of aid leads to failures of productive enterprises and an
increase in unemployment, due to the poor functioning of market mechanisms.
A first strategy is to consider sectoral policies, capable of identifying large companies in
difficulty and of estimating effective financing conditions. However, this first strategy,
which is necessary, leaves smaller but efficient companies with a smaller bargaining
power with the public authorities (vis-à-vis the large ones).
Therefore, a mechanism that is both transversal and targeted, with explicit criteria of
eligibility for companies, must be considered. Germany, for example, has chosen to
contribute to the financing of fixed costs. An amount of 25 billion euros has been dedi-
cated to this scope. Until August 2020, each company whose income has fallen by
more than 60% compared to the 2019 level of activity can receive a contribution for
OFCE Policy brief ■ 76 ■ July 6, 202015
the financing of 70% of its fixed costs, with a maximum of 150,000 euros per
company.8 In Italy, two measures contribute to the financing of companies. The first is
the suspension of the transfer of VAT from companies to the Italian State before a
8.
rescheduling on 5 payments. This suspension is conditional on a drop in activity of 33% A presentation of such a mechanism
for small businesses and of 50% for large ones. Then, a moratorium was put in place on for France is given in the OFCE Blog
“Covid-19 et entreprises : Comment
interest charges from mid-March to mid-September, for SMEs that have not experi- éviter le pire” by Mathieu Plane,
enced payment incidents. These last two measures are limited due to the constrained 29 May 2020.
Italian budgetary environment. They target the liquidity of companies without
improving their solvency.
By qualifying the solvency of companies according to the scenarios envisaged, our anal-
ysis distinguishes companies whose failure is due to the lockdown from those which,
even in a hypothetical growth scenario (the No-Covid), were doomed to exit the
market. Considering the companies failing uniquely because of the current pandemic
crisis (around 14,000 companies in our sample), we find that refinancing their equity
would represent a cost of around 3 billion euro. In the absence of additional informa-
tion on the viability of the companies, this amount represents a lower bound, and
probably an inaccessible minimum, since the real identification of these companies
remains very difficult.
Another strategy would be to contribute to the equity of all insolvent companies,
regardless of their viability (around 31,000 companies). In that case the cost estimate
would amount instead to 8 billion euros. This cost represents the amount necessary to
refinance companies' equity on September 1, 2020, avoiding all bankruptcies. But this
policy can be described as a policy of partial discrimination. It discriminates in the sense
that, rather than allocating unconditional aid to more companies, it identifies the
companies that really need more equity. But it remains partial insofar as it does not
allow, without additional procedures, distinguishing viable companies (at least in the
medium term), from those which will in any case be forced to exit the market quickly.
Such a mechanism can be decentralized by the existence of a public office where
companies could justify their capital requirements on September 1, 2020 (before the
first financings in order to avoid strategic behavior) and, for example, the absence of
payment incidents in 2019 to justify their good health before the shock. ■
OFCE Policy brief ■ 76 ■ July 6, 202016
APPENDIX 1. The model
The exercise consists in providing companies with rules of behavior in the face of nega-
tive or positive demand shocks. Faced with these shocks, the company adapts the use
of its factors of production to meet demand. We thus deduce a dynamic of the liquidity
of companies as follows
Lt = Lt–1 + St – CVt – CF (1)
where L represents the liquidity of the company at time t and t – 1, S indicates the
sales of the company, CV and CF respectively represent the variable (ie the wage bill
and intermediate consumption) and the fixed costs of the business. Equation (1) simply
means that the level of liquidity of a company at a given time depends on its level at the
start of the period, the inflows (sales) and expenses linked to its current operations, and
the fixed costs which they are independent and constant for each period. Fixed costs
include the financial charges, the repayment of the principal as well as the corporate
taxes. The time t can represent weeks or months. In our simulation, each period corre-
sponds to half a month, a year is thus composed of 24 periods. For each period, we
establish two diagnoses. A company is said to be illiquid when its cash flow becomes
negative, that is to say that the availability on current accounts and the sale of its liquid
assets are no longer sufficient to finance total costs. Likewise, a company is said to be
insolvent if its equity is lower than its debts, that is to say if the current liabilities exceed
the available assets.
Equation (1) shows that what will determine the dynamics of liquidity, following a
demand shock, are the level of variable and fixed costs. We can identify two simulation
strategies in the literature. The first strategy models the behavior of the company by
limiting its ability to adapt the use of its resources to the evolution of its sales. In these
so-called partial adjustment models (Schivardi and Romano, 2020; OECD, 2020),
following the sudden and massive demand shock during the lockdown, companies
reduce their demand for factors, but rigidities inherent in factor markets imply a less
than proportional reduction. These rigidities lead to an inequality between the reduc-
tion in sales and the reduction in the expenditure linked to the resources mobilized,
potentially leading to negative gross operating profits. The model is essentially
mechanical and does not model the company's decision. The second strategy, in the
spirit of Gourinchas et al. (2020), starts from an opposite hypothesis. Rather than facing
an excess of resources, companies are rationed on their labor demand due to lockdown
of workers. This leads hem to sub-optimal allocation choices that penalize their
liquidity. This model thus explains the company's choice of factor consumption in an
environment very strongly disturbed by three negative shocks: (i) a negative demand
shock; (ii) a rationing of the labor factor supply, due to confinement; (iii) a reduction in
productivity following the telework.
The model proposed here combines the partial adjustment specific to the first strategy
(Schivardi and Morone, 2020; OECD, 2020) with an explicit modeling of the choice of
enterprise specific to Gourinchas et al. (2020). The model is based on the assumption
that in a highly disturbed environment, the objective of companies is to minimize their
production costs:
(2)
OFCE Policy brief ■ 76 ■ July 6, 202017
where F(K; L, M) = AKβKLβLMβM et A = θ e ui. is the Cobb-Douglas production function.
We don't make any assumption about market imperfections, but we assume fixed
prices in such a short-term time span. We deduce that the optimal demands for factors
are:
∗
∗
We alsop take into account that companies can only partially adjust their quantity of
factors (partial adjustment model) according to the following equation:
∗
where X = {L, M}. The parameter vector γ (0 < γL , γLM < 1) describes the speed of
adjustment of the quantity of factors. If γ = 1, there is an immediate adjustment so that
L and M correspond to the optimal choices. If, on the contrary, γ = 0, the adjustment is
zero and the company chooses quantities of factors corresponding to those of the
previous period. We consider the adjustment to be imperfect, that is, not zero or imme-
diate. This partial adjustment reflects the rigidity of contracts, market imperfections
such as information asymmetries or even the fixed costs linked to the use of L and M
factors, which we do not understand much in the data. We choose γM = 0,25.
The partial employment scheme is a device that allows companies to directly reach the
optimal level of work quantity. In the model, this amounts to putting γL = 1. For the
establishment of an alternative scenario without a partial employment scheme, we set
γL = 0,1. At this level, the company would take almost a year to review 90% of its
employment contracts. The equation for the dynamics of liquidity therefore becomes:
∗
To summarize, the simulation includes the following decisions: (i) For each period, the
company observes the level of demand9 QDt = (1 – gt )QDt–1 ; (ii) the company deter-
mines the optimal amount of factors (L* , M*) ; (iii) the company is forced on its
^ ^ 9.
adjustment and determines the quantities (L* , M) ; and produces QtS = F(K, L*t , Mt ) The initial shock was taken from the
with its Cobb-Douglas technology and partial employment scheme, or OFCE Policy brief, n ° 65, table 1.
^ ^
QtS = F(K; L, M ) without the partial employment policy device; (iv) the company
collects its sales and ensures the settlement of its factors and fixed costs; (v) the
company's cash flow is updated according to the equation Lt = Lt–1 + St – CVt – CF.
OFCE Policy brief ■ 76 ■ July 6, 202018
APPENDIX 2. Sensitivity analysis
This appendix describes the sensitivity of the results to the modeling choices. In fact,
any simulation includes modeling choices, and the results presented depend on the
behavioral assumptions and the underlying simulation parameters. In our case, the crit-
ical parameter is the one determining the speed at which the company adjusts its
intermediate consumption. Due to frictions on this market resulting from contractual
rigidities, information imperfections and unobserved fixed costs, a reduction in the
level of production does not lead to a proportional drop in intermediate consumption.
While the partial employment scheme allows companies to optimize the desired level
of employment, no similar measure exists for intermediate consumption. Table A2
shows the sensitivity of the results with respect to this parameter, detailing the cumula-
tive share of illiquid and insolvent companies on January 1, 2021, the variations in the
level of employment compared to original employment, and the liquidity lost for
companies compared to what they would hold in a regular growth scenario.
Table A2. Sensitivity analysis of the results with respect to the speed of adjustment of intermediate goods
consumption (the γM paraeter)
En %
Speed of adjustment γM 1/10 1/6 1/5 1/4 1/3 1/2 1 Hors Covid
Time implied to revise
11 months 6 months 5 months 4 months 3 months < 2 months 0 —
90% of contracts
Illiquidity 15.3 12.7 11.6 10.2 8.5 6.3 4.2 3.8
Insolvency 5.4 4.1 3.7 3.2 2.7 2.2 1.9 1.8
Employment variation -3.5 -2.9 -2.7 -2.5 -2.3 -2.1 -2.0 +1.5
Liquidity variation -27.7 -25.3 -24.5 -23.5 -22.3 -20.9 -19.2 0.0
Note: Statistics on January 1, 2021. Scenario with a reminder on January 1, 2021 being 95% of the initial shock. The "Off-Covid" scenario is carried out on
the basis of an annual growth rate of 1.5%. The variations in employment sum the jobs destroyed due to the insolvency of companies then the jobs in par-
tial employment scheme device, because of the very weak subsequent job creation induced.
We observe that by varying γM between a tenth and the unit, the results differ consider-
ably. In the case of an immediate adjustment (γM = 1), the share of illiquid and insolvent
companies is very close to that which we would have observed in a growth scenario.
The adjustment takes place more in the factor market. Firms adjusting instantly, in this
case we would observe a significant decrease in the level of employment (-400,000 jobs
out of the 11 million in the database) and a drastic reduction in intermediate inputs. In
this scenario, with a rate of insolvent businesses at 1.9 rather than 1.8%, the vast
majority of businesses would survive but in a reduced production environment.
Conversely, with a very slow adjustment speed (γM = 0,1), the number of insolvent
businesses would increase to 5.4%, exactly 3 times more than regular growth, with
equally disastrous consequences for the level of business liquidity and employment.
How then can we infer a realistic level of this parameter? We selected an adjustment
speed γM = 0,25 as a central hypothesis. This implies that companies take around
4 months to revise 90% of their contracts and produce a share of illiquid and insolvent
OFCE Policy brief ■ 76 ■ July 6, 202019
companies of 10.2 and 3.2% respectively. To select this value, we start from the obser-
vation that in 2009, the French economy suffered a 3% drop in GDP, associated with a
20% increase in the default rate (which peaked at 1.85% compared to at a long-term
average of 1.55%). Comparing this with the benchmark share of insolvent companies
in the non-Covid-19 scenario (1.8%), this would lead us to γM = 0,5. Given that the
expected reduction in GDP for 2020 is much larger (recent OFCE publications forecast -
11% for France) and more sudden and therefore less anticipated by economic agents,
we consider that the scenarios where the speed of adjustment γM is between 0,2 et
0,33 are the most plausible, with γM = 0,25 taken as central value.
In addition, a useful benchmark for our results is the 2017 Banque de France report on
business failures.10 This work shows an average of 55,000 failing companies each year
over the 1990-2016 period, with peaks beyond 60,000 in 1993, 2009 and 2015. As a 10.
proportion of active companies, failures vary from a minimum of 1.3% (in 2015) to a B. Bureau, T. Libert, 2016, “Enjeux
économiques des défaillances d'en-
value larger than 1.8% in 2009. These figures are in line with the scenario excluding treprises en France”, Banque de
Covid-19, where about 2% of companies encounter solvency problems during the France, Direction des Entreprises,
Observatoire des Entreprises, Bulletin
year. On this basis, and taking into account the values of the adjustment parameter (γ ) de la Banque de France, n° 208,
is between 0.2 and 0.3, we can predict that by the end of the year, the pandemic novembre-décembre.
would cause between 25,000 and 60,000 more failures, with 40,000 more failures as
the central scenario compared to the 55,000 failures observed each year. Without the
partial employment scheme, the simulations indicate a much greater growth in failures
ranging between 55,000 and 100,000 in addition to those expected in the regular
growth scenario excluding Covid-19, with 77,000 additional failures as the central
scenario. Again, the partial employment scheme plays a major role in the survival
of companies.
To reference this document:
Mattia Guerini, Lionel Nesta, Xavier Ragot, Stefano Schiavo, 2020,
« Firm liquidity and solvency under the Covid-19 lockdown in France », OFCE Policy brief 76, July 6.
OFCE Policy brief ■ 76 ■ July 6, 2020Nos derniers Policy briefs
26 juin 2020 (Policy brief 74)
Évaluation au 26 juin 2020 de l'impact économique de la pandémie de COVID-19
et des mesures du confinement et du déconfinement en France
Magali Dauvin, Bruno Ducoudré, Éric Heyer (dir.), Pierre Madec, Mathieu Plane,
Raul Sampognaro, Xavier Timbeau (dir.)
19 juin 2020 (Policy brief 73)
Dynamique des défaillances d'entreprises en France et crise de la Covid-19
Mattia Guerini, Lionel Nesta, Xavier Ragot, Stefano Schiavo
17 juin 2020 (Policy brief 72)
How to spend it: A proposal for a European Covid-19 recovery programme
Jérôme Creel, Mario Holzner, Francesco Saraceno, Andrew Watt, Jérôme Wittwe
08 juin 2020 (Policy brief 71)
Setting New Priorities for the ECB's Mandate
Christophe Blot, Jérôme Creel, Emmanuelle Faure, Paul Hubert
08 juin 2020 (Policy brief 70)
De nouvelles priorités pour le mandat de la BCE
Christophe Blot, Jérôme Creel, Emmanuelle Faure, Paul Hubert
5 juin 2020 (Policy brief 69)
Évaluation de l'impact économique de la pandémie de COVID-19
et des mesures de confinement sur l'économie mondiale en avril 2020
Département analyse et prévision, sous la direction d’Éric Heyer et de Xavier Timbeau
07 mai 2020 (Policy brief 68)
Pétrole : chronique d’un effondrement
Céline Antonin
06 mai 2020 (Policy brief 67)
Évaluation au 6 mai 2020 de l’impact économique de la pandémie de COVID-19
et des mesures de confinement sur le marché du travail en France
Bruno Ducoudré, Pierre Madec
20 avril 2020 (Policy brief 66)
Évaluation au 20 avril 2020 de l'impact économique de la pandémie de COVID-19
et des mesures de confinement en France : comptes d’agents et de branches
Département analyse et prévision, sous la direction d’Éric Heyer et de Xavier Timbeau
Directeur de la publication Xavier Ragot
Rédacteur en chef du blog et des Policy briefs Guillaume Allègre
Réalisation Najette Moummi (OFCE).
Copyright © 2020 – OFCE policy brief ISSN 2271-359X. All Rights Reserved.
www.ofce.sciences-po.fr @ofceparis
Observatoire français des conjonctures économiques l Centre de recherche en économie de Sciences Po
10, place de Catalogne l 75014 Paris l Tél/ 01 44 18 54 00You can also read