How does Big-box Retail Entry Affect Incumbents in the Hospitality Industry: Evidence from a Natural Experiment
←
→
Page content transcription
If your browser does not render page correctly, please read the page content below
(2020) 50, 207–229

     How does Big-box Retail Entry Affect Incumbents in
      the Hospitality Industry: Evidence from a Natural
                         Experiment∗
                            Oana Mihaescu and Niklas Rudholm
                                  Institute of Retail Economics, Sweden

 Abstract: We use entry by IKEA in four Swedish municipalities as a natural experiment to measure
the effects of big-box retail entry on the revenues of incumbent firms in the hospitality sector. We further
investigate whether the effects depend on the size of the local market before entry. Our results show a negative
impact on the revenues of incumbents in Haparanda, Kalmar, and Karlstad, but insignificant effects in the
metropolitan region of Gothenburg. As most firms in the hospitality sector are restaurants, we expect that
our results are due to increased competition since all IKEA stores come with large, popular, and reasonably-
priced restaurants.
Keywords: big-box entry, agglomeration, hospitality sector
JEL Codes: D22, L11, L25, L83, P25

1.    INTRODUCTION

The impact of large retail entry on the revenues of incumbent retailers has been shown to
differ depending on the type of products the incumbents are selling (Han et al., 2018). Firms
selling complements to the large entrant firm are expected to experience increases in revenues
generated by demand- and supply-side spillovers. The relationship between large retail
entry and firms selling substitutes is more intricate. On the one hand, incumbents selling
substitutes may also be benefited through supply- and demand-side externalities. Industrial
∗
 Research funding from the Swedish Retail and Wholesale Development Council (Handelns Utvecklingsråd,
grant number 2015:4) is gratefully acknowledged. The authors would also like to thank participants at the
Centre of Retailing seminar “What happens when IKEA comes to town,” Lund University (March 20, 2018),
the Swedish Retail and Wholesale Council seminar “Retailing as a growth engine” (March 16, 2018), and
the 25th International Conference on Recent Advances in Retailing and Services Science Conference (July
16-19, 2018) for valuable comments and suggestions. Finally, we would like to thank the editor and two
anonymous reviewers for valuable comments that helped improve the quality of our paper.
Oana Mihaescu is a Researcher in Economic Geography at the Institute of Retail Economics, Stockholm,
Sweden. Niklas Rudholm is a Professor of Economics at the Institute of Retail Economics, Stockholm,
Sweden. Corresponding Author : Oana Mihaescu, E-mail: oana.mihaescu@huiresearch.se.

(c) Southern Regional Science Association 2020
ISSN 1553-0892, 0048-49X (online)
www.srsa.org/rrs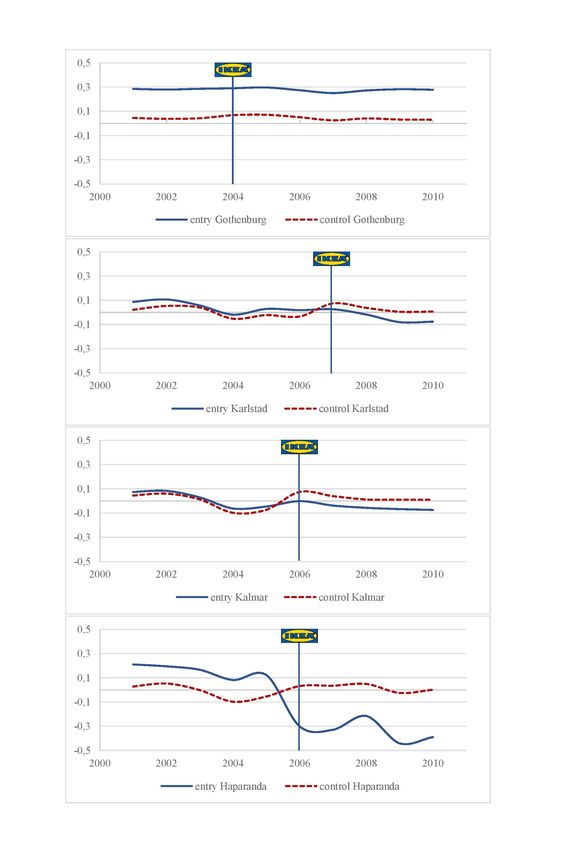
208                                                             The Review of Regional Studies 50(2)

co-location helps decrease input costs, facilitates labor matching, and increases knowledge
spillovers (Marshall, 1920; Hotelling, 1929; Weber, 1929; Christaller, 1933; Lösch, 1940),
thus determining further increases in firm revenues within the cluster. On the demand-side,
spillovers are explained by gravitation-related arguments, which state that entry by large
retailers (like IKEA) selling high-order goods on a local market increases the centrality of
the place, leading to a widening of its ‘catchment’/market area. This means that customers
travelling from further away are now attracted to the enlarged shopping area, increasing its
customer base and simultaneously the need for accommodation and food services.
     On the other hand, entry by large retailers creates competitive pressure in the entry
regions. A new IKEA store is expected to increase competition for incumbents selling furni-
ture and furnishings. IKEA is also competing with the hospitality industry as every IKEA
store comes with its own large, popular, and reasonably-priced restaurant. This relationship
has been largely disregarded in the literature, although IKEA is expanding and entering
new markets at a fast pace. In 2016 alone, sales at IKEA increased by 7.9 percent and net
profits by 19.6 percent compared to the previous year, while they opened 31 new stores and
pick-up points worldwide. In addition, IKEA welcomed close to 800 million visitors to their
stores (IKEA, 2016) and 650 million guests to their restaurants (Krogarna, 2017), which are
standard for all new stores. In Sweden only, IKEA Food had a turnover of about 1.7 billion
SEK1 and hosted more than 200,000 guests in 2016 (IKEA, 2016; Krogarna, 2017).
     It is important to investigate how entry by IKEA impacts the revenues of incumbent
firms within the hospitality sector in Sweden. A number of studies have previously focused
on the impacts of entry by large retailers on the revenues, employment, and productivity
of incumbent retail firms.2 However, potential cross-industry effects of large retail entry on
incumbent revenues are largely unexplored, although some studies warned about the impor-
tance of ‘micro-heterogeneity’ within locations. For example, Freedman and Kosová (2012)
argue that not all firms are affected in the same way by agglomeration. Even within the same
industry, while some firms may be gaining, others may be losing depending on the strength
of the agglomeration and competition effects. We thus focus on cross-industry relationships
and also differentiate between entry markets of different size because the literature indicates
a productivity gap between smaller and larger markets, which is linked to firm productivity
(Henderson et al., 2001; Rice et al., 2006; Saito and Gopinath, 2009). While Han et al.
(2018) has already shown that this gap is reduced for retail firms following entry by IKEA,
it is interesting to also see what the effect is for firms in the hospitality sector.
     Although an investigation into how IKEA entry affects incumbent firms in the hospitality
industry is important, there are also reasons to believe that the events analyzed in this study
will become more common in other countries and for other big-box retailers. First, as IKEA
increases the number of stores in other countries, it is likely that these entries will take
place in increasingly smaller communities. Our analysis can provide an indication of how
incumbent firms in the hospitality sector in these smaller cities will be affected. Second, as
e-commerce increases its competition with traditional big-box stores, these businesses will
have to differentiate their offer to the consumers, preferably in a manner that e-tailers cannot
replicate. One way of doing so is to offer restaurant services at the big-box store location. We
1
    Approximately 160 million EURO. Exchange rate 2019-06-24: 1 SEK = 0.094 EURO.
2
    See, for example, Maican and Orth (2012), Daunfeldt et al. (2015), and Rudholm et al. (2018)

c Southern Regional Science Association 2020.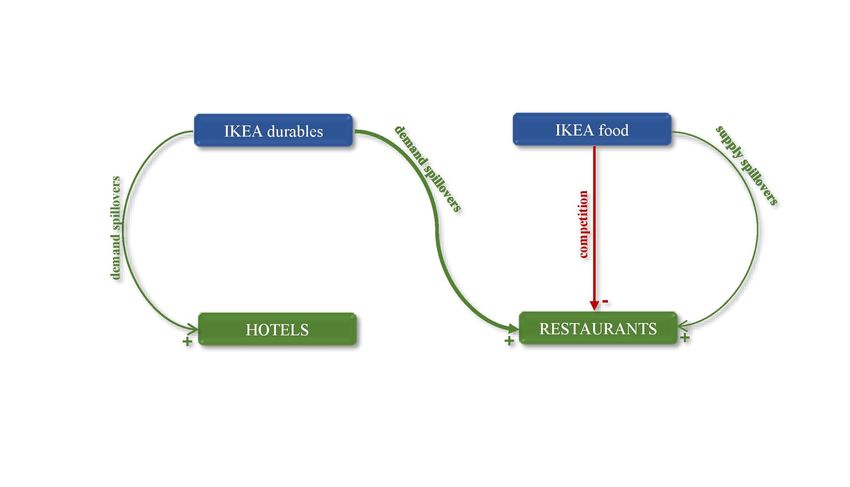
MIHAESCU & RUDHOLM: HOW DOES BIG-BOX RETAIL ENTRY AFFECT INCUMBENTS                               209

thus expect the combination of big-box retailing and restaurants to become more common
in the future.
    Methodologically, the estimation of how big-box retail entry might affect the revenues
of incumbent firms within the hospitality sector in the entry municipalities is not an easy
task. Previous studies of how IKEA entry affects incumbent retailers in local economies
(Daunfeldt et al., 2015, 2017) use traditional difference-in-differences estimation methods,
after first trying to select control group municipalities with similar characteristics to the entry
municipalities. We follow these studies in that we first select control group municipalities
that are similar to the entry municipalities in terms of the determinants of IKEA entry and
other relevant characteristics, and thus suitable to use as counterfactuals when measuring the
development in incumbent firms within the hospitality sector in absence of IKEA entry. As
in Håkansson et al. (2016), we use the municipalities deemed suitable for entry by IKEA in
the period 2013-2016 as controls for IKEA entries in smaller markets in the period 2006-2007,
and the metropolitan area of Stockholm as a control for the entry in the larger Gothenburg
area in 2004. Secondly, we use a difference-in-differences translog production function to
measure the impact of IKEA entry on output, measured as the change in consumer price
adjusted revenue at the time of IKEA entry, holding the use of capital and labor inputs
constant.
    Our results show that the effects of IKEA entry on the revenue of firms in the hospitality
industry in the entry regions are negative and significant. Furthermore, the effect depends
on the size of IKEA relative to the size of the local market, with larger (in absolute terms)
negative effects identified for IKEA entry in smaller markets. While the effect is insignificant
in the metropolitan area of Gothenburg, entry by IKEA accounts for an average decrease of
10 percent in the revenues of incumbents in Karlstad, 13 percent in Kalmar, and 34 percent
in the much smaller municipality of Haparanda. The large effect in Haparanda is mainly
due to the very small size of the market compared to the new establishment. In 2005, before
IKEA entered, the turnover in durable goods retailing in Haparanda was of about 140 million
SEK, compared to the average IKEA store turnover in Sweden of about 800 million SEK
(IKEA, 2017).3
    The rest of the paper will proceed as follows. Section 2 presents the theoretical founda-
tions for why big-box entry affects revenues of firms in the hospitality sector and a summary
of previous research. Section 3 presents our identification strategy and empirical model,
while Section 4 presents the data, descriptive statistics and estimation results. Section 5
discusses the findings of the study.

2.      THEORETICAL FOUNDATIONS AND PREVIOUS RESEARCH

To our knowledge, no previous studies have investigated the effects of IKEA entry on the
revenues of incumbent firms in the hospitality sector in the entry regions. This merits study
because a positive impact of big-box retail entry on revenues in incumbent hospitality sector
firms in an entry region would indicate the possibility of both increased wages for employees
and increased profits for firms.
3
    Approximately 13 and 75 million EURO, respectively. Exchange rate 2019-06-24: 1 SEK = 0.094 EURO.

c Southern Regional Science Association 2020.
210                                                        The Review of Regional Studies 50(2)

                  Figure 1: Supply and Demand Spillovers between IKEA
                              and the Hospitality Industry

    In addition, the hospitality sector includes both restaurants and hotels, which makes it
both a substitute and a complement to IKEA. IKEA sells furniture and furnishings, but in
the same time comes with its own large, popular, and reasonably-priced restaurant. While
the durables section of IKEA acts as a complement to the whole hospitality sector, IKEA
Food becomes a complement to hotels in the entry region, but a substitute to incumbent
restaurants. This triggers a series of mechanisms within the entry cluster that affect substi-
tute and complement incumbents (restaurants and hotels) differently (see Figure 1).

2.1.   IKEA as Complement to the Hospitality Industry

The possible agglomeration effects between IKEA and the restaurant industry in the entry
areas are due to two types of linkages: demand spillovers and supply spillovers. Demand-side
externalities are derived from three main factors: the increased size of the retail area, IKEA
selling high-order products, and ‘branding.’
    The gravitational pull model, grounded in Reilly’s (1931) law of retail gravitation, ex-
plains that it is the increasing total size of a trade center that leads to a widening of the ‘catch-
ment’/market area for the respective center. The Central Place Theory (CPT), (Christaller,
1933) also states that entry by a large retailer selling high-order goods on a local market (like
IKEA) increases the centrality of the place. This means that customers travelling from fur-
ther away are attracted to the newly enlarged shopping area. Its size and its retailing profile
(specialized on durable goods) makes that IKEA stores have considerably wider ‘catchment’

c Southern Regional Science Association 2020.
MIHAESCU & RUDHOLM: HOW DOES BIG-BOX RETAIL ENTRY AFFECT INCUMBENTS 211
areas than other stores in the cluster. A new IKEA store is further increasing the customer
base of the entry area because it ‘brands’ the shopping centers where it makes entry. As
Kinley et al. (2002) explain, well-known brands have the power to attract customers from
greater distances, increase loyalty, increase spending, target wider customer groups, and
offer competitive advantage for the entry areas. They also explain that branded shopping
centers become tourist destinations. It is thus understandable why IKEA boosts shopping
tourism to the entry areas, thus increasing the customer base for the incumbent hotels and
restaurants4 .
These factors contribute to an increase in the attractiveness and thus the range of the
retail area. This means that customers travelling from longer distances are likely to patronize
the enlarged retail area, including some of the other incumbent shops and restaurants, due
to increased possibilities for comparison and multipurpose shopping (Brown, 1989; Chung
and Kalnins, 2001). Previous research shows that entry by IKEA increases the revenues of
incumbent retail firms selling complementary products (in general) and located relatively
close (within 2 km) to the new IKEA store (Han et al., 2018). The effect is also found to be
larger in regions where the new entry is large relative to the existing local market (Håkansson
et al., 2016; Han et al., 2018). An increase in the customer base may also mean a potential
increase in sales for the restaurants in the entry area.
2.2. IKEA as Substitute to the Hospitality Industry
According to agglomeration theories, both supply and demand externalities could bene-
fit incumbent restaurants in IKEA entry areas as they are substitutes to the new IKEA
restaurants. Supply-side spillovers are achieved through decreases in shared costs from, for
example, cost savings in distribution through shared infrastructure, better labor matching,
and lower costs of innovation due to increased knowledge spillovers from co-location (Mar-
shall, 1920; Hotelling, 1929; Weber, 1929; Christaller, 1933; Lösch, 1940). These spillovers
lead either to reductions in the costs for inputs used in production or more efficient per-
sonnel, and thus increase firm productivity (Grossman and Helpman, 1991; Lucas Jr., 1988;
Glaeser, 1999).
Demand-side spillovers from IKEA restaurants to incumbent restaurants are less likely,
since ‘comparison shopping’ in the restaurant industry is less common than in retailing. This
could mean that any positive effects from co-location may be counteracted by the centrifugal
forces created by increased competition. Entry by big-box retailers creates competitive
4
As IKEA attracts customers from longer distances, some of them would want to spend a night (or more) at
the hotel before returning home, generating demand spillovers to the hotel industry. This trend has become
stronger as shopping centers have become more popular as tourist destinations than seaside resorts, parks,
and main towns (Robertson and Fennell, 2007). In Sweden, revenues from shopping tourism (trips whose
primary goal are shopping activities) increased by 136 percent between 2000 and 2016, while revenues
in hospitality in general increased by 97 percent and in retailing by 85 percent (Svensk Handel, 2017).
This development is particularly important for smaller cities, such as Haparanda, where the income from
shopping tourism activities generated by the entry of such giants like IKEA may generate a large part
of their revenues. Such developments may generate so-called ‘self-reinforcing processes’ (Glaeser, 1999),
where, for example, entry by firms such as IKEA may stimulate the creation of new amenities (e.g., hotels
and restaurants) and the demand for specialized labor, which may stimulate further entry by firms in an
area and thus create agglomerations (Johansson and Karlsson, 2009).
c Southern Regional Science Association 2020.212 The Review of Regional Studies 50(2)
pressure in the entry regions because they are highly productive due to economies of scale
and due to innovations in logistics, distribution, inventory control, computerization and use
of specialized software, and communications (Foster et al., 2006; Basker, 2007), and many
of these factors also apply to the new IKEA restaurants.
The response of the incumbents to increased competition depends on their capacity to
increase their productivity or to differentiate their offer from that of the new entrant, but
also on whether the customer base is large enough to support increased trade on the same
local market (Freedman and Kosová, 2012). If incumbent restaurants in the entry area can
innovate and differentiate their products enough to make them attractive to the customers,
they will likely manage to increase their productivity and consequently survive the new
challenge. However, if incumbents lack an appropriate reaction or if the customer base is
not large enough (as it may very well be in sparsely populated areas), some of them will
experience a decrease in productivity and eventually they will be displaced from the market.
A new spatial equilibrium will then occur at a degree of spatial concentration where the
agglomeration forces balance competition (Krugman, 1991; Venables, 1996; Ottaviano et al.,
2002).
2.3. Differentiated Externalities
The expected impact of a new IKEA store on the hospitality industry is two-folded de-
pending on whether the incumbents are substitutes or complements to IKEA, and to which
section of IKEA (durable goods or food) we relate them. It is expected that the durables
section of IKEA increases the output of incumbent firms in the hospitality sector, prob-
ably less through supply- and much more through demand-side externalities as suggested
by the findings presented in Han et al. (2018). When it comes to IKEA Food, although
some supply externalities may occur (for example in the form of better labor matching or
knowledge spillovers), the strongest acting force might very well be increased competition
for the incumbent restaurants, which may reduce revenues faster than they can adjust their
use of inputs. Consequently, their profits may decrease, which may at some point in time
force them out of the market if they are not able to innovate and differentiate enough to
survive the challenge.5 So the question is whether supply and demand externalities created
by IKEA entry are greater than the negative effect produced by increased competition for
restaurants, coffee shops, and the like in the entry area.
2.4. Agglomeration Effects and the Size of the Local Market
The literature also indicates that wages have persistently lagged behind in rural regions,
compared with their urban counterparts (Henderson et al., 2001; Rice et al., 2006). This
difference is due to a gap in productivity between urban and rural areas, a gap that is
5
Our dataset is not ideally suited for identifying entry and exit. The only way of identifying entry and exit
is by recording when a specific organization number for a retail firm appears in or leaves the dataset. There
can, however, be a number of reasons for this, other than a formal entry or exit of a firm. If, for example,
the firm is sold, it is often the case that the firm is registered with a new organization number. Thus, we
are not able to analyze the effects of IKEA entry on the entry and exit of firms in the hospitality industry
in the entry regions.
c Southern Regional Science Association 2020.MIHAESCU & RUDHOLM: HOW DOES BIG-BOX RETAIL ENTRY AFFECT INCUMBENTS 213
inherently linked to firm productivity (Saito and Gopinath, 2009). This would suggest that
in small markets, where firms are on average less productive, competition effects generated by
entry of a large actor may be stronger than in urban areas, where firms are more productive.
This means that incumbent firms in the hospitality sector might have a harder time coping
with increased competition due to the IKEA Food entry, and consequently that the gap
between urban (large) and rural (small) markets is widened following the new large entry.
On the other hand, supply and demand externalities from the large and more productive
establishment may spillover to incumbent firms, helping them increase their output levels
in the long-run. Incumbent firms may also be forced to find innovative ways to survive the
challenge and thus force their productivity levels up. However, this depends to a great extent
on whether a large enough customer base is available in the area to serve both the large new
entrant and the smaller incumbents.
Previous research emphasized an inverse relationship between the size of the local market
and the positive effect of big-box entry on retail revenues, suggesting that positive spillovers
may be stronger in small markets than the centrifugal forces generated by competition. For
example, Håkansson et al. (2016) indicated that big-box entry increased the CPI-adjusted
revenues of incumbent retail firms in regions where the entry was large relative to the local
retail market, while no such effects could be found in the case of larger urban markets. Other
studies (Maican and Orth, 2015; Han et al., 2018; Rudholm et al., 2018) also show that the
impact of big-box retail entry is larger in magnitude for markets that are smaller relative to
the size of the new retailer, i.e., rural markets. This is, at first sight, surprising because the
urban spatial literature indicates that it is large markets that grow more rapidly because of
stronger spillovers and more highly-productive firms that want to locate in the area, thus
creating a self-reinforcing process (Glaeser, 2011; Andersson and Larsson, 2018). Theories
such as Reilly’s (1931) law also suggest that increasing the total size of a market leads to a
widening of the market, which may in the long-run lead to further entry, and thus growth of
the respective market. However, these theories also suggest that these positive externalities
may reach a saturation point when markets are too large and thus no further spillovers are
likely to occur. That previous studies have found the positive impact of big-box retail entry
on retail revenues to be larger in magnitude for rural markets is a clear sign that in such
markets the demand- and supply-side externalities outweigh the increased competition, at
least for retailers selling complement products to the big-box establishment.
2.5. Previous Studies
Studies on how shopping centers, big-box stores, and particularly entry by IKEA impact
the hospitality industry in the entry region is a field largely left unstudied. Most of the
literature on the relationship between retailing and hospitality is focused on the effects of
investments in shopping centers and of shopping center attributes on patronage. Maronick
and Stiff (1985) studied the effect of downtown shopping centers on patronage and found an
increase in the number of visits for recreation and dining-out in the entry area in the period
immediately following the entry. Kinley et al. (2002) added on the importance of shopping
center attributes in attracting tourists. Both internal attributes such as cleanliness, safety,
and the variety of the merchandise, as well as external attributes such as proximity to
c Southern Regional Science Association 2020.214 The Review of Regional Studies 50(2)
transportation hubs and location in general, were deemed essential for shopping tourists.
A few years later, Maronick (2007) found that the power of new specialty centers such as
festival markets to attract tourists wears off in time. They also found that such centers
attract ‘shopper tourists’ and ‘recreational shoppers’ rather than ‘conventional shoppers,’
which suggests that such developments may drive hospitality firms to locate in the area (see
also Chapin (2004)). According to Jacobs (1961), when a primary use (such as shopping) is
effectively combined with secondary diversity (such as restaurants), the city flourishes and
the secondary diversity may even become a primary use itself in time, reinforcing the cycle
and attracting even more customers to the area.
Only a few studies touched on the possible effects of large retailing on the hospitality
industry. Robertson and Fennell (2007) found that visitors of shopping centers form a
significant proportion of the trade of local hotels. They counted that up to 90 percent of
weekend guests in certain areas with retail centers in the U.K. were staying specifically to
undertake a shopping trip there, and that many returned on a regular basis. Shopping
centers are a main factor in attracting short trips and business tourists, which are higher
spenders than leisure visitors and also tend to return to attractive locations as leisure tourists.
Freedman and Kosová (2012) studied agglomerations of establishments in the hotel industry
and found that hotels are reluctant to enter areas with high concentrations of similar hotels
as opposed to hotels with other standards. Studying retailing, Han et al. (2018) found no
causal effects of increased agglomeration on substitute firms at all, while all positive effects
pertain to firms that sell complements to new large entrants. However, no equivalent studies
have to our knowledge been performed for the hospitality industry.
3. METHOD
In order to investigate the effects of IKEA entry on the CPI-adjusted revenues of incumbent
firms in the hospitality industry in Sweden during the period 2001–2010, we treat the four
IKEA entries in Sweden from 2004 to 2007 as exogenous events for the incumbent firms in the
hospitality sector in the entry regions. Then, we select suitable control municipalities to the
IKEA entry municipalities and use a difference-in-differences production function regression
model on firm level data to estimate the impact of IKEA entry on the revenues of these
firms. As such, we compare the CPI-adjusted revenues of hospitality sector firms in the
entry regions after IKEA entry with the CPI-adjusted revenues of the same firms before
IKEA entry, as well as with that of hospitality sector firms in the control regions throughout
the study period.
3.1. Selection of Control Group Municipalities
Two fundamental identification problems relate to our modeling strategy. First, it is im-
possible for a hotel or restaurant located in a region where an IKEA store enters to also
be observed in the counterfactual state of not having IKEA enter that region. Second, it
is likely that the regions chosen for entry by IKEA will differ substantially from randomly
selected regions. Greenstone et al. (2010) point out that firms choose locations in an ef-
fort to maximize profits. If we are to correctly measure how IKEA entry affects incumbent
c Southern Regional Science Association 2020.MIHAESCU & RUDHOLM: HOW DOES BIG-BOX RETAIL ENTRY AFFECT INCUMBENTS 215
hospitality sector firms in the entry regions, we need to identify control regions that are as
similar as possible to the entry regions with respect to the likelihood of IKEA entry and
other relevant regional characteristics.
In two studies of how entry by IKEA affects revenues and employment in the durable
goods retail industry in Sweden (Daunfeldt et al., 2015, 2017), control municipalities are
identified using logit estimations to detect municipalities where IKEA did not enter, but
which had a similar probability of entry based on observables. However, as pointed out
by Greenstone et al. (2010), such a strategy implies that the IKEA entry decision can be
correctly modeled by the observable characteristics of the municipalities, while in most cases
many important characteristics are generally unknown and unobserved by the researcher.
One obvious example is the subsidies often given to IKEA for entering certain municipalities,
which in some cases become known for the entry municipalities after entry, but which remain
unknown for the alternative entry sites (i.e., potential control municipalities).
Greenstone et al. (2010) address this problem by comparing the development for incum-
bent plants in winning counties to that of incumbent plants in losing counties that were the
new plant’s runner-up choice. As such, also the losing counties survived most of the selection
process but narrowly lost in the end, making it likely that the entry and runner-up counties
were similar in both observables and un-observables affecting the entry choice of the large
plant.
We instead follow Håkansson et al. (2016) and Han et al. (2018) and choose the next
round of IKEA entries, completed during the 2013–2016 period, as control municipalities for
three of the four IKEA entries in Sweden during the 2004–2007 period, i.e., Kalmar (2006),
Haparanda (2006), and Karlstad (2007). Our study period covers the years 2000-2010, and
the building permits for the 2013–2016 round of IKEA entries, i.e., Borlänge, Uddevalla, and
Umeå, were issued in 2011 (Borlänge and Uddevalla) and 2014 (Umeå), making it unlikely
that incumbents in these municipalities anticipated the arrival of the new IKEA stores during
our study period. The municipalities in the 2013–2016 round of entries are also similar to the
pre-IKEA entry characteristics of the entry municipalities (Kalmar, Haparanda, and Karl-
stad) in several observables. For example, both Karlstad and Umeå have local universities,
and both Borlänge and Kalmar have university college campuses, while the municipalities
of Haparanda and Uddevalla have no higher education institutions. In addition, both the
markets in the entry and in the control groups are essentially rural and similar in population
density with fewer than 80 inhabitants per square kilometer. Most importantly, however, is
that both the entry and control group municipalities were deemed suitable entry locations
by IKEA itself within a 10-year period, indicating that these municipalities should be similar
in terms of both observable and unobservable determinants of IKEA entry. Daunfeldt et al.
(2015, 2017) and Han et al. (2018) have also demonstrated that for the Swedish entries under
study, the regional spillover effects regarding revenues, employment, and productivity in the
retail industry of IKEA entry are limited to the entry municipalities. Therefore, we focus
our study on the potential spillover effects within the above-mentioned entry municipalities.
The fourth IKEA entry under study took place in the urban metropolitan area of Gothen-
burg in 2004 and is the second IKEA store in the region. Gothenburg is Sweden’s second
largest city; its metropolitan area consists of 13 municipalities and has approximately 1 mil-
lion inhabitants. As explained in Håkansson et al. (2016), only two other Swedish metropoli-
c Southern Regional Science Association 2020.216 The Review of Regional Studies 50(2)
tan areas can reasonably be considered potential control regions for Gothenburg: Stockholm
and Malmö.6 However, Malmö is a special case with its close ties to another metropolitan
area, Copenhagen. Thus, Stockholm metropolitan area, with its 26 municipalities and about
2 million inhabitants is more suited as a control for Gothenburg than Malmö. Most impor-
tantly, Stockholm has two IKEA stores, one in the northern and another in the southern part
of the metropolitan core, meaning that both Stockholm and Gothenburg have been deemed
suitable as two-store metropolitan areas by IKEA.
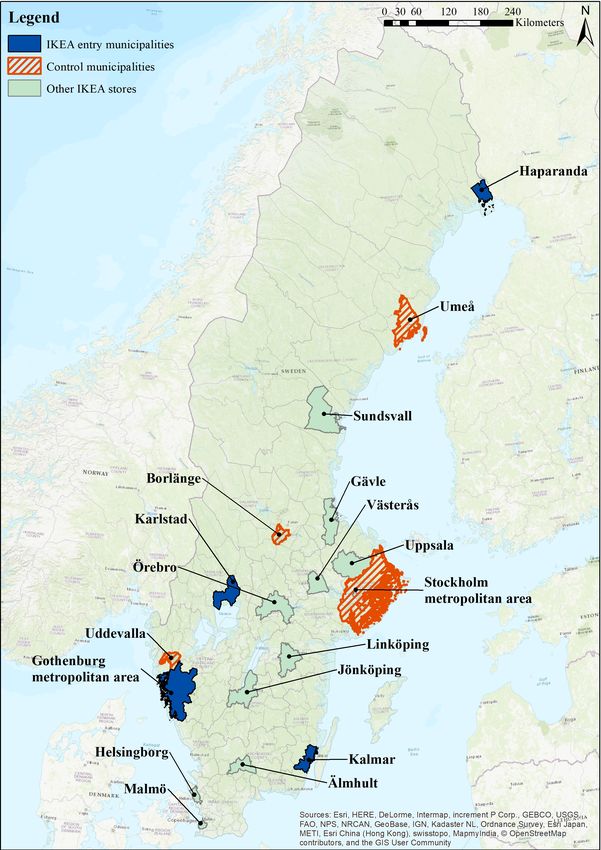
In Figure 2, the entries studied here (i.e., Gothenburg metropolitan area and Haparanda,
Kalmar, and Karlstad municipalities) are marked in (dark) blue while the control regions
(i.e., Stockholm metropolitan area and Borlänge, Uddevalla, and Umeå municipalities) are
marked with stripes. The other previous IKEA-entry municipalities are marked in (light)
green.
3.2. The Difference-in-differences Production Function Model
After selecting suitable control regions, we follow Greenstone et al. (2010) and Håkansson
et al. (2016) and use a difference-in-differences production function regression model to
measure the effect of IKEA entry on the CPI-adjusted revenues of incumbent hospitality
sector firms in the entry municipalities.
In our most general specification, the firms are assumed to use a production technology
that can be described by the transcendental logarithmic (translog) production function de-
veloped by Christensen et al. (1971). This functional form can be seen as a second-order
Taylor series approximation with a remainder term of an arbitrary production function, and
can be written as follows:
ln Qi,t = β1 lnLi,t−1 + β2 ln Ki,t−1 + β3 ln2 Li,t−1 + β4 ln2 Ki,t−1 + β5 ln Li,t−1 lnKi,t−1 + Ri,t , (1)
where Qi,t is a measure of output in hospitality sector firm i at time t, and where Li,t-1 and
Ki,t-1 are measures of the labor and capital inputs used by firm i, respectively, both lagged
one period.7
As discussed in Håkansson et al. (2016), the revenues of the studied hospitality firms
must be discounted using a price index to arrive at a relevant measure of output. As such,
following a suggestion of the OECD regarding how to measure output in multiple product or
service firms (OECD, 2001), output (Qi,t ), is defined as revenues of firm i in year t discounted
by the Swedish consumer price index (CPI). Labor (Li,t-1 ) is measured as the total number
6
As noted by Håkansson et al. (2016), municipalities in Swedish metropolitan areas are geographically very
small and not individually representative of the market of new IKEA stores. As such, we use metropolitan
areas instead of municipalities for comparison when studying the urban IKEA entry in Gothenburg.
7
A potential problem is that the input variables may be endogenous, i.e., they may correlate with the error
term of the equation for the CPI adjusted revenue of hospitality sector firms. Such endogeneity could be
due to missing or measurement errors in the data, but our main concern in this paper is endogeneity due
to revenues being simultaneously determined with the use of capital and labor. As such, we choose to use
lagged (i.e., predetermined) values of capital and labor in the estimation of equation (3).
c Southern Regional Science Association 2020.MIHAESCU & RUDHOLM: HOW DOES BIG-BOX RETAIL ENTRY AFFECT INCUMBENTS 217
Figure 2: IKEA-entry, Control, and Previous IKEA-entry
Municipalities in Sweden
of employees of firm i at time t − 1, while capital (Ki,t-1 ) is measured as the book value of
total capital of firm i at time t − 1, and both variables have been log transformed.
c Southern Regional Science Association 2020.218 The Review of Regional Studies 50(2)
Finally, Ri,t is the remainder term of the Taylor series approximation, which in most
empirical work is assumed to contain a constant and a random error term, making equation
(1) a standard ordinary least squares regression model. However, as we are interested in
measuring how the entry of an IKEA store in a region affects the revenues of incumbent
hospitality sector firms, i.e., whether IKEA entry causes a shift in the production function
of the affected firms while holding the levels of the capital and labor inputs constant, our
remainder term needs to take this into account. As such, we propose the following remainder
term:
Ri,t = β0 + β6 TRi + β7 TPt + βT P ∗T R (TPt ∗ TRi ) + γm + αn + εi,t (2)
where β0 is a constant, T Ri is an indicator variable equal to one for firms located in the
IKEA-entry region, and zero otherwise, and TPt is an indicator variable equal to one for the
treatment period (i.e., after IKEA entry), and zero otherwise. Our key variable of interest
is the interaction between TPt and TRi, as this will provide an estimate of the treatment
effect, i.e., how the revenues of incumbent firms in the hospitality sector in the entry region
after IKEA entry compares with their own revenues before entry, and with the revenues of
the hospitality sector firms in the control group throughout the study period, holding the
levels of inputs (i.e., labor and capital) constant. A positive and statistically significant
parameter estimate for βT P ∗T R indicates that revenues have increased while holding the use
of capital and labor constant. To control for heterogeneity between the IKEA entry- and
control municipalities, municipality fixed effects (γm ) are also included in our model. Finally,
the model contains four-digit NACE-code industry fixed effects (αn ) to consider possible
time-invariant heterogeneity across the different sub-industries belonging to the hospitality
sector. As such, the treatment effect will be identified by the change in treatment status of
hospitality sector firms within the same municipality and 4-digit SNI-2002 code hospitality
industry.8
Combining Equations (1) and (2) gives:
lnQi,t = β0 + β1 lnLi,t−1 + β2 ln Ki,t−1 + β3 ln2 Li,t−1 + β4 ln2 Ki,t−1 + β5 ln Li,t−1 lnKi,t−1 +
β6 TRi + β7 TPt + βT P ∗T R (TPt ∗ TRi ) + γm + αn +εi,t . (3)
Equation (3) is a difference-in-differences translog production function model in which
βT P ∗T R estimates the conditional average treatment effect. This type of difference-in-differences
estimator is one of the tools most frequently used in applied economics research to evalu-
ate the effects of public interventions and other treatments of interest on relevant outcome
variables (Abadie, 2005). As mentioned above, the ordinary least square estimation for
βT P ∗T R indicates a significant IKEA entry effect on the CPI-adjusted revenues of incum-
bent firms in the hospitality sector if we can reject the hypothesis that βT P ∗T R = 0. For
comparison, we will also present results from two other specifications, a Cobb-Douglas pro-
duction function difference-in-differences model and a traditional, non-production function
difference-in-differences model (see section 4 and the online supplemental material).
8
The SNI-2002 code system for industry classification is discussed in more detail in section 4 below.
c Southern Regional Science Association 2020.MIHAESCU & RUDHOLM: HOW DOES BIG-BOX RETAIL ENTRY AFFECT INCUMBENTS 219
The results from our empirical estimations are difficult to predict as they will be a
combination of two opposing forces. On one side, hospitality sector firms in entry regions
may became more productive in that they increase their revenues for given levels of labor and
capital after IKEA entry. Agglomeration economies caused by the new IKEA may function
as centripetal forces since knowledge spillovers may make labor more productive and there
may be demand externalities from the pull generated by the size, order of goods sold, and
reputation of IKEA. However, co-location with IKEA also intensifies competition, especially
for incumbent restaurants, and could do so to the extent that the positive agglomeration
effects are dominated by the competition effects.
4. DATA, DESCRIPTIVE STATISTICS, AND ESTIMATION RESULTS
To investigate the effect of IKEA entry on the revenues of incumbent hospitality sector firms
in IKEA-entry municipalities, we use data on all limited liability companies in the hospitality
industry that were active in the entry and control municipalities at some point between 2001
and 2010. The data were collected from PAR, a Swedish consulting firm that compiles this
information from the Swedish Patent and Registration Office (PRV), and include all variables
registered in the annual reports.
The determination of if a firm belongs to the hospitality industry is made based on the
firm’s reported main activity within the Swedish SNI-2002 code system. According to the
Swedish industry classification (SNI)9 , the hospitality industry includes data on accommo-
dation facilities (assembled in this paper under the denomination of ’hotels:’ hotels, hostels,
conference facilities, camping sites, and holiday villages) and on food facilities (or ‘restau-
rants,’ including not only restaurants but also coffee shops, bars, restaurants in hospitals,
schools, and other institutions, and catering activities). Of the 7,775 firms in our sample, 20
percent are hotels and 80 percent are restaurants which also resembles the distribution at
the national level. Consequently, the results presented below will to a larger extent be driven
by the restaurant industry, making it more likely that the competition effects outweigh the
agglomeration effects since the food sector hospitality firms must compete with the new
IKEA restaurants after entry. A potential caveat is that this classification does not allow us
to differentiate between the effects of IKEA entry on accommodation and on food facilities
since many of the firms within the accommodation category also include food facilities at
their place of business.
Descriptive statistics for the variables included in the empirical model are presented in
Table 1, and the t-tests of differences in means indicate that the data from the entry and
control municipalities are quite similar, not only for output but also for our measures of
capital and labor.
9
Similar to the European NACE-code system.
c Southern Regional Science Association 2020.220
Table 1: Means, Standard Deviations, T-tests of Differences in Means, Variable Description, and Data Source for Incumbent
Firms in the Hospitality Industry
Small Small Large Large
market market Mean market market Mean Variable Data
Variable entries controls difference t-value entry control difference t-value description source
Haparanda Kalmar Karlstad Gothenburg
lnQi,t 6.61 6.59 6.54 6.54 0.097** 2.12 6.55 6.59 -0.004 -0.17 Revenues of firm i in year t PAR/Statistics
(0.74) (0.70) (0.51) (0.73) (0.72) (0.77) discounted by CPI Sweden/own
calculations
lnKi,t−1 5.64 5.72 5.44 5.48 0.082 1.31 5.60 5.48 0.095*** 2.85 Total capital of PAR/own
(1.70) (1.90) (1.65) (1.87) (2.02) (2.07) firm i in year t calculations
lnLi,t−1 1.12 1.58 1.58 1.56 0.005 0.15 1.72 1.62 0.004 0.22 Total number of employees PAR/own
(0.86) (0.88) (0.87) (0.96) (1.11) (1.14) of firm i in year t calculations
c Southern Regional Science Association 2020.
ln2 Ki, t − 1 34.60 36.31 32.34 33.50 -0.128 -1.17 35.46 34.29 -0.115 -1.38 lnKi,t−1 squared PAR/own
(17.44) (23.43) (18.22) (20.50) (23.30) (24.84) calculations
2
ln Li,t−1 1.98 3.29 3.25 3.34 0.467 0.66 4.18 3.92 0.746* 1.91 lnLi,t−1 squared PAR/own
(1.97) (2.96) (3.21) (3.37) (4.99) (5.17) calculations
lnKi,t−1 lnLi,t−1 6.59 10.02 9.44 9.66 -0.143 -0.55 11.41 10.65 -0.005 -0.03 lnLi,t−1 multiplied PAR/own
(5.43) (7.55) (6.82) (7.32) (10.05) (10.43) by lnKi,t−1 calculations
T Pt 0.53 0.57 0.45 0.54 0.019 1.33 0.72 0.55 0.001 0.19 Indicator variable equal to one Own
(0.50) (0.49) (0.50) (0.50) (0.45) (0.50) for treatment period years calculations
T Ri 1.00 1.00 1.00 0.00 1.00 . 1.00 0.00 1.00 . Indicator variable equal to Own
(0.00) (0.00) (0.00) (0.00) (0.00) (0.00) one for firms located in calculations
treatment municipalities
T Pt × T Ri 0.53 0.57 0.45 0.00 0.124*** 44.52 0.72 0.00 0.711*** 139.64 Indicator variable equal to one Own
(0.50) (0.49) (0.50) (0.00) (0.45) (0.00) for firms located in treatment calculations
municipalities in treatment years
Note: The t-test of difference in means for the small markets has been performed between averages over the three entries (Haparanda, Kalmar, Karlstad) and the averages of the three controls
(Borlänge, Uddevalla, and Umeå).
The Review of Regional Studies 50(2)MIHAESCU & RUDHOLM: HOW DOES BIG-BOX RETAIL ENTRY AFFECT INCUMBENTS 221
Table 2: Estimation Results, Dependent Variable lnQi,t , Translog Model
Haparanda Kalmar Karlstad Gothenburg
coef. std. err. coef. std. err. coef. std. err. coef. std. err.
lnKi,t−1 -0.012 0.042 0.009 0.036 0.060 0.037 0.098*** 0.018
lnLi,t−1 0.359*** 0.115 0.457*** 0.119 0.218** 0.101 0.191*** 0.023
ln2 Ki,t−1 0.015*** 0.004 0.009** 0.004 0.005 0.004 0.002 0.002
ln2 Li,t−1 -0.003 0.022 -0.054** 0.024 0.006 0.019 0.004 0.004
lnKi,t−1 lnLi,t−1 -0.048*** 0.017 -0.032* 0.018 -0.032** 0.015 -0.027*** 0.000
T Pt 0.099** 0.040 0.095** 0.039 0.106*** 0.035 0.035** 0.020
T Ri 0.143 0.090 0.036 0.061 0.019 0.059 0.258 0.200
T Pt × T Ri -0.418** 0.190 -0.139** 0.066 -0.108** 0.041 -0.009 0.027
Treatment Effect -34.16%** -12.98%** -10.24%** -0.90%
Industry FE yes yes yes yes
Municipality FE yes yes yes yes
Obs 1,070 1,392 1,466 15,303
R2 0.12 0.10 0.10 0.11
*** significant at the 1 percent level, ** significant at the 5 percent level, and * significant at the 10 percent
level. Note: The treatment effects are calculated using the formula 100 × [exp(βT P ∗T R ) − 1], which allows us
to present the results in percentage terms (Woolridge, 2010). We use Huber-White robust standard errors
in all our estimated models.
The results from the estimation of equation (3) are presented in Table 2. The main
variable of interest is the interaction between being a hospitality sector firm located in the
entry regions (TRi ) and having an observation related to the time period after entry (TPt ).
The parameter estimate related to this variable compares the CPI-adjusted revenues of
hospitality sector firms in the entry region after IKEA entry with the revenues of the same
firms before IKEA entry, and with that of hospitality sector firms in the control regions
throughout the study period. The log transformation of revenues in the hospitality sector
firms (Qi,t ) has the benefit of making the parameter estimate related to the effect of IKEA
entry from our difference-in-differences model interpretable in percentage terms after using
the formula 100×[exp(βT P ∗T R ) – 1]. The index T P ∗ T R indicate that it is the parameter
estimate related to the interaction variable equal to one for hospitality sector firms being
in the entry regions (T R) in the period after IKEA entry (T P ) that should be used in the
calculations (Woolridge, 2010). These results interpreted in percentage terms are presented
on the row marked Treatment Effect in Table 2.
The results show that IKEA entry decreased the revenues of incumbent hospitality sector
firms by, on average, 34 percent in Haparanda, the smallest market analyzed in our study.
For Kalmar, the decrease in revenues was 13 percent, while for the larger entry municipality
of Karlstad the effects were smaller (10 percent), but still statistically significant at the
5 percent level. No statistically significant effects were found for the IKEA entry in the
Gothenburg metropolitan area10 .
10
To eliminate the possibility that the null effect is being driven by establishments in municipalities that
are far from the new store, we have excluded from our sample all the municipalities that are not adjacent
neighbors to the entry municipality of Gothenburg. We have done the same for the control metropolitan
area of Stockholm and excluded all the municipalities that are not adjacent neighbors to the two munic-
ipalities that have IKEA stores in this area. Rerunning our regression with the new entry and control
c Southern Regional Science Association 2020.222 The Review of Regional Studies 50(2)
Figure 3: Pre- and Post-treatment Trends in Residuals for
each Entry and the Corresponding Control Municipalities
c Southern Regional Science Association 2020.MIHAESCU & RUDHOLM: HOW DOES BIG-BOX RETAIL ENTRY AFFECT INCUMBENTS 223
Table 3: IKEA Entry Effect on the Productivity of Incumbent Firms in Hospitality
Haparanda Kalmar Karlstad Gothenburg
Translog model -34.16%** -12.98%** -10.24%** -0.90%
Cobb-Douglas model -33.44%** -14.27%** -10.42%** -1.09%
Difference-in-differences model -31.55%** -19.43%*** -3.54% 0.30%
*** significant at the 1 percent level, ** significant at the 5 percent level, and
* significant at the 10 percent level. Estimation results of T Pt × T Ri , dependent
variable lnQi,t ; results in percentage terms, i.e., calculated using the formula
100 × [exp(βT P ∗T R ) − 1].
A key assumption in our difference-in-differences identification strategy is that trends in
the treatment and control municipalities would have been parallel in absence of treatment.
This assumption is impossible to test formally, but to give an indication of its validity, we
follow Pope and Pope (2015) and graphically illustrate output trends in entry and control
municipalities before and after IKEA entry. Following Pope and Pope (2015), we run the
regression model described in equation (3) using the data for each entry and the correspond-
ing control municipalities, while leaving out the treatment municipality indicator and the
interaction with the treatment period. We then aggregate the residuals for each year and
plot them over the entire period of analysis. The graphs (Figure 3) show that the residual
pre-entry trends in entry and control municipalities are parallel for all four entries in our
study. One minor exception is that there appears to be a bit of an anticipatory effect, with
the dip starting in all situations about a year earlier, likely after the plan to open a new
store has been announced. Furthermore, while the trend for Gothenburg is not changing
for the entire period of analysis, we observe that for the other three municipalities (where
we obtain negative and significant effects) there is a shift at the time of IKEA entry. The
shift is smaller in the case of Karlstad and largest in the case of Haparanda, where we also
observe the largest effect of IKEA entry.
In Table 3, we compare the results from our preferred model (the translog model) with
results from two other, less general, models. The full tables of estimates for the additional
models can be found in the Appendix.
The results from the estimation of the Cobb-Douglas production function model indicate
that the effects are very similar to those from our preferred (translog) model, showing a
decrease of 33 percent for Haparanda, 14 percent for Kalmar, and 10 percent for Karlstad.
This indicates that the treatment effect variable is not correlated with the squared labor
and capital terms to any significant extent. Otherwise removing these variables would have
caused missing variable bias (Studenmund, 1914) and thus changed the estimate of the
treatment effect. The results remain very similar for the small market of Haparanda even
if we use a traditional difference-in-differences model excluding all labor and capital terms
from the regression. This indicates that hotels and restaurants in Haparanda did not change
their labor and capital levels in any major way at the time of IKEA entry. Otherwise the
municipalities, that are now either the entry municipalities themselves or directly adjacent to the entry
municipalities, we observe no change in the result. The new coefficient for the treatment variable is 0.002,
with an attached standard error of 0.06 (p-value of 0.951). This indicates that the null effect in Gothenburg
is not driven by establishments in municipalities that are far away from the new store.
c Southern Regional Science Association 2020.224 The Review of Regional Studies 50(2)
capital and labor variables would have been correlated with the treatment effect variable
and would have caused omitted variable bias altering the estimate of the treatment effect
when removing these variables from the regression.
For the entries in Kalmar and Karlstad, we do note a change in the size of the treatment
effect estimates when using the difference-in-differences model rather than the translog or
Cobb-Douglas model. These changes indicate that labor and capital (now removed from the
model) are correlated to the treatment effect variable, and thus generate omitted variable
bias when excluded. This is an indication that hotels and restaurants in Kalmar and Karlstad
changed their use of labor and/or capital in direct connection in time with IKEA’s entry
into the region.
The results also show that the impact of new IKEA stores on firms in the hospitality
sector is inversely related to the size of the local market. The effect is the largest in the
rural market of Haparanda, the smallest market with a population of 10,059 in 2010, and the
impact becomes smaller the larger the market becomes as Kalmar had 62,815 inhabitants
and Karlstad had 85,753 inhabitants in 2010. None of the models show significant results
for the Gothenburg metropolitan area with a population of almost 1 million inhabitants in
2010. These results can be compared to those of Håkansson et al. (2016) and Han et al.
(2018), who report that IKEA entry had a positive and statistically significant impact on
the revenues of incumbent retailers only in the smaller entry municipalities of Haparanda
and Kalmar, while no statistically significant effects were reported for the larger markets,
Karlstad and Gothenburg. However, while Han et al. (2018) found no significant effects on
firms selling substitute goods, we do find that the effects on firms in the hospitality sector
are negative and significant. Our results thus show the importance of taking into account
how the entrant firm will affect all products and services that incumbent firms in the entry
areas are providing and not only those directly related to the entrant itself. This also shows
the importance of using disaggregated data not only at the geographical, but also at the
industry level, when studying potential spillover effects of big-box retail entry.
5. SUMMARY AND DISCUSSION
The purpose of this paper has been to investigate inter-industry effects of IKEA entry on the
revenues of incumbent firms in the hospitality industry. The results show that IKEA entry
negatively affects revenues for firms in the hospitality sector in the entry municipalities and
that the magnitude of the effect is inversely proportional with the size of the local market of
entry. IKEA entry decreased the CPI-adjusted revenues of incumbent firms in the hospitality
industry by 34 percent for the smallest municipality in our study, Haparanda. For Kalmar,
the decrease was 13 percent, while for the larger entry municipality of Karlstad the results
showed a decrease of only 10 percent. No statistically significant effects were found for the
IKEA entry in the Gothenburg metropolitan area.
The most obvious explanation for these results would be that any positive externalities,
both on the supply and on the demand side, are overshadowed by competition effects for
firms in the hospitality industry. We believe that this is due to the IKEA restaurant cap-
turing a large share of existing diners from the incumbent restaurants and this effect being
larger than any effects on lodging. This is a likely development after IKEA entry as it is
c Southern Regional Science Association 2020.MIHAESCU & RUDHOLM: HOW DOES BIG-BOX RETAIL ENTRY AFFECT INCUMBENTS 225
a Swedish custom to eat lunch (rather than dinner) out, and both IKEA and most of the
incumbent restaurants in the entry municipalities compete for the lunch guests. While most
Swedish restaurants offer lunch that costs between 85 (7.99 EUR11 ) and 110 SEK (10.34
EUR11 ), lunch alternatives in IKEA restaurants cost at the most 79 SEK (7.45 EUR11 ) with
some alternatives (including Swedish meatballs) available for 49 SEK (4.61 EUR11 ). In ad-
dition, IKEA restaurants offer a nice environment that can accommodate a high number of
customers, making the IKEA restaurant a strong competitor in any local restaurant market.
This result is also boosted by the fact that we have a dominance of restaurant and similar
facilities over hotels (and other accommodation facilities) in our sample. Of the 7,775 firms
in our sample, 20 percent are hotels and 80 percent are restaurants. The proportion is
approximately the same in all four municipalities under study and resembles the proportion
at national level – 24 percent hotels and 76 percent restaurants. Furthermore, many of
the hotels include restaurants and other food facilities but are registered under the “hotel”
category, so the actual proportion of restaurants is even larger. Unfortunately, the data does
not allow us to disaggregate further and check the effect on hotels and restaurants separately,
but it is likely that our results are driven by the restaurant facilities in each area under study.
The magnitude of the effects is larger in smaller markets, showing that, in the case of the
hospitality sector, the gap in firm revenues between small and large markets is accentuated
by IKEA entry. IKEA brings in a combination of goods and services that makes shopping
an experience and attracts more customers. Smaller municipalities often do not have a large
enough customer base to cover both the new large entrant and the incumbents, which makes
it likely that the new IKEA restaurant will attract customers from incumbent restaurants
in the area. This means less sales for incumbent restaurants, and thus a decrease in their
profits if they are not able to adjust their use of inputs such as capital and labor to a similar
extent.
The finding that an IKEA entry has a larger impact on incumbents in smaller markets is
not that surprising bearing in mind how large an IKEA entry is compared to existing restau-
rants in the smaller entry municipalities. Although IKEA never releases any local statistics
regarding sales, we know that IKEA Food has an average yearly turnover of 1.7 billion SEK1
in Sweden (IKEA, 2016), which would mean an average of about 85 million SEK12 per IKEA
restaurant and year. As such, one might expect a larger impact on existing hospitality firms
in the smaller markets (Haparanda, Kalmar, and Karlstad) than in Gothenburg. Consider-
ing all four entry municipalities, the average market share of the IKEA restaurants is 7.22
percent of total municipal turnover in hospitality as a whole, and 10.29 percent of total
turnover in the restaurant market. When excluding Gothenburg, the average market share
of the IKEA restaurants is 40.55 percent of total municipal turnover, and 84.16 percent of
total turnover in the restaurant market.
Moreover, although our results may seem to indicate that local support in the form of
subsidies for the establishment of IKEA stores in small-city regions may not be a good idea
if the region has a large hospitality industry, possible benefits may eventually give taxpayers
their money’s worth in the long-term. IKEA may, for example, increase the attractiveness of
11
Exchange rate 2019-06-24, 1 SEK = 0.094 EUR.
12
Approximately 8 million EUR. Exchange rate 2019-06-24, 1 SEK = 0.094 EUR.
c Southern Regional Science Association 2020.You can also read