PACIFIC REGION INTEGRATED FISHERIES MANAGEMENT PLAN GROUNDFISH EFFECTIVE FEBRUARY 21, 2021
←
→
Page content transcription
If your browser does not render page correctly, please read the page content below
PACIFIC REGION

         INTEGRATED FISHERIES
           MANAGEMENT PLAN
             GROUNDFISH

     EFFECTIVE FEBRUARY 21,
              2021
                                                    VERSION 1.0

                               Roughscale Sole (Clidoderma asperrimum)

This Integrated Fisheries Management Plan is intended for general purposes only. Where there is a discrepancy between
the Integrated Fisheries Management Plan and the regulations, the regulations are the final authority. A description of
Areas and Subareas referenced in this Integrated Fisheries Management Plan can be found in the Pacific Fishery
Management Area Regulations.

Groundfish Integrated Fisheries Management Plan - Summary
This page intentionally left blank
Page 2 of 38
Groundfish Integrated Management Plan - SummaryFOREWORD
The purpose of this Integrated Fisheries Management Plan (IFMP) is to identify the main
objectives and requirements for the Groundfish fishery in the Pacific Region, as well as
the management measures that will be used to achieve these objectives. This document
also serves to communicate the basic information on the fishery and its management to
Fisheries and Oceans Canada (DFO) staff, legislated co-management boards and other
stakeholders. This IFMP provides a common understanding of the basic “rules” for the
sustainable management of the fisheries resource.
This IFMP is not a legally binding instrument which can form the basis of a legal
challenge. The IFMP can be modified at any time and does not fetter the Minister's
discretionary powers set out in the Fisheries Act, Species At Risk Act, and Oceans Act.
The Minister can, for reasons of conservation or for any other valid reasons, modify any
provision of the IFMP in accordance with the powers granted pursuant to the Fisheries
Act, Species At Risk Act, and Oceans Act.
Where DFO is responsible for implementing obligations under land claims agreements,
the IFMP will be implemented in a manner consistent with these obligations. In the event
that an IFMP is inconsistent with obligations under land claims agreements, the
provisions of the land claims agreements will prevail to the extent of the inconsistency.
This IFMP is a living document that will be subjected to a review every two years for
updates, with input from interested parties. Any changes required within a given fishing
season will continue to be made as needed.
IFMP documents are available from the DFO Pacific Region Internet site:
http://www.pac.dfo-mpo.gc.ca/fm-gp/ifmp-eng.html.
1. INTRODUCTION
1.1. History
Each year Fisheries and Oceans Canada provides opportunities to First Nations
for food, social and ceremonial (FSC) purposes (or domestic purposes for First
Nations with modern treaties), and the commercial and recreational fisheries to
harvest groundfish. First Nations, recreational, and commercial fisheries on the
Pacific Coast of Canada have long harvested groundfish. Groundfish serve as a
source of food, they provide jobs, income, and enjoyment for individuals,
businesses, and coastal communities and they play key roles in natural
ecosystems.
2. TYPE OF FISHERY AND PARTICIPANTS
2.1. First Nations
Page 3 of 38
Groundfish Integrated Management Plan - SummaryIn the 1990 Sparrow decision, the Supreme Court of Canada found that where an
Indigenous group has an Indigenous right to fish for food, social, and ceremonial
(FSC) purposes, it takes priority, after conservation, over other uses of the
resource. Fisheries are authorized via a Communal Licence issued by the
Department under the Aboriginal Communal Fishing Licences Regulations.
For additional information regarding indigenous fisheries, refer to section 7.1 of
this summary.
2.1.1. Recreational
A recreational fishery may occur where authorized by a valid Tidal Waters Sport
Fishing licence, which is required for the recreational harvest of all species of
fish. Approximately 300,000 Tidal Waters Sport Fishing licences are sold each
year. Tidal Waters Sport Fishing Licences can be purchased online by using the
DFO website:
http://www.pac.dfo-mpo.gc.ca/fm-gp/rec/licence-permis/application-eng.html
2.1.2. Commercial
There are seven distinct commercial groundfish sectors: Groundfish trawl,
Halibut, Sablefish, Inside Rockfish, Outside Rockfish, Lingcod, and Dogfish
fisheries that are managed according to the measures set out in this management
plan. The management of these sector groups is integrated, with all groups subject
to 100% at-sea monitoring and 100% dockside monitoring, individual vessel
accountability for all catch (both retained and released), individual transferable
quotas (ITQ), and reallocation of these quotas between vessels and fisheries to
cover catch of non-directed species. There are approximately 250 active
commercial groundfish vessels. Information on licensed vessels is available
online at the DFO website: http://www.pac.dfo-mpo.gc.ca/fm-gp/licence-
permis/index-eng.htm.
First Nations have communal access to commercial opportunities through
communal commercial licences acquired through the Allocation Transfer Program
(ATP) and Pacific Integrated Commercial Fisheries Initiative (PICFI). The Maa-
nulth have an allocation for commercial groundfish fishing outside of the Treaty
as identified in the “Maa-nulth First Nation Harvest Agreement”. The allocations
in the Harvest Agreement do not affirm Indigenous or Treaty rights. These
licences are fished in a manner that is comparable to the general commercial
fishery.
Page 4 of 38
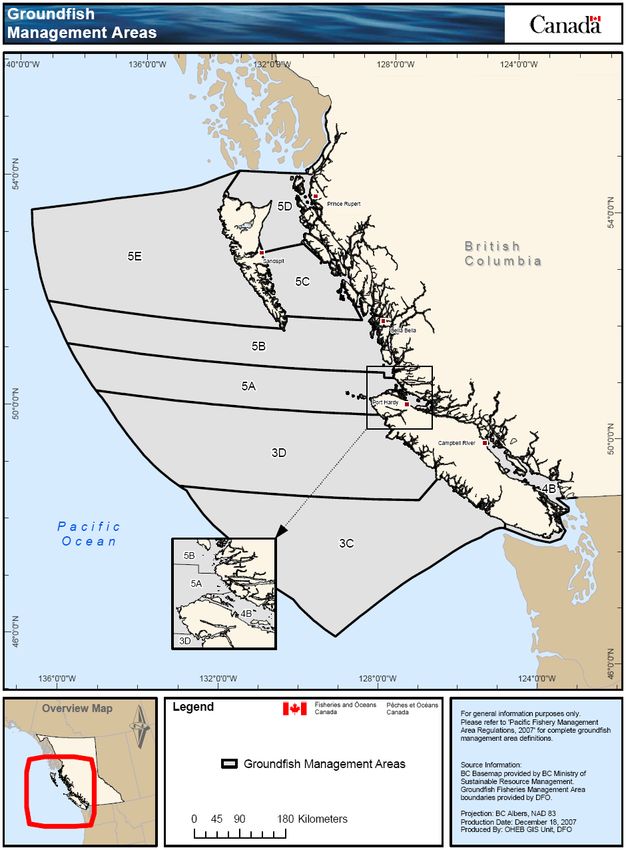
Groundfish Integrated Management Plan - SummaryFigure 1: Commercial Groundfish Management Area Map
Page 5 of 38
Groundfish Integrated Management Plan - Summary3. STOCK ASSESSMENT, SCIENCE & TRADITIONAL KNOWLEDGE
3.1. Groundfish Stock Assessment Program
Stock assessment and research programs involving groundfish are conducted by
the Department and through cooperative research programs carried out in
conjunction with industry associations. Stock assessment advice has been
provided for over 70 commercially exploited groundfish stocks. Science
personnel, in association with DFO fishery managers and groundfish user group
representatives, establish assessment priorities and timing schedules for
assessments. These programs are intended to support ongoing evaluation of
management measures. Opportunities for stakeholder involvement and co-
operative ventures in research and assessment activities are pursued.
During the 2020/21 fishery season, harvest advice has been published for Pacific
Cod, Rougheye/Blackspotted Rockfish complex, and inside Yelloweye Rockfish
population. A new approach for the provision of harvest advice was also
published with the Management Procedure Framework for British Columbia
Groundfish. Regularly provided updates for outside Yelloweye Rockfish
population and Sablefish based on adopted management procedures were
provided (section 6.1.5.4), as were updates for Pacific Hake and Halibut 1. During
the 2021/22 fishery season, harvest advice is anticipated for Arrowtooth Flounder,
Yellowmouth Rockfish, and updates for Bocaccio, Pacific Cod and the outside
Yelloweye Rockfish population.
Upon receipt of science advice and in consultation with Departmental advisory
processes, catch limits have been reviewed for Pacific Cod,
Rougheye/Blackspotted Rockfish complex, Bocaccio and the inside Yelloweye
Rockfish population.
Pacific Cod
A Science Response provide updated advice for Pacific Cod stocks in 3CD and
5ABCD based on Assessment of Pacific Cod (Gadus macrocephalus) for Hecate
Strait and Queen Charlotte Sound (Area 5ABCD), and West Coast Vancouver
Island (Area 3CD) in 2018 (2020/070). The 2018 assessment recommended
updates in each area be provided in years immediately following the biennial
groundfish synoptic bottom trawl survey (i.e., when the most recent survey index
point is available). Fishery-independent synoptic bottom trawl surveys are
typically conducted biennially in BC, usually occurring in even-numbered years
for West Coast Vancouver Island (WCVI), and odd-numbered years in Queen
Charlotte Sound and Hecate Strait. However, due to the coronavirus disease 2019
1
Pacific Halibut and Pacific Hake are two groundfish species with assessments that are
delivered outside the CSAS process. These species are each managed under the auspices
of treaties between Canada and the United States, which have their own annual stock
assessment and advisory process. 2 Details of concluded final agreements can be found at
https://www.rcaanc-cirnac.gc.ca/eng/1100100030588/1542730442128.
Page 6 of 38
Groundfish Integrated Management Plan - Summary(COVID-19) pandemic, the scheduled 2020 WCVI survey did not occur.
Nonetheless, a Science Response was completed with available catch data and
2019 survey data. The Science Response estimated the 3CD stock to be in the
Cautious Zone, as was the case in the 2018 assessment. However, the stock is
estimated to have declined in abundance and is estimated to be closer to the LRP
than in the previous assessment. The probability of the fishing mortality
exceeding the limit removal rate (LRR) is less than 1% for all levels of catch up to
400 t. A concern noted within Science Response is the lack of a WCVI synoptic
survey update in 2020. The Science Response recommend surveying this area as
soon as it is feasible to do so, then updating this advice. The 5ABCD stock is
estimated to be in the Cautious Zone, as it was in the 2018 assessment. The
probability of the stock exceeding the LRR is less than 1% for all levels of catch
up to 1,400 t. Given the science advice and recent fishery removals, the catch
limit for 3CD is lowered from 500 t to 300 t, as described in section 6.1.5.4. No
change had been made for the 5ABCD stock, which remains at 950 t.
Rougheye/Blackspotted Rockfish complex
Two spatial stocks of the Rougheye/Blackspotted (REBS) Rockfish complex have
been identified along the BC coast, based loosely on the spatial distribution of
genetically confirmed specimens from surveys: the northern REBS stock (REBS
North) in groundfish management areas 5DE is predominantly comprised of
Blackspotted Rockfish, and the southern stock (REBS South) in 3CD5AB is
largely comprised of Rougheye Rockfish. The science advice noted an area of
hybridization in area 5C and recognised that these spatial definitions only
approximate the true species distribution. This distribution approach was adopted
in the absence of a more reliable methodology to identify the species and their
distribution.
Median biomass estimates for REBS North suggest that the stock is above the
Upper Stock Reference point with > 99% probability (i.e. within the Healthy
zone), and that the current exploitation rates is less than the rate associated with
maximum sustainable yield. Given the science advice and recent fishery
removals, the catch limit for REBS North is 800 t, as described in section 6.1.5.4.
Median biomass estimates for REBS South suggest that the stock is above the
Upper Stock Reference point with greater than 74% probability (i.e. within the
Healthy zone), but that the current exploitation rates is greater than the rate
associated with maximum sustainable yield. At current removal rates, the REBS
South stock is projected to fall below the USR over the next 75 years (1.5
generations). Given the science advice and recent fishery removals, the catch limit
for REBS South is 300 t, as described in section 6.1.5.4. The previous coastwide
catch limit for Rougheye Rockfish was 1,144 t, and the combined catch limit for
the REBS complex North and South totals 1,100 t. The Science Advisory Report
recommends that the next REBS assessment occur by 2030, or sooner, subject to
the availability of new information. During intervening years, the trend in
abundance can be tracked by surveys which sample this species, as well as by
Page 7 of 38
Groundfish Integrated Management Plan - Summarycommercial fishery CPUE. when additional catch indices and aging data will be
available.
Bocaccio and Inside Yelloweye Rockfish
Through the process of regular evaluation of the rebuilding plans, science advice
on stock status and rebuilding strategies for Bocaccio (December 2019) and the
inside Yelloweye Rockfish population (June 2020) was provided.
Bocaccio spawning biomass is estimated to have declined by more than 95% over
the past 50 years, with the most significant declines occurring prior to 1970 and
after 1990. While Bocaccio is currently still estimated to be less than its Limit
Reference Point, a significant recruitment event occurred in 2016. As a result of
this event there is a greater than 90 percent probability that Bocaccio’s estimated
stock status will be greater than the Upper Stock Reference (USR) by 2025. The
USR is the stock threshold below which removals must be progressively reduced
in order to avoid reaching the LRP. A stock status above the USR is often referred
to as the “healthy zone.” This projected growth above the USR assumes a total
annual mortality of up to 500 t. Estimated average mortality from all sources
between 2015 – 2019 is 69 t. Bocaccio recruitment events and management
responses of the same magnitude recently occurred in US waters.
Scientific advice for the inside Yelloweye Rockfish was provided through the
application of a new management strategy evaluation framework recently
developed for BC groundfishes (the Management Procedure [MP] Framework)
(Anderson et al. 2020). This was the first stock to use the MP Framework, which
was used to evaluate the performance of alternative data-limited MPs to support
the current rebuilding plan for inside Yelloweye Rockfish population. None of the
models estimated the median stock biomass to be below the LRP (the Critical
zone) in 2019. Differences in estimates of inside Yelloweye Rockfish stock status
between the current models and previous assessment were attributable to model
structure choices. Based on performance relative to the objectives, the rank order
of the five candidate management approaches was assessed and a MP with
constant catch policy of 15 t was adopted.
DFO’s 2001 rockfish conservation strategy set out four components:
comprehensive catch monitoring; dramatically reduced fishing mortality;
extensive fishery closed areas; and improved stock assessment and monitoring.
All aspects of this conservation strategy remain important and are facilitated
through DFO’s integrated fishery management measures and Rockfish
Conservation Areas. Rebuilding Plans for Bocaccio and associated management
measures remain in effect. Given these measures and the science advice noted
above the 2021/22 mortality cap for Bocaccio will be increased to 483 t from 363
t, while the 2021/22 mortality cap for inside Yelloweye Rockfish will remain at
15 t, as described in Appendix 9.
Page 8 of 38
Groundfish Integrated Management Plan - Summary3.2. Canadian Science Advisory Secretariat
Science is the basis for sound, evidence-based decision making. DFO Science
Sector provides advice on the likelihood of achieving policy objectives under
alternative management strategies and tactics. The Canadian Science Advisory
Secretariat (CSAS) oversees the provision of all scientific advice required by
operational client sectors within the Department (Fisheries Management,
Ecosystems Management, and Policy). In the Pacific Region, science advisory
processes are managed by the Centre for Science Advice Pacific (CSAP).
Scientific assessments and advice on the assessment and management of the
Groundfish fishery is peer reviewed annually in Regional Peer Review (RPR)
meetings. Government and non-government individuals with knowledge and
technical expertise pertaining to each RPR meeting are invited to contribute to the
peer review and development of advice, based on the science presented. The
schedule of CSAS meetings is available online at: http://www.isdm-
gdsi.gc.ca/csas-sccs/applications/events-evenements/index-eng.asp. General
information about the CSAS Policies, Procedures, Schedule and Publications can
be found at: http://www.dfo-mpo.gc.ca/csas-sccs/index-eng.htm.
Science advice, proceedings and stock assessments/scientific evaluations resulting
from CSAS meetings are available online at: http://www.meds-sdmm.dfo-
mpo.gc.ca/csas-sccs/applications/Publications/index-eng.asp.
3.3. Biological Synopsis
In addition to work directed at providing stock assessments, DFO staff and
contracted service providers conduct routine data collection and compilation, and
specialized research on the general biology of groundfish in support of stock
assessment. The routine work includes:
• Collection and archiving of catch data from fisher logs, observer and
electronic logs and unloading slips.
• Collection and archival of catch, biological and environmental data from at-
sea research cruises
• Collection of biological specimen data from dockside, and at-sea sampling.
• Archiving of biological data collected from departmental and contract sources.
4. ECONOMIC, SOCIAL, CULTURAL IMPORTANCE
The purpose of this section is to provide a socio-economic overview of groundfish
fisheries in British Columbia using available information. This summary
addresses groundfish in the context of the Indigenous Food, Social, and
Ceremonial fishery, the recreational fishery, and the commercial fishery including
harvesting, processing, and export activity. The focus of this section is on the
economic activity of the fisheries rather than measures of economic value (i.e.
Page 9 of 38
Groundfish Integrated Management Plan - Summaryconsumer and producer surpluses). Where available, information on the social and
cultural context of the fisheries has been included; these sections may be
expanded in future years, as additional information is made available. The
information from 2003 to 2018 is included, although the entire period is not
covered in all instances due to data limitations. DFO recognizes the unique values
of each of the fisheries described here. The overview provided by this profile is
intended to help build a common understanding of the socio-economic
dimensions of the fisheries rather than compare the fisheries.
4.1. Indigenous Fisheries
4.1.1. Participation
Generally, there are three categories of Indigenous participation in fisheries –
food, social, and ceremonial (FSC), commercial, and treaty.
4.1.1.1 Participation in the Food, Social, and Ceremonial Fishery
The Aboriginal Fisheries Strategy (AFS) was implemented in 1992 to address
several objectives related to First Nations and their access to the resource. These
included:
• To provide a framework for the management of fishing by Indigenous groups
for food, social and ceremonial purposes.
• To provide Indigenous groups with an opportunity to participate in the
management of fisheries, thereby improving conservation, management and
enhancement of the resource.
• To contribute to the economic self-sufficiency of Indigenous communities.
• To provide a foundation for the development of self-government agreements
and treaties.
• To improve the fisheries management skills and capacity of Indigenous
groups.
AFS fisheries agreements may identify the amounts of species including
groundfish that may be fished for FSC purposes, terms and conditions that will be
included in the communal fishing licence, and fisheries management
arrangements. Currently approximately 58 coastal First Nations are issued
communal licences by the Minister of Fisheries, Oceans and the Canadian Coast
Guard that include groundfish for FSC purposes.
4.1.1.2 Participation in Modern Indigenous Treaties
Fisheries chapters in modern First Nation treaties may articulate a treaty fishing
right for FSC purposes that are protected under Section 35 of the Constitution Act,
1982. Some modern treaty First Nations are provided commercial access either
through the general commercial fishery or a Harvest Agreement. While this
Page 10 of 38
Groundfish Integrated Management Plan - Summarycommercial access may be referenced in the treaty, it is not protected under the
Constitution Act.
Seven modern treaties (Nisga’a Final Agreement, Tsawwassen First Nation Final
Agreement (TFA), Maa-nulth First Nations Final Agreement (MNA), Tla’amin
Nation Final Agreement, Sechelt Self-government Act, Westbank First Nation
Self-government Agreement and Yale First Nation Final Agreement) have been
ratified in British Columbia 2.
The Maa-nulth treaty includes five Nuu-cha-nulth First Nations
(Ka:’yu:k’t’h/Che:k’tles7eth, Huu-ay-aht, Toquaht, Uchucklesaht, Ucluelet) and
came into effect in April 2011; it provides for commercial groundfish in a Harvest
Agreement.
4.1.2. Social and Cultural Significance
Fisheries and the harvest and management of aquatic resources have particular
importance to many Indigenous communities. Many Indigenous communities are
located adjacent to key fishing sites, oceans and aquatic resources, and consider
the management of these resources to be matters important to these communities.
There are Indigenous groups who are seeking greater access to economic
opportunities from aquatic resources as a potential driver for economic
development in their communities; more stability in FSC fisheries; a greater role
in the aquatic resource and oceans management decisions that affect them; and a
greater role in stewardship, including stock assessment, oceans and habitat
management, conservation and protection, and recovery strategy development and
implementation.
4.2. Recreational Fishery
4.2.1. Participation
Tidal water recreational licences permit access to all marine species, including
many groundfish, under the conditions described in the BC Sport Fishing Guide.
The number of tidal water licences sold for access in BC decreased from around
337,000 in 2003 to a low of 300,000 in 2008 where it remained until a sharp
increase to about 343,000 in 2015 (Figure 1). Since 2015, the number of tidal
water licences has remained relatively stable 3. The majority of the decline was
due to a decrease in the sale of licences to non-Canadian residents, while the
recent increase was due to increased sales to residents.
2
Details of concluded final agreements can be found at https://www.rcaanc-
cirnac.gc.ca/eng/1100100030588/1542730442128.
3
http://www.pac.dfo-mpo.gc.ca/fm-gp/rec/licence-permis/Stats/99tocurrent-eng.html
Page 11 of 38
Groundfish Integrated Management Plan - SummaryThe National Recreational Fishing Survey is conducted every five years, and
therefore the latest available data is from 2015 4. Resident and non-resident
anglers fished an estimated 2 million days in BC tidal waters in 2015. The number
of businesses in BC that provide recreational fishing services directly to anglers
(e.g. guides and charters) is unknown.
Tidal Recreational Fishing Licences by Year and Resident
Status
400
350
300
Thousands of licences
250
200
150
100
50
0
Non-Resident Licences Resident Licences
*Data for 2018/2019 is preliminary and should be treated as such
Figure 1. BC Tidal Water Recreational Fishing Licences by Canadian Resident Status,
2003/04-2018/19*. Source: DFO Internal Recreational Licensing data. 5
4.2.2. Economic Contribution
Between 2010 and 2016, the contribution of the tidal waters recreational fishing
sector (all species) to the real gross domestic product (GDP) 6 and employment in
BC grew by 24% and 20% respectively 7. The data from the 2015 National Survey
of Recreational Fishing indicates that groundfish accounted for approximately
27% of total direct fishing expenditures and about 20% of major purchases
attributed to fishing in BC.
4
https://www.dfo-mpo.gc.ca/stats/rec/can/2015/index-eng.html
5
http://www.pac.dfo-mpo.gc.ca/fm-gp/rec/licence-permis/Stats/99tocurrent-eng.html
6
Gross Domestic Product includes wages to labour, owner profits and earnings, return on capital
investments, changes in inventories, and depreciation on capital.
7
BC Stats. BC Fisheries and Aquaculture Sector, 2016 Edition, 2018.
Page 12 of 38
Groundfish Integrated Management Plan - SummaryDetermining the contribution of the recreational fishing sector to the economy is
complicated, as some, but not all, of the GDP, employment and revenue
attributable to the industry is also part of the province’s tourism sector. Tourists
are those people who travel 80 kilometres or more from their usual place of
residence in order to participate in the activity. While many anglers live near to
the coast of BC and can participate without travelling far from home, others must
travel to participate in the tidal water recreational fishery and are classified as
tourists. Consequently, there is significant overlap in the economic values for the
recreational fishing sector and the tourism sector. Approximately 27% of the
overall recreational fishing sector’s contribution to GDP is the result of activities
not directly related to fishing, but rather includes non-angling activities
undertaken by tourist anglers (e.g. visiting a museum).
From 2010-2015, the number of tidal water resident anglers increased by 6% to
176, 819, and the number of Canadian non-resident and foreign anglers (outside
of B.C.) also increased by 15% to 70,600 anglers.
4.2.3. Social and Cultural Significance
There is a lack of data on the location of recreational fishing sector dependent
employment, and thus it is not possible to comment on the social significance of
the fishery. However, it is recognized that recreational fishing activities - in
particular, providers of fishing packages - often occur in more remote locations,
providing important direct and indirect employment opportunities in these
communities.
Regional estimates of angler expenditures attributable to groundfish activity
illustrate differences between regions (Figure 2). Total expenditures (direct and
major purchases) on groundfish were $154.0M, representing about 25% of total
recreational expenditures (all species). Relative to other regions, Georgia Strait
was a key groundfish fishing area, with 31% of expenditures occurring in this
region. The proportion of total groundfish expenditures were lower in other areas
with 17% in West Coast Vancouver Island, 14% in Haida Gwaii, 11% in
Johnstone Strait, 10% in North Coast, 10% in Barkley Sound, and 8% in Central
Coast. The share of angler expenditures on groundfish as a proportion of all
species varied by region. In Georgia Strait, groundfish represented 18% of direct
expenditures of all species, while in Johnstone Strait, groundfish represented 45%
of direct expenditures of all species. Similar results were seen for major purchase
expenditures, with groundfish representing between 14% (Georgia Strait) and
44% (Johnstone Strait) of all species major purchases.
Page 13 of 38
Groundfish Integrated Management Plan - SummaryGroundfish Angler Direct Expenditures and Major Purchases
by Region
50
45
40
35
Millions of 2019$
30
25
20
15
10
5
0
HG NC CC JS GS BS WCVI
Angler Direct Expenditures Major Purchases
Figure 2. 2015 Angler Direct Expenditures and Major Purchase Expenditures for
Groundfish (all groundfish) by Region (millions of 2019 dollars). Source: DFO
internal analysis of National Survey of Recreational Fishing (2015).8 Note: HG = Haida
Gwaii; NC = North Coast; CC = Central Coast; JS = Johnstone Strait; GS = Georgia
Strait; BS =
4.3. Commercial Fishery
4.3.1. Participation
The number of active vessels, and thus presumably crew, involved in the harvest
of groundfish declined between 2009 and 2014, from 355 vessels to 327. After a
slight resurgence until 2017, the number fell again in 2018 (315), but quickly
recovered in 2019 as the number of active vessels increased to 335 (Figure 3).
8
Additional information on the history and vision for recreational fisheries can be found in the document
"Vision for Recreational Fisheries in BC:" http://www.pac.dfo-mpo.gc.ca/consultation/smon/sfab-
ccps/docs/rec-vision-eng.pdf
Page 14 of 38
Groundfish Integrated Management Plan - SummaryActive Groundfish Vessels by Fishery
400
350
300
Number of Vessels
250
200
150
100
50
0
2009 2010 2011 2012 2013 2014 2015 2016 2017 2018 2019
Groundfish Trawl Halibut Lingcod Rockfish Inside Rockfish Outside Sablefish Dogfish
Figure 3. Active Groundfish Vessels by Fishery 2009-2019. Source: DFO PacFish Database.
Note: Some vessels fish multiple fisheries, thus may be represented more than once.
Indigenous participation in the commercial groundfish fishery may occur through
communal commercial licences, or as organization (e.g. Commercial Fishing
Enterprises) or individual ownership of licences and vessels. Information on
individual ownership is not available. Communal commercial licences (F) identify
communal Indigenous participation within the commercial groundfish fishery and
allow Indigenous communities to designate vessels and individual fishers to carry
out the fishing. The ATP and PICFI programs have been used by DFO to acquire
commercial groundfish licence eligibilities (K - Sablefish, L - Halibut, ZN -
Rockfish, T - Trawl). The ATP and PICFI programs have also acquired and
distributed more than 16% of the total Halibut quota, and more than 17.5% of the
Sablefish quota as well as small amounts of quota for most trawl species. In 2019,
PICFI allocated groundfish licences and quota in agreements with 19 Commercial
Fishing Enterprises.
4.3.2. Economic Contribution
In 2017, the groundfish fishery was the largest component of the fish harvesting
sector and it was responsible for approximately 76% of all BC seafood landings
and about 39% of the total value of BC wild seafood landings. In terms of the
Page 15 of 38
Groundfish Integrated Management Plan - Summaryprocessing labour intensity, in 2016 the groundfish fishery provided about 49% of
all direct processing employment hours. 9
The real landed value of the groundfish fishery was relatively stable between
2009 and 2013, and then increased by approximately 55% between 2014 and
2017. This increase was largely the result of an increase in the landed value of the
groundfish trawl fishery, totalling 89% over the same time period. The landed
value of the groundfish fisheries declined by approximately 20%, from $194.2
million in 2017 to $155.4 million in 2019, mainly due to a 30% reduction in
landed value of the Halibut fishery (Figure 5, Figure 6, Table 1). Figure 5 and 6
below present total BC groundfish landed value and volume for the last 10 years.
Groundfish Total Landed Value by Fishery (2019$)
$200.0
$180.0
Landed Value (millions of 2019$)
$160.0
$140.0
$120.0
$100.0
$80.0
$60.0
$40.0
$20.0
$0.0
2010 2011 2012 2013 2014 2015 2016 2017 2018 2019
Groundfish Trawl Halibut Lingcod Rockfish Inside Rockfish Outside Sablefish Dogfish
Figure 5: Groundfish Total Landed Value by Fishery 2010-2019 (in 2019 $). Source: Landed
volume and value calculated from Dockside Monitoring Program landings, Ground fish Fishery
Observations System and sales slip prices.
9
GSGislason & Associates, August 2017 report and British Columbia Seafood Industry Year in Review.
Various years. BC Ministry of Environment. https:www2.gov.bc.ca/gov/content/industry/agriculture-
seafood/statistics/industry-and-sector-profiles.
Page 16 of 38
Groundfish Integrated Management Plan - SummaryGroundfish Total Landings by Fishery
160
Total Landings (millions of Kilograms)
140
120
100
80
60
40
20
0
2010 2011 2012 2013 2014 2015 2016 2017 2018 2019
Groundfish Trawl Halibut Lingcod Rockfish Inside Rockfish Outside Sablefish Dogfish
Figure 6: Groundfish Total Landed Volume by Fishery 2010-2019. Source: The landed
volume and value is calculated from the Dockside Monitoring Program landings, Ground fish
Fishery Observations System and sales slip prices.
The real wholesale value of the fisheries fell by approximately 19% between
2009-2014. Since then, the fisheries have generally seen an increase in wholesale
value from $334.0M in 2016 to around $280.4M in 2019.
The export data does not allow for identification of all groundfish species (e.g. all
rockfish); however, for most identifiable species export values had been steady
from 2010 to 2013, with a slight dip in 2014 (Figure 8). Since 2014, export values
have steadily increased. Cod and Halibut export prices show an upward trajectory
from 2010-2016, while export prices for Sablefish demonstrate a downward
trajectory over the same period. However, Sablefish prices have increased rapidly
from 2017-2019, and the current price of $13/kg is the highest Sablefish has seen
this decade.
Page 17 of 38
Groundfish Integrated Management Plan - SummaryTotal Exports Quantity and Value (2019$) by Species and Year
$220.00 80.00
$200.00
70.00
Total Export Value (millions of 2019$)
Total Exports (millions of Kilograms)
$180.00
60.00
$160.00
$140.00 50.00
$120.00
40.00
$100.00
$80.00 30.00
$60.00
20.00
$40.00
10.00
$20.00
$- 0.00
2010 2011 2012 2013 2014 2015 2016 2017 2018 2019
Hake Halibut Flatfish Sablefish Other Cod Total Export Quantity
Figure 8. Total Groundfish Exports Quantity and Value by Species and Year, 2010-2019 (in
2019 $). Source: Statistics Canada. EXIM. Accessed September 29, 2020. Note: Other Groundfish
species include Dogfish, Lingcod, Pollock and other.
4.3.3. Social and Cultural Significance
There is a lack of information on communities of residence for groundfish vessel
masters and crew. Consequently, it is not possible to comment of the social
significance of the groundfish harvesting sector to BC communities. In the case of
processing employment, past work has suggested a strong correlation between the
off-loading location of groundfish and processing employments. There are smaller
centres for which commercial fishing and fish processing are integral elements of
the local economy. In some locations, groundfish represents a significant
component of processing employment. 10
There is a long history of commercial groundfish fishing in British Columbia.
This history has been documented by several authors, although the link between
current culture and the historical significance is less documented. 11 The
commercial Halibut fishery harvested Halibut back to the 1880’s, but the harvest
10
Fraser and Associates. 2008. Linkages Between the Primary Fish Production and Fish Processing Sectors
in British Columbia: Final phase 2 report. Prepared for the Department of Fisheries and Oceans, Pacific
Region. Victoria, British Columbia.
11
For example: Forester, Joseph E. and Anne D. Forester. 1975. British Columbia’s Commercial Fishing
History. Hancock House Publishers Ltd., Saanichton, BC.
Page 18 of 38
Groundfish Integrated Management Plan - Summarywas largely marketed in Seattle until the arrival of the railroad. 12 From small
shipments east in 1888, the fishery grew until it accounted for over 80% of
Canadian Halibut landings by the 1940s. Prince Rupert, labelled the “Halibut
Capital of the World”, originally shipped via steamships but switched to rail in
1913, with dozens of rail cars of iced Halibut shipped each month.
The trawl fishery began with only a few nets in the early 1900s, with the otter
trawl introduced in 1911. Initially most of the harvest was sold locally. The trawl
fishery went through a number of periods of growth and decline, with growth
during both World Wars. The World War II expansion was based largely on the
development of the Dogfish liver oil market. The groundfish fisheries remain part
of the BC coast 13, with expanded methods, and provides seafood for domestic and
international markets.
5. SHARED STEWARDSHIP ARRANGEMENTS
5.1. Commercial Industry
Several Collaborative Agreements (CA) currently exist between Fisheries and
Oceans Canada and Wild Canadian Sablefish Ltd., the Canadian Groundfish
Research and Conservation Society, and the Pacific Halibut Management
Association. CAs are also being considered for 2020/21 between Fisheries and
Oceans Canada and several partners to support groundfish science activities
through the allocation of fish to finance the activities, consistent with the authority
granted to the Minister in Fisheries Act.
5.2. Fisheries and Oceans Canada
The groundfish fisheries in British Columbia are managed through the Groundfish
Management Unit. This includes seven Fisheries Management personnel directly
involved in the management of this fishery. In addition, a groundfish stock
assessment unit, located at the Pacific Biological Station contributes to annual
stock assessments for groundfish species. Contributions to the IFMP are provided
by Fisheries Management, the Science Branch, Conservation and Protection,
Ecosystem Management Branch, the Pacific Fishery Licence Unit, the Treaty and
Aboriginal Policy Directorate, and numerous others.
6. GOVERNANCE PROCESS
The Groundfish IFMP is updated in February of every year. First Nations FSC
fisheries may occur year-round. Season dates for commercial and recreational
12
Forester, Joseph E. and Anne D. Forester. 1975. British Columbia’s Commercial Fishing History.
Hancock House Publishers Ltd., Saanichton, BC.
13
Robson, Peter A. and Michael Skog (editors). 1996. Working the Tides: A Portrait of Canada’s West
Coast Fishery. Harbour Publishing, Madeira Park, BC.
Page 19 of 38
Groundfish Integrated Management Plan - Summaryfisheries vary, and can be found in the commercial harvest plan appendices to the
IFMP and the recreational Tidal Waters Sport Fishing Guide.
Several advisory committees and subcommittees have been established to provide
advice to the Department on management of groundfish fisheries. Terms of
reference, membership and meeting minutes for the Halibut Advisory Board
(HAB), Groundfish Trawl Advisory Committee (GTAC), Sablefish Advisory
Committee (SAC), Groundfish Hook and Line Subcommittee (GHLSC), the
Commercial Industry Caucus (CIC), and the Groundfish Integrated Advisory
Board (GIAB) can be found on the Internet at:
http://www.pac.dfo-mpo.gc.ca/consultation/ground-fond/index-eng.html.
DFO engages in a variety of consultation, engagement and collaborative harvest
planning processes with First Nations which advise DFO on groundfish
management. These exchanges and involvement may include bilateral
consultations, advisory processes, management boards, technical groups and other
roundtable forums. Consulting is an important part of good governance, sound
policy development and decision-making. It is also a component of modern
treaties established between First Nations and the provincial and federal
governments. In addition to good governance objectives, Canada has statutory,
contractual and common law obligations to consult with Indigenous groups.
The Sport Fishing Advisory Board provides advice to the Department on matters
relating to the recreational fishery. More information on this advisory board can
be found on the Internet at: http://www.pac.dfo-
mpo.gc.ca/consultation/smon/sfab-ccps/index-eng.html.
7. ACCESS AND ALLOCATIONS
The Minister can, for reasons of conservation or for any other any other valid
reasons, modify access, allocations and sharing arrangements outlined in the
IFMP in accordance with the powers granted pursuant to the Fisheries Act.
7.1. First Nations
First Nations along BC’s coast harvest groundfish for FSC purposes under the
Aboriginal Communal Fishing Licences Regulations or Treaty Harvest
Agreements. In both cases, allocations are specified, and the fisheries are licenced
and conducted under the authority of the Minister.
With respect to treaties, agreements are in place with the Nisga’a, Tsawwassen,
Maa-nulth, and Tla’amin First Nations. Nisga’a, Tsawwassen, Maa-nulth, and
Tla’amin First Nations Treaties came into effect on May 11, 2000, April 1, 2009,
April 1, 2011, and April 5, 2016 respectively.
7.1.1. Maa-nulth
Page 20 of 38
Groundfish Integrated Management Plan - SummaryThe domestic (food, social, and ceremonial) allocations for groundfish under the
Maa-nulth First Nations Final Agreement are as follows:
1. Halibut: The Maa-nulth Fish Allocation for Halibut is 26,000 pounds (net
weight, dressed, head off) plus 0.39% of the Halibut Canadian Total
Allowable Catch (net weight, dressed, head off).
2. Rockfish: The Maa-nulth Fish Allocation of Rockfish is 11,250 pounds of
whole fish, plus 2.46% of the Commercial Rockfish Outside Total Allowable
Catch.
3. Groundfish: The Maa-nulth Fish Allocation of Groundfish is 13,000 pounds of
whole fish.
4. Sablefish: The Maa-nulth Fish Allocation for Sablefish is 0.082% of the
Sablefish Canadian Total Allowable Catch.
In addition to the allocation of fish for domestic purposes, Maa-nulth has an
allocation for commercial catch outside of the Treaty as identified in the “Maa-
nulth First Nation Harvest Agreement”. The allocations in the Harvest Agreement
do not affirm Indigenous or Treaty rights. Fishing under the Harvest Agreement
will be comparable to the requirements of the current commercial fishery.
Commercial groundfish allocations are expressed as limits (i.e., “up to” amounts)
under the Harvest Agreement:
1. Halibut: up to 2% of the coastwide commercial halibut TAC.
2. Rockfish: up to 2.6178% of the commercial ZN-Outside rockfish TACs.
3. Sablefish: up to 0.34% of the coastwide commercial sablefish TAC.
7.1.2. Tla’amin
The domestic (food, social, and ceremonial) allocations for groundfish under the
Tla’amin Nation Final Agreement are as follows:
1. In any year, the Tla’amin Fish Allocation for the aggregate of rockfish and
lingcod is a maximum of 5,000 lbs.
2. In any year, the Tla’amin Fish Allocation for all groundfish other than
rockfish and lingcod is a maximum of 1,000 lbs.
7.1.3. Tsawwassen and Nisga’a fisheries
Groundfish are currently unallocated species under the terms of the Tsawwassen
and Nisga’a treaties. As authorised by their treaties, they may harvest groundfish
for domestic purposes, subject to conservation, public health, or public safety, in
Page 21 of 38
Groundfish Integrated Management Plan - Summarytheir respective fishing areas under the terms of annual fishing plans signed off by
the treaty nations and Canada.
7.1.4. Five Nations Multi-Species Fishery Management Plan
Five Nuu-chah-nulth First Nations located on the west coast of Vancouver Island
- Ahousaht, Ehattesaht, Hesquiaht, Mowachaht/Muchalaht, and Tla-o-qui-aht (the
Five Nations) – have an aboriginal right to fish for any species, with the exception
of Geoduck, within their court-defined fishing territories and to sell that fish.
Their fishing territories are located within portions of Pacific Fishery
Management Areas (PFMA) 25/125, 26/126, 124 and all of PFMA 24. As part of
the implementation of that right, the Department released in 2019 the first Five
Nations Multi-Species Fishery Management Plan (FMP), developed in
consultation with the Five Nations. The FMP includes specific details about the
Five Nations’ right-based sale fishery, such as harvesting opportunities/access,
licensing and designations, fishing area, gear, and fishery monitoring and catch
reporting. For further information, the 2020/21 FMP can be found at:
https://waves-vagues.dfo-mpo.gc.ca/Library/40869374.pdf. The 2021/22 FMP
will be available in Spring 2021.
The implementation of the Five Nations’ right-based sale fishery is an ongoing
process. Aspects of the Five Nations’ right-based sale fishery remain before the
courts and management changes may be necessary following future decisions. As
a result, in-season management changes to this IFMP may occur. DFO will make
efforts to advise stakeholders of any such changes in advance of their
implementation.
7.2. Recreational
Daily and possession limits are in place for various groundfish species. Annual
limits and size limits are also in place for several groundfish species such as
Lingcod and Halibut. These are described in the British Columbia Tidal Waters
Sport Fishing Guide available at: http://www.pac.dfo-mpo.gc.ca/fm-gp/rec/index-
eng.html.
There are several instances where total recreational catch is managed to specified
amounts. Recreational fishing for Halibut is managed to an annual coastwide
allocation. As a result of the Rockfish Conservation Strategy drafted in 2001,
recreational catch of rockfish and Lingcod in the Strait of Georgia is also
managed to stay within specified amounts, referred to as “management caps”.
Since 2011, an optional experimental program has also been in place which
allows interested recreational harvesters to temporarily transfer commercial
halibut quota onto an experimental licence for the purposes of recreational fishing.
This pilot program allows those who choose to participate the opportunity to fish
for halibut beyond the daily and possession limits or beyond the season closure
date for the regular recreational halibut fishery. More information regarding the
Page 22 of 38
Groundfish Integrated Management Plan - SummaryExperimental Recreational Halibut Program can be found here:
http://www.pac.dfo-mpo.gc.ca/fm-gp/commercial/ground-fond/halibut-
fletan/presentation-eng.html.
7.3. Aquaculture
Fisheries and Oceans Canada continues to support the research and development
of the aquaculture sector. The Department will provide the aquaculture industry
with reasonable access, by scientific licence, to the wild groundfish resource to
assist industry development (growth and diversification). Requests to access the
wild resource will be contingent upon stakeholders providing detailed project
proposals for review and approval by the Department. More information can be
found at: http://www.pac.dfo-mpo.gc.ca/aquaculture/index-eng.html.
Currently 0.1% of the Sablefish TAC is allocated to the aquaculture industry to
support broodstock collection for sablefish aquaculture.
7.4. Research
Allocations are made each year for research to account for the mortalities
associated with survey catches within TACs. This includes the outside waters hard
bottom hook and line survey, the International Pacific Halibut Commission
longline standardized stock assessment survey, the trawl multi-species surveys,
and the Sablefish trap survey. In some cases, allocations may also be made in
excess of forecasted survey catches to support the costs of completing select
science projects. These allocations are made based on the Minister of Fisheries,
Oceans, and the Canadian Coast Guard’s authority to allocate fish or fishing gear
for the purpose of financing scientific and fisheries management activities that are
described in a joint project agreement entered into with any person or body, or
any federal or provincial minister, department, or agency. In general, research
allocations are deducted from the fish available to the commercial fishery by
sector prior to the definition of commercial TACs used for the purposes of
defining allocations on licences. However, the sectoral allocations based on
percentage splits between commercial sectors defined in section 7.5 below are
calculated before research allocations are deducted.
Species Trawl Longline Sablefish Total
Surveys Surveys surveys, (tonnes)
(tonnes) (tonnes) tagging,
catch
sampling
(tonnes)
Arrowtooth Flounder 12.7 0.0 0 12.7
Big Skate 0.8 0.0 0 0.9
Bocaccio Rockfish 0.6 0.0 0 0.6
Page 23 of 38
Groundfish Integrated Management Plan - SummaryCanary Rockfish 1.8 6.5 0 8.3
Copper, China, Tiger Rockfish 0.2 2.8 0 3.0
Dover Sole 5.7 0.0 0 5.7
English Sole 6.7 0.0 0 6.7
Lingcod 0.4 3.6 0 4.0
Longnose Skate 0.5 0.0 0 0.5
Longspine Thornyhead 0.0 0.0 0 0.0
Pacific Cod 2.1 0 0 2.1
Pacific Hake 0.2 0.0 0 0.2
Pacific Halibut 2.5 27.2 0 29.7
Pacific Ocean Perch 20.8 0.0 0 20.8
Petrale Sole 0.7 0.0 0 0.7
Quillback Rockfish 0.4 5.8 0 6.2
Redbanded Rockfish 1.7 11.6 0 13.3
Redstripe Rockfish 1.1 0.0 0 1.1
Rock Sole 1.7 0.0 0.0 1.7
Rougheye/Blackspotted Rockfish 1.0 20.6 0 21.6
Sablefish 3.0 0.4 85 88.4
Shortraker Rockfish 0.0 5.4 0 5.4
Shortspine Thornyhead 1.3 0.9 0 2.2
Silvergray Rockfish 9.5 12.7 0 22.2
Spiny Dogfish 1.1 0.0 0 1.1
Walleye Pollock 3.0 0.0 0 3.0
Widow Rockfish 0.1 0.0 0 0.1
Yelloweye Rockfish 0.0 16.6 0 16.6
Yellowmouth Rockfish 5.9 3.0 0 8.9
Yellowtail Rockfish 2.3 2.0 0 4.3
*The Halibut amount for the groundfish trawl survey is part of the trawl fishery’s Halibut bycatch mortality
cap. The groundfish trawl fishery has a bycatch mortality cap of 454 tonnes that is not part of the allocated
commercial TAC.
7.5. Commercial
The commercial TAC for various groundfish species are allocated between the
different groundfish sectors. Formal discussions between the Hook and Line
rockfish (category ZN licence), Halibut (category L licence) and Trawl (category
T licence) sectors were initiated in 2000 to establish individual rockfish species
allocations between the sectors to modify the 1997 adopted “92/8” Trawl/Hook
and Line allocation. The agreed to allocation of groundfish species between the
commercial sectors are as follows:
7.5.1. Rockfish Species
Page 24 of 38
Groundfish Integrated Management Plan - SummaryCommercial Sector
Species
T ZN L
Canary 87.70% 11.77% 0.53%
Longspine Thornyhead 95.35% 2.29% 2.36%
Pacific Ocean Perch 99.98% 0.02% 0.00%
Quillback 2.56% 87.97% 9.47%
Copper, China, Tiger 2.56% 87.97% 9.47%
Redbanded 50.00% 37.50% 12.5%
Redstripe 97.23% 2.77% 0.00%
Rougheye/Blackspotted 55.80% 41.17% 3.03%
Shortspine Thornyhead 95.40% 2.27% 2.33%
Shortraker 52.30% 43.92% 3.78%
Silvergray 88.43% 10.97% 0.60%
Widow 98.21% 1.79% 0.00%
Yelloweye 2.54% 64.34% 33.12%
Yellowmouth 96.77% 2.49% 0.74%
Yellowtail 98.91% 1.09% 0.00%
7.5.2. Non-quota Rockfish Species
Commercial Sector
Non-quota Species
T L + ZN
Aurora Rockfish 90.00% 10.00%
Black Rockfish 14.00% 86.00%
Blue Rockfish 5.00% 95.00%
Brown Rockfish 5.00% 95.00%
Chillipepper Rockfish 65.00% 35.00%
Darkblotch Rockfish 99.00% 1.00%
Dusky Rockfish 50.00% 50.00%
Greenstripe Rockfish 96.00% 4.00%
Harlequin Rockfish 99.00% 1.00%
Bocaccio Rockfish 14 93.00% 7.00%
Rosethorn Rockfish 65.00% 35.00%
Sharpchin Rockfish 99.00% 1.00%
Shortbelly Rockfish 0.00% 100.00%
Splitnose Rockfish 99.00% 1.00%
Vermillion Rockfish 1.00% 99.00%
7.5.3. Other Groundfish
Commercial Sector
Species*
T L + K + ZN + Sch II
Lingcod 74.00% 26.00%
14
Bocaccio is currently a quota species in the trawl fishery, but not in the Hook and Line fisheries.
Page 25 of 38
Groundfish Integrated Management Plan - SummaryCommercial Sector
Species*
T L + K + ZN + Sch II
Dogfish 32.00% 68.00%
Hake, pollock, Pacific cod & sole 100.00% 0.00%
Sablefish 8.75% 91.25%
*Halibut is not permitted for retention by trawl gear so there is no percentage of an
allocation assigned to trawl.
Commercial Sector
Species ZN ZN
T L LC K DF
Inside Outside
3CD 62.83% 14.19% 0.00% 0.00% 1.50% 11.26% 10.22%
Longnose 5AB 32.83% 48.49% 0.01% 0.00% 8.61% 9.47% 0.57%
Skate
5CDE 20.28% 59.80% 0.00% 0.00% 8.53% 10.55% 0.84%
3CD 24.55% 26.72% 0.00% 0.00% 1.93% 4.16% 42.63%
5AB 91.48% 5.97% 0.01% 0.00% 1.20% 0.72% 0.62%
Big Skate
5CDE 92.07% 6.34% 0.00% 0.00% 0.56% 0.95% 0.08%
Page 26 of 38
Groundfish Integrated Management Plan - Summary7.5.4. Commercial Total Allowable Catches
As a result of rounding, the TAC allocations by management area do not sum to the sector totals for some species. For the exact
TAC values, please contact a member of the Groundfish Management Unit. Portions of some of the TACs listed here will be
allocated for research purposes. Portions of the ZN Outside TAC exclude amounts allocated for research purposes. Details of
research allocations are found in the harvest plans included as appendices to the full IFMP document.
ZN
Halibut Sablefish ZN Inside Trawl Dogfish Lingcod
Species Area Outside
(tonnes) (tonnes) (tonnes) (tonnes) (tonnes) (tonnes)
(tonnes)
3C 0 0 14* 0 1,224 0 0
Yellowtail
rockfish 3D, 5A/B,
0 0 47* 0 4,216 0 0
5C/D/E
Sector total 0 0 60* 0 5,440 0 0
Widow rockfish Coastwide 0 0 46* 0 2,500 0 0
3C, 3D 1 0 30 0 615 0 0
5A, 5B 2 0 51 0 241 0 0
Canary rockfish 5C, 5D 1 0 24 0 97 0 0
5E 1 0 25 0 12 0 0
Sector total 6 0 129 0 965 0 0
3C/D 2 0 41 0 332 0 0
Silvergray 5A/B 4 0 80 0 646 0 0
rockfish
5C/D 4 0 73 0 587 0 0
Groundfish Integrated Fisheries Management Plan - SummaryZN
Halibut Sablefish ZN Inside Trawl Dogfish Lingcod
Species Area Outside
(tonnes) (tonnes) (tonnes) (tonnes) (tonnes) (tonnes)
(tonnes)
5E 3 0 47 0 382 0 0
Sector total 13 0 241 0 1,945 0 0
3C/D 0 0 0 0 750 0 0
5A/B 0 0 0 0 1,687 0 0
Pacific ocean 5C 0 0 0 0 1,555 0 0
perch
5D/E 0 0 0 0 1,200 0 0
Sector total 0 0 1 0 5,192 0 0
3C 1 0 4 0 219 0 0
3D, 5A/B 6 0 20 0 1,135 0 0
Yellowmouth 5C/D 4 0 13 0 685 0 0
rockfish
5E 7 0 24 0 325 0 0
Sector total 18 0 60 0 2,364 0 0
3CD5AB 9 0 117 0 167 0 0
Rougheye/
Blackspotted 5CDE 24 0 313 0 446 0 0
rockfish
Sector total 33 0 430 0 614 0 0
Shortraker
Coastwide 9 0 102 0 126 0 0
rockfish
3C/D 5A/B/C 0 0 31* 0 1,150 0 0
Page 28 of 38
Groundfish Integrated Management Plan - SummaryZN
Halibut Sablefish ZN Inside Trawl Dogfish Lingcod
Species Area Outside
(tonnes) (tonnes) (tonnes) (tonnes) (tonnes) (tonnes)
(tonnes)
Redstripe 5D/E 0 0 12* 0 400 0 0
rockfish Sector total 0 0 43* 0 1,550 0 0
Shortspine
Coastwide 17 0 17 0 736 0 0
thornyheads
Longspine
Coastwide 10 0 10 0 405 0 0
thornyheads
Redbanded
Coastwide 74 0 210 0 295 0 0
rockfish
3C, 3D, 5A 8 0 38 0 1 0 0
5B 9 0 10 0 1 0 0
Yelloweye 5C, 5D 9 0 16 0 1 0 0
rockfish 5E 13 0 16 0 1 0 0
4B 1 0 0 6 0 0 0
Sector total 40 0 80 6 3 0 0
3C, 3D, 5A 3 0 43 0 0 0 0
5B 3 0 28 0 0 0 0
Quillback
5C, 5D 6 0 32 0 0 0 0
rockfish
5E 4 0 6 0 0 0 0
4B 0 0 22 22 0 0 0
Page 29 of 38
Groundfish Integrated Management Plan - SummaryZN
Halibut Sablefish ZN Inside Trawl Dogfish Lingcod
Species Area Outside
(tonnes) (tonnes) (tonnes) (tonnes) (tonnes) (tonnes)
(tonnes)
Sector total 16 0 131 22 4 0 0
3C, 3D, 5A 1 0 24 0 0 0 0
5B 1 0 7 0 0 0 0
Copper, China 5C, 5D 4 0 19 0 0 0 0
and Tiger
rockfish 5E 0.3 0 1 0 1 0 0
4B 0 0 3 3 0 0 0
Sector total 6.3 0 54 3 1 0 0
Bocaccio
Coastwide 0 0 0 0 414 0 0
rockfish
3C/D 0 0 0 0 300 0 0
5A/B 0 0 0 0 250 0 0
Pacific cod
5C/D/E 0 0 0 0 700 0 0
Sector total 0 0 0 0 1,250 0 0
3C/D 0 0 0 0 1,375 0 0
5C/D/E 0 0 0 0 1,100 0 0
Dover sole
5A/B 0 0 0 0 598 0 0
Sector total 0 0 0 0 3,073 0 0
Rock sole 3C/D 0 0 0 0 102 0 0
Page 30 of 38
Groundfish Integrated Management Plan - SummaryZN
Halibut Sablefish ZN Inside Trawl Dogfish Lingcod
Species Area Outside
(tonnes) (tonnes) (tonnes) (tonnes) (tonnes) (tonnes)
(tonnes)
5A/B 0 0 0 0 650 0 0
5C/D 0 0 0 0 800 0 0
Sector total 0 0 0 0 1,552 0 0
3C/D, 5A/B 0 0 0 0 186 0 0
Lemon sole 5C/D/E 0 0 0 0 636 0 0
Sector total 0 0 0 0 822 0 0
Petrale sole Coastwide 0 0 0 0 900 0 0
3C 0 0 0 0 800 0 150
3D 0 0 0 0 440 0 360
5A, 5B 0 0 0 0 862 0 200
Lingcod
5C, 5D, 5E 0 0 0 0 580 0 420
4B 0 0 0 0 0 0 38**
Coastwide total 0 0 0 0 2,572 0 1,168
3C, 3D, 5A, 5B,
0 0 0 0 3,840 8,160 0
5C, 5D, 5E
Spiny Dogfish 4B 0 0 0 0 640 1,360 0
Coastwide total 0 0 0 0 4,480 9,520 0
Sablefish Coastwide 0 2,510 0 0 241 0 0
Page 31 of 38
Groundfish Integrated Management Plan - SummaryZN
Halibut Sablefish ZN Inside Trawl Dogfish Lingcod
Species Area Outside
(tonnes) (tonnes) (tonnes) (tonnes) (tonnes) (tonnes)
(tonnes)
Gulf 0 0 0 0 1,115 0 0
3C, 3D
(including Area 0 0 0 0 4,000 0 0
20)
Pollock 5A/B (includes
0 0 0 0 2,500 0 0
Area 12)
5C/D/E 0 0 0 0 1,320 0 0
Coastwide total 0 0 0 0 4,935 0 0
Gulf 0 0 0 0 7,000 0 0
Hake
Offshore *** 0 0 0 0 TBD 0 0
Halibut Coastwide 2,350 0 0 0 454**** 0 0
3C/D 13 2 1 0 12 21 0
5A/B 22 3 4 0 341 2 0
Big skate
5C/D/E 39 6 3 0 561 1 0
Sector total 74 11 9 0 914 24 0
3C/D 20 16 2 0 88 14 0
5A/B 47 9 8 0 32 1 0
Longnose skate
5C/D/E 51 9 7 0 17 1 0
Sector total 168 48 25 0 195 22 0
Page 32 of 38
Groundfish Integrated Management Plan - SummaryZN
Halibut Sablefish ZN Inside Trawl Dogfish Lingcod
Species Area Outside
(tonnes) (tonnes) (tonnes) (tonnes) (tonnes) (tonnes)
(tonnes)
Arrowtooth
Coastwide 0 0 0 0 5,000 0 0
flounder
* This tonnage is not allocated to individual licence holders, nor is it transferable.
** The Lingcod coastwide total includes the 38 tonne allocation to cover 4B trip limits. This tonnage is not allocated to licence holders, nor is it transferable.
*** This is a notional TAC for initial licence issuance – The actual TAC will be announced in early April 2021.
****The groundfish trawl fishery has a bycatch mortality cap of 454 tonnes that is not part of the allocated commercial TAC. Halibut caught while fishing
under the authority of a groundfish trawl licence cannot be retained and must be returned to the water as quickly as possible.
Page 33 of 38
Groundfish Integrated Management Plan - Summary7.5.5. Commercial Species-Area Groups
All groundfish hook and line licence holders will be permitted to hold quota for
up to 40 species-area groups of holdings. Landings of other groundfish will be
managed through trip limits or landings allowances. Additional species areas
groups are in place for the groundfish trawl fishery and can be found in Appendix
8 of the IFMP.
Pacific Halibut (Coastwide) Silvergray rockfish (5E)
Sablefish (Coastwide) Yelloweye rockfish (3C, 3D, 5A)
Lingcod (3D) Yelloweye rockfish (5B)
Lingcod (3C) Yelloweye rockfish (5C, 5D)
Lingcod (5A, 5B) Yelloweye rockfish (5E)
Lingcod (5C, 5D, 5E) Yelloweye rockfish (4B)
Dogfish (3C, 3D, 5A, 5B, 5C, 5D, 5E) Quillback rockfish (3C, 3D, 5A)
Dogfish (4B) Quillback rockfish (5B)
Big skate (3C, 3D) Quillback rockfish (5C, 5D)
Big skate (5A, 5B) Quillback rockfish (5E)
Big skate (5C, 5D, 5E) Quillback rockfish (4B)
Longnose skate (3C, 3D) Copper, China and Tiger rockfish (3C, 3D, 5A)
Longnose skate (5A, 5B) Copper, China and Tiger rockfish (5B)
Longnose skate (5C, 5D, 5E) Copper, China and Tiger rockfish (5C, 5D)
Canary rockfish (3C, 3D) Copper, China and Tiger rockfish (5E)
Canary rockfish (5A, 5B) Copper, China and Tiger rockfish (4B)
Canary rockfish (5C, 5D) Rougheye / Blackspotted rockfish (3CD5AB)
Canary rockfish (5E) Rougheye / Blackspotted rockfish (5CDE)
Silvergray rockfish (3C, 3D) Redbanded rockfish (Coastwide)
Silvergray rockfish (5A, 5B) Shortraker rockfish (Coastwide)
Silvergray rockfish (5C, 5D) Shortspine thornyhead (Coastwide)
7.6. Outgoing and Incoming Sector Caps
There are caps on the amount of quota species, in pounds, permitted to leave and
enter commercial sectors from/to other commercial sectors. The figures can
change regularly. Please consult the DFO website for the most current figures:
https://www.pac.dfo-mpo.gc.ca/fm-gp/commercial/ground-fond/publications-
eng.html.
8. RESOURCE MANAGEMENT GOAL
To sustainably manage groundfish fisheries, and to work with harvesters, coastal
and Indigenous communities to enable their continued prosperity from fish and
seafood.
Groundfish Integrated Fisheries Management Plan - SummaryYou can also read