PHOTO HERE - Rotorua Lakes Catchment Asset Management Plan DRAFT FOR CONSULTATION
←
→
Page content transcription
If your browser does not render page correctly, please read the page content below
PHOTO HERE

Rotorua Lakes Catchment
Asset Management Plan
2018-2028

DRAFT FOR CONSULTATION
Document control
Document information

Document name:         Rotorua Lakes Catchment Asset Management Plan

Contact person:        Niroy Sumeran, Lakes Operations Officer
Status:                Draft

Document review

Review timeframe:      2020/21 In line with the requirements of Council’s Long Term Plan.
Reviewers:             Audit NZ, Organisational Asset Management Steering Group, Programme
                       Leads

Document history

Author              Description of change                             Date                  Version
Kirsty Brown
Kirsty Brown
                    Audit NZ changes (A1901191)
                    Internal review by OAMSG

                                                  T                   March 2015
                                                                      July 2015
                                                                                            1.0
                                                                                            1.1
                               AF
Kirsty Brown        Adoption by Regional Direction & Delivery         November 2015         1.2
                    Committee
Niroy Sumeran       Edited as per Niroy Sumeran and Andy Bruere       November 2017         1.3
Mary Burford        Edited as per LTP 2018-2028                       February 2018         1.4
           R
          D

Rotorua Lakes Catchment Asset Management Plan 2018-2028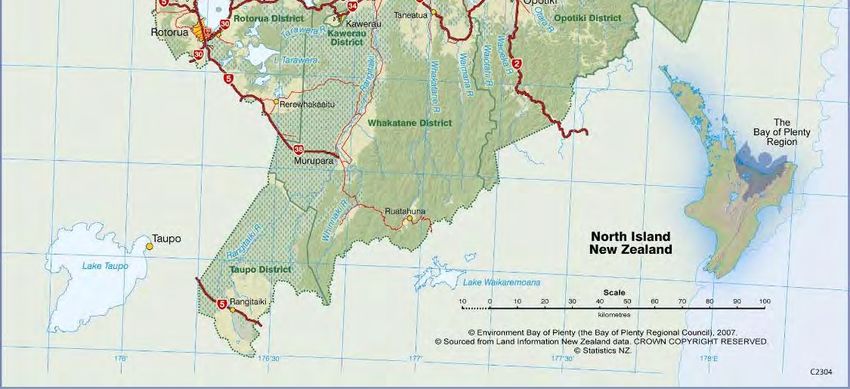
Asset management team

Rotorua Lakes Catchment
Chris Ingle                              General Manager, Integrated Catchments

Helen Creagh                             Rotorua Catchments Manager

Andy Bruere                              Lakes Operations Manager

Niroy Sumeran                            Lakes Operations Officer

Approved for issue:

Signed: ..................................................................    Date:   ...........................................

Chris Ingle
General Manager, Integrated Catchments

                                                                         T
                                             AF
Signed: ..................................................................    Date:   ...........................................

Helen Creagh
              R

Rotorua Catchments Manager
             D

Signed: ..................................................................    Date:   ...........................................

Andy Bruere
Lakes Operations Manager

Rotorua Lakes Catchment Asset Management Plan 2018-2028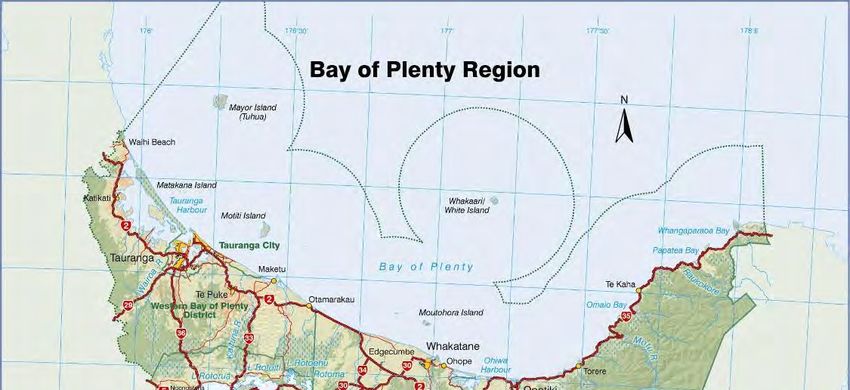
Contents

1     Introduction ...............................................................................................................................1
2     The Bay of Plenty region ..........................................................................................................2
3     Overview of asset management planning.................................................................................7
4     Strategic environment .............................................................................................................10
5     Programme drivers .................................................................................................................15
6     Business overview ..................................................................................................................18
7     Risk management ...................................................................................................................21
8     Asset summary .......................................................................................................................22
9     Asset life cycle management ..................................................................................................23
10    Asset detailed information ......................................................................................................25
11    Asset management plan review..............................................................................................33
12

                                                                  T
      Improvement plan ...................................................................................................................33
                                        AF
          R
         D

Rotorua Lakes Catchment Asset Management Plan 2018-2028
1 Introduction
1.1 Purpose of this Plan
The purpose of this Plan is to formally document the management philosophy that is applied
to the Rotorua Lakes Catchment assets and services. This approach ensures that acceptable
levels of service is provided in the most cost effective manner and contribute to the
achievement of the Long Term Plan (LTP).
This long-term planning approach is considered necessary given the large capital and
operating expenditure, the long lives of the assets and the lead times in planning for
upgrades, of new assets when required. The sequencing and timing of works are developed
through discussions with key stakeholders and this Plan is prepared in consultation with them.
The key purpose of this plan is to:
Provide a document to convey the long-term strategy for the management of the
Rotorua Lakes Catchment assets and services.
T
Improve understanding of service level standards, options and costs to smooth peak
funding demands, while improving customer satisfaction and organisational image.
Manage the environmental, service delivery and financial risks of asset failure.
AF
Identify lifecycle (long-term) costs to provide agreed level of service over the long-
term.
Explain how the long-term works programmes have been developed and how they
will be funded.
R
This AMP also aims to demonstrate that the service potential of the Rotorua Lakes
Catchment assets is being maintained.
D
Rotorua Lakes Catchment Asset Management Plan 2018-2028 1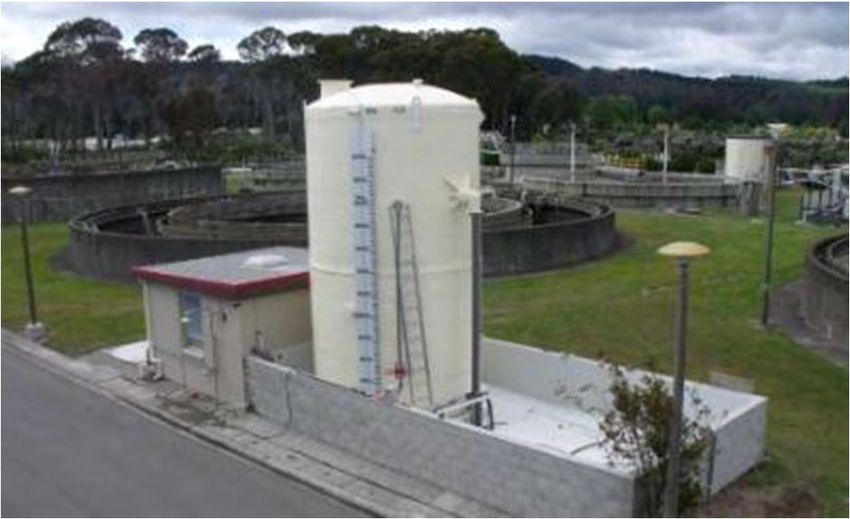
1.2         Scope of this Plan
            The plan format shown below outlines sections contained within this AMP.

                       This section introduction the purpose of this plan. Including an overview our region, it's
       Introduction    environment and some key physical features. Breif statistics such as population, rural/urban mix.
                       Rotorua Lakes Catchment at a glance

         Strategic     This section describes the Council's strategy, community links and vision for the Rotorua Lakes
      Environment      Catchment. Aligned is the key partnership and stakeholders vital to the programmes success.

                       The programme drivers define the current operational requirements and considerations to ensure
       Programme       this programme meets it Community outcomes. Health and Safety, statutory and requlatory
           Drivers     equirements. Local Government and Resources Management Acts, Council Bylaw policies and
                       strategies.

         Business
         overview      A business overview details the funding and expenditure for this activity

            Risk       Council proactive approach to minisising risk and prediciting adverse impact that may affect
      Management       assets and the community

            Assets

                                                            T
                        Details on the Rotorua Lakes Catchment assets and planned work schedules
                                   AF
      Improvement      Identify and develop improvements to the AMP and process's to ensure it is fit for purpose and
             Plan      effective

 2          The Bay of Plenty region
            R

2.1         Our region
            The Bay of Plenty is located on the east coast of the North Island of New Zealand. The
            region incorporates the full extent of the coastline from Cape Runaway in the east, to Waihi
           D

            Beach in the west and captures the coastal townships of Tauranga and Whakatāne. On the
            landward side, the region is mostly bounded by the watersheds of the catchments that flow
            into the Bay of Plenty; this includes the lakes in the Rotorua district. On the ocean side, the
            region includes 18 offshore islands including the volcanically active White Island, and the
            sea extending out to the 12-nautical-mile boundary.

            The area of the region is 21,740 square kilometres, comprising 12,231 square kilometres of
            land and 9,509 square kilometres of coastal marine area as shown in Figure 1 below.

Rotorua Lakes Catchment Asset Management Plan 2018-2028                                                                    2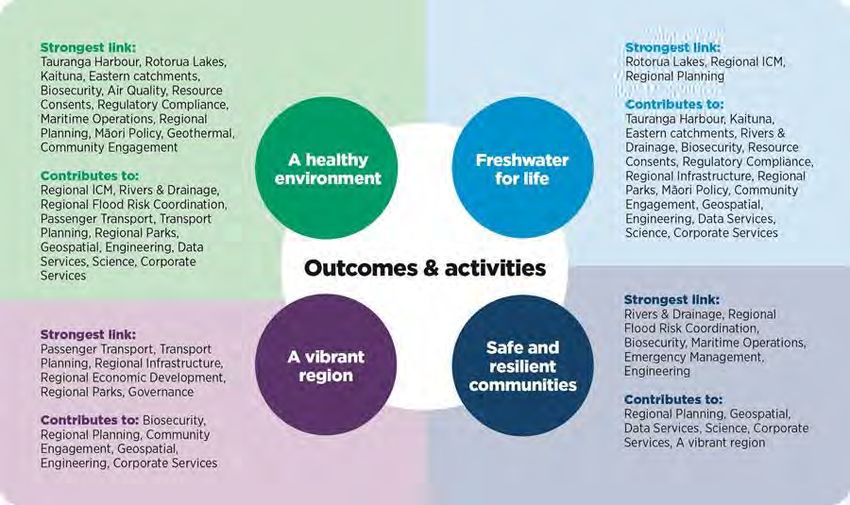
T
                              AF
          R

Figure 1 Map of the Bay of Plenty region
         D

2.1.1    The natural environment
         The Bay of Plenty region has a number of prominent features and landmarks. The
         prominent features of the region include islands such as Matakana, Tuhua (Mayor) and an
         active volcano; Whakaari (White Island). Other distinctive landmarks in the region include
         the numerous lakes of the Rotorua district and the distinctive peaks of Mount Tarawera and
         Putauaki, the Tauranga and Ohiwa Harbours and Mauao (Mount Maunganui).

         The region is volcanically active with the Taupo Volcanic Zone crossing the area between
         White Island and Lake Taupo. The two major features of this zone include a number of
         extensive geothermal areas (for example those found in Rotorua) and a number of
         earthquake fault lines that run parallel to each other within this zone.

         The Bay of Plenty Regional Council is responsible for twelve lakes with this catchment,
         Rotorua, Rotoehu, Rotoiti, Ōkāreka, Tikitapu, Ōkataina, Rotokakahi, Tarawera, Ōkaro,
         Rotomā, Rerewhakaaitu, Rotomahana.

2.1.2    Climate
         The Bay of Plenty generally has one of the sunniest climates in New Zealand, especially in
         coastal areas where dry spells have been traditionally quite common place. Annual rainfall
         follows variations in topography and varies from 1,400 mm near the coast to 4,000 mm on
         the highest parts of the Raukumara Ranges. Indications of climate change by the IPCC are
         that the

Rotorua Lakes Catchment Asset Management Plan 2018-2028                                             3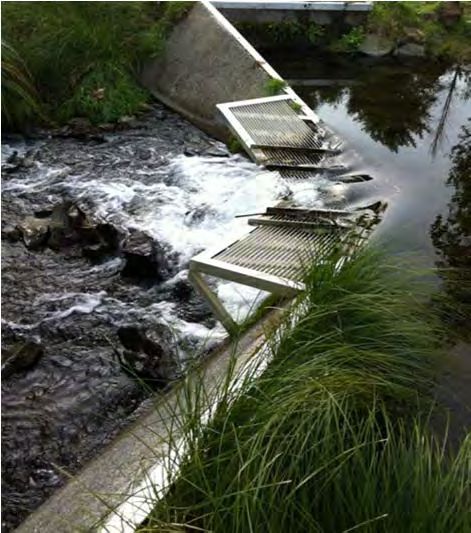
Bay of Plenty region may receive less rainfall in future, however the intensity and frequency
of high rainfall events will likely to increase. Sea level is predicted to rise with increased
magnitude of tidal storm surges.
The region has lower than average wind. Temperature inversions trap warm air under a
layer of cold air in many places, particularly in winter.
2.1.3 Economy and population
At the 2013 census, the region had a population of 273,360. The population estimate for
2018 is 303,500.
The largest urban area in the region is Tauranga city. 82% of the population live in the
areas of Tauranga City, Rotorua District, and Western Bay of Plenty.
Key points from the 2013 Census about the Bay of Plenty population are:
The population ranks 5th in size out of the 16 regions in New Zealand
The Māori population ranks third in size out of the 16 regions in New Zealand. Overall
27.5% of people belong to the Māori ethnic group (14.9% in New Zealand). However,
the percentage is significantly higher in the eastern part of the region
For people aged 15 years and over, the median income is $26,200 (lower than the
T
New Zealand median). A higher percentage of people have an annual income of
$20,000 or less for New Zealand as a whole
The median age is 40.6 years (38.0 years for New Zealand)
AF
17.5 percent of people in Bay of Plenty region are aged 65 years and over, compared
with 14.3 percent of the total New Zealand population
The region’s unemployment rate for the year to March 2017 was 5.7% (compared to
9% in the 2013 Census)
Under the Statistics NZ medium growth scenario, the Bay of Plenty region’s
population is predicted to grow to 329,800 by 2028
R
Table 1 Population estimates for Bay of Plenty region
Bay of Plenty region population
D
Census Population Estimates (Statistics NZ – medium growth projections)
Year 2013 2018 2023 2028 2033 2038 2043
279, 700 303,500 318,400 329,800 339,400 346,900 353,100
Projected population Population increase 2018-2028
growth (%) 8.7%
Population increase 2018-2043
16%
Source: http://stats.govt.nz/browse_for_stats/population/estimates_and_projections/subnational-pop-
estimates-tables.aspx.
Population projections to 2028 for the territorial authorities in the Bay of Plenty region
indicate that there will continue to be strong population growth in Tauranga city. Growth in
Western Bay of Plenty, Rotorua and Whakatāne districts will continue, but population may
decline in Ōpōtiki and Kawerau districts. This is shown in the graph below. As a result of the
population growth in Tauranga City, the percentage share of the region’s population
increases, and declines for all other districts.
Rotorua Lakes Catchment Asset Management Plan 2018-2028 4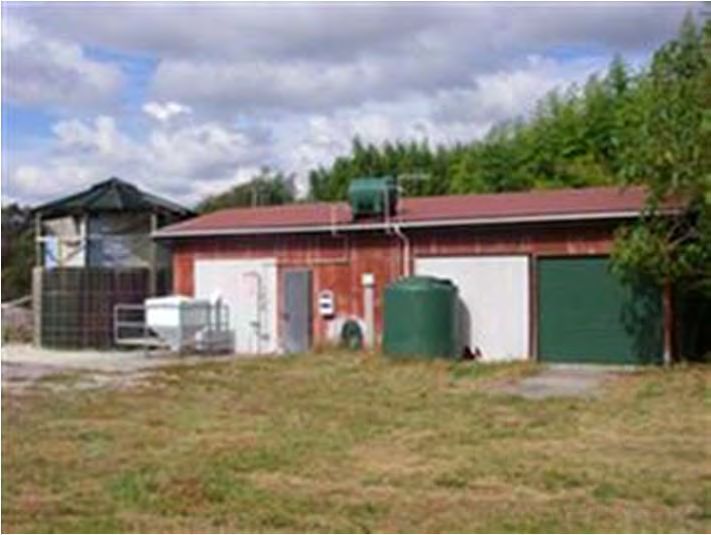
Figure 2 Population projections to 2028 for Territorial Authorities (Statistics NZ medium growth
         projections as at July 2017).

                        Population projections to 2028
 200000

 150000

 100000

   50000

        0
                      2013                   2018                 2023                 2028

                         Western Bay of Plenty district    Tauranga city
                         Rotorua district                  Whakatane district
                         Kawerau district                  Opotiki district

                                                    T
Source:http://stats.govt.nz/browse_for_stats/population/estimates_and_projections/subnational-pop-
                                 AF
estimates-tables.aspx

2.2         Rotorua Lakes Catchment at a glance

            The Bay of Plenty Regional Council (BoPRC) manages twelve lakes on behalf of the
            community via the Rotorua Te Arawa Lakes Programme. These lakes are of regional and
            national significance as well as being a taonga to the people of Te Arawa.
          R

            The twelve lakes that are considered as part of this Asset Management Plan (AMP) are
            outlined in Table 2. Deed funded lakes are those out of the twelve lakes that have been
            identified as the most in need of action and have Crown funding (as formalised under a
         D

            Memorandum of Understanding dated 18 April 2007) towards improving their water quality,
            subject to Bay of Plenty Regional Council (BoPRC) and Rotorua Lakes Council (RLC)
            matching the Crown’s contribution

Rotorua Lakes Catchment Asset Management Plan 2018-2028                                           5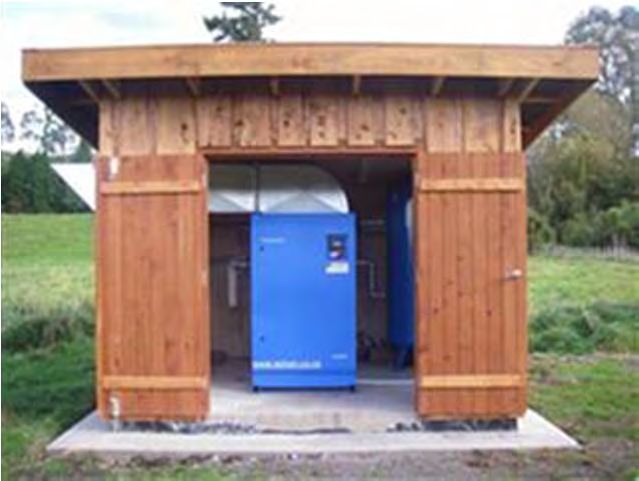
Table 2 Lakes covered under the Rotorua Lakes Catchment

      Deed Funded Lakes                               Non-Deed Funded Lakes
      Rotorua                                         Tikitapu
      Rotoehu                                         Ōkataina
      Rotoiti                                         Rotokakahi
      Ōkāreka                                         Tarawera
                                                      Okaro
                                                      Rotomā
                                                      Rerewhakaaitu
                                                      Rotomahana

2.3      Background
         The Rotorua Te Arawa Lakes are seen as iconic by many New Zealanders. They have unique
         cultural, historical, social, and economic value locally, regionally, nationally and
         internationally.

                                                     T
         A Lakes Management Working Group (consisting of Te Arawa Māori Trust Board,
         Bay of Plenty Regional Council and Rotorua Lakes Council) was initially established in 1998
         to identify and address the problems arising from a lack of co-ordination between the many
                                 AF
         groups with interests in managing the lakes and then to consider how the law and those
         concerned could work together to solve problems as effectively and efficiently as possible.

         In 2000, the Lakes Management Strategy was released to the community for consultation and
         feedback. A draft strategy for the lakes of the Rotorua District was adopted in October 2002.
         The document sets goals for the protection, use, enjoyment and management of the lakes.
           R

         The Rotorua Te Arawa Lakes Strategy Group (previously known as the Lakes Management
         Working Group) was established through the Te Arawa Lakes Settlement Act 2006. The
         strategy group have worked co-operatively on the lakes programme for the protection and
         restoration of the Te Arawa Lakes. The Rotorua Te Arawa Lakes Strategy Group has set a
         goal to restore the lake water quality to a sustainable level and a set of targets, action plans
          D

         and tools were developed to meet that. On 18 April 2007, a Memorandum of Understanding
         between the Crown and the Rotorua Te Arawa Lakes Strategy Group was signed to formally
         establish a working relationship between the parties for the purpose of maintaining and
         improving the water quality of the lakes through the Rotorua Te Arawa Lakes Programme.
         This is a circa $200 million programme spanning more than 20 years to improve or maintain
         water quality to meet community aspirations for water quality.

         *Source: Section 3 of the Programme Management Plan 2008-2022.

2.4      Programme objectives
         The key objective for the Rotorua Te Arawa Lakes Programme is:

                 “To meet community expectations for water quality in each lake”.

         Each of the 12 Rotorua lakes has a water quality target based on a Trophic Level Index (TLI)
         that is identified in the Regional Water and Land Plan. These current measureable objectives
         set for the programme are calculated using four key indicators – total nitrogen, total
         phosphorous, water clarity, and chlorophyll-A which are combined into one TLI number. The
         higher the TLI is, the lower the lake water quality. These current TLI targets are as follows:

Rotorua Lakes Catchment Asset Management Plan 2018-2028                                                 6
Table 3 Trophic Level Index (TLI) Targets for the twelve lakes
Nutrient reduction
Lake TLI target Nutrient reduction target (P)
target (N)
Rotoehu 3.9 8,880 kg 708 kg
Rotomā 2.3 1,320 kg 250 kg
Tikitapu 2.7 701-822 kg 21-31 kg
Ōkāreka 3.0 2,500 kg 80 kg
Ōkaro 5.0 910 kg 20 kg
Rotorua 4.2 250 tonnes 10 tonnes
Rotoiti 3.5 130 tonnes 19 tonnes
Ōkataina 2.6 860 kg 380 kg
Tarawera 2.6 TBC TBC
Rerewhakaaitu 3.6 TBC TBC
Rotokakahi 3.1 TBC TBC
T
Rotomahana - TBC TBC
Rotokakahi is an iwi owned lake managed by the Lake Rotokakahi Control Board
AF
Lake Rotomahana TLI does not exceed the three-yearly rolling average 0.2 unit
trigger
The aim for the above reductions is to meet community expectations for water quality in
each lake.
Although objectives are set in a regulatory document, partners within this programme
acknowledge and agree that community expectations mean more than meeting a scientific
R
measure of water quality (TLI). Measures of community satisfaction can also include
restoration of taonga species, mahinga kai, restoring the mauri of water or simply improving
water clarity. *
D
*SOURCE: SECTION 4 OF THE PROGRAMME MANAGEMENT PLAN 2008-2022
3 Overview of asset management planning
3.1 Asset management objectives and purpose
BoPRC recognises that the Rotorua Lakes AMP is the fundamental driver of managing
the twelve lakes on behalf of the community.
In order to fulfil the outcomes, vision, goals and objectives of these assets BoPRC have
adopted a systematic approach to the long-term management of its assets and services
by preparing this AMP.
BoPRC is committed to "best appropriate practice" asset management in order to
achieve the following key objectives:
3.2 Meet the service expectations of the community ('customer
values')
Ensure capital projects and maintenance activities achieve efficient results with optimal
benefits. We will demonstrate Council’s approach to managing risk and comply with
statutory requirements.
Rotorua Lakes Catchment Asset Management Plan 2018-2028 73.3 Plan timeframe
This AMP covers a 10-year timeframe. The main focus of the plan is to determine the
work programmes required to maintain, improve and renew assets over the next ten
years. The AMP provides the detail underpinning the LTP 2018-2028 and will be revised
every three years.
3.4 Key planning assumptions and limitations of this plan
Financial forecasts have been developed for ten years based upon the summaries in the
LTP 2018-2028.
Total construction costs and renewals profiles have not been altered for CPI. The
majority of the assets are new (less than 10 years old)
Total construction costs include design and supervision/management costs
Total construction costs have been apportioned across the component assets
Costs for lakes assets have a very high design component, therefore some minor
asset renewals will be much less than the valued replacement cost due to overhead
costs being apportioned across the asset base
3.5 Relationship with other plans and documents
Key documents will be used to control the Rotorua Lakes Catchment activity and Rotorua
T
Te Arawa Lakes Programme. Details of these documents, the current version and the
approval process are detailed in Table 4.
These documents are key to the success of the programme’s objectives and they will be
AF
treated as live documents. All documents will be reviewed as stated below to ensure these
documents are complete and reflect the current status of the programme.
R
D
Rotorua Lakes Catchment Asset Management Plan 2018-2028 8Table 4 Other plans and documents
Plans/Documents Description Frequency Date of issue
Long-Term Plan The LTP sets out an agreed vision and community Must be produced every three years. LTP 2018-2028, 1 July
outcomes for Bay of Plenty Regional Council. The 2018
framework of this plan is in line with the requirements of
the Local Government Act 2002 (LGA 2002). This plan
assists in promoting sustainable practices.
Annual Plan The works identified in the AMP should automatically Must be produced in the intervening years AP 2017/2018
become the basis on which future Annual Plans are between LTPs. Every third year the annual
prepared (as well as the LTP above). plan is embedded in the LTP.
T
Programme This document groups multiple programme projects to Must be reviewed and updated quarterly. V2.0, 21 August 2014
Management Plan achieve a strategic outcome. It captures and baselines
(PMP) 2008-2022 the scope and objectives of the programme and includes
AF
the following: work breakdown, governance and
controls, reporting, schedules, success measures
(including targets) etc.
Asset Management Levels of service, growth, risk, maintenance, renewal Should be reviewed and aligned every year V2.0, 1 July 2018
Plan and development works and strategies are identified and prior to the Annual Plan process and a major
budgeted for within this plan. This information should update every three years prior to the LTP.
automatically feed into the LTP and Annual Plan.
Communication
Stakeholder
Engagement Plan
and
R
This document supports the Programme Management
Plan. It is the road map for getting the programme’s
message to the Stakeholders and community.
Must be reviewed and updated annually. V1.5, 19 March 2014
Additional plan to sit aside
November 2014.
D
Finance Management Details the programme spending, baseline budgets, Must be reviewed and updated bi-annually. V2.0, 28 August 2014
Plan reporting and approval information.
Risk/Issues Details the processes and tools put in place to Must be reviewed and updated quarterly. V1.0, May 2014
Management Plan successfully manage identification; classification;
assessment; treatment and escalation of risks and
issues.
Change Management Serves to outline the process taken when changes are Must be reviewed and updated annually. V2.0, 7 March 2014
Plan made to the direction of the programme.
Rotorua Lakes Catchment Asset Management Plan 2018-2028 94 Strategic environment
4.1 Purpose
As caretakers of our land, air and water, Bay of Plenty Regional Council monitors the effects of
human activities on our environment. We also promote the sustainable management of our natural
and physical resources for present and future generations.
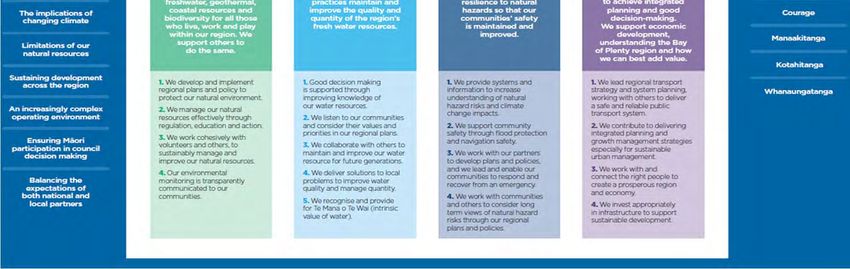
4.2 Linkages – community outcomes, and the Rotorua Catchment activity
Bay of Plenty Regional Council’s work guides and supports the sustainable development of the
Bay of Plenty. We want to make sure our region grows and develops in a way that keeps its values
safe for future generations. Council’s proposed vision and community outcomes are shown in figure
3 below.
Figure 3 Outcomes and activities
T
AF
R
D
A major focus of our work involves looking after the environment. We manage the effects of people’s
use of freshwater, land, air and coastal water. However, we also have a broader responsibility with
others for the economic, social and cultural well-being of the regional community.
4.3 Programme strategy
The Bay of Plenty Regional Council Strategy for the Lakes of the Rotorua District provides an overall
management strategy for the Rotorua Lakes. It is an overarching policy document that gives a vision
for the future, with some practical steps to achieve that vision.
As caretakers of the region's land, air and water, BoPRC monitors the effects of human activities on
the environment. It also promotes the sustainable management of natural and physical resources for
present and future generations.
Rotorua Lakes Catchment Asset Management Plan 2018-2028 104.4 Rotorua Te Arawa Lakes Programme Vision
The lakes of the Rotorua district and their catchments are preserved and protected for the use and
enjoyment of present and future generations, while recognising and providing for the traditional
relationship of Te Arawa with their ancestral lakes.
Matakite:
E tiakina ana, e manaakitia ana hoki nga rota o te rohe o Te Arawa hei painga mo tatau me nga
whakatipuranga e ara mai nei, a, me te aro ana ki te hononga tuku iho o Te Arawa ki o ratau
rota.
4.5 Key Partnerships and stakeholders
Bay of Plenty Regional Council works with a number of parties to deliver the Lakes Programme
and manage the overall goals and objectives of the activity. The Rotorua Te Arawa Lakes Strategy
Group is the overarching management group for the 12 lakes in the Rotorua Te Arawa Lakes
Programme. The parties involved and their responsibilities are summarised in Table 5.
Table 5 Roles and responsibilities for the partner organisations
T
Agency Role within Lakes programme
Te Arawa Lakes Trust Representatives of 52 iwi hapū of Te Arawa as outlined in
Schedule 2 of the Te Arawa Lakes Settlement Act 2006
Land owner of the Te Arawa Lake beds
AF
Lead and monitor cultural component of the lakes strategy
Involved and engaged in lakes programme strategy
deliverables
Rotorua Lakes Council Administer the relevant sections of the Resource
Management Act 1991
Provide and maintain urban sewerage and storm water
R
discharge infrastructure
Plan for and manage land uses within lake catchments
through the District Plan
Fund agreed portion of the Deed funded projects, in
D
association with Bay of Plenty Regional Council
Bay of Plenty Regional Council Implement the strategy for the lakes
Administer the relevant sections of the Resource
Management Act 1991
Monitor and report water quality issues
Implement the Recreation and Aquatic Pest Management
Strategy
Plan for and manage land uses within lake catchments
through the Regional Policy Statement
Fund agreed portion of Deed funded projects, in association
with Rotorua Lakes Council
An overall shown in figure 4 below is a picture of the partnership framework, the policies, strategies,
resourcing and work plans that help to deliver the Rotorua Lakes Vision and Strategy which is the
core outcome for the strategy group.
Rotorua Lakes Catchment Asset Management Plan 2018-2028 11Figure 4 Rotorua Lakes Vision and Strategy
T
AF
R
D
Rotorua Lakes Catchment Asset Management Plan 2018-2028 124.6 Community outcomes
Bay of Plenty Regional Council's work guides and supports the sustainable development of the
Bay of Plenty. Council wants to make sure the region grows and develops in a way that keeps its
values safe for future generations.
The Rotorua Te Arawa Lakes Programme contributes directly to four of the five Community
Outcomes identified in BoPRC's LTP 2018-2028, these are set out below:
Table 6 How the programme supports community outcomes
Community outcomes How the activity Key performance
contributes to community indicators
outcomes
Water Quality and Quantity Setting water quality Percentage reduction in
Our water and land improvement actions to exports of nitrogen from the
management practices achieve each lake’s Trophic Lake Rotorua catchment in
maintain and improve the Level Index (TLI) target accordance with the
quality and quantity of the Works with iwi, landowners integrated Framework and
region’s water resources. and the community to engineering solutions target
Environmental Protection provide updates on Rotorua Meeting the TLI for each
We maintain and enhance lakes water quality and lake, which are set in the
regional biodiversity and our
air, land, freshwater,
geothermal and coastal
T
progress Regional Water and Land
Plan
Achieving nutrient
AF
resources for the benefit of our reductions targets set in the
communities. We support Regional Policy Statement
others to do the same. for Lake Rotorua and other
Resilience and Safety individual lake action plans
Our planning and Continue to implement the
infrastructure provides Rotorua Te Arawa Lakes
resilience to natural hazards Programme, including
R
and flooding so that our implementing Lake Water
communities’ safety is Quality Action Plans;
improved and maintained. investigation lake restoration
options; and monitoring
Regional Collaboration and
interventions
D
Leadership
Harvest lake weed
We have established the
region’s priorities and strategic Take proactive measures to
direction with our partners and minimise algae blooms
communities. We have Commission and operate the
collaborated to achieve Tikitere Nitrogen Reduction
integrated planning across the Plant
region.
Continue operation of
P-locking plants
Rotorua Lakes Catchment Asset Management Plan 2018-2028 13Figure 5 The way we work
T
AF
R
D
Rotorua Lakes Catchment Asset Management Plan 2018-2028 145 Programme drivers
5.1 Health and safety
The programme has in place a Health and Safety Management Plan. It is designed to ensure the
programme’s major deliverables are completed with an acceptable level of safety. The purpose of
the Health and Safety Management Plan is to set out the health and safety policy, plans and
processes within which health and safety will be managed during the execution of the programme.
The main health and safety risks are associated with the lake sites and on-road travel. All
personnel involved on sites are considered to be exposed to higher risks; while all office work are
considered to be low risks.
*Source: Quality Management section of Programme Management Plan 2008-2022.
5.2 Statutory requirements
Statutory requirements impact on the way in which the Bay of Plenty Regional Council operates to
meet its obligations to its stakeholders. Some of the key legislation relevant to the programme is as
follows:
5.3 Local Government Act 2002 (Amended 2010)
The Local Government Act 2002 provides councils with a framework of powers to carry out
democratic decision-making and action for and on behalf of its community. It also imposes
T
accountability for prudent management and stewardship of community assets in the present and
into the future. The Act requires councils to identify community outcomes and develop a
comprehensive Long-Term Plan (LTP) including the identification of assets and how those assets
are to be managed.
AF
It is intended that this Asset Management Plan will be a vehicle for developing and recording
community outcomes in relation to property management and will be a
‘feeder plan’ supporting LTP functions and forecasts and asset information.
5.4 Resource Management Act 1991 (RMA) and Amendments
R
The RMA 1991 is New Zealand’s primary legislation dealing with the management of natural and
physical resources. It provides a national framework to manage land, air, water and soil resources,
the coast, subdivision and the control of pollution, contaminants and hazardous substances.
The RMA has a single overarching purpose:
D
“To promote the sustainable management of natural and physical resources”.
The Regional Water and Land Plan is a vehicle used to meet the requirements of the RMA and this
plan then in turn sets the water quality goals for Council to achieve by way of setting Trophic Level
Indices for each lake. These are then further considered in the
Levels of Service section of this AMP and also as part of the Lake Action Plans that have been/are
being developed for each of the twelve lakes.
5.5 Hazardous Substances and New Organisms Act 1996 (HSNO)
The HSNO Act came into force in two stages. Provisions relating to new organisms took effect in
July 1998. The provisions relating to hazardous substances came into force on
2 July 2001. The Act and regulations control the import, manufacture, or use (including disposal) of
manufactured chemicals that have hazardous properties.
Several of the plants managed and operated on behalf of BOPRC contain hazardous materials and
storage and use of these materials are governed by this Act.
Rotorua Lakes Catchment Asset Management Plan 2018-2028 155.6 Civil Defence Emergency Management Act (CDEM) 2002
The Civil Defence Emergency Management Act 2002 (CDEM Act 2002) came into force on 1
December 2002. The CDEM Act 2002 ensures that New Zealand has the resources to manage
disasters.
5.7 Emergency Management focuses on ‘the 4Rs’
Figure 6 4R’s
Reduction – identifying and analysing risks to
human life and property
Reduction Readiness Readiness – developing capabilities before an
emergency occurs
Response – taking action immediately before,
during or directly after an emergency
Response Recovery
Recovery – initiating activities after impact and
extending them until the community’s capacity for
self-help is restored
T
AF
5.8 The Civil Defence Emergency Management Act 2002 requires
The Bay of Plenty Regional Council and other district and city councils in the region to form a Civil
Defence and Emergency Management Group (CDEM Group).
To develop a Civil Defence Emergency Management Plan that identifies risks from hazards and
puts readiness, response, and recovery procedures in place. The plan is developed with public
input to ensure hazards and risks are dealt with to a level accepted by the community.
R
5.9 Health and Safety in Employment Act 1992
The objective of the Health and Safety and Employment Act 1992 is to promote the prevention of
harm to all people at work and others in, or in the vicinity of, places of work. The Act applies to all
D
New Zealand workplaces and places duties on employers, the
self-employed, employees, principals and others who are in a position to manage or control
hazards.
The emphasis of the law is on the systematic management of health and safety at work. It requires
employers and others to maintain safe working environments and implement sound practice. It
recognises that successful health and safety management is best achieved through good faith co-
operation in the place of work and in particular, through the input of those doing the work.
5.10 Rating Powers Act 1988
The Local Government (Rating) Act 2002 replaced the Rating Powers Act 1988 with updated and
streamlined rating powers. The intention is to ensure that the community has the opportunity to be
well informed about what its money is being spent on and to express its views when major
decisions are being made.
The three main purposes of the Act are to:
Provide local authorities with flexible powers to set, assess and collect rates
Ensure that rates reflect decisions made in a transparent and consultative manner
Provide for processes and information to ensure that ratepayers can identify and understand
their liability for rates
Rotorua Lakes Catchment Asset Management Plan 2018-2028 165.11 Health Act 1956
This Act establishes the government structure required to enact and enforce health requirements,
including the activities of local government.
5.12 Regulatory requirements
The Regional Council has developed various policies and works in partnership with other agencies,
to fulfil its role and align its activities to other agencies and organisations throughout the region.
This means that in establishing the Rotorua Te Arawa Lakes Programme, Council took into
account the following policies, strategies and guidelines.
Table 7 Policies, strategies etc.
Name Date
Funding Deed Original - August 2008, Variation 1 – October 2013
BOPRC Procurement Policy 2010 2010
BOPRC Ten-Year Plan (2009–2019) June 2009
BOPRC Ten-Year Plan (2012–2022) June 2012
BOPRC Annual Plan (2013/2014) June 2013
T
BOPRC Annual Plan (2014/2015) June 2014
BOPRC Long Term Plan (2015-2025) June 2015
BOPRC Annual Plan (2016/2017) June 2016
AF
BOPRC Annual Plan (2017/2018) June 2017
BOPRC Long Term Plan (2019-2028) June 2018 (Draft)
Rotorua Lakes Council’s Procurement September 2012
Policy
Rotorua Lakes Council’s Annual Plan 2014
R
Regional Water and Land Plan (Rule 11) 2011
Regional Policy Statement 2010
Rotorua Lakes Restoration MOU 2007
D
Rotorua Lakes Strategy Version 1, 2013
Action Plans:
Lake Ōkaro Action Plan
2006
Lake Ōkataina Action Plan
Lake Ōkāreka Action Plan 2013
Lake Rotoehu Action Plan 2011
Lake Rotomā Action Plan 2007
Lakes Rotorua and Rotoiti Action Plan 2009
Lake Tikitapu Action Plan 2009
2011
Rotorua Lakes Recreation Strategy 2005
Rotorua Lakes Catchment Asset Management Plan 2018-2028 176 Business overview
6.1 Funding and expenditure
6.1.1 Funding
Bay of Plenty Regional Council is a Regional Council established under the Local Government Act
2002 (LGA), and is domiciled and operates in New Zealand. The relevant legislation governing the
Council’s operations includes the LGA and the Local Government (Rating) Act 2002.
The Council also receives grants in respect of qualifying operating and capital expenditure from
Central Government for the Rotorua Lakes Protection and Restoration Action Plan as detailed in the
funding deed. These grants are recognised as revenue in the period they are received.
Below figure 8 show the funding ratios applied to the LTP 2018-2018.
Figure 8 Rotorua Lakes Catchment Funding ratios
Deed activities 25%
T
25% 50%
AF
General Funds
Targeted Rates
Subsidies
Non deed activities 50% 50%
R
0% 50% 100%
6.1.2 Expenditure
D
Financial estimates provided in table 8 incorporates the projected income and funding sources
(uninflated) to fund operational, renewal and capital expenditure for the next ten years. Deed project
income ends 2022. This is based on the best available information at the time of preparation.
Rotorua Lakes Catchment Asset Management Plan 2018-2028 18Table 8 Rotorua Lakes financial estimates 2018-2028 (uninflated)
2018/19 2019/20 2020/21 2021/22 2022/23 2023/24 2024/25 2025/26 2026/27 2027/28
$000 $000 $000 $000 $000 $000 $000 $000 $000 $000
Operating revenue
Targeted rates 3,063 3,012 2,949 2,902 2,847 2,796 2,727 2,685 2,632 2,571
Other subsidies 5,377 5,040 4,870 6,545 - - - - - -
Total operating revenue 8,441 8,052 7,819 9,447 2,847 2,796 2,727 2,685 2,632 2,571
Operating expenditure
Operating expenses 14,101 13,085 13,307 16,629 4,229 4,136 4,371 4,148 4,102 4,053
Depreciation and amortisation 795 879 965 1,009 1,009 984 959 937 856 856
T
Subtotal expenditure 14,896 13,964 14,272 17,638 5,238 5,120 5,330 5,084 4,957 4,909
Overhead charges and recoveries
AF
Corporate costs 945 957 976 962 967 979 964 964 965 939
Rates cost recharged 70 70 78 75 85 84 87 83 83 82
Total overhead charges and recoveries 1,015 1,027 1,054 1,037 1,052 1,063 1,051 1,047 1,048 1,021
Total expenditures 15,911 14,992 15,326 18,675 6,291 6,183 6,381 6,131 6,005 5,931
Net deficit (surplus) to fund 7,470 6,940 7,507 9,228 3,444 3,387 3,655 3,446 3,374 3,359
Funding required
General funding
(Increase) decrease in reserves
Total funding
R
2,246
5,224
7,470
2,169
4,771
6,940
2,459
5,048
7,507
2,496
6,732
9,228
2,949
495
3,444
3,019
368
3,387
3,290
364
3,655
3,290
157
3,446
3,384
(11)
3,374
3,521
(161)
3,359
D
Capital
Lakes capital expenditure 1,140 4,300 3,450 - - - - - - -
Total capital expenditure 1,140 4,300 3,450 - - - - - - -
Capital funding
Capital subsidies 250 2,150 1,400 0 0 0 0 0 0 0
Increase/(decrease) in debt 890 2,150 2,050 0 0 0 0 0 0 0
Total capital funding applied 1,140 4,300 3,450 0 0 0 0 0 0 0
Rotorua Lakes Catchment Asset Management Plan 2018-2028 19T
AF
R
D
Rotorua Lakes Catchment Asset Management Plan 2018-2028 206.2 Major capital works programme
Capital works and costs as outlined within LTP 2018-2028 are below.
Table 9 Capital works
Project Costs Commissioning years
Tikitere Nitrogen Reduction Plant $7,599,086 2020/2021
Buoy Okareka $35,000 2018/2019
Buoy Rotoiti $35,000 2018/2019
Nutrient Assessment Database $250,000 2018/2019
Lake Ōkāreka Pipeline $970,000 2020/2021
Total $8,889,086
7 Risk management
Proactive risk management is key for BoPRC. By predicting adverse impacts that may affect a
realised.
T
particular project, plans can be developed to treat a risk before the risk impacts, escalates, or is
Risk assessment and management are vital business processes used to:
AF
Identify potential threats to the programme, system or asset
To assess vulnerabilities of the programme, system or asset
To evaluate the impacts on programme’s assets or systems
To evaluate the probability of these threats occurring
To evaluate the probability of these threats occurring
R
Assessing risks at asset level is the focus of this AMP section and the Programme and Project Risk
Management Plan.
The identification of the programme risks focuses on the following three key areas as identified in
D
figure 9:
Figure 9 Key risk areas
Rotorua Lakes Catchment Asset Management Plan 2018-2028 218 Asset summary
Council manages 12 lakes through the Rotorua Te Arawa Lakes Programme activity as noted in the Introduction. The programme focuses on water
quality protection and restoration. It is a joint programme between Bay of Plenty Regional Council, Rotorua Lakes Council and Te Arawa Lake Trust.
Council manages $16,542,337 (replacement value) of assets to implement the goals of the Rotorua Lakes Strategy. The assets and their locations (on 5
lakes) are summarised on this page.
Table 10 Asset replacement value
Lakes Summary $16,542,337 Lake Okaro $279,200
P-Locking plants: Rotoehu, Rotorua $1,092,800 Wetland 1 & 2 $279,200
Nitrogen Reduction (Tikitere Zeolite Pilot) plant: Rotorua $469,400
De-stratification plant: Rotoehu $456,600 Lake Rotoiti $11,446,900
T
Koaro Fish pass $26,000 Monitoring buoy A & B $78,400
Monitoring buoys: Rotorua, Rotoiti, Rotoehu and Tarawera, $243,700 Ōhau Channel diversion wall $11,368,500
AF
Wetlands: Okaro and Rotoehu (floating) $1,119,200
Groundwater monitoring bores: Rerewhakaaitu, Tarawera, $1,353,218 Lake Rotoehu $1,756,400
Rotokakahi, Tikitapu and Okareka
Aquatic weed harvester trailer: Rotorua $63,335 Waitangi Soda Springs P-locking plant $382,600
Outlet Structure: Okareka $263,443 De-stratification plant $456,600
Diversion wall: Rotoiti.
Pioneer Pump Canopy unit: Okareka
R $11,368,500
$86,141
Monitoring buoys (2)
Wetland
$77,200
$840,000
D
Lake Rotorua $1,598,582 Lake Okareka $349,584
Puarenga P-Locking plant $315,200 Outlet structure $263,443
Utuhina P-Locking plant $395,000 Pioneer Pump Canopy unit $86,141
Tikitere Zeolite Pilot plant $469,400
Monitoring buoy $39,700 Multiple Lakes $1,111,671
Koaro Fish pass $26,000 Monitoring buoy $48,400
Groundwater bores (4) $353,282 Groundwater bores (12) $999,936
Aquatic weed harvester trailer: Rotorua $63,335
Rotorua Lakes Catchment Asset Management Plan 2018-2028 229 Asset life cycle management
The following Lifecycle Management (LCM) section provides detailed summary of the lakes assets. It also provides key strategies and work programmes
that are underway to manage the assets that form the activity, to ensure that Levels of Service are met as are the overall goals and objectives of this plan
and the lakes strategy.
The LCM section includes the following:
Explanation of Lifecycle Management
Asset valuation and data summaries
Key issues and actions for each asset group
Lifecycle Management strategies and programmes
Table 11 Asset ID Depreciation cost
T
Asset ID Description Asset
Useful
Cost Depreciation 2018/2019 2019/2020 2020/2021 2021/2022 2022/2023 2023/2024 2024/2025 2025/2026 2026/2027 2027/2028
Life
ODRC Rate $000 $000 $000 $000 $000 $000 $000 $000 $000 $000
(years)
$000
AF
LAK102512 435 Oturoa Rd, Lake Rotorua Asset
10965 108 2.00 50.00 2 2 2 2 2 2 2 2 2 2
LAK102514 79 Ngongotaha Road, Ngongotaha
62 2.00 50.00 1 1 1 1 1 1 1 1 1 1
Boring number 10967
LAK102515 83 Gee Road, Rotokawa, Rotorua
Bore number 10968 61 2.00 50.00 1 1 1 1 1 1 1 1 1 1
LAK102516 588 Spencer Road Lake Tarawera
Bore number 1000129 71 2.00 50.00 1 1 1 1 1 1 1 1 1 1
LAK102517 Te Miro, Lake Tarawera Boring
72 2.00 50.00 1 1 1 1 1 1 1 1 1 1
LAK102518
LAK102520
number 1000131
Lake Tarawera Outlet - DOC
Campground Bore number 1000134
1180 Tarawera Road, Buried Village
Bore number 1001051
75
72 R
2.00
2.00
50.00
50.00
2
1
2
1
2
1
2
1
2
1
2
1
2
1
2
1
2
1
2
1
D
LAK102521 757 Ashpit Road, Waiotapu Bore
number 1001052 69 2.00 50.00 1 1 1 1 1 1 1 1 1 1
LAK102522 757 Ashpit Road, Waiotapu Bore
number 1001053 62 2.00 50.00 1 1 1 1 1 1 1 1 1 1
LAK102523 1278 Ashpit Road, Waiotapu Bore
number 1001055 94 2.00 50.00 2 2 2 2 2 2 2 2 2 2
LAK102524 101 Rerewhakaaitu Road, Waiotapu
Bore number 1001056 83 2.00 50.00 2 2 2 2 2 2 2 2 2 2
LAK102525 11 Highland Loop Road, Lake
Rotokakahi Bore number 1001068 103 2.00 50.00 2 2 2 2 2 2 2 2 2 2
LAK102526 Tarawera Road, Lake Tikitapu Bore
number 1001069 97 2.00 50.00 2 2 2 2 2 2 2 2 2 2
LAK102527 171 Millar Road, Lake Okareka Bore
number 1001070 92 2.00 50.00 2 2 2 2 2 2 2 2 2 2
Rotorua Lakes Catchment Asset Management Plan 2018-2028 23LAK102528 Ohau Channel Diversion Wall 8,047 6.67 14.99 537 537 537 537 537 537 537 537 537 537
LAK102529 Utuhina Phosphorus Locking
Plant;4/49 Depot Street Rotorua 260 8.33 12.00 22 22 22 22 22 22 22 22 18 0
LAK102530 Puarenga Phosphorus Locking
Plant;;Rotorua CC Sewage
Treatment Plant, State Highway 241 8.33 12.00 20 20 20 20 20 20 20 20 17 0
30a, Rotorua
LAK102531 Waitangi/Soda Springs Phosphorus
Locking Plant;59 Manawahe Road,
329 8.33 12.00 27 27 27 27 27 27 27 27 23 0
Rotoehu
LAK102532 Tikitere Denitrification Plant;;State
Highway 30, Rotorua 176 8.33 12.00 15 15 15 15 15 15 15 15 12 0
LAK102533 Tikitere Denitrification Plant;State
Highway 30, Rotorua 27 8.33 12.00 2 2 2 2 2 2 2 2 2 0
LAK102534 Lake Rotoehu Destratification
Plant;2131 State Highway 30 390 5.56 17.99 22 22 22 22 22 22 22 22 22 22
T
LAK102535 Lake Rotoehu Floating
Wetland;2131 State Highway 30 718 5.00 20.00 36 36 36 36 36 36 36 36 36 36
adjacent Te Maero Stream
LAK102536 Lake Rotorua Monitoring Buoy
AF
21 8.33 12.00 2 2 2 2 2 2 2 2 1 0
LAK102537 Hamurana Tributary Koaro fish pass 25 2.50 40.00 1 1 1 1 1 1 1 1 1 1
LAK102538 Lake Rotoiti Monitoring Buoy 24 8.33 12.00 2 2 2 2 2 2 2 2 2 0
LAK102539 Lake Tarawera Monitoring Buoy 31 8.33 12.00 3 3 3 3 3 3 3 3 2 0
LAK102540 Lake Rotoehu Monitoring Buoy A 29 8.33 12.00 2 2 2 2 2 2 2 2 2 0
LAK102541 Lake Rotoehu Monitoring Buoy B 29 8.33 12.00 2 2 2 2 2 2 2 2 2 0
LAK102542
LAK104731
LAK104732
Okaro Wetlands 1 & 2 Okaro Road,
Rainbow Mountain Murupara
Aquatic Weed Harvester Trailer
Lake Okareka Outlet Structure
200
63
R
2.50
10.00
40.00
10.00
5
6
5
6
5
6
5
6
5
6
5
6
5
6
5
6
5
0
5
0
D
263 5.00 20.00 13 13 13 13 13 13 13 13 13 13
11,994 738 738 738 738 738 738 738 738 716 635
Rotorua Lakes Catchment Asset Management Plan 2018-2028 2410 Asset detailed information
10.1 Phosphorus locking (P-locking) plants
There are currently three Phosphorous locking (P-locking) plants in the Rotorua District that are managed
by BoPRC. These are:
Utuhina Stream - Lake Rotorua
Puarenga Stream - Lake Rotorua
Waitangi Soda Springs - Lake Rotoehu
P-locking plants are used to reduce available phosphorous from a water body by using a “locking” chemical
such as alum. P-locking plants target point sources that are high in phosphorus with the aim of reducing the
concentration of phosphorous entering water bodies, i.e. Lake Rotorua or Lake Rotoehu. Various studies
have shown that these lakes have degrading water quality due to excess phosphorous. Currently, both
Rotorua P-locking plants are going through a re-consent process to continue dosing alum.
T
AF
R
D
Plant Replacement cost Sum of ODRC* Sum of AD**
Puarenga $315,200 $240,850 $50,240
Utuhina $395,000 $260,180 $54,271
Waitangi Soda Springs $382,600 $328,750 $68,574
$1,092,800 $829,780 $173,085
*ODRC: Optimised depreciated rate of cost ** AD: Asset depreciation
Plant Scheduled works Estimate cost Schedule dates
Puarenga General repairs and $5,000 Annual
maintenance, coating
Tank condition review $5,000 2019/20
Coating $30,000 2018/19
Utuhina General repairs and $5,000 Annual
maintenance, coating
Tank condition review $5,000 2019/20
Coating $30,000 2018/19
Rotorua Lakes Catchment Asset Management Plan 2018-2028 25Plant Scheduled works Estimate cost Schedule dates
Waitangi Soda Springs General repairs and $5,000 Annual
maintenance,
Tank condition review $5,000 2019/20
Consenting process $100,000 2018/19
10.2 De-Stratification plant – Lake Rotoehu
The De-Stratification plant (DSP) forces air through diffusers into the lake at different depths to eliminate
stratified layers of temperature, plant or animal life. This ensures that more oxygen is available at the lower
levels of the lake, leading to improvements in water quality.
The DSP is located at the southern end of Lake Rotoehu and is operated by BoPRC’s Lake Operations
Officer, University of Waikato and external consultants and contractors. This is a pilot plant and monitoring
and sampling has now been completed.
T
AF
R
Plant Replacement cost Sum of ODRC* Sum of AD**
De-stratification $456,600 $390,390 $54,353
D
*ODRC: Optimised depreciated rate of cost ** AD: Asset depreciation
Plant Scheduled works Estimate cost Scheduled dates
De-stratification No planned works $0 NA
Rotorua Lakes Catchment Asset Management Plan 2018-2028 2610.3 Nitrogen Reduction (Tikitere Zeolite Pilot) plant – Lake Rotorua
The Nitrogen Reduction (Tikitere Zeolite Pilot) plant (TNRP) is located at State Highway 30, Tikitere. It is
operated by BoPRC and its consultants/contractors. Originally, this site was set up as a de-nitrification pilot
plant which was decommissioned. Components from the de-nitrification plant such as control systems,
transmitter units and pumps were reused in plant trials.
The geothermal flows that originate from the Tikitere Hells’ Gate thermal field, are high in nitrogen and are
discharged into Lake Rotorua via the Waiohewa Stream. The TNRP aims to improve water quality in the lake
by absorbing the nitrogen which is in the form of ammonia.
At the December 2014 Rotorua Te Arawa Lakes Strategy Group meeting, construction of the full-scale plant
was delayed until the 2018/19 financial year. The main reason for this delay is that the benefits of the
nitrogen reduction from that this plant would need to be combined with other reductions of nitrogen for there
to be a noticeable impact on lake water quality. Therefore, it was agreed to delay construction of the plant
and not incur the $700,000 per annum operating expense until other reductions in nitrogen within the
catchment are made. Adjustments to the forecast expenditure of the Programme as a result of this delay in
construction were also approved by BoPRC at the 10 February 2015 meeting. Staff intend to proceed with
obtaining the resource consents for the project and complete final detail engineering design and build costing
estimates before proceeding to build the plant in 2018/19.
T
AF
R
D
Nitrogen Reduction (De-nitrification) plant
Asset Replacement cost Sum of ODRC* Sum of AD**
Nitrogen Reduction
(Tikitere Zeolite Pilot) Est $469,400 $203,260 $42,397
plant
*ODRC: Optimised depreciated rate of cost ** AD: Asset depreciation
Asset Scheduled works Estimate cost Schedule dates
Nitrogen Reduction Technical and $500,000 2018/19
(Tikitere Zeolite Pilot) engineering advice
plant and design work
Plant construction $7,099,000 2019/21
works
Rotorua Lakes Catchment Asset Management Plan 2018-2028 2710.4 Water quality monitoring buoys
BoPRC manages seven water quality monitoring buoys. The University of Waikato (UoW) has installed and
maintains them on BOPRC’s behalf and output information is available online to the public.
Lake Date deployed Depth
Tarawera (meteorological) September 2006 N/A
Rotorua July 2007 21 m
Rotoiti (narrows) July 2008 19 m
Rotoehu April 2011 10.5 m
Rerewhakaaitu February 2016 13.6 m
Okaro January 2013 1.5 m
Rotokakahi To be installed N/A
Asset Replacement cost Sum of ODRC* Sum of AD**
Combined assets Est $243,700 $277,900 $28,006
*ODRC: Optimised depreciated rate of cost ** AD: Asset depreciation
Asset
All buoy’s
Scheduled works
Repairs,
T Estimate cost
$2,000
Schedule dates
Annual
AF
maintenance and
monitoring
New – buoy Lake $35,700 2018/19
Ōkāreka
New – buoy Lake
Rotoiti $35,700 2018/19
R
10.5 Koaro Fish pass/Trout Barrier
The Koaro Fish Pass is located in the Hamurana Stream on the northern edge of Lake Rotorua. It was built
in 2012.
D
The assets that form the fish pass include 3 x base slabs and 2 x wing walls.
Rotorua Lakes Catchment Asset Management Plan 2018-2028 28Asset Replacement cost Sum of ODRC Sum of AD
Koaro Fish pass/Trout
$26,000 $24,700 $1,550
Barrier
*ODRC: Optimised depreciated rate of cost ** AD: Asset depreciation
Asset Scheduled works Estimate cost Schedule dates
Koaro Fish pass/Trout General monitoring
$1,000 Annual
Barrier
10.6 Ōhau Channel diversion wall
The Ōhau diversion wall is located in Lake Rotoiti and was built in 2008. The diversion wall has been built
to reduce the amount of nutrients reaching Lake Rotoiti from Lake Rotorua via the Ōhau Channel. Water
from Lake Rotorua is now diverted down the Kaituna River rather than entering Lake Rotoiti, and due to the
reduced nutrient loading has helped to improve the water quality in the lake significantly.
The assets that form the diversion wall include the following:
King piles (up to 70 m deep)
Sheet piles (1,300 m long wall)
Timber facing
Timber walers
Mesh
T
AF
Navigation equipment
R
D
Annual depreciation is approximately $700,000. Annual depreciation will be revised and reduced once
protection system is put in place.
Corrosion identified on the diversion wall in 2014 has led to the development of a structural management
plan to ensure the wall meets its service life of 50 years. Structural components are scheduled to be
installed in 2018/19 to delay major remediation by 10 years.
Asset Replacement cost Sum of ODRC Sum of AD
Ōhau Channel diversion $11,368,500 $8,047,480 $1,344,123
wall
*ODRC: Optimised depreciated rate of cost ** AD: Asset depreciation
Asset Scheduled works Estimate cost Schedule dates
Ōhau Channel diversion General monitoring $50,000 Annual
wall and maintenance
Design, structural $1,170,000 2018/2022
engineering and
protection works
Rotorua Lakes Catchment Asset Management Plan 2018-2028 2910.7 Wetlands
The Bay of Plenty Regional Council manages a number of wetlands. One land based constructed wetland
– the Okaro Wetland, and a 2,800 m2 floating wetland in Lake Rotoehu. Two small wetlands (70 m2) in
Lake Rotoiti and a small wetland in Lake Rotorua (around 70 m2).
Wetlands act to reduce nitrogen and phosphorous levels in lakes Rotorua and Rotoehu whereby plants
extract nitrogen from lake water or land runoff and use for growth.
The floating wetlands also provide additional benefits once they are fully established and are towed to their
final location. These benefits include acting as a nursery for Koura, nesting for birds, enhancing fisheries
and dampening wave action in the lake.
T
AF
Asset Replacement cost Sum of ODRC* Sum of AD**
Floating Wetlands $913,396 $718,130 $89,913
Land based Wetland $205,804 $199,810 $12,508
Okaro
R
*ODRC: Optimised depreciated rate of cost ** AD: Asset depreciation
Works planned
Asset Estimate cost Planned schedule
D
description
Floating Wetland Monitoring $500 Annual
Land based Wetland
Monitoring $500 Annual
Okaro
Rotorua Lakes Catchment Asset Management Plan 2018-2028 3010.8 Groundwater monitoring bores
Bay of Plenty Regional Council has 16 ground water monitoring bores. Four of these are located around
Rotorua and the remainder around the greater Tarawera Lake Catchments.
The gross replacement cost for the groundwater monitoring bores is $1,353,218. The ODRC is $1,233,490
reflecting that the assets are in as new condition. The assets have been valued in total and have not been
itemised down to component level.
Asset Replacement cost
T Sum of ODRC* Sum of AD**
AF
Groundwater monitoring $1,353,218 $1,233,490 $3,776
bores
*ODRC: Optimised depreciated rate of cost ** AD: Asset depreciation
Works planned
Asset Estimate cost Planned schedule
description
R
Groundwater monitoring
Monitoring $500 Annual
bores
D
Rotorua Lakes Catchment Asset Management Plan 2018-2028 3110.9 Aquatic weed harvester trailer
The weed harvester trailer provides the ability to transport the harvester to problem lakes where the weed
harvester is used to reduce in-lake nutrient recycling and the impact on amenity values.
Asset Replacement cost Sum of ODRC* Sum of AD**
Aquatic weed harvester $63,335 $63,335 $15,859
trailer
*ODRC: Optimised depreciated rate of cost ** AD: Asset depreciation
Works planned
Asset Estimate cost Planned schedule
description
Aquatic weed harvester General
$500 Annual
trailer maintenance
10.10 Outlet structure
The Bay of Plenty Regional Council own and hold a resource consent to operate an outlet pipeline from
Lake Ōkāreka to the Waitangi Stream (which flows into Lake Tarawera). The purpose of the pipeline is to
manage lake levels. The pipeline has been partially upgraded in 2015 to replace failing asset and increase
T
maximum discharge. BoPRC staff operates an adjustment valve from open (to a maximum consent limit of
239 L/s in winter) to fully closed in summer using a control operating protocol.
AF
Asset Replacement cost Sum of ODRC* Sum of AD**
Lake Ōkāreka Outlet $263,443 $263,443 $25,246
structure
*ODRC: Optimised depreciated rate of cost ** AD: Asset depreciation
Works planned
R
Asset Estimate cost Planned schedule
description
Lake Ōkāreka Outlet General
$5,000 Annual
structure maintenance
D
Lake Ōkāreka Outlet Repairs and upgrade
$970,000 2018/2021
structure – upgrade construction
10.11 Pioneer pump canopy unit
In 2017 a temporary pipeline was used at Lake Ōkāreka to supplement the existing outlet pipeline,
reducing critically high lake levels caused by extreme weather events that occurred between March and
August. The temporary pipeline requires a pump to function and the cost of hiring a pump becomes
excessive over long periods of operation. It was decided that purchasing a pump would provide long term
cost benefits verses hiring.
Asset Replacement cost Sum of ODRC* Sum of AD**
Pioneer pump canopy unit $86,141 $86,141 $5,805
*ODRC: Optimised depreciated rate of cost ** AD: Asset depreciation
Works planned
Asset Estimate cost Planned schedule
description
Pioneer pump canopy unit General maintenance $500 Annual
Rotorua Lakes Catchment Asset Management Plan 2018-2028 32You can also read