Semiautomated Mapping of Benthic Habitats and Seagrass Species Using a Convolutional Neural Network Framework in Shallow Water Environments - MDPI
←
→
Page content transcription
If your browser does not render page correctly, please read the page content below
remote sensing
Article
Semiautomated Mapping of Benthic Habitats and
Seagrass Species Using a Convolutional Neural
Network Framework in Shallow Water Environments
Hassan Mohamed 1, * , Kazuo Nadaoka 2 and Takashi Nakamura 2
 1    Department of Geomatics Engineering, Shoubra Faculty of Engineering, Benha University,
      Cairo 11672, Egypt
 2    School of Environment and Society, Tokyo Institute of Technology, Tokyo 152-8552, Japan;
      nadaoka.k.aa@m.titech.ac.jp (K.N.); nakamura.t.av@m.titech.ac.jp (T.N.)
 *    Correspondence: hassan.mohamed@ejust.edu.eg or hassan.hussein@feng.bu.edu.eg

 Received: 6 November 2020; Accepted: 4 December 2020; Published: 7 December 2020

 Abstract: Benthic habitats are structurally complex and ecologically diverse ecosystems that are
 severely vulnerable to human stressors. Consequently, marine habitats must be mapped and monitored
 to provide the information necessary to understand ecological processes and lead management actions.
 In this study, we propose a semiautomated framework for the detection and mapping of benthic
 habitats and seagrass species using convolutional neural networks (CNNs). Benthic habitat field data
 from a geo-located towed camera and high-resolution satellite images were integrated to evaluate the
 proposed framework. Features extracted from pre-trained CNNs and a “bagging of features” (BOF)
 algorithm was used for benthic habitat and seagrass species detection. Furthermore, the resultant
 correctly detected images were used as ground truth samples for training and validating CNNs with
 simple architectures. These CNNs were evaluated for their accuracy in benthic habitat and seagrass
 species mapping using high-resolution satellite images. Two study areas, Shiraho and Fukido (located
 on Ishigaki Island, Japan), were used to evaluate the proposed model because seven benthic habitats
 were classified in the Shiraho area and four seagrass species were mapped in Fukido cove. Analysis
 showed that the overall accuracy of benthic habitat detection in Shiraho and seagrass species detection
 in Fukido was 91.5% (7 classes) and 90.4% (4 species), respectively, while the overall accuracy of
 benthic habitat and seagrass mapping in Shiraho and Fukido was 89.9% and 91.2%, respectively.

 Keywords: convolutional neural networks; benthic habitats mapping; seagrass spices mapping;
 shallow-water ecosystems

1. Introduction
     Recently, high-resolution underwater video systems have enabled scientific discoveries of the
seafloor related to marine studies, environmental management, and species monitoring. In particular,
towed underwater video cameras play an important role in detecting benthic habitats [1,2] by facilitating
detailed observations and field sampling of unexplored marine ecosystems. Furthermore, towed video
cameras are low cost, have fast processing, and are environmentally sustainable, i.e., they do not harm
the environment. However, these video systems produce low light, increased turbidity, and images
with high noise, which all pose challenges for underwater video analysis. Firstly, low illumination and
turbid conditions produce weak descriptors and confuse object detection techniques. Secondly, benthic
habitats are frequently altered by waves and currents and may appear to be different from various
camera angles. Thirdly, the images produced by towed video cameras usually have low contrast
and low saturation; consequently, these often provide insufficient information for the recognition

Remote Sens. 2020, 12, 4002; doi:10.3390/rs12234002                        www.mdpi.com/journal/remotesensing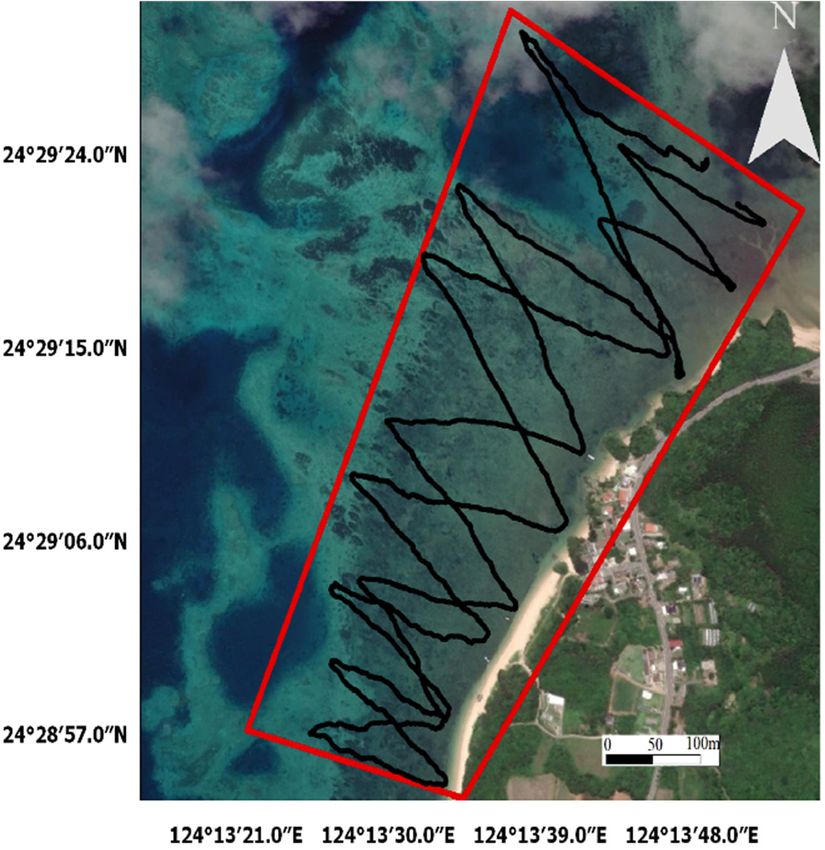
Remote Sens. 2020, 12, 4002                                                                          2 of 18

and discrimination of species. Finally, the captured images often consist of an assemblage of benthic
habitats with irregular shapes and sizes [3].
      Previous studies [4–6] have provided precedence for applying computer vision-based techniques
to benthic image classification. Such research has used multiple combinations of shape, color,
and texture features as the most important discriminating factors for datasets. For example,
Shihavuddin et al. [6] tested a combination of color and texture feature descriptors (such as completed
local binary patterns, Gabor filter responses, hue channel color histograms, and gray level co-occurrence
matrices) for underwater image classification. They proposed using several combinations of machine
learning classifiers, e.g., k-nearest neighbors, neural networks, and support vector machines (SVMs).
Three benthic datasets, EILAT, RSMAS, and Moorea labeled corals (MLC), were used to evaluate
the proposed methods. The results of the study showed that a combination of various feature
extraction descriptors and classifiers outperformed a single method across various datasets with at
least a 5% overall improvement in classification accuracy. In addition, Gauci et al. [7] assessed three
red-green-blue channels and three LAB color dimensions representing the lightness and the four
unique colors of human vision extracted manually as classifiers of two benthic habitats: Sand and
maerl. They used images captured by cameras mounted on remote operated vehicles (ROVs) and
evaluated the accuracy and efficiency of three machine learning algorithms (i.e., random forest, neural
network, and classification trees); each of the tested algorithms achieved state-of-the-art classification
accuracies. In another study, Raj and Murugan [8] used bagging of features (BOF) descriptors with
an SVM algorithm to classify seven benthic classes. Around 11000 underwater images captured by a
camera on an ROV device were used to evaluate the process: 80% for training and 20% for testing.
The proposed method resulted in 93% overall accuracy (OA).
      Recently, convolutional neural networks (CNNs) have been successfully used in numerous
classification tasks [9]. The production of new CNN architectures such as AlexNet [10], VGGNet [11],
ResNet [12], and GoogleNet [13] has improved the resultant classification accuracy in several computer
vision problems. Furthermore, automation of the classification of benthic habitat images captured by
towed underwater cameras has now been investigated [14,15]. Raphael et al. [16] reviewed the recent
developments in CNNs for coral classification, and they highlighted the current limitations and future
research directions of this technology.
      Elawady [17] was the first to propose the use of CNNs for coral classification; the raw input
images used in the study were first enhanced using color correction and smoothing filtering. A LeNet-5
CNN was then trained with an input layer containing three basic channels of color images, texture,
and shape descriptors. Two datasets were used to evaluate the proposed method: The MLC dataset [18],
which included 2000 images and 9 classes, and the Atlantic Deep-Sea dataset [19], which had 55 images
and 5 classes. Overall, the model resulted in 55% OA. Asma et al. [20] also proposed a coral classification
model for detecting damaged and healthy corals using a CNN. These authors collected 1200 images of
damaged and healthy corals from the Persian Gulf, fusion tables, Google searches, coral reef image
bank.org, and Australian and Florida corals datasets. From these images, 90% were used for training
and 10% for evaluating the model. The final model predicted diseased and healthy corals with 95%
classification accuracy. In another study, Andrew et al. [21] compared CNN and fully CNN (FCNN)
architectures using multi-view underwater images to improve coral reef ecosystem classification
accuracy. These authors proposed a patch-based CNN that could process multiple-viewpoint images as
inputs while also creating 3D semantic segmentation of diverse coral reef batches. They also evaluated a
combination of voting- and logit pooling-based methods with these patch-based CNNs. To validate the
method, 2391 stereo image pairs were divided into 2 subsets, an 80% training set, and a 20% testing set,
in order to classify 10 classes. They reported an OA of 94%. In a study by Anabel et al. [22], the authors
evaluated three powerful CNNs (Inception v3, ResNet, and DenseNet) with data augmentation
techniques for classifying underwater coral images. Three datasets (MLC, ELAT, and RSMAS) were
used for evaluating these models. Furthermore, Alessandra et al. [15] exploited the diversity of various
CNN ensembles to study plankton and coral classification. These ensembles were evaluated using five
Remote Sens. 2020, 12, 4002                                                                          3 of 18

datasets (WHOI, ZooScan, Kaggle plankton datasets, EILAT, and RSMAS coral datasets). In these latter
two studies, the evaluated CNN models accomplished state-of-the-art accuracies that outperformed
classical methods.
      Although these aforementioned approaches achieved high recognition accuracies, they each
required substantial computation and memory requirements, which are not available to most users.
Moreover, the available underwater image datasets were inadequate for training CNNs for benthic
habitats feature extraction from scratch. As a result, the authors of these studies used pre-trained CNNs
as feature extractors for classifying machine learning algorithms. In nearly all image detection and
classification applications, the image descriptors extracted from pre-trained CNNs have been superior
to hand-crafted features [23]. These learned descriptors are also transferable to other domains, such as
underwater image detection, which saves time and reduces labor relative to end-to-end network
training. Thus, researchers have recently begun to solve underwater classification problems using
pre-trained CNNs as feature extractors [24].
      For example, the authors in [25] applied extracted CNN attributes from a pre-trained VGGNet
first fully connected layer for coral reef classification. These authors trained a multilayer perceptron
(MLP) network with the extracted attributes using 4750 images in which 237,500 points had been
annotated by an expert. These images were a subset from the Benthoz15 dataset [26]; they were
divided into 70% training and 30% testing images. The model classified the images into coral and
noncoral, achieving 97% OA. In another study, Ammar et al. [27] combined VGGNet learned features
with hand-crafted features for coral reef classification using a two-layer MLP classifier to exploit the
diversity of the representation attributes, which included 4096 dimensional features extracted from a
fully connected layer of VGGNet and 540 dimensional color and texture descriptors [18]. The proposed
method was evaluated using 2055 images with 400.000 expert pixel annotations from the MLC dataset
labeled to four noncoral labels and five coral genera. This combination of features outperformed the
use of individual attributes with an average 3% increase in classification accuracy. Lian et al. [28]
combined fully connected features and convolutional features extracted from VGGNet network layers
in a coral classification process. The principal component analysis dimensionality reduction method
was used to compress these attributes, while the EFC dataset, consisting of 212 images with 42.400 point
annotations categorized into 10 classes, was used for model evaluation. Two-thirds of these samples
were used for training and one-third was used for testing. The authors achieved 91.4% OA using a
linear SVM algorithm. In a separate study [29], the authors introduced features extracted from deep
residual networks [12] for underwater classification using four benthic datasets (MLC, Benthoz15,
EILAT, and RSMAS). They showed that features extracted from deeper convolutional layers were
superior to those from shallower layers. Moreover, combining these features resulted in more powerful
image descriptors. Finally, Ammar et al. [24] tested the same deep residual network features for
recognizing kelp in underwater images; these features were found to outperform both CNNs and
hand-crafted features.
      Based on these collected studies, benthic cover recognition approaches using underwater images
can be placed into two categories, each of which has numerous disadvantages. The first approach
depends on classifying underwater images using manually labeled points in each image and
saved-in-state, off-the-shelf datasets; however, this approach is ill-suited to mapping large tracts
of coastline [30]. The second approach involves classifying underwater images individually based on
hand-crafted methods, which largely rely on human annotators; thus, this approach can be cumbersome
and inefficient [31]. The automatic classification of towed underwater images, therefore, remains
challenging and requires further innovative [31]. The classic alternative is to produce benthic habitat
maps of large-scale coastal areas from multispectral satellite images [32–34]. However, this process
requires sufficient ground truth data to train the classification algorithms every time a classification is
performed. Consequently, the classification of largely inaccessible benthic habitat is rare. Therefore,
it remains necessary to develop a benthic habitat mapping framework that can be applied to various
areas with reliable cost, speed, and accuracy [35]: This is the focus of the present study.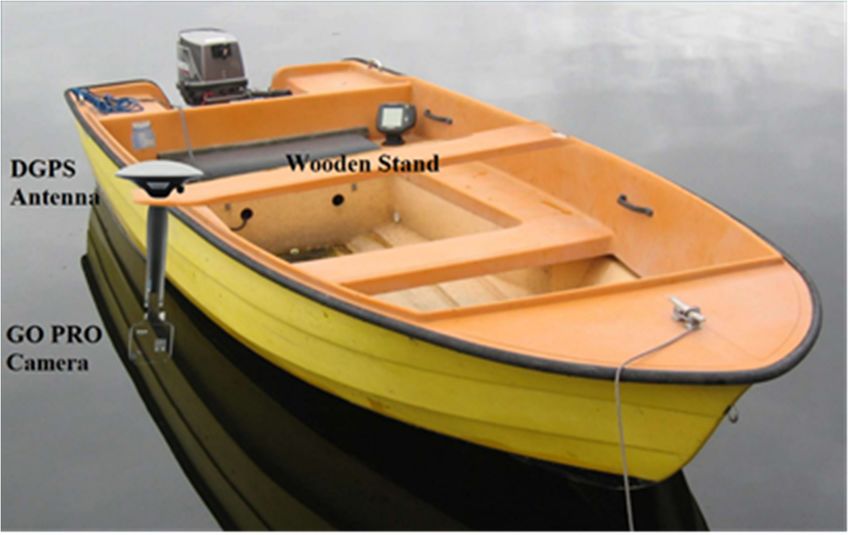
Remote Sens. 2020, 12, 4002                                                                                                   4 of 18

     Here, we present a semiautomated framework for benthic habitat and seagrass species detection
and mapping. Specifically, we investigated a combination of shape and CNN descriptors in an
underwater image detection process. Furthermore, we classified high-resolution satellite images for
benthic habitat mapping using CNNs with simple architectures. The main achievements described
here are summarized
     Remote Sens. 2020, 12, x as follows: (i) We combined CNN attributes, i.e., image features extracted  4 of 17 from
pre-trained CNNs, and BOF attributes to exploit their diversity; (ii) we demonstrated that our proposed
     benthic
method         habitat mapping
         outperforms                 usingand
                            single CNN     CNNsBOF with simple architectures.
                                                     algorithms               The main
                                                                 using two diverse     achievements
                                                                                    underwater  imagedescribed
                                                                                                         recognition
     here are summarized as follows: (i) We combined CNN attributes, i.e., image features extracted from
datasets; (iii) we exploited this combination to create ground truth samples for high-resolution satellite
     pre-trained CNNs, and BOF attributes to exploit their diversity; (ii) we demonstrated that our
image classification; and (iv) we used CNNs with simple architectures for benthic habitat and seagrass
     proposed method outperforms single CNN and BOF algorithms using two diverse underwater image
species  mapping and accomplished a superior classification accuracy relative to those produce by
     recognition datasets; (iii) we exploited this combination to create ground truth samples for high-
machine   learning
     resolution        algorithms.
                   satellite  image classification; and (iv) we used CNNs with simple architectures for benthic
      habitat and seagrass species mapping and accomplished a superior classification accuracy relative to
2. Materials and Methods
    those produce by machine learning algorithms.

2.1. Study Areas and Methods
      2. Materials
     Ishigaki Island, located in the south of Japan in the Pacific Ocean, was the overall study area
      2.1. Study Areas
chosen for this framework assessment (Figure 1). It is a subtropical island with abundant biodiversity,
            Ishigakiareas,
shallow coastal        Island,and
                                located    in the south
                                     a maximum            of Japan
                                                        water   depth  in the   Pacific
                                                                           of 3.5  m. Ocean,    was theareas
                                                                                        Two smaller       overall
                                                                                                                onstudy
                                                                                                                     either area
                                                                                                                               side of
      chosenwere
the island     for this  framework
                     selected          assessment
                                 to evaluate     the(Figure    1). It is aThe
                                                       framework:          subtropical
                                                                                Shirahoisland  witharea
                                                                                          coastal    abundant    biodiversity,
                                                                                                         and Fukido       cove area.
      shallow area
The Shiraho     coastalwasareas,  and a maximum
                             a heterogeneous           water depth
                                                    ecosystem       withof 3.5  m. Two smaller
                                                                            numerous             areasincluding
                                                                                         reefscapes,    on either side    of the hard
                                                                                                                    complex
      island were selected to evaluate the framework: The Shiraho coastal area and Fukido cove area. The
corals, such as Acropora and Porites, and soft corals, such as Heliopora coerulea. Furthermore, a wide
      Shiraho area was a heterogeneous ecosystem with numerous reefscapes, including complex hard
rangecorals,
        of sediments       exists along the coastline (e.g., soft sand, cobble, and boulders), as well as both
              such as Acropora and Porites, and soft corals, such as Heliopora coerulea. Furthermore, a wide
brown    andofother
      range             algae.exists
                 sediments       Moreover,
                                       along thea dense    Thalassia
                                                   coastline   (e.g., softhemprichii   seagrass
                                                                             sand, cobble,        grows onas
                                                                                            and boulders),     the sandy-bottom
                                                                                                                 well  as both
seafloor.   The   Fukido     area   is a  seagrass     bed  with    turbid     waters   located  in  a
      brown and other algae. Moreover, a dense Thalassia hemprichii seagrass grows on the sandy-bottom tidal  flat with    sand, silt,
and clay    bottom
      seafloor.         coverage
                 The Fukido      areanear    the mouth
                                       is a seagrass    bed of
                                                            withtheturbid
                                                                       Fukido     River.
                                                                              waters       A T.
                                                                                      located in hemprichii    seagrass
                                                                                                 a tidal flat with  sand, meadow
                                                                                                                             silt,
dominates
      and claythebottom
                   area: Leaves
                            coverageare near8–15
                                               thecm    high,ofand
                                                    mouth        the seagrass     extends
                                                                       Fukido River.     A T.along  the shoreline
                                                                                              hemprichii              (300 m wide
                                                                                                          seagrass meadow
      dominates
and 1000            the area:
             m long).          Leaves arelong
                           In addition,       8–15 leaves
                                                    cm high,ofand     seagrass
                                                                Enhalus          extendsseagrass
                                                                              acoroides   along thewith
                                                                                                      shoreline
                                                                                                           30–150(300cmm wide
                                                                                                                           in length,
      and   1000  m   long).  In  addition,   long   leaves of  Enhalus     acoroides  seagrass with   30–150
which is classified as vulnerable species, have been found in the Fukido area [36]. The seagrasses in the       cm  in  length,
      which is classified as vulnerable species, have been found in the Fukido area [36]. The seagrasses in
Fukido    area can, therefore, be placed into 4 categories: E. acoroides, tall T. hemprichii, short T. hemprichii,
      the Fukido area can, therefore, be placed into 4 categories: E. acoroides, tall T. hemprichii, short T.
and areas in which seagrass are sparse (Figure 2).
      hemprichii, and areas in which seagrass are sparse (Figure 2).

          Figure
      Figure  1. 1.Location
                    Location of
                             ofShiraho
                                Shirahoandand
                                           Fukido study study
                                               Fukido   areas inareas
                                                                Ishigaki
                                                                      inIsland, JapanIsland,
                                                                          Ishigaki     (Esri,USGS, Open
                                                                                               Japan    Street
                                                                                                     (Esri,  USGS,
      Openmaps).
            Street maps).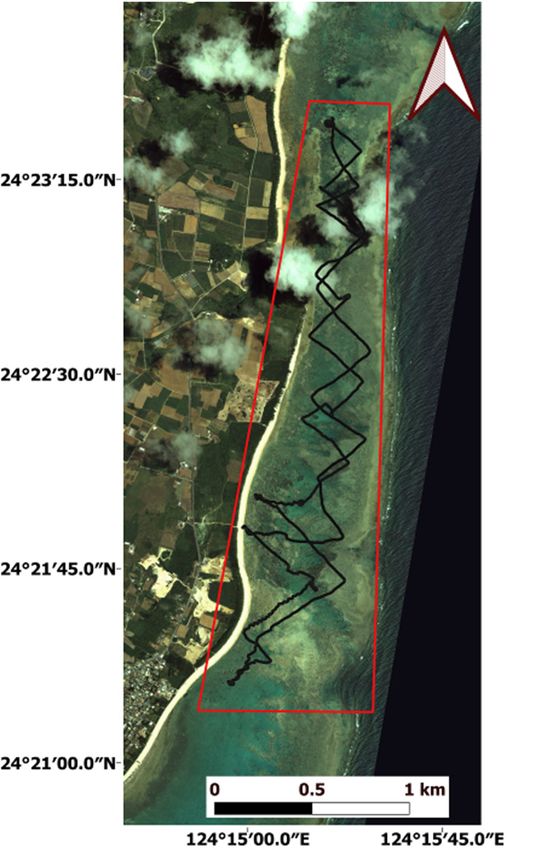
Remote Sens.
Remote Sens. 2020, 12, 4002
2020, 12, x 55 of
of 17
18
(a) (b) (c) (d)
(e) (f) (g) (h)
(i) (j) (k)
Figure
Figure 2.
2. Examples
Examples of of towed
towed images
images that
that were
were used
used for
for benthic
benthic habitats
habitats and
and seagrass
seagrass identification.
identification.
(a)
(a) Corals,
Corals, (b)
(b)blue
bluecorals,
corals,(c)(c)
soft sand,
soft (d) (d)
sand, sediments, (e) brown
sediments, algae,algae,
(e) brown (f) algae, (g) seagrass,
(f) algae, (h) E.
(g) seagrass,
acoroides, (i) tall(i)
(h) E. acoroides, T. tall
hemprichii, (j) small
T. hemprichii, T. hemprichii,
(j) small (k) seagrass
T. hemprichii, sparsesparse
(k) seagrass areas.areas.
2.2. Field
2.2. Field Data
Data Collection
Collection
Field data
Field data from
from the
the Shiraho
Shiraho benthic
benthic habitats
habitats and
and Fukido
Fukido seagrass
seagrass species
species were
were collected
collected during
during
the typhoon season on 21 and 28 August 2016, respectively. Moreover, the
the typhoon season on 21 and 28 August 2016, respectively. Moreover, the rainfall acquired prior rainfall acquired prior
to
to the data acquisition times increased the outflows from the major tributaries,
the data acquisition times increased the outflows from the major tributaries, Todoroki River for Todoroki River for
Shiraho reef
Shiraho reef and
and Fukido
Fukido River
River for
for Fukido
Fukido cove. However, the
cove. However, the turbidity
turbidity level
level was
was higher
higher inin Fukido
Fukido
cove than the Shiraho area. The Fukido cove muddy substrate and that it is near
cove than the Shiraho area. The Fukido cove muddy substrate and that it is near to the Fukido River to the Fukido River
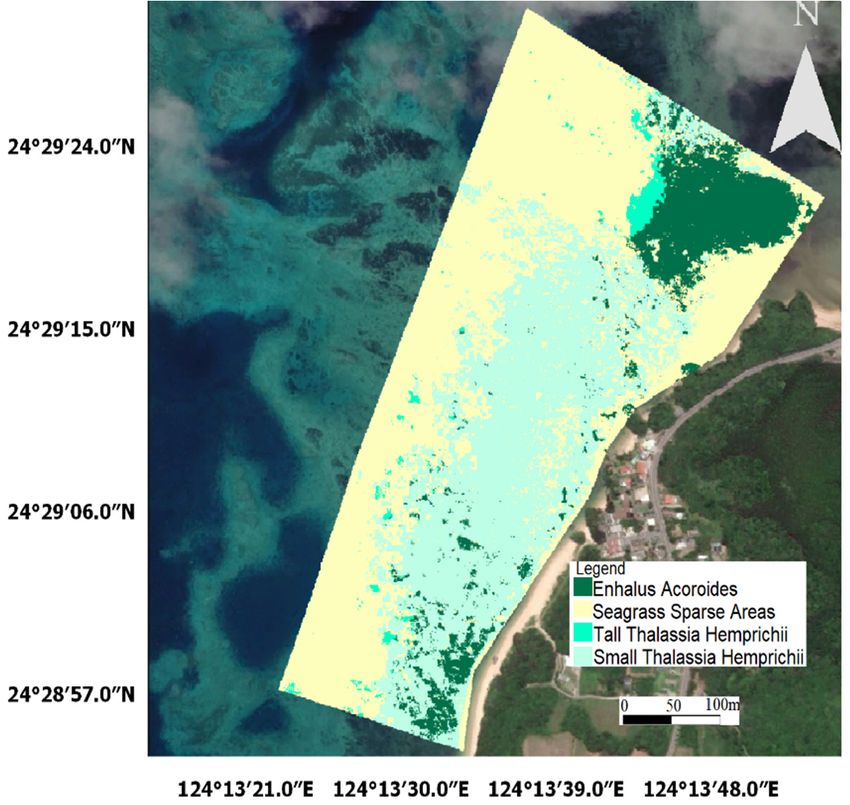
mouth explain the high turbidity level. Two field surveys were performed
mouth explain the high turbidity level. Two field surveys were performed to collect underwater to collect underwater
images using
images using aa high-resolution
high-resolution towed
towed video
video camera
camera (GoPro
(GoPro HERO3
HERO3 Black
Black Edition)
Edition) [37]
[37] (Figure
(Figure 3),
3),
which was attached with a wooden stand to a motorboat side, thus that it was placed
which was attached with a wooden stand to a motorboat side, thus that it was placed directly beneath directly beneath
the water
the water surface.
surface. In In addition,
addition, the
the coordinates
coordinates of of the
the surveyed
surveyed underwater
underwater images
images werewere recorded
recorded
using a differential global positioning system (DGPS) mounted vertically above
using a differential global positioning system (DGPS) mounted vertically above the camera (Figure the camera (Figure 4).
At each site, about 4 h of recordings were collected; these were then converted
4). At each site, about 4 h of recordings were collected; these were then converted to underwater to underwater images
using free
images video-to-image
using converter converter
free video-to-image software. The extracted
software. Theimages had images
extracted 1 secondhad time1 intervals that
second time
were synchronized with the DGPS observations. Finally, 3000 benthic habitat
intervals that were synchronized with the DGPS observations. Finally, 3000 benthic habitat images images were labeled as
7 classes, while 1500 seagrass images were labeled as 4 categories. The images
were labeled as 7 classes, while 1500 seagrass images were labeled as 4 categories. The images werewere labeled manually
to construct
labeled benthic
manually to habitat-
constructand seagrass
benthic species-detection
habitat- and seagrass schemes.
species-detection schemes.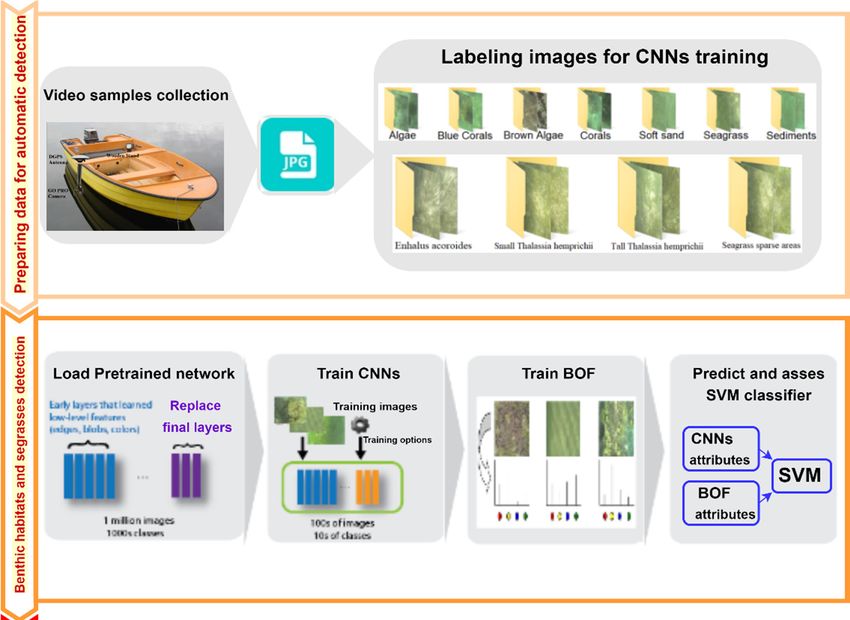
Remote
Remote Sens. 2020, 12,
Sens. 2020, 12, 4002
x 66 of
of 17
18
Remote Sens. 2020, 12, x 6 of 17
(a) (b)
(a) (b)
Figure 3. The field surveys in Ishigaki Island, Japan: (a) Shiraho area over Quickbird satellite imagery (b)
3. The field
Figure 3. field surveys
surveys in
in Ishigaki
Ishigaki Island,
Island,Japan:
Japan: (a)
(a) Shiraho
Shiraho area
areaover
overQuickbird
Quickbirdsatellite
satelliteimagery
imagery (b)
Fukido cove over Geoeye-1 satellite imagery.
Fukido cove over Geoeye-1 satellite imagery.
(b) Fukido cove over Geoeye-1 satellite imagery.
Figure 4. An illustration of the towed camera and the differential global positioning system (DGPS)
Figure 4.
Figure 4. An
An illustration
illustration of
of the
the towed
towed camera
camera and
and the
the differential
differential global
global positioning
positioning system
system (DGPS)
(DGPS)
positions on the motorboat.
positions on
positions on the
the motorboat.
motorboat.
2.3.
2.3. Satellite
Satellite Data
Data
2.3. Satellite Data
Two
Two high-resolution satellite
satellite images were were used for
for benthic habitat
habitat and seagrass
seagrass mapping at at the
Two high-resolution
high-resolution satellite images images were usedused for benthic
benthic habitat and
and seagrass mapping
mapping at thethe
22 study
study areas:
areas: A A Quickbird
Quickbird satellite
satellite image
image forfor the
the Shiraho
Shiraho area
area and
and aa Geoeye-1
Geoeye-1 satellite
satellite image
image for
2 study areas: A Quickbird satellite image for the Shiraho area and a Geoeye-1 satellite image for for
Fukido
Fukido covewith
cove with0.6
0.6
m m and
and 0.5 0.5
m m spatial
spatial resolutions,
resolutions, respectively.
respectively. Both Both platforms
platforms had thehad
same the same
number
Fukido cove with 0.6 m and 0.5 m spatial resolutions, respectively. Both platforms had the same
number
of bands,of bands, i.e., one panchromatic
band and band and red,
andgreen, and blue multispectral
bands. Thebands. The
number ofi.e., one panchromatic
bands, i.e., one panchromatic red, green,
band and red, blue multispectral
green, and blue multispectral Quickbird
bands. The
Quickbird
image image
was acquired was acquired
onacquired on
20 July 2007, 20 July
and 2007,
the2007, and
Geoeye-1 the Geoeye-1
image image
was acquired was acquired
on the on
23 June on the
2017. 23 June
Quickbird image was on 20 July and the Geoeye-1 image was acquired theOn
23 both
June
2017.
dates, On
theboth
weather dates,
wasthe weather
calm, was calm,
and cloud and cloud
coverage coverage wasthere
low. Although
a time there was a time
2017. On both dates, the weather was calm, and was
cloudlow. Although
coverage was low.wasAlthough gap between
there the
was a time
gap between
satellite imagethe the satellite
collection image collection and field data surveys, neither study area experienced
gap between satelliteand
imagefieldcollection
data surveys, neither
and field study
data area experienced
surveys, neither study significant changes
area experienced
significant changes during this time [38]. A radiometric calibration process was performed for both
significant changes during this time [38]. A radiometric calibration process was performed for both
images using the values presented in the images metadata files.
images using the values presented in the images metadata files.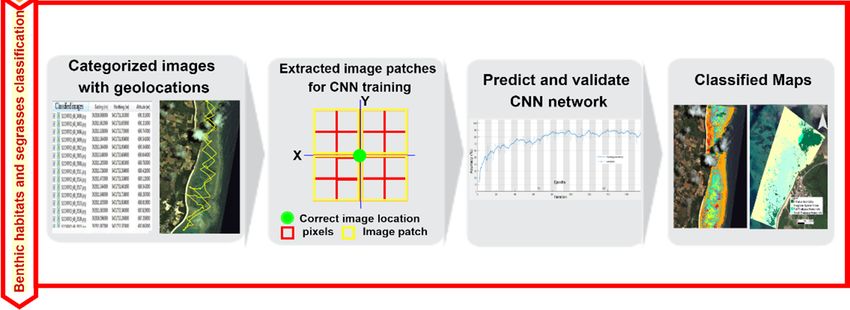
Remote Sens. 2020, 12, 4002                                                                           7 of 18

during this time [38]. A radiometric calibration process was performed for both images using the
values presented in the images metadata files.

2.4. Methodology
     The framework proposed in this study has 2 successive processes. First, benthic habitats and
seagrasses were detected by SVM [39,40] classifier using attributes extracted from pre-trained CNNs and
a BOF [41,42] approach. Second, the correctly detected images were used as field samples for training
a CNN with a simple architecture in order to map benthic habitats and seagrasses. These processes
were conducted in the MATLAB environment.

2.4.1. Benthic Habitat and Seagrass Detection
     Detection of benthic cover and seagrass species in each study area was established using the
following steps:

1.    For the Shiraho area, 7 benthic cover categories were labeled individually by a human annotator
      using 3000 underwater images: T. hemprichii seagrass, soft sand, hard sediments (pebbles, cobbles,
      and boulders), brown algae, other algae, corals (Acropora and Porites), and blue corals (H. coerulea).
2.    For Fukido cove, 4 seagrass categories were also labeled as E. acoroides, tall T. hemprichii,
      short T. hemprichii, and seagrass sparse areas using 1500 underwater images.
3.    All these labeled georeferenced images were used as inputs for the pre-trained VGG16 CNN and
      BOF approach in order to create the descriptors for use in the semiautomatic recognition process.
4.    Extracted attributes from the fully connected layer (FC6) of the VGG16 CNN and BOF approach
      were used as the inputs for training the SVM classifier; the outputs were image labels.
5.    Validation of the SVM classifier was conducted using 75% randomly-sampled independent
      images for training and 25% for testing.
6.    More images were categorized using the validated SVM classifier and checked individually.

     For benthic habitat and seagrass species categorization, 4096 descriptors were extracted from the
input images using the fully connected layer (FC6) of VGG16 CNN. In addition, 250 BOF attributes
were extracted with a block width of 32, grid step of 16, the strongest feature percentage from each
category set to 80%, and by using the grid point selection method. Subsequently, the SVM classifier
with the third-order polynomial kernel function was used for the categorization process.

2.4.2. Benthic Habitat and Seagrass Mapping
    Correctly categorized underwater images were used as ground truth samples for benthic cover
and seagrass species mapping as follows:

1.    A number of image patches were extracted around each correctly categorized image location
      with 2 pixel dimensions in horizontal and vertical directions.
2.    The image patch size was 2 × 2 × 3 pixels; 1500 image patches were each extracted from the
      Quickbird imagery for benthic habitat mapping and the Geoeye-1 imagery for seagrasses mapping.
3.    These image patches were used as inputs for evaluating CNNs with a simple architecture for
      benthic habitat and seagrass mapping; they were divided into 75% training images and 25%
      testing images.
4.    Benthic habitat and seagrass mapping was performed by the trained CNNs using high-resolution
      satellite images.

     The proposed CNN for benthic habitat and seagrass species mapping had 7 layers (Figure 5);
the classification layer number was 7 for benthic habitat mapping and 4 for seagrasses mapping.
The results of the CNN were obtained using a stochastic gradient descent optimizer with an initial
learning rate of 0.0001. Finally, the highest classification accuracy was achieved for benthic habitats using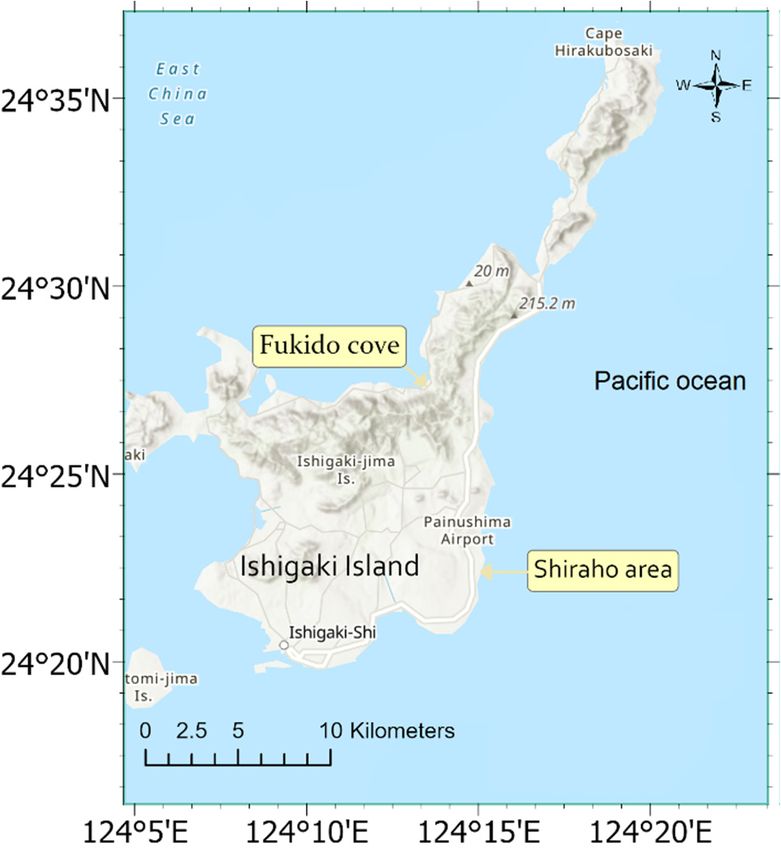
Remote Sens. 2020, 12, 4002                                                                                        8 of 18

a maximum of 25 epochs and 7 iterations per epoch; for seagrass species classification, classification
accuracy was maximized using at most 65 epochs and 2 iterations per epoch. The methodology steps
for benthic habitat and seagrass recognition and mapping are shown in Figure 6.
Remote Sens. 2020, 12, x                                                                         8 of 17

      Remote Sens. 2020, 12, x                                                                               8 of 17

      Figure 5.
              5. The proposed
                      proposed convolutional
                                convolutional neural    network (CNN)  architecture   for benthic
                                                                                          benthic habitats
                                                                                                   habitats and
                                                                                                            and
           FigureThe
      Figure       5. The proposed convolutionalneural
                                                 neural network  (CNN)architecture
                                                        network (CNN)  architectureforfor
                                                                                       benthic habitats and
      seagrass spices
      seagrass  spices mapping.
                       mapping.
            seagrass spices mapping.

           Figure
      Figure       6. Flowchart
             6. Flowchart       of the
                            of the     methodologyused
                                    methodology    used in
                                                         in this
                                                            this study
                                                                 studyfor
                                                                       forbenthic
                                                                           benthichabitats andand
                                                                                    habitats   seagrass species
                                                                                                  seagrass  species
           detection and mapping.
      detection and mapping.
      3. Results
      Figure 6. Flowchart of the methodology used in this study for benthic habitats and seagrass species
      detection and mapping.
      3.1. Benthic Habitat and Seagrass Detection

3. Results

3.1. Benthic Habitat and Seagrass Detection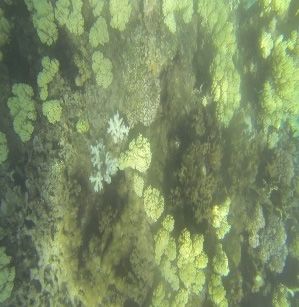
Remote Sens. 2020, 12, 4002 9 of 18
3. Results
Remote Sens. 2020, 12, x 9 of 17
3.1. Benthic Habitat and Seagrass Detection
The overall accuracies for each benthic habitat and seagrass species categorized from the SVM
classifier using BOF and VGG16 attributes are shown in Figures 7 and 8, respectively.
respectively. In addition,
Tables 1–3 summarizes the corresponding
Tables 1–3 summarizes the corresponding recognition OA and kappa values for each of the tested
tested
methods. Furthermore, Tables
Tables 2–4
2–4 present
present the
the confusion
confusion matrices
matrices for the detection of benthic habitats
and seagrass species using the BOF
BOF and
and VGG16
VGG16 descriptors
descriptors along
along with
with the
the SVM
SVM classifier.
classifier.
resulted detection
Figure 7. The resulted detection overall
overallaccuracy
accuracy(OA)
(OA)ofofeach
eachbenthic
benthichabitat
habitatofofallalltested
testedmethods
methods forfor
Shirahoarea.
Shiraho area. AL:
AL: Algae,
Algae,BA:
BA:Brown
BrownAlgae,
Algae,CO:
CO:Corals,
Corals,BC:
BC:Blue
BlueCorals,
Corals,SD:
SD:Sediments,
Sediments,SS: SS:Soft
SoftSand,
Sand,
and SG:
and SG: Seagrass.
Seagrass.
Table 1. The overall accuracy (OA) and Kappa results of all tested methods for benthic habitat detection
Table 1. The overall accuracy (OA) and Kappa results of all tested methods for benthic habitat
for the Shiraho area.
detection for the Shiraho area.
Methodology
Methodology BOF VGG16
BOF VGG16 VGG16&RES50
VGG16&RES50 BOF&VGG16
BOF&VGG16
OA%
OA% 85.2
85.2 87.5
87.5 89.9
89.9 91.5
91.5
Kappa
Kappa 0.82
0.82 0.85
0.85 0.88
0.88 0.90
0.90
Table 2.2. The
Table The resulted
resulted confusion
confusion matrix
matrix for
for benthic
benthic habitat
habitat detection
detection using
using BOF&VGG16
BOF&VGG16 descriptors
descriptors
and
and SVM
SVM classifier.
classifier. UA:
UA: User
User Accuracy,
Accuracy,PA:
PA:Producer
ProducerAccuracy.
Accuracy.
Predicted Validated Class
Validated Class Row.
Predicted Class Row. Total UA
UA
Class AL AL BA BA CO CO BC
BC SDSD SS SS SG SG Total
ALAL 128 128 4 4 22 11 11 0 0 1 1 137
137 0.93
0.93
BABA 3 3 47 47 00 00 00 0 0 0 0 5050 0.94
0.94
COCO 4 4 0 0 131131 44 33 0 0 0 0 142
142 0.92
0.92
BCBC 4 4
2 2 6 6 31
31 2
2 0
0 1
1 46
46 0.67
0.67
SD 4 0 1 1 128 2 1 137 0.93
SD SS 4 0 0 0 10 10 128
7 43 2 0 1 137
50 0.93
0.86
SS SG 0 6 0 0 00 00 47 0 43 178 0 18850 0.86
0.95
SG Total 6
Col. 149 0 53 0140 0
37 1454 45 0 181 178 188= 91.5%0.95
OA
PA
Col. Total 149 0.86 53 0.89 0.94
140 0.84
37 0.88
145 0.9645 0.98 181 KappaOA val.= = 0.90
91.5%
PA 0.86 0.89 0.94 0.84 0.88 0.96 0.98 Kappa val. = 0.90
Figure 8. The resulted overall accuracy of each seagrass species of all tested methods for Fukido area.
SSA: Seagrass sparse areas, STH: Tall T. hemprichii, TTH: Small T. hemprichii, and EA: E. acoroides.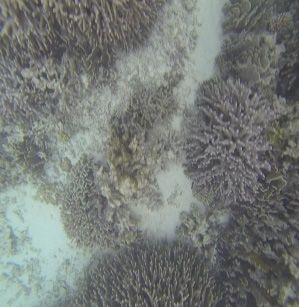
BC            4      2         6         31        2         0         1        46       0.67
            SD            4       0        1          1       128         2        1        137      0.93
             SS           0      0         0          0        7         43        0        50       0.86
            SG           6       0         0         0         4         0        178       188      0.95
       Col.2020,
Remote Sens.  Total     149
                 12, 4002        53       140        37       145        45       181        OA = 91.5% 10 of 18
           PA          0.86     0.89      0.94      0.84      0.88      0.96      0.98     Kappa val. = 0.90

     Figure 8. The
               The resulted
                   resulted overall
                            overall accuracy
                                    accuracy ofof each
                                                  each seagrass
                                                       seagrass species
                                                                species of
                                                                        of all
                                                                           all tested
                                                                                tested methods
                                                                                       methods for
                                                                                                for Fukido
                                                                                                    Fukido area.
                                                                                                             area.
     SSA: Seagrass sparse areas, STH: Tall
                                       Tall T.
                                            T.hemprichii,
                                                hemprichii,TTH:
                                                            TTH:Small
                                                                  SmallT.T.hemprichii,
                                                                            hemprichii,andandEA:
                                                                                              EA:E.E.acoroides.
                                                                                                      acoroides.
  Remote Sens. 2020, 12, x                                                                                   10 of 17
     Table 3. The overall accuracy (OA) and Kappa results of all tested methods for seagrass species
     detection
       Table 3.for
                Thetheoverall
                       Fukidoaccuracy
                               area. (OA) and Kappa results of all tested methods for seagrass species
       detection for the Fukido area.
                    Methodology       BOF    VGG16      VGG16&RES50 BOF&VGG16
                       Methodology
                         OA%           BOF
                                        84.0     VGG16
                                                    86.0   VGG16&RES50
                                                                  87.7           BOF&VGG16
                                                                                      90.4
                          OA%
                         Kappa         84.0
                                        0.77      86.0
                                                    0.80       87.7
                                                                  0.83              90.4
                                                                                      0.86
                         Kappa         0.77       0.80         0.83                 0.86
     Table 4. The resulted confusion matrix for seagrass species detection using BOF&VGG16 descriptors
       Table
     and SVM4.classifier.
                The resulted
                          UA:confusion matrix for
                              User Accuracy,  PA:seagrass
                                                  Producerspecies detection using BOF&VGG16 descriptors
                                                            Accuracy.
       and SVM classifier. UA: User Accuracy, PA: Producer Accuracy.
                                               Validated Class
                  Predicted
              Predicted Class          Validated Class                          Row. Total   UA
                                     EA        TTH        STH         Row. Total
                                                                     SSA                 UA
                        Class     EA      TTH STH             SSA
                      EA EA        85 85 0       0 2          22          2 89     89 0.96 0.96
                     TTH                0       131            3          4       138          0.95
                       TTH         0       131      3            4          138        0.95
                     STH               4         4            98         0        106          0.93
                     SSASTH         4 0     4    1 98         160        25 106    42 0.93 0.60
                   Col. SSA
                        Total       0 89 1 136 16            11925       31 42     OA =0.60
                                                                                        90.4%
                    Col.
                      PATotal      89 0.96 136 0.87119          31
                                                             0.82                90.4% val. = 0.86
                                                                        0.81 OA =Kappa
                         PA       0.96     0.87    0.82       0.81         Kappa val. = 0.86
3.2. Benthic Habitat and Seagrass Mapping
  3.2. Benthic Habitat and Seagrass Mapping
     The training and validation accuracy progress of the proposed CNN for the Shiraho benthic habitats
        The training and validation accuracy progress of the proposed CNN for the Shiraho benthic
and Fukido seagrass species is shown in Figures 9 and 10, respectively. In addition, Tables 5 and 6
  habitats and Fukido seagrass species is shown in Figures 9 and 10, respectively. In addition, Tables 5
show the resultant confusion matrices from benthic habitat and seagrass species classification using
  and 6 show the resultant confusion matrices from benthic habitat and seagrass species classification
the proposed CNN. Finally, the resultant classified maps for the Shiraho benthic habitats and Fukido
  using the proposed CNN. Finally, the resultant classified maps for the Shiraho benthic habitats and
seagrass species are presented in Figure 11.
  Fukido seagrass species are presented in Figure 11.

       Figure
     Figure 9.9.The
                 Thetraining
                      trainingand
                               andvalidation
                                  validation accuracy
                                             accuracy progress
                                                      progress of
                                                               ofthe
                                                                  theproposed
                                                                      proposedCNN
                                                                               CNNfor
                                                                                   forShiraho
                                                                                       Shirahoarea benthic
                                                                                                area benthic
       habitats classification.
     habitats classification.
Remote Sens. 2020, 12, 4002 11 of 18
Remote Sens. 2020, 12, x 11 of 17
Figure 10.
Figure 10. The
The training
training and
and validation
validation accuracy
accuracy progress of the
progress of the proposed
proposed CNN
CNN for
for Fukido
Fukido cove
cove
seagrasses classification.
seagrasses classification.
Table
Table 5. Theresulted
5. The resultedconfusion
confusion matrix
matrix forfor benthic
benthic habitat
habitat classification
classification using
using proposed
proposed CNN.CNN.
UA:
UA: User Accuracy, PA: Producer Accuracy.
User Accuracy, PA: Producer Accuracy.
Predicted Validated Class
Validated Class Row.
Predicted Class Row. Total UAUA
Class SG SG SS SS AL AL CO
CO BCBC BABA SD SD Total
SGSG 37 37 0 0 22 00 13
0 0
13 1 1 5353 0.70
0.70
SSSS 0 0 52 52 22 00 00
0 0 0 0 5454 0.96
0.96
ALAL 0 0 5 5 4949 00 00
0 0 0 0 5454 0.91
0.91
CO 0 0 0 48 3
2 0 53 0.91
CO 0 0 0 48 32 0 53 0.91
BC 3 0 0 2 049 0 54 0.91
BCBA 3 0 0 0 00 21 1
50490 1 0 5354 0.91
0.94
BASD 0 0 0 0 00 10 21
0 50 52 1 5453 0.94
0.96
SDTotal
Col. 0 40 0 57 0 53 0
51 682
52 0 54 52 54 = 89.9%0.96
OA
PA
Col. Total 40 0.93 570.91 53
0.92 0.94
51 0.72
0.9652 0.96 54 Kappa
68 OAval. = 0.88
= 89.9%
Kappa val. =
PA 0.93 0.91 0.92 0.94 0.72 0.96 0.96
Table 6. The resulted confusion matrix for seagrass spices classification using proposed CNN.
0.88
UA: User Accuracy, PA: Producer Accuracy.
Table 6. The resulted confusion matrix for seagrass spices classification using proposed CNN. UA:
Validated Class
User Accuracy, PA:
Predicted Producer Accuracy.
Class Row. Total UA
TTH SSA EA STH
Predicte Validated Class 0
TTH 84 3 7
Row. Total 94 UA 0.89
d SSA
Class TTH 0 SSA 80EA STH
10 3 93 0.86
EA
TTH 84 0 3 20 887 4 94 94 0.89 0.94
STH
SSA 0 4 80 0 10 03 90 93 94 0.86 0.96
Col. Total 88 85 91 111 OA = 91.2%
EA 0 2 88 4 94 0.94
PA 0.95 0.94 0.97 0.81 Kappa val. = 0.88
STH 4 0 0 90 94 0.96
Col.
88 85 91 111 OA = 91.2%
Total
PA 0.95 0.94 0.97 0.81 Kappa val. = 0.88Remote Sens.
Remote Sens. 2020,
2020, 12,
12, 4002
x 12 of
12 of 17
18
(a) (b)
Figure 11. The resulted CNNs classified maps in Ishigaki Island, Japan: (a) Shiraho area benthic habitats
Figure 11. The resulted CNNs classified maps in Ishigaki Island, Japan: (a) Shiraho area benthic
map (b) Fukido cove seagrasses maps.
habitats map (b) Fukido cove seagrasses maps.
4.
4. Discussion
Discussion
The use of towed cameras with motorboats to survey benthic habitats has allowed scientists to
investigate larger areas than could be assessed by traditional SCUBA diving. However, However, the the efficiency
efficiency
of image collection is in contrast to the inefficiency of data data processing
processing in in ecosystem
ecosystem analysis:
analysis: Image
classification
classification isisusually
usuallyperformed
performedmanually
manually byby marine
marine experts,
experts, which
which is time-consuming
is time-consuming andand
costlycostly
[24].
As a result, developing an automated analysis of underwater images is essential if the advantagesthe
[24]. As a result, developing an automated analysis of underwater images is essential if of
advantages of remote
remote surveying surveying
technologies aretechnologies
to be exploited. are toIn be
theexploited. In the
present study, wepresent
proposedstudy, we proposed
a semiautomated
aframework
semiautomated framework
for benthic cover and forseagrass
benthicspecies
cover and seagrass
detection and species
mappingdetection
using CNNs.and mapping
Our frameworkusing
CNNs. Our framework provides alternative solutions for the recognition
provides alternative solutions for the recognition and mapping of benthic habitats and seagrasses and mapping of benthic
habitats andand
worldwide seagrasses worldwide
could ultimately and could
support ultimately support
the conservation of thesethe conservation
important of these important
ecosystems.
ecosystems.
For benthic habitats and seagrass species detection, numerous layers from various CNNs with
For benthic
different habitats
architectures, and seagrass
including FC7 andspecies
FC8detection,
layers from numerous
VGG19 layers from various
or AlexNet, CNNs with
and loss3-classifier
different
layer from architectures,
GoogleNet, including
were tested FC7for and
allFC8 layers classes,
detection from VGG19but theseor AlexNet,
yielded and loss3-classifier
relatively low OA
layer from GoogleNet, were tested for all detection classes, but these
values. Indeed, the FC6 layer from VGG16 and the FC1000 layer from Resnet50 produced significantly yielded relatively low OA
values. Indeed,
better results thanthe FC6CNNs
these layerlayers
fromwhen VGG16 usedand the FC1000
to recognize layerhabitats
benthic from Resnet50
and seagrass produced
spices.
significantly
Furthermore,better variousresults than these
additional CNNswere
attributes layers whensuch
tested usedastothe recognize benthic habitats
Hue Saturation Value (HSV) and
seagrass spices. Furthermore, various additional attributes were tested
color descriptors and the Gray Level Co-occurrence Matrix (GLCM) texture descriptors. However, such as the Hue Saturation
Value (HSV) coloryielded
these descriptors descriptors and the lower
significantly Gray Level
OA, and Co-occurrence
their addition Matrix
to the(GLCM)
BOF andtexture
VGG 16 descriptors.
attributes
However, these descriptors yielded significantly lower OA, and their addition
did not improve the resulted overall detection accuracy. We also applied principal components analysis to the BOF and VGG
16 attributes did not improve the resulted overall detection accuracy. We
in our study to remove redundant features; however, this reduced the OA in all experiments. Moreover, also applied principal
components
the powerfulanalysis in our
and generic study to
features remove redundant
extracted from CNNsfeatures; however,
have already shownthissuperior
reduced performance
the OA in all
experiments. Moreover, the powerful and generic features extracted from CNNs
over BOF features [43] and conventional hand-crafted features [27,44]. In addition, various classifiers, have already shown
superior performance
such as Bagging over BOFneighbor,
trees, K-nearest featuresand [43]neural
and conventional
network, werehand-crafted featureshabitats
assessed for benthic [27,44].andIn
addition, various classifiers, such as Bagging trees, K-nearest neighbor,
seagrasses detection but yielded lower OA results. On the other hand, SVM produced the highest OA and neural network, were
assessed for benthic
for all benthic habitats
cover and and seagrasses
seagrasses detection but
species’ classification yielded to
compared lower OA results.
all tested On the other
classifiers.
hand, SVM produced the highest OA for all benthic cover and seagrasses species’ classification
compared to all tested classifiers.Remote Sens. 2020, 12, 4002 13 of 18
In the majority of benthic images, blue corals and corals were in the same location, while sediments
and soft sand were mixed, all of which confused all classifiers. Furthermore, distinguishing between
sparse seagrass areas and short T. hemprichii areas was the most challenging part of seagrass detection.
Considering the poor quality of the towed images, water turbidity, and the mix of substrates in the
studied areas, the resultant OAs can be considered reliable for both benthic habitats and seagrass
species detection. Thus, we have demonstrated that transfer learning with pre-trained VGG16 networks
combined with BOF significantly improves the detection of seagrass meadows and benthic habitats at
various locations.
Previous studies have presented various techniques for benthic cover and seagrass mapping.
For instance, several studies have demonstrated the effectiveness of an object-based image analysis
approach for seabed mapping using high-resolution satellite images [45–47]. These studies reported
accuracies of 61.6% (9 classes) [45], 82.0% (11 classes) [46], and 92% (4 classes) [47] for mapping benthic
habitats using Quickbird-2, Planet Dove, and Worldview-2, respectively. Other studies have integrated
bathymetry data with Worldview-2 sensor bands as inputs for machine learning classifiers [35,48].
Consequently, Luis et al. [48] achieved 89.5% for classifying seven classes using a maximum likelihood
classifier, whereas Pramaditya et al. [35] reached a maximum OA of 88.5% for 14 classes using a random
forest classifier. Alternative studies proposed unsupervised classification of high-resolution satellite
images and labeling classes based on field observations for seabed mapping [2,49,50]. These studies
showed that unsupervised classification labeled with field data achieved overall accuracies comparable
to those produced by machine learning classifiers. However, all of these studies used field samples
extracted manually with small sample sizes, which involved substantial labor and processing time.
Moreover, unsupervised approaches require adequate field samples for validation and calibration.
Our proposed semiautomated framework can overcome such problems to create field samples
automatically for subsequent benthic habitat and seagrass mapping.
After several experiments, we conclude that the best patch size is 2 × 2 × 3 pixels for benthic habitat
and seagrass mapping. Additionally, the optimum CNN models have the architecture illustrated
in Figure 5. However, the proposed CNN became confused between short and tall T. hemprichii in
some areas. Moreover, discriminating sparse seagrass areas from specific seagrass species, especially
E. acoroides, was also a challenging task. E. acoroides leaves are generally located in submerged areas;
they are usually projected vertically and do not lie flat on the substrate. As a result, E. acoroides is
difficult to classify by remote sensing methods [51]. In benthic habitats, the seagrass areas had the
lowest overall classification accuracy as they were misclassified with blue coral areas and other classes.
However, other classes were classified with significantly higher overall accuracies and our benthic
habitat mapping results were superior to those of similar studies that used high-resolution satellite
images for large-scale mapping of the seabed. It must be noted that it is difficult to compare our
accuracies with those of previous studies due to differences in the satellite sensors used, water turbidity,
and diversity of substrate.
In general, seagrasses are vital blue carbon ecosystems that are suffering from global decline [51,52];
however, these declines are not well-documented in tropical regions [53]. This global decline
is a consequence of human activities, causing seagrass degradation through eutrophication and
sedimentation [54]. Thus, obtaining seagrass species distributions and percentage coverage is vital for
developing protection and monitoring systems of these threatened areas. However, applying optical
remote sensing techniques for the large-scale mapping of seagrasses is challenging [55] for many
reasons. First, seagrasses usually grow in turbid waters, and the signal to noise ratio of the processed
images is exceptionally low. Second, seagrass meadows show significant seasonal variation and are
frequently moved by waves and currents. Third, seagrass areas are usually heterogeneous with mixed
seagrass species.
While high-resolution satellite images are generally available, reliable seagrass labeling and
mapping using machine learning algorithms is usually difficult for the reasons mentioned above.
Nevertheless, recent studies have tested machine learning algorithms for seagrass mapping.Remote Sens. 2020, 12, 4002 14 of 18
For instance, Eva et al. [56] compared WorldView-3, Ziyuan-3A, Sentinel-2, and Landsat 8 sensors for
mapping of seagrass meadows in shallow waters, all of which were suitable for seagrass mapping.
Moreover, an object-based image analysis model classified five seagrass species with 69% maximum OA
using WorldView-3 imagery. Pramaditya and Wahyu [55] showed that a classification trees algorithm
outperforms SVM and maximum likelihood for seagrass species mapping using PlanetScope satellite
image; the classification trees algorithm classified five seagrass meadows with 74% OA. Nam et al. [57]
compared ensemble machine learning algorithms for seagrass monitoring using data from Sentinel–2
imagery; they demonstrated the effectiveness of a rotation forests ensemble for classifying dense and
sparse seagrass areas with 88% OA. On the other hand, Daniel et al. [58] proposed deep capsule
network and deep CNN models for the quantification of seagrass distribution through regression.
Their proposed models were evaluated with WorldView-2 satellite images and achieved better results
than traditional regression methods. Overall, the results of our study show that detection and mapping
of seagrasses using the proposed CNN model is a better option than using traditional machine
learning algorithms.
Our proposed framework has several advantages. First, the system used for collecting in situ
data is not harmful to the environment and can be performed annually to monitor ecosystem changes.
Second, the pre-trained CNNs calibrated by ground truth observations can be adapted for use in other
areas. Third, the proposed framework is semiautomatic, accurate, cost-effective, and consistent with
simple classification schemes that can be widely applied. Finally, the presented approach achieved high
accuracies with simple logistics, short processing time, and small amounts of training data. However,
our proposed framework has limitations: Accuracy decreased in areas with mixed substrates and
turbid waters such as Fukido cove [59], and the system was tested only in shallow water environments.
Moreover, the field observations were collected by motorboats, which require appropriate weather
conditions for surveying. These limitations may be overcome in future studies, which will focus on
enhancing the towed underwater images and reducing the turbidity effects. Moreover, the emerging
NASA multispectral cameras [60] will be tested; these cameras can produce sub centimeters resolution
multispectral underwater images, which will increase the discriminating power of the applied classifiers.
Finally, testing the proposed framework using ROVs, which can produce higher quality underwater
images and survey deep seafloor areas.
5. Conclusions
In this study, we proposed a simple, fast, and cost-effective system for seabed substrate
categorization and mapping using CNNs. Our results attest to the superior performance of a
combination of pre-trained CNNs and BOF descriptors for benthic cover and seagrass detection.
Moreover, our model incorporating CNNs with simple architectures shows promise for the mapping of
seabed benthos and, therefore, merits further testing using various case studies. Using the Shiraho area
and Fukido cove as validation sites, we found that integrating CNNs and a BOF approach achieved the
highest OAs of 91.5% and 90.4% for benthic habitat and seagrasses detection, respectively. Furthermore,
applying CNNs with simple architecture for seabed mapping significantly improved our results,
with 89.9% and 91.2% OA for benthic habitat and seagrasses mapping, respectively. Thus, by using
our framework, seabed substrates and seagrasses can be accurately categorized and mapped with
minimum-workforce field observations.
Author Contributions: Conceptualization, H.M., K.N. and T.N.; methodology, K.N. and H.M.; software, H.M.
and T.N.; validation, K.N. and T.N.; formal analysis, H.M. and K.N.; investigation, T.N.; resources, K.N.; data
curation, H.M. and T.N.; writing—original draft preparation, H.M.; writing—review and editing, K.N. and T.N.;
visualization, T.N.; supervision, K.N.; project administration, K.N.; funding acquisition, K.N. All authors have
read and agreed to the published version of the manuscript.
Funding: This research was financially supported partly by Nakamura Laboratory in Tokyo Institute of Technology
and JSPS Grant-in-Aids for Scientific Research (No. 15H02268), and Science and Technology Research Partnership
for Sustainable Development (SATREPS) program, Japan Science and Technology Agency (JST)/Japan International
Cooperation Agency (JICA).Remote Sens. 2020, 12, 4002 15 of 18
Conflicts of Interest: The authors declare no conflict of interest.
References
1. Sun, X.; Shi, J.; Liu, L.; Dong, J.; Plant, C.; Wang, X.; Zhou, H. Transferring deep knowledge for object
recognition in Low-quality underwater videos. Neurocomputing 2017, 275, 897–908. [CrossRef]
2. Vassallo, P.; Bianchi, C.N.; Paoli, C.; Holon, F.; Navone, A.; Bavestrello, G.; Cattaneo Vietti, R.; Morri, C.
A Predictive Approach to Benthic Marine Habitat Mapping: Efficacy and Management Implications.
Mar. Pollut. Bull. 2018, 131, 218–232. [CrossRef] [PubMed]
3. Mahmood, A.; Bennamoun, M.; An, S.; Sohel, F.; Boussaid, F.; Hovey, R.; Kendrick, G.; Fisher, R.B. Deep
Learning for Coral Classification. In Handbook of Neural Computation; Academic Press: Cambridge, MA, USA,
2017; pp. 383–401.
4. Beijbom, O.; Edmunds, P.J.; Roelfsema, C.; Smith, J.; Kline, D.I.; Neal, B.P.; Dunlap, M.J.; Moriarty, V.; Fan, T.Y.;
Tan, C.J.; et al. Towards Automated Annotation of Benthic Survey Images: Variability of Human Experts and
Operational Modes of Automation. PLoS ONE 2015, 10, 1–22. [CrossRef] [PubMed]
5. González-Rivero, M.; Beijbom, O.; Rodriguez-Ramirez, A.; Holtrop, T.; González-Marrero, Y.; Ganase, A.;
Roelfsema, C.; Phinn, S.; Hoegh-Guldberg, O. Scaling up Ecological Measurements of Coral Reefs Using
Semi-automated Field Image Collection and Analysis. Remote Sens. 2016, 8, 30. [CrossRef]
6. Shihavuddin, A.; Gracias, N.; Garcia, R.; Gleason, A.C.R.; Gintert, B. Image-Based Coral Reef Classification
and Thematic Mapping. Remote Sens. 2013, 5, 1809–1841. [CrossRef]
7. Gauci, A.; Deidun, A.; Abela, J.; Zarb Adami, K. Machine Learning for Benthic Sand and Maerl Classification
and Coverage Estimation in Coastal Areas Around the Maltese Islands. J. Appl. Res. Technol. 2016, 14,
338–344. [CrossRef]
8. Raj, M.V.; Murugan, S.S. Underwater Image Classification using Machine Learning Technique. In Proceedings
of the International Symposium on Ocean Electronics, SYMPOL, Ernakulam, India, 11–13 December 2019;
pp. 166–173.
9. Modasshir, M.; Li, A.Q.; Rekleitis, I. MDNet: Multi-Patch Dense Network for Coral Classification.
In Proceedings of the OCEANS 2018 MTS/IEEE, Charleston, SC, USA, 22–25 October 2018; pp. 1–6.
10. Krizhevsky, A.; Sutskever, I.; Hinton, G.E. ImageNet Classification with Deep Convolutional Neural Networks.
In Proceedings of the Advances in Neural Information Processing Systems 25 (NIPS 2012), Curran Associates,
Lake Tahoe, NV, USA, 3–8 December 2012; pp. 1097–1105.
11. Simonyan, K.; Zisserman, A. Very deep convolutional networks for large-scale image recognition.
In Proceedings of the 3rd International Conference on Learning Representations, ICLR 2015, San Diego, CA,
USA, 7–9 May 2015; pp. 1–14.
12. He, K.; Zhang, X.; Ren, S.; Sun, J. Deep residual learning for image recognition. In Proceedings of the
IEEE Computer Society Conference on Computer Vision and Pattern Recognition, Las Vegas, NV, USA,
27–30 June 2016; pp. 770–778.
13. Szegedy, C.; Liu, W.; Jia, Y.; Sermanet, P.; Reed, S.; Anguelov, D.; Erhan, D.; Vanhoucke, V.; Rabinovich, A.
Going Deeper with Convolutions Christian. In Proceedings of the IEEE Conference on Computer Vision and
Pattern Recognition (CVPR), Boston, MA, USA, 7–12 June 2015; pp. 1–9.
14. Gómez-Ríos, A.; Tabik, S.; Luengo, J.; Shihavuddin, A.S.M.; Herrera, F. Coral species identification with texture
or structure images using a two-level classifier based on Convolutional Neural Networks. Knowl. Based Syst.
2019, 184, 104891. [CrossRef]
15. Lumini, A.; Nanni, L.; Maguolo, G. Deep learning for plankton and coral classification. Appl. Comput. Inform.
2020, in press. [CrossRef]
16. Raphael, A.; Dubinsky, Z.; Iluz, D.; Netanyahu, N.S. Neural Network Recognition of Marine Benthos and
Corals. Diversity 2020, 12, 29. [CrossRef]
17. Elawady, M. Sparse Coral Classification Using Deep Convolutional Neural Networks. Master’s Thesis,
Heriot-Watt University, Edinburgh, Scotland, 2015.
18. Beijbom, O.; Edmunds, P.J.; Kline, D.I.; Mitchell, B.G.; Kriegman, D. Automated annotation of coral reef
survey images. In Proceedings of the 2012 IEEE Conference on Computer Vision and Pattern Recognition,
Providence, RI, USA, 16–21 June 2012; pp. 1170–1177.Remote Sens. 2020, 12, 4002 16 of 18
19. Changing Oceans Expedition 2013-RRS James Cook 073 Cruise Report. Available online: https://www.bodc.
ac.uk/resources/inventories/cruise_inventory/report/11421/ (accessed on 25 June 2020).
20. Bahrani, A.; Majidi, B.; Eshghi, M. Coral Reef Management in Persian Gulf Using Deep Convolutional Neural
Networks. In Proceedings of the 4th International Conference on Pattern Recognition and Image Analysis
(IPRIA), Tehran, Iran, 6–7 March 2019; pp. 200–204.
21. King, A.; Bhandarkar, S.M.; Hopkinson, B.M. Deep Learning for Semantic Segmentation of Coral Reef Images
Using Multi-View Information. In Proceedings of the IEEE/CVF Conference on Computer Vision and Pattern
Recognition Workshops (CVPRW), Salt Lake City, UT, USA, 18–22 June 2018; pp. 1–10.
22. Gómez-Ríos, A.; Tabik, S.; Luengo, J.; Shihavuddin, A.S.M.; Krawczyk, B.; Herrera, F. Towards highly
accurate coral texture images classification using deep convolutional neural networks and data augmentation.
Expert Syst. Appl. 2019, 118, 315–328. [CrossRef]
23. Mahmood, A.; Bennamoun, M.; An, S.; Sohel, F.A.; Boussaid, F.; Hovey, R.; Kendrick, G.A.; Fisher, R.B. Deep
Image Representations for Coral Image Classification. IEEE J. Ocean. Eng. 2018, 44, 121–131. [CrossRef]
24. Mahmood, A.; Ospina, A.G.; Bennamoun, M.; An, S.; Sohel, F.; Boussaid, F.; Hovey, R.; Fisher, R.B.;
Kendrick, G.A. Automatic Hierarchical Classification of Kelps Using Deep Residual Features. Sensors 2020,
20, 447. [CrossRef] [PubMed]
25. Mahmood, A.; Bennamoun, M.; An, S.; Sohel, F.; Boussaid, F.; Hovey, R.; Kendrick, G.; Fisher, R.B. Automatic
Annotation of Coral Reefs using Deep Learning. In Proceedings of the OCEANS 2016 MTS/IEEE Monterey,
OCE 2016, Monterey, CA, USA, 19–23 September 2016; pp. 1–5.
26. Bewley, M.; Friedman, A.; Ferrari, R.; Hill, N.; Hovey, R.; Barrett, N.; Marzinelli, E.M.; Pizarro, O.; Figueira, W.;
Meyer, L.; et al. Australian sea-floor survey data, with images and expert annotations. Sci. Data 2015,
2, 150057. [CrossRef] [PubMed]
27. Mahmood, A.; Bennamoun, M.; An, S.; Sohel, F.; Boussaid, F.; Hovey, R.; Kendrick, G.; Fisher, R.B. Coral
Classification with Hybrid Feature Representations. In Proceedings of the 2016 IEEE International Conference
on Image Processing (ICIP), Phoenix, AZ, USA, 25–28 September 2016; pp. 519–523.
28. Xu, L.; Bennamoun, M.; An, S.; Sohel, F.A.; Boussaid, F. Classification of corals in reflectance and fluorescence
images using convolutional neural network representations. In Proceedings of the Advances in neural
information processing systems, Calgary, AB, Canada, 3–6 December 2012; pp. 1097–1105.
29. Mahmood, A.; Bennamoun, M.; An, S.; Sohel, F.; Boussaid, F. ResFeats: Residual network based features for
underwater image classification. Image Vis. Comput. 2020, 93, 103811. [CrossRef]
30. Reshitnyk, L.; Costa, M.; Robinson, C.; Dearden, P. Evaluation of WorldView-2 and acoustic remote sensing
for mapping benthic habitats in temperate coastal Pacific waters. Remote Sens. Environ. 2014, 153, 7–23.
[CrossRef]
31. Lüdtke, A.; Jerosch, K.; Herzog, O.; Schlüter, M. Development of a machine learning technique for automatic
analysis of seafloor image data: Case example, Pogonophora coverage at mud volcanoes. Comput. Geosci.
2012, 39, 120–128. [CrossRef]
32. Turner, J.A.; Babcock, R.C.; Hovey, R.; Kendrick, G.A. Can single classifiers be as useful as model ensembles
to produce benthic seabed substratum maps? Estuar. Coast. Shelf Sci. 2018, 204, 149–163. [CrossRef]
33. Hedley, J.D.; Roelfsema, C.; Brando, V.; Giardino, C.; Kutser, T.; Phinn, S.; Mumby, P.J.; Barrilero, O.; Laporte, J.;
Koetz, B. Coral reef applications of Sentinel-2: Coverage, characteristics, bathymetry and benthic mapping
with comparison to Landsat 8. Remote Sens. Environ. 2018, 216, 598–614. [CrossRef]
34. Xu, H.; Liu, Z.; Zhu, J.; Lu, X.; Liu, Q. Classification of Coral Reef Benthos around Ganquan Island Using
WorldView-2 Satellite Imagery. J. Coast. Res. 2019, 93, 466–474. [CrossRef]
35. Wicaksono, P.; Aryaguna, P.A.; Lazuardi, W. Benthic Habitat Mapping Model and Cross Validation Using
Machine-Learning Classification Algorithms. Remote Sens. 2019, 11, 1279. [CrossRef]
36. Nakase, K.; Murakami, T.; Kohno, H.; Ukai, A.; Mizutani, A.; Shimokawa, S. Distribution of Enhalus acoroides
According to Waves and Currents. In Geophysical Approach to Marine Coastal Ecology: The Case of Iriomote
Island, Japan; Shimokawa, S., Murakami, T., Kohno, H., Eds.; Springer: Singapore, 2020; pp. 197–215.
37. GoPro Hero3 + (Black Edition) Specs. Available online: https://www.cnet.com/products/gopro-hero3-plus-
black-edition/specs/ (accessed on 20 June 2020).
38. Collin, A.; Nadaoka, K.; Nakamura, T. Mapping VHR Water Depth, Seabed and Land Cover Using Google
Earth Data. ISPRS Int. J. Geo-Inf. 2014, 3, 1157–1179. [CrossRef]
39. Cortes, C.; Vapnik, V. Support-Vector Networks. Mach. Learn. 1995, 20, 273–297. [CrossRef]You can also read