Climate change models predict decreases in the range of a microendemic freshwater fish in Honduras - Nature
←
→
Page content transcription
If your browser does not render page correctly, please read the page content below
www.nature.com/scientificreports
OPEN Climate change models
predict decreases in the range
of a microendemic freshwater fish
in Honduras
Caleb D. McMahan1*, César E. Fuentes‑Montejo2, Luke Ginger3, Juan Carlos Carrasco4,5,
Prosanta Chakrabarty6 & Wilfredo A. Matamoros7,8
Despite their incredible diversity, relatively little work has been done to assess impacts of climate
change on tropical freshwater organisms. Chortiheros wesseli is a species of Neotropical cichlid
(Cichlidae: Cichlinae) restricted to only a few river drainages in the Caribbean-slope of Honduras. Little
is known about this species and few specimens had been collected until recently; however, our work
with this species in the wild has led to a better understanding of its ecology and habitat preferences
making it an excellent model for how freshwater fishes can be affected by climate change. This study
assesses the distribution and habitats of Chortiheros wesseli using a combination of field data and
species distribution modeling. Results indicate this species is largely limited to its current range,
with no realistic suitable habitat nearby. Empirical habitat data show that this species is limited to
narrow and shallow flowing waters with rapids and boulders. This habitat type is highly influenced by
precipitation, which contributed the greatest influence on the models of present and future habitat
suitability. Although several localities are within boundaries of national protected areas, species
distribution models all predict a reduction in the range of this freshwater fish based on climate change
scenarios. The likelihood of a reduced range for this species will be intensified by adverse changes to
its preferred habitats.
Current and projected impacts of climate change on fishes have been described in numerous studies and thor-
oughly synthesized by Myers et al.1. Those authors demonstrate that many of the studies on freshwater fishes (few
relative to marine studies) have focused on species of economic concern (e.g. salmon) and have largely targeted
North America and Europe1. This leaves vast geographic and taxonomic voids in our understanding of ongoing
and future climate change impacts on freshwater biota, particularly in mega-diverse tropical systems1. Evidence
suggests tropical organisms may be as, or more, vulnerable to climate change impacts as temperate biota2,3.
The distributions of organisms depend on a variety of interacting abiotic and biotic variables (e.g. evolution,
physiography, climate, habitat, c ompetition4,5) and provide key baseline data for documenting effects of climate
change. However, combinations of those variables driving distributional patterns are far less well understood,
particularly for aquatic taxa. Empirical studies (combining in situ examination of wild animals and modeling)
assessing these variables are important sources of information for testing a range of hypotheses, as well as for
1
Field Museum of Natural History, 1400 S. Lake Shore Dr., Chicago, IL, USA. 2Escuela de Biología, Facultad de
Ciencias Químicas y Farmacia, Universidad de San Carlos de Guatemala, Edificio T10, Ciudad Universitaria,
Zona 12, 01012 Ciudad de Guatemala, Guatemala. 3Heal the Bay, 1444 9th Street, Santa Monica, CA,
USA. 4Departamento de Biología, Facultad de Ciencias del Mary Ambientales, CASEM, Universidad de Cádiz,
Puerto Real, 11510 Cádiz, Spain. 5Instituto Técnologico Superior de Tela, Universidad Nacional Autónoma de
Honduras, Boulevard Suyapa, Tegucigalpa, Honduras. 6LSU Museum of Natural Science, Department of Biological
Sciences, Louisiana State University, Baton Rouge, LA 70803, USA. 7Instituto de Ciencias Biológicas, Universidad
de Ciencias y Artes de Chiapas, Libramiento Norte Poniente 1150, Col. Lajas Maciel, C.P. 29039 Tuxtla Gutiérrez,
Chiapas, Mexico. 8Maestría en Ciencias en Biodiversidad y Conservación de Ecosistemas Tropicales, Instituto de
Ciencias Biológicas, UNICACH, Libramiento Norte # 1150, Col. Lajas Maciel, C.P. 29039 Tuxtla Gutiérrez, Chiapas,
México. *email: cmcmahan@fieldmuseum.org
Scientific Reports | (2020) 10:12693 | https://doi.org/10.1038/s41598-020-69579-7 1
Vol.:(0123456789)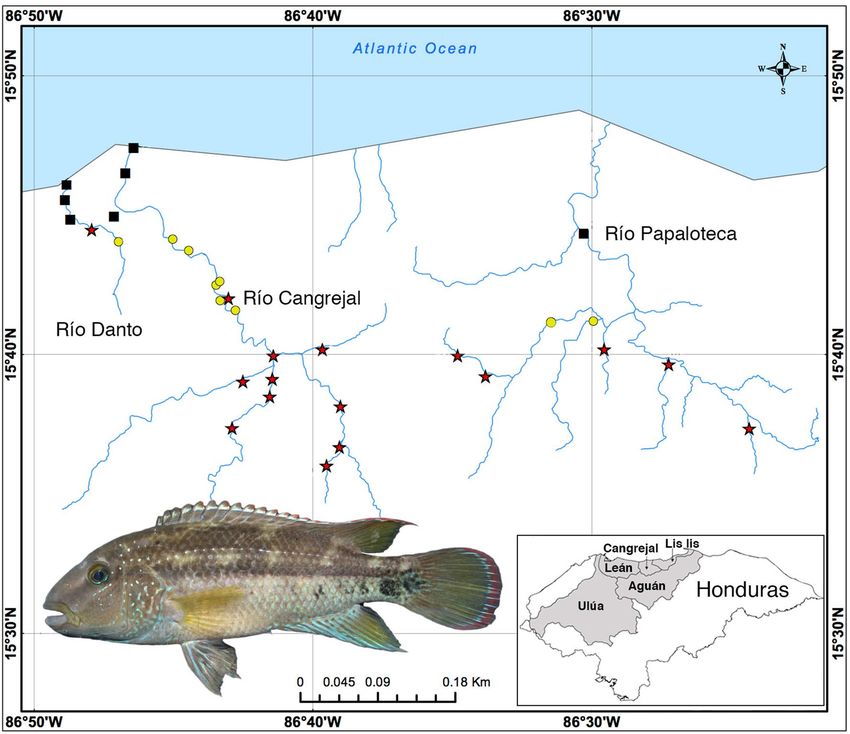
www.nature.com/scientificreports/
Figure 1. Map showing localities for Chortiheros wesseli samples and relevant river drainages in Honduras
(generated in ArcMap 10.7). Black squares indicate absence, yellow circles indicate ‘less abundant’, and red stars
indicate ‘abundant’ sample sizes of C. wesseli. Insert is a live individual of C. wesseli (LSUMZ 14519, 70.68 mm
SL); photo courtesy of D. Smith.
formulating conservation priorities and strategies. Such empirical studies are not always possible given the time
and resources necessary to gather such ecological data.
Species Distribution Models (SDMs) represent the probability of species occurrence across a spatial land-
scape based on responses to environmental variables. These SDMs can be a robust source of information in the
absence of empirical ecological data5–7. In addition to contemporary distributions8,9, models can be projected
onto paleo- and future landscapes to test hypotheses related to temporal range shifts based on changing condi-
tions (e.g. glaciation cycles, future climate p redictions10,11). For example, such distributional models predict a
future decrease in suitable habitat based on estimated future shifts in climate for Engraulis ringens, an anchovy
from Chilean w aters12, as well as for Karsenia koreana, the only plethodontid salamander in A sia13. Constructing
SDMs for aquatic taxa can be difficult because of a limited set of ambient variables and a terrestrial focus; how-
ever, with robust occurrence data these layers have offered novel insights into biogeographic patterns in fishes
and amphibians14–16.
In this study we focus on Chortiheros wesseli, a cichlid species known only from a small montane region in
the Caribbean slope of Honduras (Fig. 1). Little is known about the biology of this microendemic fish beyond
general observations in the original d escription17. All the original specimens came from the same general loca-
tion, precluding comparison to additional localities. Future climate change predictions suggest drastic changes in
patterns of rain and drought in Central A merica18, and given the narrow distribution of this endemic species in
Honduras (one of the most limited of all Central American freshwater fishes), it is likely this species will be greatly
affected by increasing variability in climatic and ecological conditions. Our aims were (1) to elucidate fine-scale
patterns of habitat association for this species based on thorough fieldwork and environmental data, and (2) to
integrate fieldwork and modeling to assess the current distribution of C. wesseli and test the potential impact of
climate change on the range of this narrowly endemic species.
Scientific Reports | (2020) 10:12693 | https://doi.org/10.1038/s41598-020-69579-7 2
Vol:.(1234567890)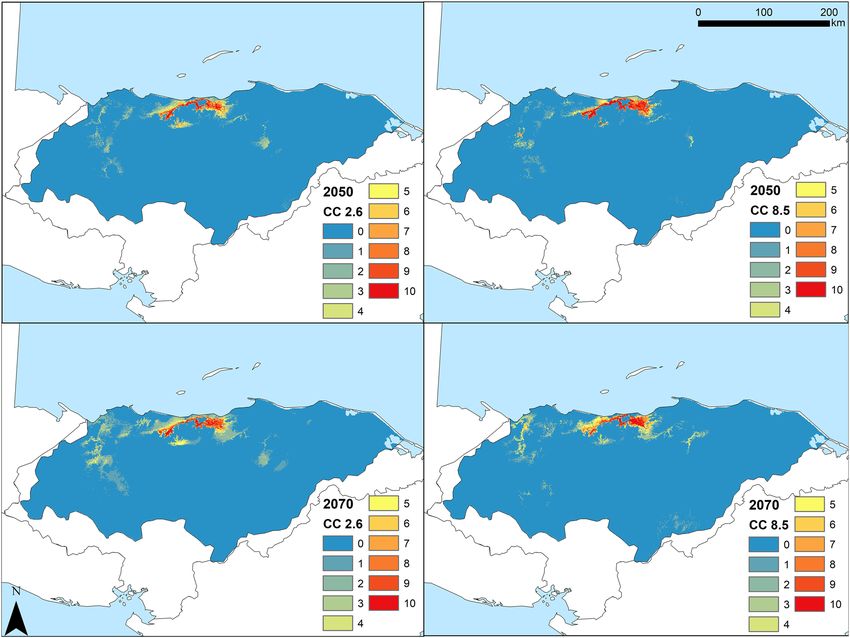
www.nature.com/scientificreports/
Figure 2. Triplot showing results of the redundancy analysis (RDA). Symbols are the same as those used in
Fig. 1.
Results
Habitat and ecology. Field collections of C. wesseli at each locality were categorized as ‘less abundant’
(N = 1–10) and ‘abundant’ (N = > 10) (Fig. 1). The parsimonious RDA (Fig. 2) explained 38.7% of variation,
of which 29.2% was explained by axis 1 and 9.5% by axis 2. Constrained variance totaled 43.3% whereas the
unconstrained variance was 56.6%. The forward selection procedure selected three environmental factors as
contributing the most to the output model: river width, mud substrate, and water depth. Results of the RDA
suggested that C. wesseli was limited to relatively shallow localities where the river width was narrow and the
dominant substrate consisted of rocks and boulders. These localities were consistent with middle and upper
reaches of the rivers.
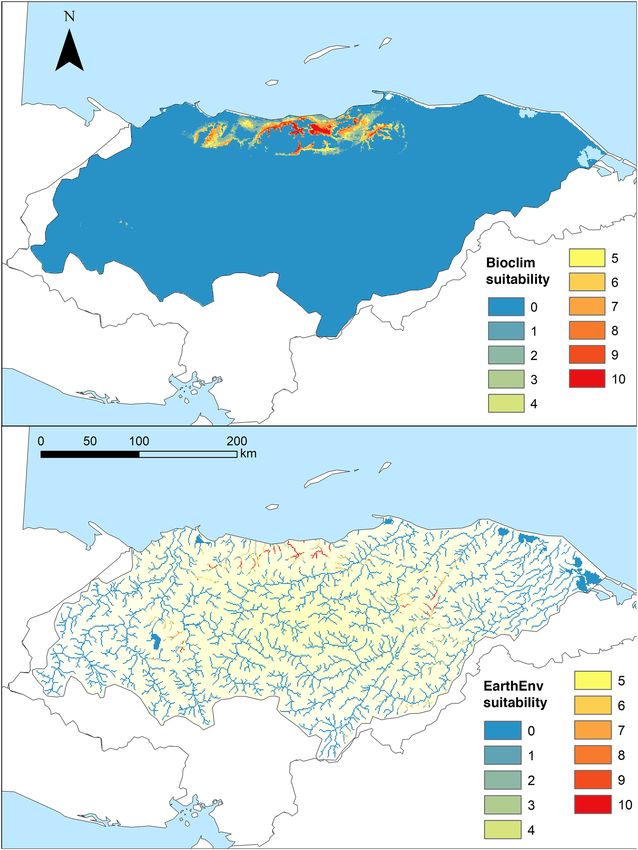
Models of current and future habitat suitability. Suitable environments for C. wesseli based on SDMs
showed a narrow distribution using Bioclim variables, with the Cangrejal and Lis Lis river basins as the most
suitable environments, followed by the Leán and Aguán river basins (Fig. 3). Contemporary models with Earth-
Env variables suggested similar results but with less suitable habitat throughout the Aguán River. Both models
indicated suitable environments in distant areas such as the Ulúa River but in all cases with lower suitability at
the edges.
Contemporary models using Bioclim variables recovered a total of 3,686.81 km2 of suitable habitat across
the study area (Table 1), with an AUC of 0.997 ± 0.001 and a TSS of 0.936 ± 0.071. In contrast, models based on
EarthEnv variables recovered only 1,276.2 km2 of suitable habitat across the study area (Table 1), with an AUC
of 0.988 ± 0.004 and a TSS of 0.751 ± 0.159. Results of jackknife analysis showed the Bioclim variable with the
highest contribution to the model was Bio18 (precipitation during the warmest quarter; 49.1%), followed by
Bio04, Bio15, Bio19, and Bio09, all with < 10% contribution (related to rainfall and temperature seasonality).
Bio18 was additionally the most important based on average permutation (Fig. 4). Remaining variables contrib-
uted < 5% to the model. The EarthEnv variable with greatest contribution to the model was prec_wsum (related
to rainfall; 35.4%), followed by Slope, LC_wavg (landcover), and Tmin_wavg (temperature), all with < 20% con-
tribution (Fig. 4). The remaining variables had either a low (< 10%; prec_sum, LC_ran), very low (< 4%), or no
contribution (Soil_avg, Soil_max, Hydavg, LC_min, LC_max; related to soil content, landcover, and hydrology).
Based on EarthEnv variables, prec_wsum had the highest average permutation importance (63%), followed by
Tmin_wavg (11.4%) and Soil_ran (11.1%).
Two national protected areas encompassing suitable habitat, Parque Nacional Nombre de Dios and Parque
Nacional Pico Bonito, were recovered by our SDMs. The total coverage of suitable habitats inside of protected
areas based on Bioclim and EarthEnv variables was 610.83 km2 and 111.59 km2, respectively (Table 1). Of the 25
occurrence records (locality points) used for building our SDMs, eight (32%) were located inside protected areas.
Future SDMs predicted a reduction of environmental suitability, shifting from a wider area in the present
to a substantially narrower area of suitable environment for C. wesseli by 2050 and 2070 (Fig. 5). Models based
on RCP2.6 showed a severe decline in the range of suitable habitat by 2050 and a small increase by 2070, while
models based on RCP8.5 showed a slight decrease in suitable habitat by the year 2050 and an abrupt, drastic
reduction by the year 2070, leading to the narrowest area of suitable habitat predicted (Figs. 5, 6; Table 1). Overall
both models converged in their predictions of decreases in the range of C. wesseli (Fig. 6).
Scientific Reports | (2020) 10:12693 | https://doi.org/10.1038/s41598-020-69579-7 3
Vol.:(0123456789)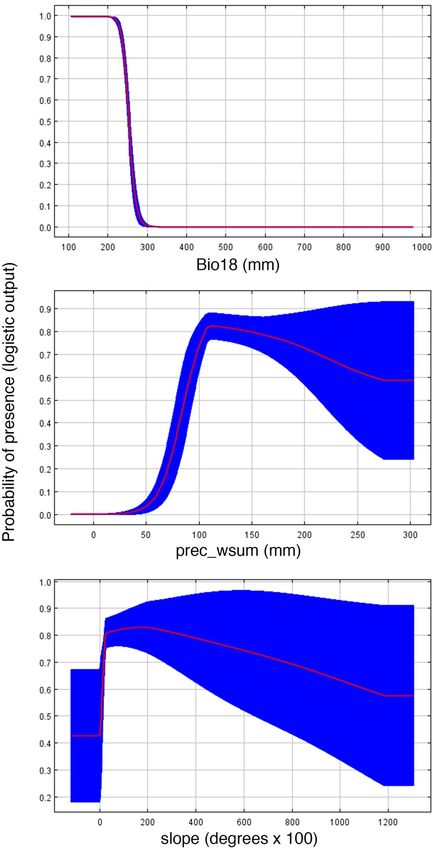
www.nature.com/scientificreports/
Figure 3. Maps showing suitable habitat for Chortiheros wesseli, under Bioclim layers (upper) and EarthEnv
layers (lower). Maps generated in ArcMap 10.7.
Discussion
Freshwater ecosystems are among the most threatened in the w orld19,20. The Neotropics are known as an incred-
ible hotspot for biodiversity, particularly in the case of an extraordinary species richness for fishes in Central
America21,22; however, given the short ranges of species’ habitats and continuous threats (e.g. habitat loss, pollu-
tion, overexploitation), this area is considered one of great concern for its freshwater biodiversity23. This concern
is deepened based on climate change predictions that will produce unfavorable futures for several taxa due to
issues such as loss of habitat and transformed food web d ynamics24,25.
Scientific Reports | (2020) 10:12693 | https://doi.org/10.1038/s41598-020-69579-7 4
Vol:.(1234567890)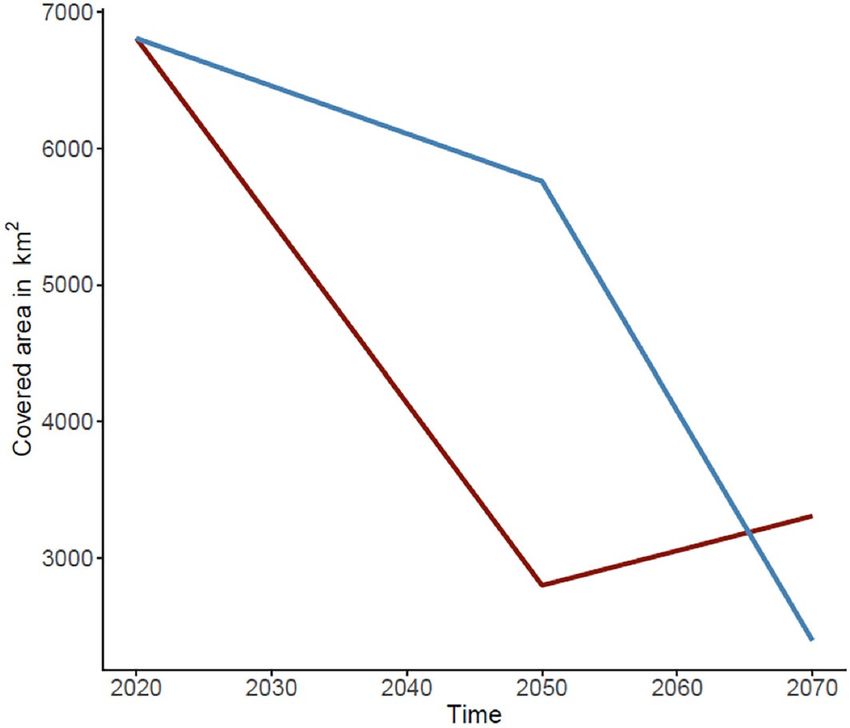
www.nature.com/scientificreports/
RCP2.6 RCP8.5
Suitability Present 2050 % 2070 % 2050 % 2070 %
Suitability over the complete study area
Low 4,175.14 1,674.75 40.11 2,369.49 56.75 3,512.29 84.12 1,504.43 36.03
Mid 1,128.53 687.19 60.89 247.52 21.93 1,219.15 108.03 317.16 28.1
High 1,505.27 436.31 28.98 689.7 45.82 1,027.84 68.28 571.4 37.96
Total 6,808.94 2,798.25 41.1 3,306.72 48.56 5,759.28 84.58 2,392.99 35.14
Suitability inside of protected areas
Low 811.37 205.57 25.34 249.2 30.71 376.74 46.43 172.01 21.2
Mid 172.01 158.58 92.19 57.89 33.66 119.98 69.75 58.73 34.14
High 252.56 151.87 60.13 246.68 97.67 311.29 123.26 223.19 88.37
Total 1,235.93 516.02 41.75 553.78 44.81 808.01 65.38 453.93 36.73
Suitability Present (total area) Present (protected areas) %
Suitability described by Earth Environment models
Low 1,606.79 57.06 3.55
Mid 745.92 53.7 7.2
High 399.39 74.68 18.7
Total 2,752.1 185.43 6.74
Table 1. Suitable area in km2 and percentage of covered area with respect to the present-day suitable area.
Our results illuminate habitat characterizations of a narrowly endemic Neotropical freshwater fish from
the Caribbean slope of Honduras. Areas with the highest probability of occurrence are supported by our field
observations, demonstrating the robustness of our model. The SDMs highlight a slightly larger range of suitable
habitat than the currently known distribution of the species, but SDMs estimate the fundamental niche of a spe-
cies, which likely differs from the realized n iche16,26. The suitable habitat detected in rivers slightly west of the
known distribution of C. wesseli can be attributed to shared environmental and physiographic characteristics21.
However, extensive sampling in these rivers supports the absence of this species from those systems, and can be
easily explained in aquatic taxa based on dispersal capabilities and v icariance22,27. The predicted range of this
species could further be restricted by abiotic variables not included in our SDMs (e.g. water chemistry), as well
as by biotic factors (e.g. species interactions, competition).
Most studies utilizing SDMs lack empirical habitat data that correspond to occurrence records, but with
these data we can better assess suitable habitat within predicted (modeled) areas. We have documented habitat
associations for this endemic cichlid that is found exclusively in aquatic habitats with rapids and riffles, as well
as large rocks and boulders for shelter. This observation is consistent with the most important variables contrib-
uting to our SDMs. Given that both Bio18 and prec_wsum both represent variables related to rainfall (Fig. 4),
we attribute this to the influence of precipitation on water depths and flow. Our results suggest that places with
muddy bottoms and wide, deep river channels are not used by C. wesseli (Fig. 2). Based on our results we predict
that the habitats for this species will be characterized by having a narrower channel width and shallower depth
with a substrate dominated by large boulders and rocks. This kind of habitat is potentially threatened by climate
change projections, especially in Central America, where seasonal variation is predicted to be considerably
different in the f uture18. These conclusions are additionally supported by our results showing how changes in
slope impact habitat suitability (Fig. 4). Small changes in elevation (mouths of rivers) provide only moderately
suitable habitats for the species, but probability of occurrence increases as slope increases. However, probability
of occurrence begins decreasing as slope continues increases (Fig. 4). These models are consistent with our
fieldwork and habitat data (Fig. 1). Species are generally predicted to move to higher elevations as a response to
changing climate28,29, but the presence of waterfalls and other barriers to moving upslope in the current habitat
of this species will reduce its ability to disperse. Other species that are restricted to these habitats (e.g. bivalves,
crayfish, aquatic beetles) presumably would be similarly endangered by future climate change.
The rivers encompassing the distribution of C. wesseli are part of the Motagua-Nombre de Dios Area of
Endemism21 and two national parks (Pico Bonito and Nombre de Dios). However, the predicted patterns of
reduction in habitat suitability and range will likely be felt inside protected areas, as well. Ongoing conservation
efforts in this area should be enhanced and promoted by the results of our study. While these environmental
and habitat data indicate higher commonality and abundance of C. wesseli than previously k nown30, the local-
ized specificity of habitat in this region of Honduras certainly supports maintaining conservation efforts for the
area. Future SDMs indicate that this area will suffer effects from climate change that would reduce the suitable
environment and range area for C. wesseli24, which highlights the importance of conservation efforts in the region
that should include better managed water usage and waste management.
Our results explain the potential impacts of changing climate on the future distribution of C. wesseli; however,
these models can say nothing regarding habitat use. Our environmental field data clearly demonstrate habitat
specificity for this endemic cichlid within the rivers in which it occurs. One of the most concerning aspects of
climate change in Central America is the likelihood of changes in seasonal dynamics of rainy and dry seasons.
These changes are more likely to modify the availability and quality of habitats in the actual ranges of C. wesseli,
Scientific Reports | (2020) 10:12693 | https://doi.org/10.1038/s41598-020-69579-7 5
Vol.:(0123456789)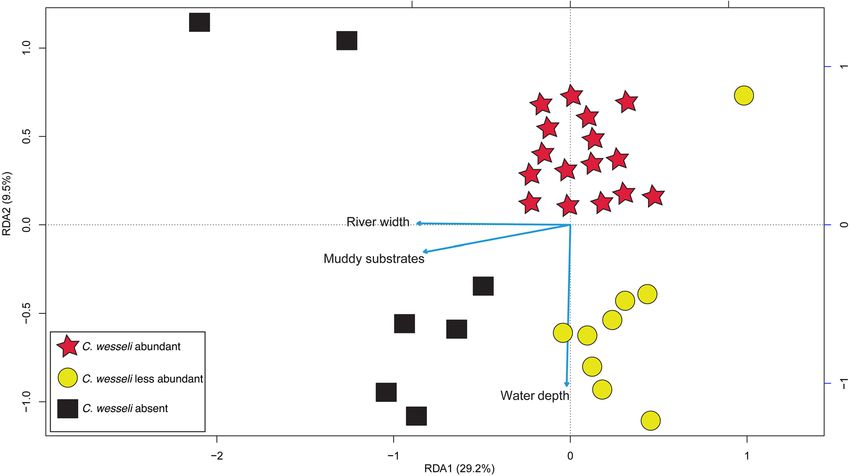
www.nature.com/scientificreports/
Figure 4. Response curves of three influential environmental predictors used for species distribution models
for Chortiheros wesseli. Abbreviations defined in Supplementary Table S2.
shrinking the distribution of the species and potentially reducing the size of p opulations31, 32, which should be
of importance throughout ongoing and future conservation planning.
This study demonstrates that high quality distributional data that can be used for garnering a better ecological
understanding of a species can also be used to predict future effects of climate change. The species studied here
is an excellent example of a narrowly endemic freshwater species that, despite a limited distribution, can have
big impacts on our understanding of a much larger region well into an uncertain future.
Scientific Reports | (2020) 10:12693 | https://doi.org/10.1038/s41598-020-69579-7 6
Vol:.(1234567890)www.nature.com/scientificreports/
Figure 5. Maps showing suitable habitat for Chortiheros wesseli under future scenarios of climate change.
Projections of suitable environment for 2050 (top) and 2070 (bottom), for both RCP2.6 (left) and RCP8.5
(right). Maps generated in ArcMap 10.7.
Figure 6. Comparison of total covered area of suitable habitats predicted by SDMs under RCP2.6 (red line) and
RCP8.5 (blue line) scenarios.
Scientific Reports | (2020) 10:12693 | https://doi.org/10.1038/s41598-020-69579-7 7
Vol.:(0123456789)www.nature.com/scientificreports/
Methods
Fieldwork survey. In September 2011 we sampled 32 localities; four in the Río Danto, 20 in the Río Cangre-
jal (both part of the Cangrejal river basin) and eight in the Río Papaloteca (Lis Lis river basin; Fig. 1). Sampling
was carried out with a combination of collecting gear: electro-fisher, seine, castnet and spear. In each locality
we sampled a stretch of river approximately 150 m in length. In order to homogenize sampling efforts, we per-
formed 20 castnet throws, one pass with the seine and one pass with the electro-fisher. Additionally, one individ-
ual spear-fished for C. wesseli for up to 30 min. Since our goal was to characterize the habitat where C. wesseli was
found, we sampled localities where we expected the fish to be present but also included localities with different
environments where we hypothesized the fish to be absent (e.g. near river mouths). Specimens were deposited
in the Louisiana State University Museum of Natural Science (LSUMZ). All methods were carried out in accord-
ance with relevant guidelines and regulations in Honduras, and all protocols were approved and conducted
under Institutional Animal Care and Use Committee (IACUC) approval 09-022 at Louisiana State University.
Environmental data and analysis. To ensure adequate characterization of habitats in which C. wesseli
was present, we collected an array of environmental data at each locality: river width, water depth, estimation of
canopy cover, erosion, estimation of habitat availability, dominant substrates (percentage of bed rock, boulders,
rocks, cobble, gravel, sand, mud and silt), and river condition (run, waters falls, rapids, riffles and pools). To esti-
mate slope, we measured the altitude in meters above sea level at the sampling point and an additional two points
500 m above and below the sampling point. Slope was represented as a percentage [slope = (U − D/1,000) × 100],
where U = altitude 500 m upstream of sampling point and D = altitude 500 m downstream of sampling point.
We implemented a Redundancy Analysis ( RDA33) to assess the relationship between environmental fac-
tors and the presence of C. wesseli in a given locality. This procedure uses a matrix with all abundance values
(independent variables) captured in our samples, and all recorded environmental data (dependent variables)
as explained above. Since environmental data are often correlated, we implemented a parsimonious R DA34 to
eliminate highly correlated factors and obtain a model in which a reduced, less correlated set of environmental
factors explained the same amount of variance as when using all environmental factors. In order to detect the
best-fit model we applied a forward selection procedure within the global RDA in R 35 using the ‘ordistep’ func-
tion in the package Vegan36. A new RDA was then performed with only those environmental factors chosen by
the forward selection procedure.
Current and projected habitat suitability. We used species distribution models (SDMs) as an inde-
pendent assessment of current suitable environments for C. wesseli in Honduras, as well as to test for shifts in the
distribution of this narrowly-distributed endemic freshwater fish associated with future projections of changes
in climate. Latitude and longitude for all specimens were compiled and all georeferenced points were examined
for accuracy. A total of 25 occurrence points were used after removing duplicate points within the same grid cell
(Supplementary Table S1). Species distribution models were estimated using Maxent v.3.4.137, which overlays
presence data onto environmental layers and characterizes those conditions most suitable for a species. We used
19 freshwater-specific environmental variables (Earth Environment (EarthEnv)38) and 19 bioclimatic variables
(Bioclim39) to estimate contemporary suitable habitat (Supplementary Table S2). All layers were clipped to the
extent of Caribbean basins in Honduras, from the Chamelecón to Patuca River basins, with a 30 arc second
(~ 1 km) spatial resolution. This reduced the potential for pseudoabsences detected in analyses14,16. We tested for
correlation among variables using a Pearson’s correlation test, and when two layers were correlated (threshold
0.8) we retained the climate layer that appeared most biologically meaningful and excluded layers with multiple
correlations. The remaining variables (eight EarthEnv, six Bioclim) were used to estimate contemporary suit-
able habitat (Supplementary Fig. S1). Comparisons of the full dataset and reduced dataset demonstrated clear
overestimation of distribution and suitable habitat in the reduced dataset of fewer variables; highly supported by
our empirical field and habitat data. This is in contrast to some views that correlated variables can overestimate
ranges; however, recent studies support the robustness of Maxent in optimizing collinearity among variables,
thus removing highly correlated variables from the complete dataset has little impact40,41. Therefore, we used
the full dataset for analyses as this most accurately matched biology and distribution of the species, particularly
working at such a fine scale, thus allowing Maxent to choose the most informative variables among all predic-
tors for modeling distribution15. We ran Maxent with a convergence threshold of 10−6 and used 10,000 itera-
tions with bootstrap resampling and 10 replicates42,43, with 25 independent presence records for each replicate to
avoid duplicated records and used a 30% random test percentage of these records to assess model performance.
Probable future distribution was estimated using two different climate change scenarios known as Representa-
tive Concentration Pathways (RCPs), which consider the impacts of climate change strategies on greenhouse
gas emissions (GGE) and published by the UN’s Intergovernmental Panel on Climate Change. We used the
corresponding bioclimatic layers from the Community Climate System Model 4.0 (CCSM4), a coupled General
Circular Model (GCM) that uses four sub-models (atmosphere, land, ocean, sea-ice) to simulate climatic condi-
tions, under the Coupled Model Intercomparison Project Phase 5 (CMIP5) downscaling. In order to compare
two different scenarios with contrasting climate change patterns, we used RCP2.6 (the minimum GGE scenario;
less drastic climatic variation) and RCP8.5 (the maximum GGE scenario; unchecked climatic variation) for the
years 2050 (average 2040–2060) and 2070 (average 2060–2080)24.
We used the receiver-operating characteristic curve (AUC) as an evaluation of model performance44. The
AUC values were between 0 and 1, with higher values indicating a better model performance. When the AUC
was below 0.5, the model performed worse than random, and the closer the AUC was to 1 the better the model
performed45. We additionally used the True Skill Statistic (TSS) as an independent assessment of model perfor-
mance, with values ranging between − 1 and + 1, where + 1 indicated perfect agreement and values ≤ 0 indicated
Scientific Reports | (2020) 10:12693 | https://doi.org/10.1038/s41598-020-69579-7 8
Vol:.(1234567890)www.nature.com/scientificreports/
a performance no better than random46. We then reclassified each replicate into binary (presence/absence) maps
to evaluate suitability using the Maximum Training Sensitivity Plus Specificity threshold, which minimizes false-
presence and false-absence errors16,47,48, and stacked them to produce a single map. We classified suitable area
into five categories as low (1–2 overlapping replicates), low-mid (3–4), mid (5–6), mid-high (7–8), and high
(9–10), with the sum equaling total suitable area predicted. We clipped the covered area that fell inside the main
protected areas distributed across the Honduran Caribbean coast near collecting localities, and also estimated
the suitable area inside these protected areas. We then compared the number of presence records inside protected
areas with records outside of them. Finally, we estimated the covered area of suitable habitat for the present-day
Bioclim model and the two RCP scenario models, comparing the total coverage area of future models with the
present area covered.
Received: 6 March 2020; Accepted: 14 July 2020
References
1. Myers, B. J. E. et al. Global synthesis of the documented and projected effects of climate change on inland fishes. Rev. Fish Biol.
Fish. 27(2), 339–361 (2017).
2. Tewksbury, J. J., Huey, R. B. & Deutsch, C. A. Putting the heat on tropical animals. Science 320(5881), 1296–1297 (2008).
3. Senior, R. A., Hill, J. A. & Edwards, D. P. Global loss of climate connectivity in tropical forests. Nat. Clim. Change 9, 623–626 (2019).
4. Dagosta, F. C. P. & de Pinna, M. C. (2019) The fishes of the Amazon: distribution and biogeographical patterns, with a compre-
hensive list of species. Bull. Am. Mus. Nat. Hist. 431, 1–163 (2019).
5. Peterson, A. T. & Soberón, J. Species distribution modeling and ecological niche modeling: getting the concepts right. Nat. Conserv.
10(2), 102–107 (2012).
6. Franklin, J. Species distribution models in conservation biogeography: developments and challenges. Divers. Distrib. 19, 1217–1223
(2013).
7. Elith, J. et al. A statistical explanation of MaxEnt for ecologists. Divers. Distrib. 17, 43–57 (2011).
8. Smeraldo, S. et al. Modelling risks posed by windo turbines and power lines to soaring birds: the black stork (Ciconia nigra) in
Italy as a case study. Biodivers. Conserv. 29, 1959–1976 (2020).
9. Jensen, A. M., O’Neil, N. P., Iwaniuk, A. N. & Burg, T. M. Landscape effects on the contemporary genetic structure of Ruffled
Grouse (Bonasa umbellus) populations. Ecol. Evol. 9, 5572–5592 (2019).
10. Villavicencio, N. A., Corcoran, D. & Marquet, P. A. Assessing the causes behind the Late Quaternary extinction of horses in South
America using Species Distribution Models. Front. Ecol. Evol. https://doi.org/10.3389/fevo.2019.00226 (2019).
11. Lecocq, T., Harpke, A., Rasmont, P. & Schweiger, O. Integrating intraspecific differentiation in species distribution models: con-
sequences on projections of current and future climatically suitable areas of species. Biodivers. Res. 25, 1088–1100 (2019).
12. Silva, C., Leiva, F. & Lastra, J. Predicting the current and future suitable habitat distributions of the anchovy (Engraulis ringens)
using the Maxent model in the coastal areas off central-north Chile. Fish. Ocean. 28, 171–182 (2018).
13. Borzée, A. et al. Climate change-based models predict range shifts in the distribution of the only Asian plethodontid salamander:
Karsenia koreana. Sci. Rep. 9, 11838 (2019).
14. Newman, C. E. & Austin, C. C. Thriving in the cold: glacial expansion and post-glacial contraction of a temperate terrestrial
salamander (Plethodon serratus). PLoS ONE 10(7), e0130131 (2015).
15. Bagley, J. C., Sandel, M., Travis, J., Lozano-Vilano, M. L. & Johnson, J. B. Paleoclimatic modeling and phylogeography of least kil-
lifish, Heterandria formosa: insights into Pleistocene expansion-contraction dynamics and evolutionary history of North American
Coastal Plain freshwater biota. BMC Evol. Biol. 13, 223 (2013).
16. McMahan, C. D. et al. Pleistocene to holocene expansion of the black-belt cichlid in Central America. Vieja maculicauda (Teleostei:
Cichlidae). PLoS ONE 12, e0178439 (2017).
17. Miller, R. R. Theraps wesseli, a new species of cichlid fish from the Caribbean slope of northern Honduras. Trop. Fish Hobbyist
44(10), 179–183 (1996).
18. Imbach, P. et al. Future climate change scenarios in Central America at high spatial resolution. PLoS ONE 13(4), e0193570 (2018).
19. Saunders, D. L., Meeuwig, J. J. & Vincent, A. C. T. Freshwater protected areas: strategies for conservation. Conserv. Biol. 16(1),
30–41 (2002).
20. Lopes-Lima, M. et al. Conservation of freshwater bivalves at the global scale: diversity, threats and research needs. Hydrobiologia
810(1), 1014 (2018).
21. Matamoros, W. A., McMahan, C. D., Chakrabarty, P., Albert, J. S. & Schaefer, J. F. Derivation of the freshwater fish fauna of Central
America revisited: Myers’s hypothesis in the twenty-first century. Cladistics 31(2), 177–188 (2015).
22. Matamoros, W. A., Kreiser, B. R. & Schaefer, J. F. A delineation of Nuclear Middle America biogeographical provinces based on
river basin faunistic similarities. Rev. Fish Biol. Fish. 22, 351–365 (2012).
23. Collen, B. et al. Global patterns of freshwater species diversity, threat and endemism. Glob. Ecol. Biogeogr. 23, 40–51 (2014).
24. Moss, R. H. et al. The next generation of scenarios for climate change research and assessment. Nature 463, 747–756 (2010).
25. Xenopoulos, M. A. et al. Scenarios of freshwater fish extinctions from climate change and water withdrawal. Glob. Change Biol.
11(10), 1557–1564 (2005).
26. Soberón, J. & Arroyo-Peña, B. Are fundamental niches larger than the realized? Testing a 50-year-old prediction by Hutchinson.
PLoS ONE 12(4), e0175138 (2017).
27. Matamoros, W. A., Schaefer, J. F. & Kreiser, B. R. Annotated checklist of the freshwater fishes of continental and insular Honduras.
Zootaxa 2307, 1–38 (2009).
28. Elsen, P. R., Monahan, W. B. & Merenlender, A. M. Topography and human pressure in mountain ranges alter expected species
responses to climate change. Nat. Commun. https://doi.org/10.1038/s41467-020-15881-x (2020).
29. Freeman, B. G., Scholer, M. N., Ruiz-Gutierrez, V. & Fitzpatrick, J. W. Climate change causes upslope shifts and mountaintop
extirpations in a tropical bird community. Proc. Natl. Acad. Sci. U.S.A. 47, 11982–11987 (2018).
30. Wessel, R. Discovery, pursuit and capture of Theraps wesseli. Buntbarshe Bull. 175, 1–7 (1998).
31. Huang, J. L. et al. Importance of spatio-temporal connectivity to maintain species experiencing range shifts. Ecography https://
doi.org/10.1111/ecog.04716(2020).
32. Saupe, E. E. et al. Spatio-temporal climate change contributes to latitudinal diversity gradients. Nat. Ecol. Evol. 3, 1419–1429 (2019).
33. Van Den Wollenberg, A. L. Redundancy analysis, an alternative for canonical correlation analysis. Psychometrika 42, 207–219
(1977).
34. Borcard, D., Gillet, F. & Legendre, P. Numerical Ecology with R (Springer, New York, 2011).
35. R Core Team. R: a language and environment for statistical computing. R Foundation for Statistical Computing, Vienna, Austria.
https://www.R-project.org/ (2013).
Scientific Reports | (2020) 10:12693 | https://doi.org/10.1038/s41598-020-69579-7 9
Vol.:(0123456789)www.nature.com/scientificreports/
36. Oksanen, J., et al. Vegan: community ecology package. R package, version 2.0-5. https://CRAN.R-project.org/package=vegan
(2012).
37. Phillips, S.J., Dudík, M., & Schapire, R.E. Maxent software for modeling species niches and distributions (Version 3.4.1). https://
biodiversityinformatics.amnh.org/open_source/maxent/. Accessed 21 August 2019.
38. Domisch, S., Amatulli, G. & Jetz, W. Near-global freshwater-specific environmental variables for biodiversity analyses in 1 km
resolution. Sci. Data 2, 150073 (2015).
39. Hijmans, R. J., Cameron, S. E., Parra, J. L., Jones, P. G. & Jarvis, A. Very high-resolution interpolated climate surfaces for global
land areas. Int. J. Climatol. 25, 1965–1978 (2005).
40. Feng, X., Park, D. S., Liang, Y., Pandey, R. & Papes, M. Collinearity in ecological niche modeling: confusions and challenges. Ecol.
Evol. 9, 10365–10376 (2019).
41. De Marco Júnior, P. & Nóbrega, C. C. Evaluating collinearity effects on species distribution models: an approach based on virtual
species simulation. PLoS ONE 13, e0202403 (2018).
42. Pearson, R. G., Raxworthy, C. J., Nakamura, M. & Peterson, A. T. Predicting species distributions from small numbers of occur-
rence records: a test case using cryptic geckos in Madagascar. J. Biogeogr. 34, 102–117 (2007).
43. Wisz, M. S. et al. Effects of sample size on the performance of species distribution models. Divers. Distrib. 14, 763–773 (2008).
44. Phillips, S. J., Anderson, R. P. & Schapire, R. E. Maximum entropy modeling of species geographic distributions. Ecol. Model. 190,
231–259 (2006).
45. Elith, J. & Leathwick, J. Predicting species distributions from museum and herbarium records using multiresponse models fitted
with multivariate adaptive regression splines. Divers. Distrib. 13, 265–275 (2007).
46. Allouche, O., Tsoar, A. & Kadmon, R. Assessing the accuracy of species distribution models: prevalence, kappa and the true skill
statistic (TSS). J Appl. Ecol. 43, 1223–1232 (2006).
47. Jiménez-Valverde, A. & Lobo, J. M. Threshold criteria for conversion of probability of species presence to either-or presence-
absence. Acta Oecol. 31, 361–369 (2007).
48. Liu, C., Newell, G. & White, M. On the selection of thresholds for predicting species occurrence with presence-only data. Ecol.
Evol. 6, 337–348 (2015).
Acknowledgements
We thank Fred Rohde, Rudolf Arndt, Dustin Smith, and Pepe Herrero for assistance with fieldwork and logistics
to collect specimens. Many thanks to the Departamento de Áreas Protegidas del Instituto de Conservacion For-
estal de Honduras for permits for fieldwork (permit ICF-033-2009). Jorge Luis Lievano assisted with generating
the map for Fig. 1. This project was supported, in part, by NSF grants DEB 0916695 to PC and DEB 1311408
to CDM.
Author contributions
C.D.M. and W.A.M. developed the project idea. C.D.M., W.A.M., and J.C.C. conducted the fieldwork. C.D.M.,
W.A.M., L.G., and C.E.F.M. performed analyses. C.D.M., P.C., W.A.M., and C.E.F.M. led the writing. All authors
contributed to producing figures and reviewing the manuscript.
Competing interests
The authors declare no competing interests.
Additional information
Supplementary information is available for this paper at https://doi.org/10.1038/s41598-020-69579-7.
Correspondence and requests for materials should be addressed to C.D.M.
Reprints and permissions information is available at www.nature.com/reprints.
Publisher’s note Springer Nature remains neutral with regard to jurisdictional claims in published maps and
institutional affiliations.
Open Access This article is licensed under a Creative Commons Attribution 4.0 International
License, which permits use, sharing, adaptation, distribution and reproduction in any medium or
format, as long as you give appropriate credit to the original author(s) and the source, provide a link to the
Creative Commons license, and indicate if changes were made. The images or other third party material in this
article are included in the article’s Creative Commons license, unless indicated otherwise in a credit line to the
material. If material is not included in the article’s Creative Commons license and your intended use is not
permitted by statutory regulation or exceeds the permitted use, you will need to obtain permission directly from
the copyright holder. To view a copy of this license, visit http://creativecommons.org/licenses/by/4.0/.
© The Author(s) 2020
Scientific Reports | (2020) 10:12693 | https://doi.org/10.1038/s41598-020-69579-7 10
Vol:.(1234567890)You can also read