SOURCE MODEL FOR THE MW 6.0 EARTHQUAKE IN JIASHI, CHINA ON 19 JANUARY 2020 FROM SENTINEL-1A INSAR DATA
←
→
Page content transcription
If your browser does not render page correctly, please read the page content below
Source model for the Mw 6.0 earthquake in Jiashi,
China on 19 January 2020 from Sentinel-1A InSAR
data
Pengfei Yu
Institute of Geophysics China Earthquake Administration https://orcid.org/0000-0003-2093-046X
Xuejun Qiao ( qiaoxuejun@gmail.com )
https://orcid.org/0000-0002-2723-5104
Wei Xiong
Institute of Seismology China Earthquake Administration
Wei Chen
Institute of Seismology China Earthquake Administration
Zhaosheng Nie
Institute of Seismology China Earthquake Administration
Dijin Wang
Institute of Seismology China Earthquake Administration
Zhige Jia
Institute of Seismology China Earthquake Administration
Jie Li
Earthquake Administration of Xinjiang Uygur Autonomous Region
Full paper
Keywords: Jiashi earthquake, InSAR, Coseismic deformation, Source model, Coulomb stress
DOI: https://doi.org/10.21203/rs.3.rs-25613/v2
License: This work is licensed under a Creative Commons Attribution 4.0 International License.
Read Full License
Page 1/19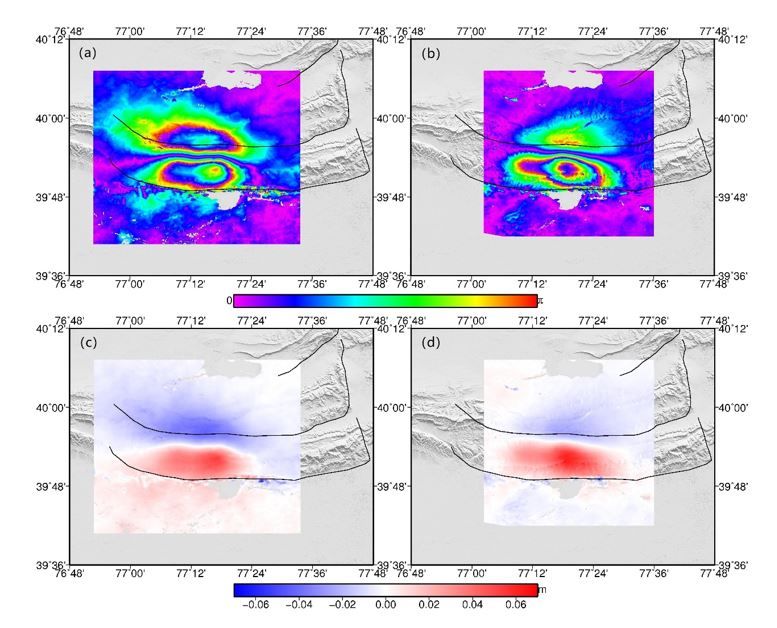
Abstract
On January 19, 2020, an Mw 6.0 earthquake occurred in Jiashi, Xinjiang Uygur Autonomous Region of
China. The epicenter was located at the basin-mountain boundary between the southern Tian Shan and
the Tarim Basin. Interferometric Synthetic Aperture Radar (InSAR) is used to obtain the coseismic
deformation eld from both ascending and descending Sentinel-1A satellite images of the European
Space Agency. The results showed that the coseismic deformation is distributed between the Kalping
fault and the Ozgertaou fault. The earthquake produced signi cant deformation over an area of
approximately 40 km by 30 km. The maximum and minimal displacements along the line of sight (LOS)
are 5.3 cm and -4.2 cm for the ascending interferogram and are 7.2 cm and -3.0 cm for the descending
interferogram, respectively. The fault geometry from the Multi peak Particle Swarm Optimization
computation indicates that the seismogenic fault is a shallow low-dipping planar fault that is 4.58 km
depth underground. The nite slip model inverted by the Steepest Descent Method implies that the
rupture is dominated by a thrust fault. The slips are concentrated in a depth of 5 ~ 7 km with a maximum
slip of 0.29 m. The estimated total seismic moment is 1.688×10¹⁸ Nm, corresponding to a magnitude of
Mw 6.1. The seismogenic fault is the Kalping fault which has a listric structure. The coseismic
deformation only occurred on the décollement layer and did not involve the ramp segment. The coseismic
Coulomb stress changes have enhanced the stress on the deep margin of the Jiashi earthquake rupture
area, indicating that there is still the possibility of strong earthquakes in this region in the future.

Introduction
An Mw 6.0 earthquake struck Jiashi (39.83°N, 77.21°E) in Xinjiang, western China on January 19, 2020,
(Figure 1a). The focal mechanism solutions from the United States Geological Survey (USGS) and Global
Centroid Moment Tensor (GCMT) indicated that the Jiashi earthquake was caused by a thrust fault with a
slight strike-slip (Table 1).

The epicenter of the Jiashi earthquake is located at the southern margin of the Kalpingtag thrust system
(Kalping block), which is situated in the basin-mountain junction region between the south Tian Shan and
the northwestern margin of the Tarim Basin. The Tian Shan orogen is an intracontinental mountain belt
revived from rapid and ongoing convergence in response to the Indo-Eurasian collision. Modern geodetic
measurements have been used to study the current characteristics of convergent deformation rates in the
Tian Shan area, but the deformation mechanism is still under debate. For example, some researchers
suggested that the Tian Shan convergent deformation is formed by concurrent slip across several faults
and intermontane basins that span the mountain belt (Abdrakhmatov et al. 1996; Thompson et al. 2002;
Zubovich et al. 2010). Most of the convergence is not absorbed by a single predominant fault and the
strain eld is roughly homogeneous. Other researchers proposed that convergence is not uniformly
distributed across the Tian Shan, and the slip on the detachment fault under the Tian Shan dominates
the deformation pattern and seismicity of major earthquakes (Yang et al. 2008; Li et al. 2015; Qiao et al.
2017). The existence of large-scale, high slip rate and low-angle detachment fault between the Tian Shan
and the foreland basin is the key indicator to distinguish the above two kinematic models. Assuming that
                                                    Page 2/19
there is a main detachment fault, the slip rate and dip angle estimated from geodetic observations are
~10 mm/a and < 5° respectively. It is consistent with the speculation of the leading edge thickening
model (Yang et al. 2008; Li et al. 2015), but there is still a lack of direct seismic evidence to con rm the
existence of such low-angle detachment fault. Therefore, the use of coseismic geodetic measurements to
study the slip distribution of strong earthquakes plays an important role in clarifying the geometric
structure of active faults in this area.

The Tian Shan orogen is resurrected by the far- eld effect from the collision between the Indian Plate and
the Eurasian plate since the Neogene era. The Kalping block thrusts to the Tarim Basin from the north to
the south, forming the Kalpingtag thrust system (Wang, 2007) (Figure 1b), which is the largest present-
day crustal deformation region in the south Tian Shan except the Wuqia-Kashi zone (Avouac et al. 1993).
There have been 15 earthquakes over magnitude 6 in the Kalping block just since 1990 such as the 1997
Jiashi strong earthquake swarm. Maidan-Karatieke fault is the northern boundary of the Kalping block,
where the Tarim Basin subducts northward to the Tian Shan orogen belt (Allen et al. 1999). It is a large
lithosphere-scale fault with obvious vertical movement at the end of the Late Pleistocene. The southern
boundary of the Kalping block is the Kalping thrust fault. To the south of the fault is the rigid Tarim Basin
with a stable basement. The Kalpingtag thrust system consists of many reverse and anticline fractures
from north to south. It is divided into two segments by the Piqiang fault (Figure 1a). The Jiashi
earthquake occurred at the southern margin of the Kalpingtag thrust system, west of the Piqiang fault.
The epicenter is between the Kalping fault and Ozgertaou fault (Figure 1b). Studies from geological and
deep seismic-re ection pro le indicate that the geometry of the Kalping fault is a listric-shaped structure
(Qu et al. 2003). The dip of the fault is steep at the top and gentle at the bottom. The fault is inclined to
the north at an angle with 30 ~ 70° near the surface. It merges into a detachment surface along the
bottom of Cambrian with a depth of about 9 km. The Ozgertaou fault is mostly east-west trending. Its
western segment is developed between the Paleogene red sandstone, mudstone and Wuqia group
mudstone. Its eastern segment consists of several north inclined thrust faults with a dip of 40 ~ 60°. It
roots into the same detachment in the deep just like the Kalping fault (Qu et al. 2003; Yang et al. 2008).
The balanced geological cross-section revealed that the crustal shortening of the Kalpingtag thrust
system on the west side of the Piqiang fault is 45 km. If the initial deformation occurs at the starting time
of the Xiyu conglomerate deposition since 2.5 Ma, the crustal shortening rate is 17.3 mm/a (Yang et al.
2008). Modern geodetic measurements have shown that the crustal shortening rate in the Jiashi area
relative to the Kazakh block in the northern Tian Shan is about 17~19 mm/a (Wang et al. 2000; Qiao et
al. 2000). The characteristics of the Kalping fault and the Ozgertaou fault given by geological
investigations is general, which is relatively rough and lack of detailed information such the dip angle
with a wide range. Although GPS surveys can provide a ne geometric constraint on the fault, the
distribution of stations in the epicenter and adjacent areas is relatively scarce (Figure 1b). Therefore, the
InSAR observations of coseismic deformation is used to highlight the fault geometry and the slip model.

Crustal deformation is the most direct manifestation of an earthquake. Interferometric Synthetic Aperture
Radar (InSAR) is a powerful technique, which can quickly obtain large-scale, high-precision, high-
resolution surface deformations and has been successfully used for many earthquakes to map the
                                                   Page 3/19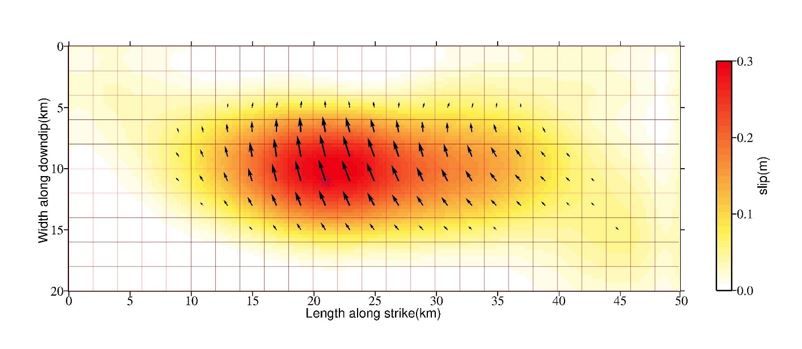
coseismic deformation and study the source model (Wright et al. 2003; Li et al. 2011; Weston et al. 2012;
Qiao et al. 2014; Ma et al. 2018; Xiong et al. 2019; Chen et al. 2019). In this study, the coseismic
deformation of the 2020 Jiashi earthquake is measured with the InSAR technique using both the
ascending and descending interferograms from the Sentinel-1A satellite. The fault geometry and slip
distribution are retrieved based on coseismic interferograms. Finally, the Coulomb stress changes
triggered by this event are evaluated and the potential seismic hazards are analyzed in the study area.
Insar Coseismic Deformation
The coseismic deformation of the Jiashi earthquake is completely captured and imaged by the Sentinel-
1A radar satellite of the Europe Space Agency (ESA). The data are acquired using a very advanced
scanning mode called terrain observation with progressive scans (TOPS) in the Interferometric Wide (IW)
mode (Table 2), which can effectively reduce the scalloping effect and improve the interference
performance. Two pairs of ascending and descending Sentinel-1A images have the shortest temporal
interval of 12 days to minimize the effect of afterslip. Meanwhile, the short perpendicular baselines of -57
m and 12 m can reduce the impact of the digital elevation model (DEM) error (Simons et al. 2002).
The Sentinel-1A SAR data are processed using the Gamma software (Werner et al. 2000). The
interferograms are generated from the Single Look Complex (SLC) products. The multi-look ratio between
the range and azimuth direction is set to 10:2 to improve the signal-to-noise ratio. The accuracy of the
azimuth coregistration better than 0.001 pixel is acquired to avoid the phase jumps between subsequent
bursts. The Shuttle Radar Topographic Mission (SRTM) DEM with a 30-m spacing resolution is used to
remove the phase related to ground topography (Farr and Kobrick 2000). A weighted power spectrum
technique is employed to lter the interferograms to reduce the phase noise and achieve a high signal-to-
noise ratio result (Goldstein and Werner 1998), and the minimum cost ow is adopted to unwrap the
ltered phase (Pepe and Lanari 2006). Then the unwrapped interferograms are geocoded to the WGS84
geographic coordinates and converted to displacements along the line of sight (LOS) (Figure 2).
The coherence of the ascending and descending results is high in most areas because of a high spatial-
temporal correlation between images acquired in a Gobi Desert region with little vegetation. The slight
discrepancy between the two interferograms can be attributed to different looking incidence and azimuth.
The continuous fringes are visible in both ascending and descending interferograms in the epicentral
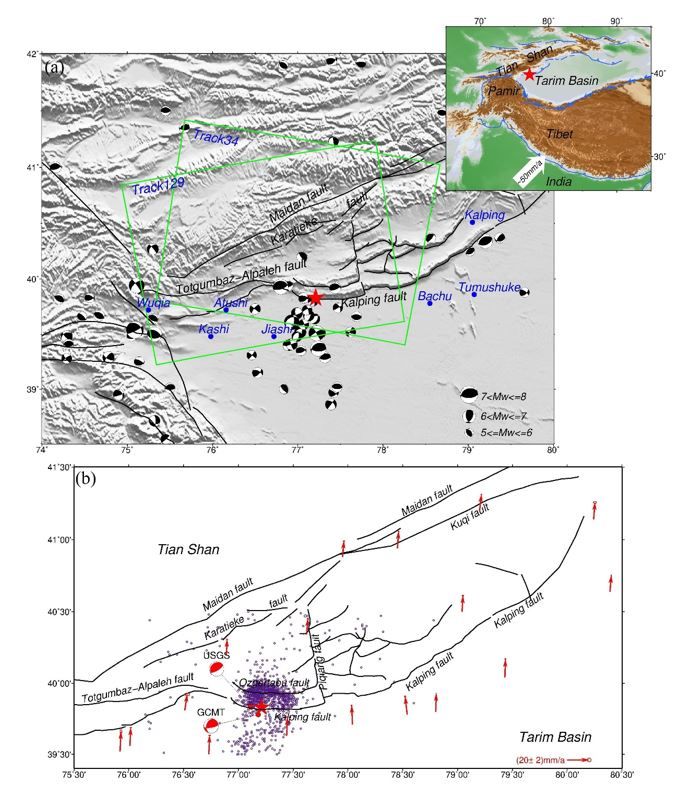
area (Figure 2a and 2b). The maximum and minimum LOS displacements are 5.3 cm and -4.2 cm for the
T129A interferogram and are 7.2 cm and -3 cm for the T34D interferogram, respectively (Figure 2c and
2d). It indicates that the earthquake produced obvious deformation over an area of approximately 40 km
by 30 km. The coseismic deformation eld is distributed along the Kalping fault and the Ozgertaou fault.
The long axis of the deformation eld is approximate EW, which is consistent with the strike of the
Kalping fault and the Ozgertaou fault. The deformation in the epicentral area between the Kalping fault
and the Ozgertaou fault is large and dominated by uplift along LOS. The epicentral area near the
Ozgertaou fault and its north side are dominated by subsidence uplift along LOS. The south side of the
Page 4/19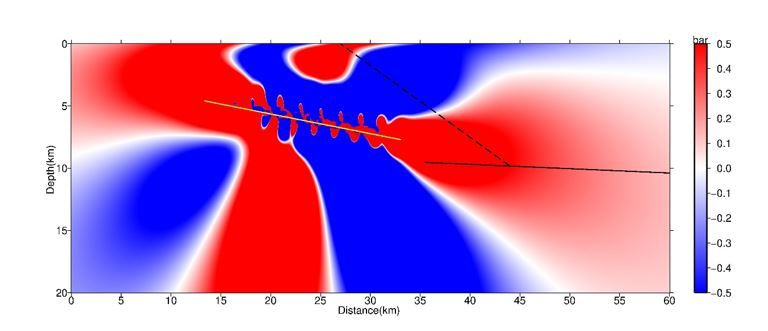
Kalping fault is deformed slightly. It is uncertain which fault is the seismogenic fault from InSAR
interferogram.

The InSAR coseismic deformation eld consists of millions of points and has a high spatial correlation
between adjacent observations. It is ine cient to use all of them to invert for the slip model. The LOS
coseismic deformation eld is rstly masked with a coherence coe cient 0.5 to obtain high-quality
deformation data. Then a quadtree algorithm is used to down-sample the data sets to reduce the point
number and improve the computational e ciency (Jónsson et al. 2002). Despite the dramatic reduction
in quantity, the major features of the original interferograms are well retained in the down-sampled
observations (Figure S1). The unit vector of each point is also calculated from the individual incidence
and azimuth angle.

Fault Geometry And Slip Model
A two-step strategy is used to construct the coseismic source model. Firstly, a nonlinear inversion is
applied to obtain the optimized fault geometry by assuming a uniform slip on a rectangular fault.
Secondly, the distributed slips are estimated by a linear inversion base on a discretized fault plane.

3.1 Fault Geometry Optimization

Based on an elastic and half-space dislocation model, a Multi peak Particle Swarm Optimization (MPSO)
algorithm is used to invert for the nine fault parameters consisting of location, length, width, depth, strike,
dip, rake and slip by minimizing the mis ts between the observed and the model predictions (Feng et al.
2010). The weighted ratio of the ascending and descending datasets is set by 1:1. On the basis of the
focal mechanism solutions from different agencies and distribution of aftershocks, we set the strike and
dip as 270°and 15°for the initial fault parameters. An optimized plane fault of 22.7 km × 4.7 km with
uniform slip of 0.37 m is derived from MPSO inversion. The strike, dip and rake angle are 274.8°, 8.8° and
105.6°, respectively. The Monte Carlo method is used to estimate the uncertainties of the fault parameters
(Table 1, Figure S2) (Funning et al. 2005). Data from 100 simulations perturbed with noise were used to
estimate the standard deviation from their distributions. The results show that the inversion is stable and
robust. The results indicate that the rupture of this earthquake is dominated by a thrust fault.

3.2 Slip Model Inversion

Based on a variable-slip distribution model, we used the constrained least-squares principle and the
Steepest Descent Method (SDM) to invert for rakes and coseismic slips on discretized subfault (Wang et
al. 2013). SDM is an iterative optimization algorithm that usually does not require a good initial
approximation to achieve computation converge. The step proportional to negative of the gradient is
chosen to achieve the maximum amount of decrease of the objective function at each step.

The dimension of the fault plane is expanded to 50 km along the strike and 20 km along the down-dip
direction to avoid edge effects. It is divided into 25 × 10 subfaults by 2 km × 2 km for each patch. The

                                                   Page 5/19
position, strike and dip of each subfault are xed at the optimized values derived from MPSO. We set the
rake to a range from 45° to 135° account for the focal mechanisms from GCMT and USGS as well as the
result of the nonlinear inversion from MPSO. The depth of the fault top position is 4.58 km. The
constrained least squares method is used to solve the following objection function (Wang et al. 2013).
F(s)=||Gs-d||2+α2||Hτ||2
where G is the Green function relating unit model slip to the predicted displacement, s is the slip on each
patch, d is the observed LOS displacement of InSAR, α is the smoothing factor, H is the nite difference
approximation of the Laplacian operator, and τ is the shear stress drop. L-curve method is used to
determine the optimal smoothing factor, which can balance the roughness of the fault slip and the model
mis t (Figure S3). Finally, the slip model of the Jiashi earthquake is calculated (Figure 3). The signi cant
slip area is distributed in 8 ~ 42 km along the strike and 4 ~ 16 km along the down-dip direction. The
maximum slip is 0.29 m and located at 39.91 °N, 77.30 °E in a depth of 6.30 km beneath the earth's
surface (Figure 3). The total seismic moment estimated from the optimal slip model is 1.688×10¹⁸ Nm,
corresponding to a magnitude of Mw 6.1. The correlation coe cient between the observations and
simulations is 95.62%. The Okada dislocation model is used for forward modeling (Okada, 1985). The
root-mean-square (RMS) residual between observations and simulations is 5 mm for ascending datasets
and 5 mm for descending datasets, respectively (Figure 4).
Static Coulomb Stress Changes
The seismogenic fault usually generates considerable static coseismic deformations and cause static
coseismic stress changes in the near and far- eld after a strong earthquake occurred (Xiong et al. 2019).
Computing and analyzing the coseismic Coulomb stress changes is an important means to evaluate the
seismic effect on the surrounding faults.
The PSCMP/PSGRN software is used to calculate the coseismic stress changes caused by the Jiashi
earthquake (Wang et al. 2006). The effective friction coe cient is set at a common value of 0.4 (King et
al. 1994). The shear modulus is assumed to be 30 GPa. The plane fault inverted above is used as the
receiver fault in the calculation of Coulomb stress. The Coulomb stress changes along a pro le across
the southern edge of the Kalpingtag nappe show that the area below the rupture of the Jiashi earthquake
is a stress-enhancing zone (Figure 5).
Discussion
5.1. Planar fault vs. listric fault
The deep seismic-re ection pro les showed that the Kalping fault is a listric structure with at and ramp
segments. The dip of the ramp near the surface is 30 ~ 70° (Qu et al. 2003). The dip of the at segment is
2 ~ 3° at a depth of 9 km (Yang et al. 2008; Gao et al. 2013). Therefore, a listric fault geometry is used to
Page 6/19invert for the slip model by SDM (Figure S4). The result showed that the RMS is 7 mm for ascending
datasets and 6 mm for descending datasets, respectively. The data-model correlation is 93.45%.
The slip models from the planar fault (Figure3) and the listric fault (Figure S5) both demonstrate that the
Jiashi earthquake is a shallow rupture and caused by a thrust fault with slight strike slips. Considering
that the planar fault model has the minimum RMS and is more concise, we take the planar fault model as
our preferred source model. The Kalping fault is the seismogenic fault since the position of the modeled
fault is close to it.
The preferred model in this study implies the seismogenic fault is very at with a dip angle 8.8°, which is
consistent with the geometrical model of Zhou (2013) who proposed a low-dipping fault of 8.2° for the
Kalping thrust system. Studies of geology and seismic re ection pro le proposed that the Kalping fault
has a listric geometry with typical characteristics of the thin-skinned tectonics (Qu et al. 2003). For thin-
skinned tectonics, the sedimentary cover of the thrust sheets is detached from its crystalline basement
along a décollement layer. The thickness of the detached cover sediments is typically on the order of 1 to
10 km (P ffner, 2017). Here, the coseismic slips of the Jiashi event are distributed in a low dip fault 5~7
km deep underground. The InSAR coseismic measurements further determined the exact geometry of the
listric structure for Kalping fault in this study. It is suggested that the mainshock occurred on the at
segment of the listric fault, while the ramp segment did not rupture.
5.2. A shallow event
Results show that the maximum slip of the Jiashi earthquake occurs at the depth 6.3 km which is very
shallow. It is contributed to the fault geometry and regional geological settings. The thin-skinned
tectonics with shallow décollement structure is the main cause of shallow earthquakes. On the other
hand, shallow earthquakes often occur in ancient craton regions, such as the southwest region of
Western Australia (Langston 1987; Dawson et al. 2008) and Lake Ontario region in North America (Ma
and Atkinson 2006; Kim et al. 2006), where a large number of shallow earthquakes with a depth of less
than 5 km occurred. Due to the strong strength of the cold and hard ancient shield, the rock strength in all
parts except near the surface exceeds the surrounding deviatoric stress. Driven by deviatoric stress, the
fault rupture is di cult to expand to the deep, so it can only rupture at the shallow part to form shallow
earthquakes (Langston 1987; Luo et al. 2011). The Tarim Basin, developed on the crystalline basement,
has the property of stable craton, which is conducive to form shallow earthquakes in the area.
In orogenic belts, the normal stress due to the large mountain ranges makes the ramp with higher dip
angles tend to have greater frictional resistance than the at with lower dip angles (Styron and Hetland
2015; Yue et al. 2017; Tan et al. 2018). Thus, most earthquakes tend to nucleate on a at with a lower dip
angle, and then expand to a deeper or shallower region (Hubbard et al. 2016). In this context, earthquakes
in orogenic belts mostly occur on low-angle detachment faults with a burial depth larger than 10 km, and
only a few ruptures of strong earthquakes can expand to ramps near the surface. Therefore, shallow
earthquakes larger than Mw 6.0 occurring at the transition zone from fault ramp to fault at
independently in orogenic belts are rare.
Page 7/195.3. Regional seismic risk assessment
Being the front edge of the Kalpingtag thrust system, the slip rate of the Kalping fault is only 1 ~ 2 mm/a
since late Cenozoic, which is just a quarter of the subduction rate of the Tarim Basin in this region (Yang
et al. 2008). It indicates that the deformation pattern of the Kalpingtag thrust system is different from
that of other orogenic belts. Deformation of most orogenic belts is dominated by front thrust faults and
deep detachment faults, while internal faults within orogenic belts are weakly deformed such as the
Himalayan orogeny belt (Stevens et al. 2015) and the New Guinea Highlands Fold-and-Thrust Belt
(Koulali et al. 2015). However, the Kalping fault and the internal faults of the Kalpingtag nappe have been
active since late Quaternary, and the tectonic activities have not completely migrated to the frontal fault
of the nappe (Wu et al. 2014). This special deformation pattern makes the faults of Kalpingtag nappe
have a low slip rate of 1 ~ 3 mm/a, but all faults can accumulate stress and trigger earthquakes. The
coseismic Coulomb stress of this earthquake increased the stress of adjacent faults, but the magnitude is
not large. For example, the Ozgertaou fault located on the north side of the Kalping fault has a stress
disturbance of up to 0.7 bar (Figure 5).The faults in the Kalpingtag nappe are locked, accumulating
elastic strain, but the detachment fault under the south Tian Shan is free to creep due to the weakening of
friction under high-temperature conditions, driving the convergent deformation of the Kalping block (Li et
al. 2015). Li et al. (2015) suggested that the locked area of the detachment fault extends to the north of
Maidan fault based on the interseismic deformation of InSAR and GPS, while Yang et al. (2008) and Qiao
et al. (2017) proposed that the locked point of the detachment fault is at the Totgumbaz–Alpaleh fault.
The two views are slightly different, but it indicates that the rupture of the Jiashi earthquake is far from
the locked point of the detachment fault. The Jiashi earthquake signi cantly increased the stress in the
locked area of the detachment fault (Figure 5). The maximum stress disturbance is 10.1 bar, which is
located at the deep margin of the rupture area. If the remaining locked area of the deep detachment fault
is completely ruptured, the deformation width will exceed 50 km, and the released seismic moment is
equivalent to an Mw 7.5 earthquake (Wells 1994).
Conclusion
Based on the coseismic deformation of the 2020 Jiashi Mw 6.0 earthquake obtained from ascending and
descending InSAR observations of Sentinel-1A, the fault geometry, slip model and coseismic Coulomb
stress changes are calculated.
The source model shows that the Jiashi earthquake occurred on the Kalping fault which is a thrust fault
with a listric structure. The main shock only ruptured the at segment of the listric fault and failed to
deform the ramp segment. The coseismic slip is mainly concentrated on a patch of 34 km × 12 km in a
depth of 5 ~ 7 km. The maximum slip is 0.29 m at a depth of 6.3 km. The released moment is 1.688 ×
1018 Nm, corresponding to a magnitude of Mw 6.1.
The coseismic Coulomb stress changes have enhanced the stress on the deep margin of the Jiashi
earthquake rupture area, indicating that the seismic risk of this region is increasing. Considering the
Page 8/19relatively few aftershocks after the mainshock and strong earthquake swarm records were recorded in
Jiashi area, there is still the possibility of another strong earthquake in this region in the future.
Additional File
Additional le 1. Figure S1. (a) and (c) represent observations of ascending and descending data. (b) and
(d) represent the down-sampling results of ascending and descending data. Figure S2. Uncertainties of
the fault parameters computed using the Monte Carlo method. X and Y coordinates are in UTM (zone 43).
X, Y, and Depth represent the location of the midpoint of the top boundary of the fault plane. Figure S3.
Trade-off curve of relative tting and roughness for the planar fault. Figure S4. (a) The geometry of the
planar fault and the listric fault. The green line represents the planar fault. The blue line represents the
listric fault. The dashed red lines represent the rupture of the Jiashi earthquake on the two faults,
respectively. For the listric fault, the dip of the ramp segment is set to 52° determined by a grid search (c).
Based on the results of deep seismic-re ection pro les, the dip of the at segment is set to 2°, and the
depth of the top boundaries of the at segment is set to 9 km. The width of the at segment is set to 20
km. The elevation difference is magni ed 10 times to represent the topography. (b) The surface rupture
(the blue line) of the listric fault, which is xed based on the fault datasets from the Institute of Geology,
CEA. Its strike is xed at 274.8° based on the nonlinear inversion. (c) Distribution of mis t and various top
dip angle. (d) Trade-off curve of relative tting and roughness for the listric fault. Figure S5. Coseismic
slip model of the Jiashi earthquake with the listric fault. The depth of 9 km is the boundary between the
ramp segment and the at segment.
Declarations
Ethics approval and consent to participate
Not applicable
Consent for publication
Not applicable
List of abbreviations
InSAR: Interferometric Synthetic Aperture Radar; LOS: line of sight; CENC: China Earthquake Network
Center; USGS: United States Geological Survey; GCMT: Global Centroid Moment Tensor; ESA: Europe
Space Agency; TOPS: terrain observation with progressive scans; IW: Interferometric Wide; DEM: digital
elevation model; SLC: Single Look Complex; SRTM: Shuttle Radar Topographic Mission; RMS: root‐mean‐
square; CEA: China Earthquake Administration
Availability of data and materials
Page 9/19The datasets used during the current study are available from the corresponding author on a reasonable
request.
Competing interests
The authors declare that they have no competing interests.
Funding
This research was funded by the Scienti c Research Fund of Institute of Seismology and Institute of
Crustal Dynamics, CEA (IS2018126282, IS2018126285), the National Natural Science Foundation of
China (41731071, 41874015), and the Spark Program of Earthquake Technology of CEA (XH18054).
Authors' contributions
PY processed SAR data and analyzed the results; WC provided technical support and useful advice for
InSAR processing; WX helped analyze and interpret the results; JL provided the information about the
tectonic setting; ZJ contributed to data curation; PY, XQ, WC and JL contributed to funding acquisition; XQ
and DW contributed to methodology; ZN contributed to project administration; PY wrote the original draft;
XQ and WX revised the manuscript. All authors read and approved the nal manuscript.
Acknowledgments
Appreciate SAR data provided by ESA. SDM program provided by professor Wang Rongjiang is used to
invert for the source model. Thanks to Dr. Liu Gang for his helpful advice. Some gures are created by
Generic Mapping Tools (Wessel and Smith 1995).
References
1. Abdrakhmatov, K. Y., Aldazhanov, S. A., Hager, B. H., Hamburger, M. W., Herring, T. A., Kalabaev, K. B.,
... & Reilinger, R. E. (1996) Relatively recent construction of the Tien Shan inferred from GPS
measurements of present-day crustal deformation rates. Nature, 384(6608), 450-453.
2. Allen, M. B., Vincent, S. J., & Wheeler, P. J. (1999) Late Cenozoic tectonics of the Kalpingtage thrust
zone: interactions of the Tien Shan and Tarim Basin, northwest China. Tectonics, 18(4), 639-654.
3. Avouac, J. P., Tapponnier, P., Bai, M., You, H., & Wang, G. (1993) Active thrusting and folding along the
northern Tien Shan and late Cenozoic rotation of the Tarim relative to Dzungaria and Kazakhstan.
Journal of Geophysical Research: Solid Earth, 98(B4), 6755-6804.
4. Chen, W., Qiao, X., Xiong, W., Yu, P., & Nie, Z. (2019) The 2007 Ning'er Mw 6.1 Earthquake: A Shallow
Rupture in Southwest China Revealed by InSAR Measurements. Earth and Space Science, 6, 2291-
2302. https://doi.org/10.1029/2019EA000555
5. Dawson, J., Cummins, P., Tregoning, P., & Leonard, M. (2008) Shallow intraplate earthquakes in
Western Australia observed by interferometric synthetic aperture radar. Journal of Geophysical
Page 10/19Research: Solid Earth, 113, B11408, doi:10.1029/2008JB005807
6. Elliott, J. R., Jolivet, R., González, P. J., Avouac, J. P., Hollingsworth, J., Searle, M. P., & Stevens, V. L.
(2016) Himalayan megathrust geometry and relation to topography revealed by the Gorkha
earthquake. Nature Geoscience, 9(2), 174-180.
7. Farr, T. G., & Kobrick, M. (2000) Shuttle radar topography Mission produces a wealth of data. Eos,
Transactions American Geophysical Union, 81(48), 583–585.
https://doi.org/10.1029/EO081i048p00583
8. Feng,W. P., Li, Z. H. (2010) A Novel Hydrid PSO/Simplex algorithm for determining earthquake source
parameters using InSAR data. Progress in Geophys., 25(4): 1189~1196. DOI: 10.3969/j.issn.1004-
2903.2010.04.007
9. Funning, G. J., Parsons, B., Wright, T. J., Jackson, J. A., & Fielding, E. J. (2005). Surface
displacements and source parameters of the 2003 Bam (Iran) earthquake from Envisat advanced
synthetic aperture radar imagery. Journal of Geophysical Research: Solid Earth, 110(B9).
10. Gao, R., Hou, H., Cai, X., Knapp, J. H., He, R., Liu, J., ... & Roecker, S. W. (2013) Fine crustal structure
beneath the junction of the southwest Tian Shan and Tarim Basin, NW China. Lithosphere, 5(4), 382-
392.
11. Goldstein, R. M., & Werner, C. L. (1998) Radar interferogram ltering for geophysical applications.
Geophysical Research Letters, 25(21), 4035–4038. https://doi.org/10.1029/1998GL900033
12. Hubbard, J., Almeida, R., Foster, A., Sapkota, S. N., Bürgi, P., & Tapponnier, P. (2016) Structural
segmentation controlled the 2015 Mw 7.8 Gorkha earthquake rupture in Nepal. Geology, 44(8), 639-
642.
13. Jónsson, S., Zebker, H., Segall, P., & Amelung, F. (2002) Fault slip distribution of the 1999 M w 7.1
Hector Mine, California, earthquake, estimated from satellite radar and GPS measurements. Bulletin
of the Seismological Society of America, 92(4), 1377-1389.
14. Kim, W. Y., Dineva, S., Ma, S., & Eaton, D. (2006) The 4 August 2004, Lake Ontario, earthquake.
Seismological Research Letters, 77(1), 65-73.
15. King, G. C., Stein, R. S., & Lin, J. (1994) Static stress changes and the triggering of earthquakes.
Bulletin of the Seismological Society of America, 84(3), 935–953.
16. Koulali, A., Tregoning, P., McClusky, S., Stanaway, R., Wallace, L., & Lister, G. (2015) New Insights into
the present-day kinematics of the central and western Papua New Guinea from GPS. Geophysical
Journal International, 202(2), 993-1004.
17. Li J, Qiao X J, Yang S M, et al. (2015) Detachment fault model characterized for the 3D surface
displacement eld in the southwestern Tian Shan[J]. Chinese Journal Geophysics, 058(010):3517-
3529. Doi:10.6038/cjg20151008.
18. Li, S., Wang, Q., Yang, S., Qiao, X., Nie, Z., Zou, R., ... & Chen, G. (2018) Geodetic imaging mega-thrust
coupling beneath the Himalaya. Tectonophysics, 747, 225-238.
19. Langston, C. A. (1987) Depth of faulting during the 1968 Meckering, Australia, earthquake sequence
determined from waveform analysis of local seismograms. Journal of Geophysical Research: Solid
Page 11/19Earth, 92(B11), 11561-11574.
20. Li, Z., Elliott, J. R., Feng, W., Jackson, J. A., Parsons, B. E., & Walters, R. J. (2011) The 2010 MW 6.8
Yushu (Qinghai, China) earthquake: Constraints provided by InSAR and body wave seismology.
Journal of Geophysical Research: Solid Earth, 116, B10302, doi:10.1029/2011JB008358.
21. Luo Y, Ni S, Zeng X, et al. (2011) The M5.0 Suining-Tongnan (China) earthquake of 31 January 2010:
A destructive earthquake occurring in sedimentary cover. Chinese Sci Bull, 56: 57-62. Doi:
10.1007/s11434-010-4276-z
22. Ma, S., & Atkinson, G. M. (2006) Focal depths for small to moderate earthquakes (m N≥ 2.8) in
Western Quebec, Southern Ontario, and Northern New York. Bulletin of the Seismological Society of
America, 96(2), 609-623.
23. Ma, Y., Qiao, X., Chen, W., & Zhou, Y. (2018). Source model of 2016 Mw6. 6 Aketao earthquake,
Xinjiang derived from Sentinel-1 InSAR observation. Geodesy and Geodynamics, 9(5), 372-377.
24. OkadaY. Surface deformation due to shear and tensile faults in a half space. Bull. Seism.Soc. Am.
,1985,75:1135~1154
25. Pepe, A., & Lanari, R. (2006) On the extension of the minimum cost ow algorithm for phase
unwrapping of multitemporal differential SAR interferograms. IEEE Transactions on Geoscience and
Remote Sensing, 44(9), 2374–2383. https://doi.org/10.1109/TGRS.2006.873207
26. P ffner, Othmar-Adrian (2017). Thick-Skinned and Thin-Skinned Tectonics: A Global Perspective.
Geosciences, 7(3), pp. 1-89. MDPI 10.3390/geosciences7030071
27. Qiao X, Wang Q, Yang S, et al. (2014) Study on the focal mechanism and deformation characteristics
for the 2008 Mw6.7 Wuqia earthquake, Xinjiang by InSAR. Chinese Journal Geophysics, 57(6):1805-
1813. Doi:10.6038/cjg20140612.
28. Qiao, X., Du, R., Hua, X., Wang, X., Wang Q. (2000) Monitoring Present-day Tectonic Deformation by
GPS in the Northeast Pamir, Xinjiang. EARTHQUAKE RESEARCH IN CHINA, 016(4):342-351.
29. Qiao, X., Yu, P., Nie, Z., Li, J., Wang, X., Kuzikov, S. I., ... & Yang, S. (2017) The crustal deformation
revealed by GPS and InSAR in the northwest corner of the Tarim Basin, northwestern China. Pure and
Applied Geophysics, 174(3), 1405-1423.
30. Qu, G., Li Y., Chen J., et al. (2003) Geometry, kinematics and tectonic evolution of Kalpingtage thrust
system. Earth Science Frontiers, 010(U08), P.142-152.
31. Scholz CH (1990) The mechanics of earthquakes and faulting. Cambridge Univ Press, NewYork, p
439.
32. Stevens, V. L., & Avouac, J. P. (2015) Interseismic coupling on the main Himalayan thrust.
Geophysical Research Letters, 42(14), 5828-5837.
33. Simons, M., Fialko, Y., & Rivera, L. (2002) Coseismic deformation from the 1999 M w 7.1 Hector Mine,
California, earthquake as inferred from InSAR and GPS observations. Bulletin of the Seismological
Society of America, 92(4), 1390-1402.
Page 12/1934. Styron, R. H., & Hetland, E. A. (2015) The weight of the mountains: Constraints on tectonic stress,
friction, and uid pressure in the 2008 Wenchuan earthquake from estimates of topographic loading.
Journal of Geophysical Research: Solid Earth, 120(4), 2697-2716.
35. Tan, X., Yue, H., Liu, Y., Xu, X., Shi, F., Xu, C., ... & Hao, H. (2018) Topographic loads modi ed by uvial
incision impact fault activity in the Longmenshan thrust belt, eastern margin of the Tibetan Plateau.
Tectonics, 37(9), 3001-3017.
36. Thompson, S. C., Weldon, R. J., Rubin, C. M., Abdrakhmatov, K., Molnar, P., & Berger, G. W. (2002) Late
Quaternary slip rates across the central Tien Shan, Kyrgyzstan, central Asia. Journal of Geophysical
Research: Solid Earth, 107(B9), 2203, doi:10.1029/2001JB000596
37. Wang, Q., Ding, G., Qiao, X., Wang, X. (2000) Research on present crustal deformation in the southern
Tianshan (Jiashi), China by GPS geodesy. ACTA SEISMOLOGICA SINICA, 3:263-270.
38. Wang, Q. (2007) Characteristics of Structural deformation and its Controlling Factors of Centraland
Western Segment in the front of the South Tian Shan. Dissertation, Zhejiang University.
39. Wang Q, Qiao X, Lan Q, et al. (2011) Rupture of deep faults in the 2008 Wenchuan earthquake and
uplift of the Longmen Shan. Nature Geoscience, 4(9), 634-640.
40. Wang, R. J., Lorenzo-Martin, F., & Roth, F. (2006) PSGRN/PSCMP—a new code for calculating co- and
post-seismic deformation, geoid and gravity changes based on the viscoelastic-gravitational
dislocation theory. Computers & Geosciences, 32(4), 527–541
41. Wang, R., Diao, F., & Hoechner, A. (2013). SDM-A geodetic inversion code incorporating with layered
crust structure and curved fault geometry. EGUGA, EGU2013-2411.
42. Wells, D. L., & Coppersmith, K. J. (1994) New empirical relationships among magnitude, rupture
length, rupture width, rupture area, and surface displacement. Bulletin of the seismological Society of
America, 84(4), 974-1002.
43. Werner, C., Wegmüller, U., Strozzi, T., & Wiesmann, A. (2000). Gamma SAR and interferometric
processing software. In Proceedings of the ERS ENVISAT Symposium, Gothenburg, Sweden, 16–20
October 2000.
44. Wessel P, Smith WHF (1995) New version of the Generic Mapping Tools released. EOS Trans AGU
76:329
45. Weston, J., Ferreira, A. M., & Funning, G. J. (2012) Systematic comparisons of earthquake source
models determined using InSAR and seismic data. Tectonophysics, 532, 61-81.
46. Wright, T. J., Lu, Z., & Wicks, C. (2003) Source model for the Mw 6.7, 23 October 2002, Nenana
Mountain Earthquake (Alaska) from InSAR. Geophysical Research Letters, 30(18), 1974,
doi:10.1029/2003GL018014 .
47. Wu C., Alimujiang, Dai X., Wu G., Chen J. (2014) Discovery of the late-quaternary activity along the
eastern segment of maidan fault in southwest Tianshan and its tectonic implication. SEISMOLOGY
AND GEOLOGY, 36(4), 976-990.
48. Xiong, W., Chen, W., Wen, Y., Liu, G., Nie, Z., Qiao, X., & Xu, C. (2019) Insight into the 2017 Mainling M
w 6.5 earthquake: a complicated thrust event beneath the Namche Barwa syntaxis. Earth, Planets
Page 13/19and Space, 71(1), 71.
49. Xiong, W., Chen, W., Zhao, B., Wen, Y., Liu, G., Nie, Z., ... & Xu, C. (2019) Insight into the 2016 Menyuan
M w 5.9 Earthquake with InSAR: A Blind Reverse Event Promoted by Historical Earthquakes. Pure and
Applied Geophysics, 176(2), 577-591.
50. Yang, S., Li, J., & Wang, Q. (2008) The deformation pattern and fault rate in the Tienshan Mountains
inferred from GPS observations. Science in China Series D: Earth Sciences, 38(7), 872–880.
51. Yang, X., Deng, Q., Zhang P., Xu X. (2008) Crustal shortening of major nappe structures on the front
margins of the Tian Shan. SEISMOLOGY AND GEOLOGY, 2008, 030(001):111-131.
52. Yue, H., Simons, M., Duputel, Z., Jiang, J., Fielding, E., Liang, C., ... & Samsonov, S. V. (2017) Depth
varying rupture properties during the 2015 Mw 7.8 Gorkha (Nepal) earthquake. Tectonophysics, 714,
44-54.
53. Zubovich, A. V., Wang, X. Q., Scherba, Y. G., Schelochkov, G. G., Reilinger, R., Reigber, C., ... & Li, J.
(2010) GPS velocity eld for the Tien Shan and surrounding regions. Tectonics, 29(6), TC6014,
doi:10.1029/2010TC002772.
54. Zhang Peizhen, Deng Qidong, Yang Xiaoping, Peng Sizhen, Xu Xiwei, & Feng Xianyue. (1996) Late
Cenozoic Tectonic Deformation Mechanism along the Tianshan Mountain, Northwestern China.
EARTHQUAKE RESEARCH IN CHINA, (2), 2.
55. Zhao, B., Bürgmann, R., Wang, D., Tan, K., Du, R., & Zhang, R. (2017) Dominant controls of downdip
afterslip and viscous relaxation on the postseismic displacements following the Mw7. 9 Gorkha,
Nepal, earthquake. Journal of Geophysical Research: Solid Earth, 122(10), 8376-8401.
56. Zhou, D. (2013) Characteristics of Present-day Crustal Deformation and Seismic Hazard Analysis in
the Western and Central Tian Shan. Dissertation, Institute of Geology, China Earthquake
Administration.
Tables
Table 1. The source parameters for the Jan. 19, 2020 Mw 6.0 Jiashi earthquake from different agencies
Page 14/19Source Lat Lon Depth Nodal plane I Nodal plane II Mw
(°) (°) (Km) Strike Dip Rake Strike Dip Rake
(°) (°) (°) (°) (°) (°)
USGS 39.83577.1119.5 221 20 72 60 71 96 6.03
(W-phase)
USGS 39.83577.114.0 262 9 105 67 81 88 6.05
(body wave)
GCMT 39.78 77.1812 196 37 30 81 72 123 6.0
GFZ 39.80 77.1010 222 16 77 56 75 94 6.1
InSAR 39.89 77.304.97 275 17 84.96- - - 6.09
(a*)
InSAR 39.90 77.304.15 275 16 88.72- - - 6.0
(b*) (c*)
Note: a* represents the planar fault model, b* represents the listric fault model and its dip angle, c* is the
average of the dip angle at the top and the bottom of the fault.
Nodal plane I Nodal plane II
Table 2. The details of the Sentinel-1 images used in this study
Flight directionTrackMaster dateSlave date Time interval (d)Perpendicular baseline (m)
Descending 34 2020-01-10 2020-01-2212 -57
Ascending 129 2020-01-16 2020-01-2812 12
Figures
Page 15/19Figure 1
(a) Distribution map of topography, fault, major historical earthquake and InSAR data in the Jiashi areas.
The black beach balls are focal mechanism solutions of the historical earthquake from the GCMT
catalog. The red star marks the epicenter of the Jiashi earthquake from CENC. The green box is the
coverage of Sentinel SAR data. The blue dots represent the major cities. The black lines are faults that are
from the display system of active faults in China provided by the Institute of Geology, China Earthquake
Page 16/19Administration. (http://www.neotectonics.cn/arcgis/apps/webappviewer/index.html?
id=3c0d8234c1dc43eaa0bec3ea03bb00bc). (b) Tectonic map of the Kalping thrust system. The red
beach balls are focal mechanism solutions of the Jiashi earthquake from USGS and GCMT. The purple
circles represent the aftershocks till 17 June 2020 from CENC. The red arrows represent the horizontal
velocity eld relative to the Eurasian plate (from CMONOC, between 1999 and 2019) provided by the
GNSS Data, Products and Services Platform (http://www.cgps.ac.cn/) of the China Earthquake
Administration.
Figure 2
Coseismic interferograms and deformation elds of the 2020 Jiashi earthquake. (a) and (c), (b) and (d)
represent the coseismic interferograms and LOS deformation elds along ascending and descending
orbits, respectively.
Page 17/19Figure 3
Coseismic slip model of the Jiashi earthquake.
Figure 4
Page 18/19Observation, simulation and residual from ascending (a-c) and descending (d-f) InSAR data and
inversion.
Figure 5
The Coulomb stress change along a pro le across the southern margin of the Kalpingtag thrust system.
The yellow line reprents the planar fault we used. The black line reprents the décollement fault. The dased
black line reprents the Ozgertaou fault (Zhou, 2013).
Supplementary Files
This is a list of supplementary les associated with this preprint. Click to download.
EPSJiashiearthquakegraphicalabstract0825.docx
AdditionalFile10825.docx
Page 19/19You can also read