Modelling Volatility Persistence and Asymmetry of Naira-Dollar Exchange Rate
←
→
Page content transcription
If your browser does not render page correctly, please read the page content below
CBN Journal of Applied Statistics Vol. 9 No. 1 (June, 2018)                141-165

       Modelling Volatility Persistence and Asymmetry of
                              Naira-Dollar Exchange Rate

Mutiu A. Oyinlola1
This paper modelled the volatility persistence and asymmetry of naira-dollar
exchange rate in interbank and Bureau de Change (BDC) using monthly data
between January 2004 and November 2017. The study employed General-
ized Autoregressive Conditional Heteroscedasticity [GARCH (1,1)], Thresh-
old GARCH [TGARCH (1,1)] and Exponential GARCH [EGARCH (1,1)].
The results of Bai-Perron (2003) structural break identified two significant
breaks in each market. Interestingly, the breaks, particularly for the interbank
exchange rate(December, 2014 and January, 2015), seem to have coincided
with the period of depreciation in the country’s exchange rate which could be
linked to the precipitous movement in the international crude oil prices. The
findings showed that persistence is generally explosive in the BDC market as
compared to interbank market where the persistence was high but not explosive
especially under asymmetric models. Based on our model selection criteria,
the symmetric GARCH model, appears to be better than the asymmetric ones
in dealing with exchange rate volatility in the interbank market while asym-
metric GARCH, especially TGARCH, seems to be better in the case of BDC
market. By implication, it is important that the monetary authority consid-
ers the developments and reactions of the markets to news most especially
the BDC, when designing appropriate exchange rate policies for the country.

 Keywords: Bureau De Change (BDC); Exchange rate; Interbank Market;
Volatility modelling.
JEL Classification: F0; F310; G150; G190.

1.0 Introduction
A key issue that has attracted considerable attention in international eco-
nomics is modelling the dynamics of exchange rate in an economy. Inspite of
the elaborate and detailed literature on volatility of financial series, divergent
views still exist on the major causes of economic fluctuations in developing
countries. Some studies in the literature have explained these fluctuations
through the perspective of inflation and oil price volatility (See Fasanya and
Adekoya 2017; Salisu and Fasanya, 2013); others have considered exchange
   1
   Corresponding author: Department of Economics, University of Ibadan, Nigeria,
mutiu− oyinlola@yahoo.com.

                                                141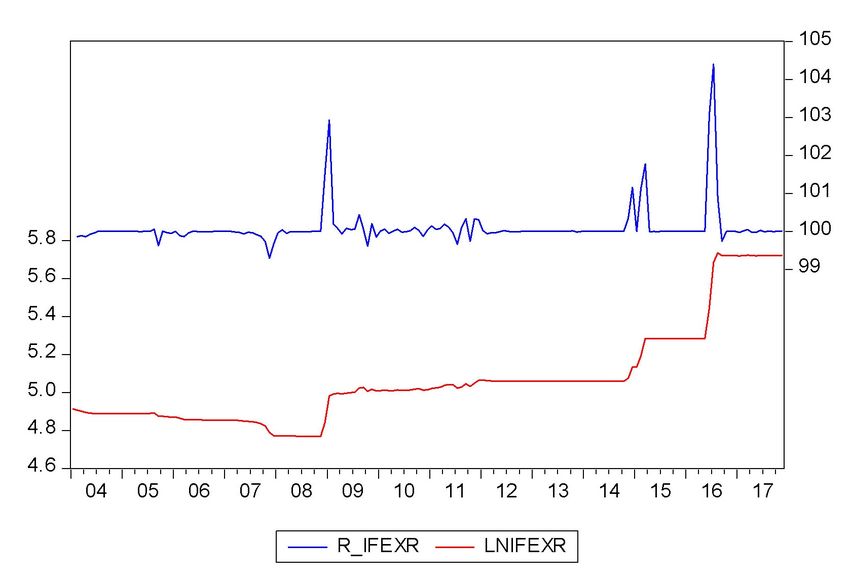
Modelling Volatility Persistence and Asymmetry of Naira-Dollar Exchange Rate   Oyinlola

volatility as the major cause of economic instability (See Bala and Asemota,
2013; Adeoye and Atanda, 2012). There are still some outstanding issues
requiring further investigation. For instance, there is no consensus on the
appropriate measure of exchange rate volatility in an economy. This lack of
consensus is attributable to a number of factors. While theory provides some
direction as to fundamental factors, the choice of measures of such factors are
within the purview of the empiricists. In addition, the choice of measures is
influenced to some extent by the constraint imposed by the scope of analysis.
In other words, considerable attention should be paid to the period in which
the variability will be captured; if the volatility is conditional, and the level
of correlation between unexpected movement in the exchange rate and its
predicted value.

The degree of exchange rate volatility in emerging markets such as Nige-
ria is largely driven by the United State dollar, a major trading currency.
In the last two decades, the vacillations have been considerable and often
unrelated to economic fundamentals. This prompted monetary authorities
in most developing countries to intervene in the markets regularly with the
objective of stabilizing the exchange rate. However, such interventions are
often done without any clear sense of a sustainable equilibrium. In addition,
the interventions operate with lags and sometimes too late to forestall severe
exchange rate misalignment and volatility. The natural reactions to these
imbalances include economic fluctuations, protectionist trade pressures, and
inevitably sharp exchange rate policy reversals. Indeed, the exchange rate
instability experienced in Nigeria especially between 2015 and 2017 exposed
all these foregoing challenges.

It is incontrovertible that economic activities in Nigeria rely mostly on im-
ported inputs. Coupled with this, the average consumer has excessive pref-
erence for foreign goods due to product quality disparity. On the exports
side, Nigeria’s main export commodity is oil that is subject to vagaries of
international market challenges and quota allocations. This has had a mod-
erating impact on the flows of foreign exchange and thus led to high exchange

                                              142
CBN Journal of Applied Statistics Vol. 9 No. 1 (June, 2018) 141-165
rate volatility over the years. In other words, exchange rate volatility in an
import dependent economy may lead to huge losses or gains to government
and domestic investors that engage frequently in foreign trade and hence are
confronted with greater risk of uncertainty about the exchange rate. Thus,
the extent of exchange rate volatility is of great importance to both the pol-
icy makers and investors.
A plethora of studies have extensively explored exchange rate volatility in
Nigeria. Some of these studies including Olowe (2009), Clement and Samuel
(2011), Adeoye and Atanda (2013), Bala and Asemota (2013), Emenike and
Peter (2016), Ajao and Igbekoyi (2013), Clement and Samuel (2011), Musa
and Abubakar (2014) and Isenah and Olubusoye (2016) focus more on the
official exchange rate markets. A more recent study by Atoi and Nkwede
(2017) accounted for asymmetry in exchange rate volatility for both official
and unofficial markets. However, many areas still require significant atten-
tion which this study seeks to explore. Specifically, this paper contributes to
the literature on exchange rate in Nigeria in two main ways.
First, the volatility persistence of exchange rate is critical to the understand-
ing of exchange rate behaviour in Nigeria. A critical look at foreign exchange
rate episodes in Nigeria from 2010 to late 2014 indicates that both official
and unofficial markets experienced significant shocks in terms of excessive
demand pressure and speculative aggression from foreign exchange market
participants which promote volatility in these markets. Recently, the persis-
tent exchange rate instability witnessed in Nigeria after the significant drop
in oil price revealed the extent to which unofficial market is important to
the economy. The huge activities in the foreign exchange markets which
official market failed to handle prompted the booming of unofficial foreign
exchange market. Accounting for these two markets in the study for better
understanding of exchange rate volatility is necessary for efficient and effec-
tive policy formulation. In addition, the demand pressure was heightened in
2015 before the introduction of more liberalized new exchange rate regime.
Thus, understanding and comparing the level of volatility persistence in these
143Modelling Volatility Persistence and Asymmetry of Naira-Dollar Exchange Rate Oyinlola
markets may shed more light on the challenges facing the foreign exchange
markets as well as guide the investors in decision making especially in their
portfolio diversification.
Second, the issue of asymmetry calls for concern in these two markets. The
upward and downward movements of domestic currency against foreign cur-
rency (i.e. Naira/Dollar) in the foreign exchange markets over the years
create more uncertainty for the players in the markets. More so, the pol-
icy of the Central Bank to rely heavily on external reserves contributed to
the issue of asymmetry in the markets. Thus, we explore asymmetric con-
ditional volatility model to sufficiently estimate the variations in exchange
rate in these markets and compare the extent of the asymmetry. In addition,
the study gives detailed information in both markets from persistence and
asymmetric perspective for better understanding of the issues surrounding
exchange rate and policy formulation. Therefore, this study is motivated to
model and compare the extent of persistence and asymmetry for both mar-
kets.
The rest of this paper is organized as follows. Section two presents the styl-
ized facts on development in the foreign exchange market, while section three
presents the literature review. Section four provides the data and preliminary
analysis while section five presents the empirical results as well as ensuing
discussion. Section six concludes the study.
1.1 Developments in the Foreign Exchange Market and Exchange
Rate Movements in Nigeria
The management of the foreign exchange (forex) rate market in Nigeria has
witnessed series of reforms which first led to a shift from a controlled ex-
change rate to the Second-tier Exchange Market introduced in September
1986. As part of the reform, the Bureau de Change Foreign Exchange Mar-
ket was introduced in 1989 purposely to deal with privately sourced foreign
exchange. The introduction of this segment of the exchange rate market led
to large volatility in the rates, thus prompting further reforms ranging from
144CBN Journal of Applied Statistics Vol. 9 No. 1 (June, 2018) 141-165
the formal pegging of the naira exchange rate to reaffirmation of the illegality
of the parallel exchange rate market. By 1995, the Central Bank of Nigeria
enhanced the sale of foreign exchange to end-users through the Autonomous
Foreign Exchange Market. Central to the reforms is the handling of the
Bureau de Change Market as authorized dealers. To further enhance accessi-
bility of forex market, the interbank foreign exchange market was introduced
in 1999. In 2002 and 2013 the exchange rate policy was managed between a
Retail Dutch Auction System and Wholesale Dutch Auction System. Sub-
sequently, the interbank foreign exchange market (with CBN interventions)
operated from November 2013 till June 2016 when it was further enhanced
to improve the exchange rate flexibility. Nonetheless, the Central Bank of
Nigeria continued to intervene in the market to stabilize the exchange rate.
There was relative stability in the exchange rate market, as expected, under
the control regime, with the official exchange rate at an average of N1.75 per
US dollar (USD). The movement of the foreign exchange experienced mostly
depreciation since the liberalization of the 1986 until 1993 when it was again,
fixed at N22/USD. This fixed exchange rate could not be supported again
leading to further depreciation to N92/USD by 1999. Meanwhile, at this same
time, the AFEM intervention rate depreciated continuously from N81.98 in
1997 to N91.83 in 1999. Subsequent reforms led to unceasing depreciation
between 1999 and 2004, when it reached N132/USD. A slight respite for the
economy was achieved between 2004 and 2008 when it appreciated for the
first time. The rate however, has been heading north since then, reaching
N192/USD in 2015 and N253/USD on the average in 2016. It should be
noted that the rate depreciated between June and September 2016, when it
was officially maintained at N305/USD till date (July, 2018).
The movement in the bureau de change rate followed similar trend, but more
volatile as expected. As at 1995, the rate was N83.69/USD and depreciated
to N99.26/USD in 1999. The rate increased to N140/USD in 2004 and ap-
preciated continuously till it reached N120/USD in 2008. By 2009, at the
period of the fallout of the global financial crisis, it depreciated to average of
145Modelling Volatility Persistence and Asymmetry of Naira-Dollar Exchange Rate Oyinlola
N161/USD, a rate that was maintained until 2014 and 2015, when it depre-
ciated again to N171/USD and N222/USD, respectively. The period marked
the new era of continuous and unwavering depreciation in the market due to
the inability of the Central Bank of Nigeria to fully support the forex as a
result of the dwindling fortune of the country which suffered immensely from
the global oil price crash. The management of exchange rate was hampered
by speculative activities at this period. The exchange rate reached the peak
of N493.29/USD by January 2017, until it stabilized to about N360/USD by
end of 2017 and till mid of 2018.
2.0 Literature Review
2.1 Theoretical Framework
This sub-section presents the Purchasing Power Parity (PPP) as the under-
lying theoretical framework for this study. Following the introduction of the
concept by Cassel (1918), it has been explored by many studies, including
Officer (1976) and Rogoff (1996). Empirical validation of the theory has
been carried out by several studies such as Sollis (2005) and Oyinlola et al.
(2011). The purchasing-power-parity (PPP) theory involves the ratio of two
countries’ price levels (absolute PPP) or price indices times a base period
exchange rate (relative PPP) as the most important variable determining
the exchange rate, but it allows both for other explanatory variables and for
random influences. The basic rationale for PPP theory is that the value of
a currency is determined fundamentally by the amount of goods and ser-
vices that a unit of the currency can buy in the country of issue. To this
end, PPP is regarded as one of the most important theories in explaining
the behaviour of exchange rate. As documented in Atoi and Nkwede (2017),
the theory explains that exchange rate between two currencies will adjust
to reflect price level changes between two countries. More specifically, the
theory proposes that the same goods (in terms of basket) should have the
same costs in each country given that allowance between different currencies
is taken into consideration. This theory relies on “law of one price” which
argues that identical goods should sell at the same price irrespective of the
146CBN Journal of Applied Statistics Vol. 9 No. 1 (June, 2018) 141-165
country. Thus, the understanding of exchange rate behaviour is well captured
through “real exchange rate”. The real exchange rate is driven by some key
factors that are subjected to volatility which in turn causes volatility in the
real exchange rate and this leads to nominal exchange rate volatility.
However, the theory failed to explain this behaviour because of its assumption
of identical goods in any two countries and there is little or no transport costs
and trade barrier. In reality, this assumptions cannot hold due to differences
in the quality of commodities produced in the two countries. In addition,
PPP theory does not account for good and services whose prices are excluded
in country’s measure of price level and non-tradable goods across borders,
this leads to evolution of interest rate parity condition (IRP). The interest
rate parity theory explains the relationship among domestic interest rates,
the interest parity and expected appreciation of the domestic currency. It
also stipulates that domestic interest rate should equal the foreign interest
rate less the expected appreciation of the domestic currency. The algebraic
form of domestic interest in the IRP theory is presented below:
εet+1 − εt
id = if − (1)
εt
where id represents domestic interest rate,id is the foreign interest rate, εet+1 is
the expected domestic currency at time and εt is the actual domestic currency
at time t. on the other hand, IRP is presented as:
εet+1
εt = (2)
if − id + 1
147Modelling Volatility Persistence and Asymmetry of Naira-Dollar Exchange Rate Oyinlola
2.2 Empirical Literature
The modelling of exchange rate volatility has increasingly gained prominence
in the international economics literature in recent years. A number of fac-
tors have been attributed to this development. First is the availability of
high frequency exchange rate series which provides robust evidence for the
presence of statistically weighty correlations between series. Second, high fre-
quency data on exchange rate creates the possibility of time varying volatil-
ity which is popularly known as conditional heteroscedasticity (see Harris
and Sollis, 2004). Specifically, exchange rate fluctuations signify huge gains
or losses arising from exchange rate misalignment in countries operating a
mono-product economy and thereby leading to economic instability. Also,
exchange rate volatility exposes investors to greater danger of uncertainty
with either making huge losses or gains from their investment. Therefore,
both the policy makers and investors are interested in the extent of exchange
rate volatility to make informed decisions (Salisu and Fasanya, 2012).
Surveying economic literature revealed that modelling exchange rate volatil-
ity has followed different dimensions over the years (See Diebold and Nerlove,
1989; Sengupta and Sfeir, 1996; Usman and Adejare, 2010; Ojebiyi and Wil-
son, 2011; Adeoye and Atanda, 2012; Ajao and Igbekoyi, 2013; Bala and
Asemota, 2013 among others). The Diebold and Nerlove (1989) appears to
be the first study to model the exchange rate volatility using the Auto Re-
gressive Conditional Hereteroskedasticity (ARCH) framework. The ARCH
model only account for symmetric impacts in a shock. However, economic
agents do not respond the same way to both positive and negative shocks.
Thus, the study did not account for asymmetric shocks in the model. Esti-
mating the likely presence of asymmetric shocks in exchange rate is of im-
mense importance to individuals, firms and government who are concerned
on managing the associated risk and uncertainties of the foreign exchange
market.
Also, Sengupta and Sfeir (1996) attempted the modelling of exchange rate
volatility in five countries (Japan, France, United Kingdom and West Ger-
148CBN Journal of Applied Statistics Vol. 9 No. 1 (June, 2018) 141-165
many) using the Autoregressive Conditional Hereteroskedasticity (ARCH)
and Generalized Autoregressive Conditional Hereteroskedasticity (GARCH).
The study revealed that exchange rate follows a random walk while the
volatility follows a persistent nonlinear behaviour. Again, the study failed to
capture for asymmetric impact that is often common with volatile series.
Examining Ghana Cedi-United States Dollar exchange rate volatility, Luguterah
et al. (2015) applied monthly exchange rate returns between January 1990
and November 2013 on symmetric and asymmetric GARCH models. Their
results show the volatility persistence and absence of leverage effects from
the asymmetric models. Consequently, the results suggest that the investors
who hedged against future exchange rate risk do not rely on information
about asymmetry in the Ghana foreign exchange market. Similarly, Rofael
and Hosni (2015) employed daily data between January 2003 and June 2013
in modelling exchange rate volatility in Egypt using ARCH type and the
State Space models. Their results revealed that exchange rate returns dis-
play volatility clustering and there is existence of time-varying variance in the
exchange rate which has to be considered when modelling nominal exchange
rates. This further shows that financial returns series exhibit sustained period
of relative calmness and high volatility in the Egyptian exchange rate market.
In Nigeria, a number of studies have attempted to model exchange rate
volatility. A notable work in this regard is Adeoye and Atanda (2012). The
study revealed the presence of overshooting volatility shocks. However, the
study did not account for asymmetric impacts in the model. This is because
the ARCH and GARCH framework only account for symmetric impacts and
shocks in a model. Further, Bala and Asemota in their 2013 paper on mod-
elling exchange rate volatility in Nigeria, argued that asymmetric impacts
and shocks are important when dealing with high frequency data. There-
fore, evaluating the presence of asymmetric shocks on exchange rate is very
pertinent to investors and policy makers. In their paper, Atoi and Nkwede
(2017)examined asymmetric analysis of exchange rates volatility in Nigeria
using three segments of the Nigerian foreign exchange market, namely; (Inter-
149Modelling Volatility Persistence and Asymmetry of Naira-Dollar Exchange Rate Oyinlola
bank Foreign Exchange Market (IFEM), Bureau de Change and Wholesale
Dutch Auction System (WDAS). The authors employed Asymmetric Thresh-
old Generalized Autoregressive Conditional Heteroscedasticity (TGARCH)
and their results showed that there was persistence of exchange rate volatility
in all markets. They found that interbank exchange rate volatility was per-
sistent and explosive compared to the other two markets. Similarly, Yakubu
and Abubakar (2014) employed different approaches such as GARCH, GJR-
GARCH, TGARCH and TS-GARCH and found the persistence of exchange
rate volatility and non-existence of leverage effect.
The study by Olowe (2009) investigated the volatility of Naira/Dollar ex-
change rates using first order symmetric and asymmetric models on monthly
data from January 1970 to December 2007. The study addressed the volatil-
ity issue through the separation of volatility during fixed exchange regime
from managed float regime and the findings indicate that volatility was per-
sistent and there was presence of leverage effect for the two regimes. In
addition, the examination of the consistency, persistency, and severity of
volatility in exchange rates of Naira/Dollar by Adeoye and Atanda (2013)
revealed that the nominal and real exchange rates of Naira/US Dollar is
not consistent with the traditional long-run PPP model. They concluded
that symmetric GARCH model does not fully account for the stylized facts
in terms of leverage effect inherent in financial time series. Clement and
Samuel (2011) employed symmetric GARCH model to study volatility of
Naira/US Dollar and Naira/UK Pound Sterling exchange rates in Nigeria
and their results showed that volatility on the returns was persistent. In
addition, Olusola and Opeyemi (2013) examined exchange rate volatility in
Nigeria using Parametric Measure. They found that exchange rate volatility
represents uncertainty and risk, which impose costs on risk averse economic
agents. The results from their Exponential Generalised Autoregressive Con-
ditional Heteroscedasticity (E-GARCH) model indicated that exchange rate
was volatile in Nigeria as a result of unusually high and low deviations.
This present study recognises that some studies have captured both the sym-
150CBN Journal of Applied Statistics Vol. 9 No. 1 (June, 2018) 141-165
metric and asymmetric effects on exchange rate in Nigeria; these studies,
however, did not consider a comparison of the levels of volatility persistence
and asymmetry in the interbank and Bureau de Change exchange markets in
Nigeria. Thus, to complement results from the previous studies, we examine
this comparison to provide better insight to investors and policy makers since
they also engage in buying and selling of currencies in both markets. In ad-
dition, this paper considered the plausible effects of the presence of multiple
breaks of the series in the analysis. The study therefore, fills this gap by
attempting to model exchange rate volatility persistence and asymmetry in
both markets using the ARCH, GARCH, TGARCH and EGARCH frame-
works.
3.0 Data and Methodology
3.1 Data sources and Construction
The monthly Naira/USD exchange rates data utilized in this study were col-
lected on interbank market and Bureau de Change. The data which cover
the period January 2004 to November 2017 were obtained from Central Bank
of Nigeria (CBN) online database. Thus, as a standard precondition in the
literature for dealing with volatile financial series, the pre-estimation analysis
is done in three stages: the first provides descriptive statistics for the respec-
tive exchange rates considered; the second tests for the presence of structural
breaks in the series; while the third tests for potential heteroscedasticity fea-
ture of the series using ARCH LM test.
A time series exhibiting conditional heteroscedasticity-or autocorrelation- in
the squared series is said to have autoregressive conditional heteroscedas-
tic (ARCH) effects. To test the probable existence of ARCH effects in the
respective exchange rate series under consideration, we explore the ARCH
Lagrangian Multiplier (LM) test procedure developed by Engle (1982) which
begins with a univariate model as specified below:
151Modelling Volatility Persistence and Asymmetry of Naira-Dollar Exchange Rate Oyinlola
k
X
rt = λ + δrt−i + εi ; i = 1, ..., k, t = 1, ..., T ; ε1 ∼ iid(0, σ 2 ); |δt| < 1 (3)
i
where rt denote exchange rate returns and is measure in this paper as:
R BDCEXRt = 100 × [∆ log(BDCEXR)] (4a)
R IF EXRt = 100 × [∆ log(IF EXR)] (4b)
k
X
rt = λ + δrt−i + εi ; i = 1, ..., k, t = 1, ..., T ; ε1 ∼ iid(0, σ 2 ); |δt| < 1
i
where BDCEXR in equation (4a) denotes Bureau de Change exchange rate,
while IFEXR is interbank or official exchange rate and ∆ is a first difference
operator.
In this section, we consider different plausible symmetric and asymmetric
GARCH modeling frameworks to capture volatility and persistence in both
the interbank and BDC exchange rate markets. That said, another signifi-
cant contribution of this paper, as far as modelling of exchange rate volatil-
ity is concerned, is the inclusion of two break dates as earlier established by
the outcomes of the Bai-Perron (2003) structural break test. Starting with
the symmetric GARCH model, our mean equation following the standard
GARCH (1, 1) procedure is as follow:
rt = η + δrt−1 + α1 D1,t + α2 D2,t + εt (5)
where rt represents the returns on Bureau de Change and interbank exchange
rates, Di,t = 1ift ≥ BDi andzerootherwise;BDi (i = 1, 2) denote the selected
break dates. Given that εt = σt et and et ∼ (0, 1) However, while the mean
equation (5) is applicable to all the models used in this paper, the variance
for the GARCH(1,1) model can be expressed as below:
σt2 = α + βε2t−1 + γσt−1
2
; α > 0, β ≥ 0, γ ≥ 0 (6)
152CBN Journal of Applied Statistics Vol. 9 No. 1 (June, 2018) 141-165
Equation (6) typically expresses the conditional variance dependent on infor-
mation about volatility observed in the previous period (the ARCH term,ε2t−1
2
) and forecasted variance from last period (the GARCH term,σt−1 ). The
persistence of σt2 is captured by β + γ and covariance stationarity requires
thatβ + γ < 1.The model is consistent with volatility clustering where large
changes in returns are likely to be followed by further large changes and
small values of variance from last period will be followed by small values of
conditional variance in current period (Mandelbrot, 1963). The pattern of
the volatility clustering may vary if bad and good news are received. Zivot
(2008) argued that the signs of the residuals or shocks have no effect on con-
ditional volatility in the basic GARCH model because the observed volatility
in the previous period enters in squared value. The study also noted the fact
that bad news (negative shocks) tends to have a larger impact on volatility
than good news (positive shocks) of the same magnitude. In other words,
volatility tends to be higher with negative shocks than with positive shocks.
Black (1976) inferred that this effect increases the leverage effect and causes
more volatility. Based on this conjecture, the asymmetric news impact on
volatility is commonly referred to as the leverage effect. This asymmetric
effects is demonstrated in this study with the use of EGARCH(1,1) and
TGARCH(1,1) in equations 8 and 9, respectively. The EGARCH model
was developed by Nelson (1991) to specifically capture asymmetries in the
volatility. It is typically represented as follows:
q q
ln(σt2 ) =φ+ψ εt−1 /σt−1 + τ ε2t−1 /σt−1
2 2 2 2
+ γ ln(σt−1 ) (7)
For the asymmetric effect to hold, then,τ < 0 implying that negative shocks
increases volatility more than positive shocks of the same magnitude. If the
sign is positive and statistically significant, that suggests positive shocks lead
to higher volatility than negative shocks of the same magnitude. However,
if the parameter is not statistically significant then the model is symmetric.
The TGARCH model is a modification of equation (6) by the inclusion of
the dummy variable It−1 .
153Modelling Volatility Persistence and Asymmetry of Naira-Dollar Exchange Rate Oyinlola
σt2 = α + βε2t−1 + γσt−1
2
+ ϑε2t−1 It−1 (8)
where It−1 = 1 if γt−1 > 0 and 0 otherwise. Hence, there is evidence of
asymmetric effect if ϑ < (>)0 which implies that positive (negative) shocks
reduce the volatility of rt by more than negative (positive) shocks of the same
magnitude.
4.0 Analysis and Discussion of Results
4.1 Descriptive statistics
Table 1 below presents the descriptive statistics for exchange rate returns in
both markets covering the entire period under investigation. There appears
to be an evidence of significant variations in exchange rate as shown by the
large difference between the minimum and maximum values for both mar-
kets. On the statistical distribution of exchange rate, both official and BDC
rates show evidence of positive skewness for all the sample period, suggest-
ing that the right tail was predominant. In relation to kurtosis, the BDC
exchange rate is leptokurtic while the official exchange rate is platykurtic.
Lastly, the study discovered that exchange rate is not normally distributed
in both markets judging by the Jarque Bera (JB) statistic.
Table 1: Descriptive Statistics of BDC and Interbank Market Exchange
Rate Returns
154CBN Journal of Applied Statistics Vol. 9 No. 1 (June, 2018) 141-165
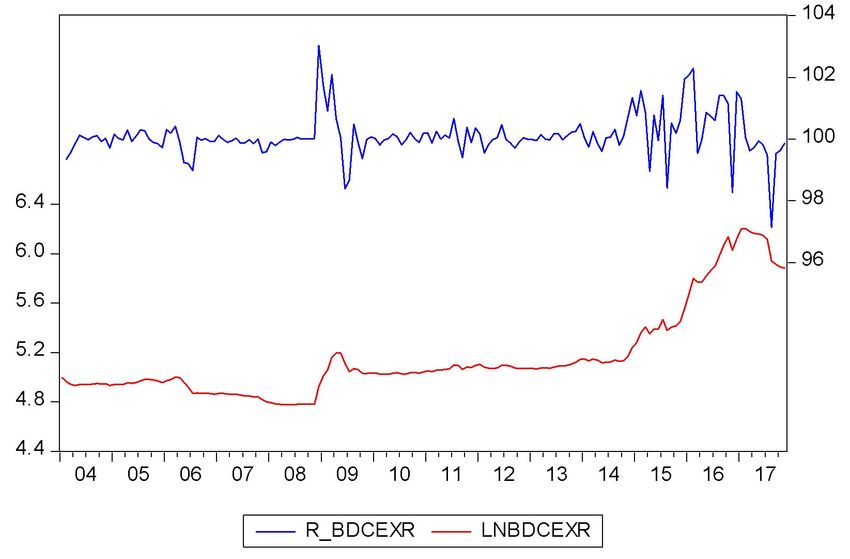
An analysis of the trend of the exchange rate in the BDC and interbank mar-
kets in Nigeria is presented in Figures 1 and 2. Figure 1 depicts the trends
of returns in the Bureau de Change (BDC) market and the underlying data.
The trajectory of Figure 1 presents an apt picture of instability of exchange
rate. The Figure portends traits of volatility clustering; these are periods of
high volatility shadowed by that of relatively low volatility. This reflection
supports the evidence in Table 1 thus demonstrating that volatility is highest
in 2008 and around 2016 which coincided with the global financial crises and
the fall in global oil price that affected the Nigerian economy. Indeed, as a
consequence of the structure of the economy that depends mainly on crude
oil for foreign exchange, the economy fell into recession by second quarter of
2016.
Figure 1: Graph of BDC Exchange Rate Returns
Figure 2 shows the dynamics of the returns in the interbank foreign exchange
market and its underlying data. The behaviour of the interbank market ex-
change rate is also unsteady similar to the observed trend in Figure 1. As
seen in the figure below, the volatility is highest in 2016.
155Modelling Volatility Persistence and Asymmetry of Naira-Dollar Exchange Rate Oyinlola
Figure 2: Graph of Interbank Exchange Rate Returns
4.2 Structural Break Test
Table 2: Bai-Perron Multiple Structural Breaks Test Results
Presented in Table 2 above are the results of the structural break test prompted
by the notable indication of shifts in the historical movements of exchange
rates in both the BDC and interbank exchange rate markets (see Figures 1
and 2). In essence, we follow the Bai and Perron multiple structural breaks
test to determine significant structural shifts in the movement of the series.
Our choice of Bia-Perron (2003) in determining the breaks is hinged on the
156CBN Journal of Applied Statistics Vol. 9 No. 1 (June, 2018) 141-165
fact that it allows for a maximum of five structural breaks in time series (see
Narayan and Liu, 2015). The test also involves a sequential application of
sup FT (` + 1| `)test which is assumed to work best in selecting the number
of breaks. The results of the structural break using Bai-Perron (2003) shows
that the exchange rates (nonetheless the market under consideration) exhibit
at least two significant structural breaks. Interestingly, the breaks particu-
larly for the interbank exchange rate seem to have coincided with the period
of depreciation in the country’s exchange rate which may be linked to the
recent precipitous movement in the international crude oil prices. Conse-
quently, the identified break dates in the case of the BDC exchange rate may
be traceable to the period of significant response of the market to shocks due
to monetary policy intervention to mitigate the depreciation of the exchange
rate which was due to fall in crude oil prices.
4.3 ARCH LM test
Essentially, Engle (1982) proposes three steps for the implementation of
ARCH test: the first step is to estimate equation (3) by OLS and obtain
the fitted residuals; the second step is to regress the square of the fitted
residuals on constant and lags of the squared residuals, i.e., estimate equa-
tion (9) below:
ε̂2t = ρ0 + ρ1 ε̂2t−1 + ρ2 ε̂2t−2 + · · · + ρp ε̂2t−p + µt ; (9)
and the third and final step is to use the LM test option to evaluate the
validity or otherwise of the null hypothesis of no ARCH effects, H0 : ρ1 =
ρ2 = · · · = ρp = 0
Table 3: ARCH LM test results
157Modelling Volatility Persistence and Asymmetry of Naira-Dollar Exchange Rate Oyinlola
Table 3 presents results of the ARCH effects for the BDC and interbank ex-
change rate. In the case of BDC exchange rate, the Obs*R-squared statistic
which is Engle’s LM test statistic shows a value of 12.468 and has a prob-
ability limit of 0.000. Similarly, obs*R-squared for interbank exchange rate
is 22.933 and has a probability limit of 0.000. This clearly suggests that
we reject the null hypothesis of homoscedasticity and confirm the presence
of ARCH effects in the BDC exchange rate and the interbank market ex-
change rate series. We can conclude that exchange rates in both interbank
and BDC exchange markets exhibit ARCH effects. Thus, this necessitates
the modelling of exchange rate volatilities under symmetric and asymmetric
scenarios in both markets for better understanding of exchange rate dynam-
ics for meaningful policy formulation and investment decisions.
4.4 Discussion of Results
The discussion here focuses on the GARCH models. Given the evidence of
ARCH effects in the series, the estimation proceeds with the implementation
of the symmetric GARCH(1,1) model in equation (7) and subsequently con-
siders the variants of asymmetric models specified in equations (8) and (9),
respectively in each market. The subsequent discussion is twofold. First, the
models with a better fit is determined. Model selection criteria such as the
Schwartz Information Criterion (SIC), Akaike Information Criterion (AIC)
and Hannan-Quinn Information Criterion (HQC) were used to decide the
model with the best fit. Fitness of models is typically determined using the
Rsquared and adjusted Rsquared but these are flawed with over-fitting and
loss of degrees of freedom. Thus, in this study, we chose the SIC in the two
markets for ease of interpretation. Within each market also, the extent of
volatility persistence and asymmetry were also discussed.
4.4.1 Volatility persistence and asymmetry of BDC exchange rate
The discussion here focuses on results of different volatility models with struc-
tural breaks presented in Table 4 below. Volatility persistence measures the
period of time required for volatility in the market to dissipate or decay and
it is computed by the sum of the coefficients of ARCH and GARCH effects.
158CBN Journal of Applied Statistics Vol. 9 No. 1 (June, 2018) 141-165
In the BDC exchange rate market, the sum of the coefficients in the GARCH
and TGARCH models is greater than one (1.77, 1.20, respectively) while
persistence in the EGARCH (1, 1) model (0.91) is also close to one. The
results indicate that EGARCH model has high persistence while GARCH
and TGARCH are both highly explosive. However, there is an indication of
greater explosive level of persistence under GARCH model with structural
breaks compared to the TGARCH model.
Following standard inferences from the literature, it suggests that there is
greater indication of explosive level of persistence in the BDC market. This
clearly lends support for the generalization of persistence by other stud-
ies such Bala and Asemota (2013), Emenike and Peter (2016) Clement and
Samuel (2011), in the exchange rate market. In comparing the performance of
the volatility models in the BDC market, the TGARCH(1,1) model appears
to provide a better fit over the GARCH(1,1) and EGARCH (1,1) models as
judged by the SIC value.
The answer to the question as to whether BDC exchange is more volatile
after bad or good news (negative or positive shocks) is provided by the sign
and significance of the coefficients of asymmetry in the TGARCH model.
The coefficient of asymmetry for TGARCH (1,1) in Table 4 is negative and
statistically significant, but only at the 10 percent level. This suggests that
in the BDC market, negative shocks have the penchant of reducing volatility
more than positive shocks of the same magnitude. In other words, bad news
in the exchange rate markets has more propensity of increasing exchange rate
volatility in the BDC market than good news.
159Modelling Volatility Persistence and Asymmetry of Naira-Dollar Exchange Rate Oyinlola
Table 4: Estimation results of Volatility Models
with two structural breaks for BDC
4.4.2 Volatility persistence and asymmetry of interbank exchange
rate
Persistence in the interbank exchange rate market as shown in Table 5 in-
dicates moderate to high persistence especially in the TGARCH (0.74) and
EGARCH (0.72) models. The GARCH model has a persistence of 1.49, which
suggests an explosive persistence. However, on the whole, the results suggest
that the BDC exchange rate market is more persistent than the interbank
exchange rate market. In terms of the performance of the volatility models,
the symmetric model, GARCH(1,1), proved to have a better fit based on the
SIC value. This indicates that participants in the interbank foreign exchange
market do not respond to news differently.
In summary, the TGARCH provides better insight into the impact of news
on the exchange rate returns volatility in the BDC market while the inter-
bank seems to be unresponsive (or less responsive) to news. The results may
160CBN Journal of Applied Statistics Vol. 9 No. 1 (June, 2018) 141-165
not be unsurprising based on the structure of these markets. These results
further confirm the responses of the markets to news and indeed, to market
forces as determined by the participants. The BDC market is adjudged to
be more market driven, hence its ostensible asymmetric reaction to news.
As a follow up to the pre-estimation test that confirms the presence of
ARCH effects in the foreign exchange markets, the study also provides post-
estimation diagnostic test using the F-test. Adjudging by the probability
values of the models in the two markets we could not reject the null hypoth-
esis of no ARCH effects in the BDC and the interbank markets (with and
without structural breaks). All the values were statistically insignificant at
5% and 1% levels of significance.
Table 5: Estimation results of Volatility Models
with two structural Breaks for interbank
161Modelling Volatility Persistence and Asymmetry of Naira-Dollar Exchange Rate Oyinlola
5.0 Conclusion and Policy Implications
The specific objective of this study was to model volatility persistence and
asymmetry of Naira-Dollar exchange rates in both BDC and Interbank mar-
kets using monthly data between January 2004 and November 2017. The
essence of volatility in exchange rate is to provide useful information to par-
ticipants in the market with respect to uncertainty or risk in the market. The
investors are more interested in the stability of exchange rate before investing
in the host country. The implication of fluctuation in the exchange rate sug-
gests huge losses (gains) to the investors and thus, low return on investment
may be detrimental to both investors and economy as a whole. For the profit
maximizing and risk averse agents/investors, the occurrence of high volatility
persistence may shape the investment decision in the area of portfolio diver-
sification to less risky assets. Therefore, modelling volatility persistence and
asymmetry is critical to policymakers and thus motivating the study. The
contribution of this paper is twofold. First, we employed Bai-Perron Mul-
tiple Structural Breaks Test which gives opportunity for determining more
than one structural break from BDC and Interbank markets. Second, we
augmented for the latter in both symmetric and asymmetric models.
Based on our model selection criteria, the symmetric GARCH model, ap-
peared to be better than the asymmetric ones in dealing with exchange
rate volatility in interbank markets while asymmetric GARCH, especially
TGARCH, appeared to be better in the case of BDC market whether struc-
tural breaks are accommodated in the models or not. These findings revealed
evidence of asymmetric effects in both markets. In addition, the persistence
in the BDC market was largely moderated after the shocks (i.e. structural
breaks) compared to interbank market where the persistence was not explo-
sive especially under asymmetric models. These results tend to suggest the
need to account for market differences when designing appropriate exchange
rate policies for the country as the market participants respond differently
to developments in the markets. This will go a long way in aligning the
exchange rate in the two markets for proper investment decision making and
policy formulation. Finally, shocks to exchange rate need to be subdued
162CBN Journal of Applied Statistics Vol. 9 No. 1 (June, 2018) 141-165
through sufficient reserves accumulation to absorb any unforeseen shocks to
the exchange rate structure.
References
Adeoye, W. B. and Atanda, A. A. (2012). Exchange Rate Volatility in Nigeria:
Consistency, Persistency and Severity Analyses. CBN Journal of Applied
Statistics 2(2), 29-49.
Ajao, M. G. and Igbekoyi, O. E. (2013). The Determinant of Real Exchange
Rate Volatility in Nigeria. Academic Journal of Interdisciplinary Studies,
2(1), 459-471
Atoi, N.V. and Nkwede, F.E. (2017) Asymmetric Analysis of Exchange Rates
Volatility: Evidence from Emerging Economy, IOSR Journal of Business
and Management, 19(1), 82-90.
Bai, J. and Perron, P. (2003). Computation and analysis of multiple structural
change models, Journal of Applied Econometrics, 18(1), 1-22.
Bala, D. A. and Asemota, J. O. (2013). Exchange-Rates Volatility in Nigeria:
Application of GARCH Models with Exogenous Break. CBN Journal of
Applied Statistics, 4(1), 89-116
Black, F. (1976). Studies in Stock Price Volatility Changes. Proceedings of the
1976 Business Meeting of the Business and Economics Statistics Section,
American Statistical Association, 177-181.
Cassel, G. (1918). Abnormal Deviations in International Exchanges. Economic
Journal. 28, 413–15.
Clement, A and Samuel, A. (2011). Empirical Modeling of Nigerian Exchange
Rate Volatility. Mathematical Theory and Modeling, 1(3), 8-15.
Diebold, F. X. and Nerlove M. (1989). The Dynamics of Exchange Rate Volatility:
A Multivariate Latent Factor ARCH Model. Journal of Applied Economet-
rics, 4, 1-21.
Emenike, K. O. and Ali, P. I. (2016). Test for Autoregressive Conditional Het-
eroscedasticity in Naira/US Dollar Exchange Rate in Nigeria, International
Journal of Econometrics and Financial Management, 4(1), 11-16.
Engle, R. F, (1982). Autoregressive Conditional Heteroscedasticity with Esti-
mates of the Variance of United Kingdom Inflation, Econometrica, 50(4),
987-1007.
163Modelling Volatility Persistence and Asymmetry of Naira-Dollar Exchange Rate Oyinlola
Fasanya, I. O., and Adekoya, O. B. (2017). Modelling Inflation Rate Volatility
in Nigeria with Structural Breaks. CBN Journal of Applied Statistics, 8(1),
175-193.
Harris, R., and Sollis, R. (2005). Applied Time Series Modelling and Forecasting.
Second Edition, London: John Wiley and Sons.
Luguterah, A, Akumbobe, R.A. and Yaan, E. A. (2015). Modelling Exchange
Rate Volatility of The Ghana Cedi to the US Dollar Using GARCH Models.
Mathematical Theory and Modeling, 5(8), 92-103.
Musa, Y. and Abubakar, B. (2014). Investigating Daily Naira/Dollar Exchange
Rate Volatility: A Modeling using GARCH and Asymmetric Models, IOSR
Journal of Mathematic, 10(2), 139-148.
Mandelbrot, B.B. (1963). New Methods in Statistical Economics. Journal of
Political Economy, Vol. 71, No. 5, pp. 421-440.
Nelson, D.B., (1991). Conditional Heteroskedasticity in Asset Returns: A New
Approach, Econometrica, 59(2), 347–370.
Officer, L. (1976). The Purchasing-Power-Parity Theory of Exchange Rates: A
Review Article. IMF Economic Review, 23(1). https://doi.org/10.2307/
Ojebiyi, A. and Wilson, D. O., (2011). Exchange rate volatility: An Analysis of
the Relationship between the Nigerian Naira, Oil Prices and US Dollar. Un-
published Masters Thesis in Business Administration, Gotland University.
Olowe, R. A. (2009). Modelling Naira/Dollar Exchange Rate Volatility: Applica-
tion of GARCH and Asymmetric Models. International Review of Business
Research Papers, 5, (3)
Olusola, O. and Opeyemi, A. (2013). Exchange Rate Volatility in Nigeria: Ev-
idence from a Parametric Measure. Australian Journal of Business and
Management Research, 3 (5), 12-17.
Oyinlola, M.A., Adeniyi, O. and F.O. Egwaikhide (2011). Purchasing Power
Parity Hypothesis in the Selected African Countries, Pakistan Journal of
Applied Economics, 21, 93-110.
Rofael, D. and Hosni, R. (2015), Modeling Exchange Rate Dynamics in Egypt:
Observed and Unobserved Volatility. Modern Economy, 6, 65-80.
Rogoff, K (1996). The Purchasing Power Parity Puzzle, Journal of Economic
Literature, 34(2), 647-668
Salisu, A. A., and Fasanya, I.O. (2012). Comparative Performance of Volatility
Models for Oil Price. International Journal of Energy Economics and Policy,
2(3), 167-183.
164CBN Journal of Applied Statistics Vol. 9 No. 1 (June, 2018) 141-165
Sengupta J. K., and Sfeir, E.R., (1996). Modeling exchange rate volatility, De-
partment of Economics, University of California, Santa Barbara, Working
paper 12-96, www.econ.ucsb,eu/papers,wp12-96.pdf.
Sollis, R. (2005). Evidence on Purchasing Power Parity from Univariate Mod-
els: The Case of Smooth Transition Trend-Stationarity, Journal of Applied
Econometrics, 20, 79-98.
Usman O. A and Adejare A. T. (2013). Effects of Exchange Rate Volatility on
the Nigerian Economy. International Journal of Academic in Economics
and Management Sciences, 2(6), 172-184
Zivot, E. (2008). Practical Issues in the Analysis of Univariate GARCH Models,
Retrieved from https://pdfs.semanticscholar.org
165You can also read