NP-Scout: Machine Learning Approach for the Quantification and Visualization of the Natural Product-Likeness of Small Molecules - MDPI
←
→
Page content transcription
If your browser does not render page correctly, please read the page content below
Article

NP-Scout: Machine Learning Approach for the
Quantification and Visualization of the Natural
Product-Likeness of Small Molecules
Ya Chen 1, Conrad Stork 1, Steffen Hirte 1 and Johannes Kirchmair 1,2,3,*
 1 Center for Bioinformatics (ZBH), Department of Informatics, Faculty of Mathematics, Informatics and
   Natural Sciences, Universität Hamburg, 20146 Hamburg, Germany; chen@zbh.uni-hamburg.de (Y.C.);
   stork@zbh.uni-hamburg.de (C.S.); steffen.hirte@studium.uni-hamburg.de (S.H.)
 2 Department of Chemistry, University of Bergen, 5007 Bergen, Norway

 3 Computational Biology Unit (CBU), Department of Informatics, University of Bergen,

   5008 Bergen, Norway
 * Correspondence: johannes.kirchmair@uib.no or kirchmair@zbh.uni-hamburg.de; Tel.: +47-5558-3464

 Received: 4 December 2018; Accepted: 21 January 2019; Published: 24 January 2019

 Abstract: Natural products (NPs) remain the most prolific resource for the development of small-
 molecule drugs. Here we report a new machine learning approach that allows the identification of
 natural products with high accuracy. The method also generates similarity maps, which highlight
 atoms that contribute significantly to the classification of small molecules as a natural product or
 synthetic molecule. The method can hence be utilized to (i) identify natural products in large
 molecular libraries, (ii) quantify the natural product-likeness of small molecules, and (iii) visualize
 atoms in small molecules that are characteristic of natural products or synthetic molecules. The
 models are based on random forest classifiers trained on data sets consisting of more than 265,000
 to 322,000 natural products and synthetic molecules. Two-dimensional molecular descriptors,
 MACCS keys and Morgan2 fingerprints were explored. On an independent test set the models
 reached areas under the receiver operating characteristic curve (AUC) of 0.997 and Matthews
 correlation coefficients (MCCs) of 0.954 and higher. The method was further tested on data from the
 Dictionary of Natural Products, ChEMBL and other resources. The best-performing models are
 accessible as a free web service at http://npscout.zbh.uni-hamburg.de/npscout.

 Keywords: natural products; natural product-likeness; machine learning; random forest;
 classification; similarity maps; visualization; molecular fingerprints; web service

1. Introduction
     Natural products (NPs) continue to be the most prolific resource for drug leads [1–4]. A recent
analysis found that over 60% of all small-molecule drugs approved between 1981 and 2014 are
genuine NPs, NP analogs or their derivatives, or compounds containing an NP pharmacophore [5].
NPs are characterized by enormous structural and physicochemical diversity [6–8]. Some of the
regions in chemical space covered by NPs are not, or only rarely, populated by synthetic molecules
(SMs) [7,9]. The structural complexity of many NPs exceeds that of compounds found in conventional
synthetic libraries for screening, in particular with respect to stereochemical aspects, molecular shape,
and ring systems [10–18].
     The primary bottleneck of NP research is the scarcity of materials for testing. In a recent study,
we showed that the molecular structures of more than 250,000 NPs have been deposited in public
databases, and that only approximately 10% of these are readily obtainable from commercial
providers and other sources [19].

Biomolecules 2019, 9, 43; doi:10.3390/biom9020043                         www.mdpi.com/journal/biomolecules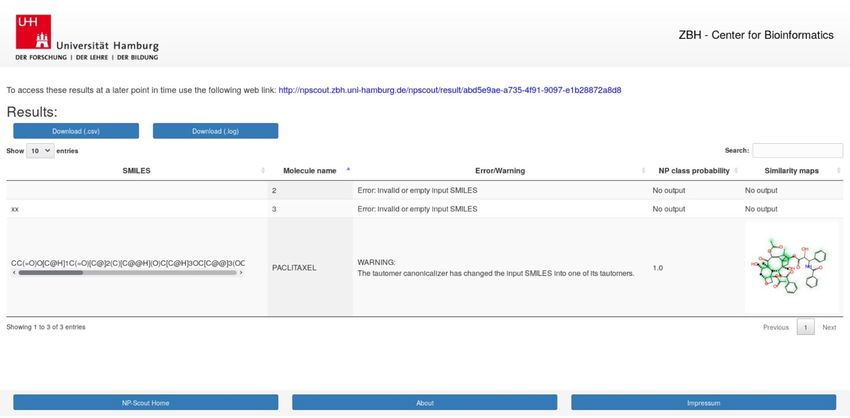
Biomolecules 2019, 9, 43                                                                       2 of 17

     Given the fact that NPs exhibit a wide range of biological activities that are of immediate
relevance to human health, new avenues that would make NP research more effective are being
explored, in particular, research involving computational approaches [2]. For example,
computational methods have been employed successfully for the identification of bioactive NPs [20–
22] and their bio-macromolecular targets [23–26]. They have also been successfully utilized for the
design of simple synthetic, bioactive mimetics of NPs [27–29]. In this context, computational methods
for quantifying the NP-likeness of compounds can be valuable tools to guide the de novo generation
of NP mimetics and optimize the NP-likeness of lead compounds. Such methods may also be useful
for identifying genuine NPs in commercial compound libraries, which often also contain SMs [19].
This can be valuable in the context of library design and for the prioritization of compounds for
experimental testing.
     The best-known in-silico approach for identifying NPs is the NP-likeness score developed by
Ertl et al. [30]. The NP-likeness score is a Bayesian measure that quantifies a compound’s similarity
with the structural space of NPs based on structural fragments. As such, the model can identify sub-
structures characteristic to NPs. The method has been re-implemented, with some modifications, in
various platforms (e.g., [31–33]). Among them is the Natural-Product-Likeness Scoring System [31],
which allows the calculation of the NP-likeness score (with some modifications). The Natural-
Product-Likeness Scoring System also allows the use of customized data sets for training. An
alternative approach for quantifying NP-Likeness, following a similar modeling strategy, but based
on extended connectivity fingerprints (ECFPs), was reported by Yu [34]. Also a rule-based approach
has been reported [35].
     In this work, we present the development and validation of new machine learning models for
the discrimination of NPs and SMs. To the best of our knowledge, these models are trained on the
largest collection of known NPs that have been employed for the development of such classifiers.
Among further developments, we present the utilization of similarity maps [36] for the visualization
of atoms of a molecule, which are characteristic for NPs or SMs, according to the models.

2. Materials and Methods

2.1. Data Preparation
     NPs were compiled from several physical and virtual NP databases (see Results for details). The
chemical structures were parsed directly from SMILES notation, where available. Alternatively,
chemical structures stored in chemical table files (e.g., SDF) were parsed with RDKit [37] and
converted into SMILES. Minor components of salts were removed by the method described in ref 38.
Any compounds with a molecular weight below 150 Da or above 1500 Da, and any compounds
consisting of elements other than H, B, C, N, O, F, Si, P, S, Cl, Se, Br, or I were filtered. The
“canonicalize” method, which was implemented in the “tautomer” class of MolVS [39], was used for
neutralizing the molecular structures and merging tautomers. After the removal of duplicate SMILES
(ignoring stereochemistry), the processed NP reference data set consisted of a total of 201,761 NPs.
     SMs were compiled from the “in-stock” subset of ZINC [40,41]. In a first step, 500,000
compounds of ZINC were picked by random selection from the complete “in-stock” subset and pre-
processed following the identical protocol used for the NP databases. After generating unique,
canonicalized SMILES, any molecules present in the NP reference data set were removed from the
SM data set (as determined by the comparison of canonicalized SMILES). Then, random sampling
was used to compile a reference data set of SMs of identical size as the NP reference data set (i.e.,
201,761 compounds).
     The Dictionary of Natural Products (DNP) [42] and the ChEMBL database [43,44] were pre-
processed following the identical protocol outlined for the NP and SM data sets. The ChEMBL sub-
set of molecules, published in the Journal of Natural Products, was retrieved directly from ChEMBL
[43,45]. The natural products subset of ZINC was downloaded from the ZINC website [46].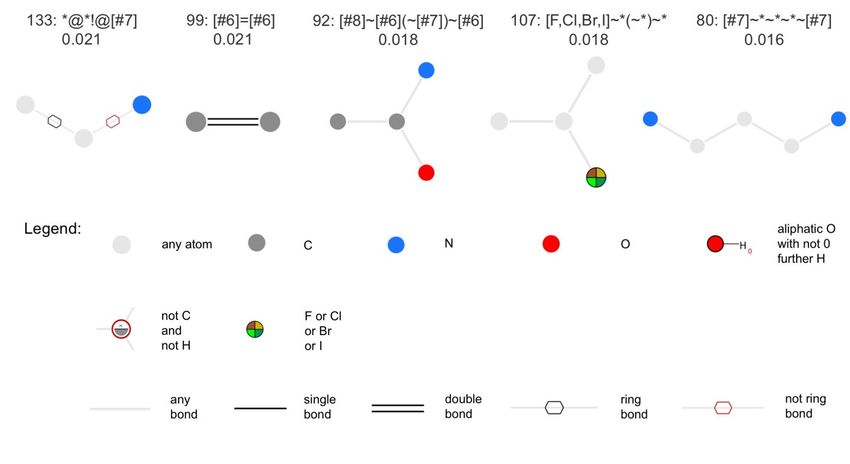
Biomolecules 2019, 9, 43                                                                           3 of 17

2.2. Principal Component Analysis
     Fifteen two-dimensional molecular descriptors calculated with the Molecular Operating
Environment (MOE) [47] were used for principle component analysis (PCA): MW (Weight), log P
(log P (o/w)), topological polar surface area (TPSA), number of hydrogen bond acceptors (a_acc),
number of hydrogen bond donors (a_don), number of heavy atoms (a_heavy), fraction of rotatable
bonds (b_rotR), number of nitrogen atoms (a_nN), number of oxygen atoms (a_nO), number of acidic
atoms (a_acid), number of basic atoms (a_base), sum of formal charges (FCharge), number of
aromatic atoms (a_aro) and number of chiral centers (chiral), and number of rings (rings).

2.3. Model Building
      Prior to model building, the preprocessed NP and SM reference data sets were merged, resulting
in a total of 403,522 data records. The merged data set was then randomly split into a training set of
322,817 and a test set of 80,705 compounds (ratio of 4:1). In fingerprint space, structurally distinct
molecules may have identical fingerprints. For this reason, de-duplication, based on fingerprints, was
separately performed for all NPs and all SMs in the training data. Any fingerprints present in both the NP
and SM subsets were removed, in order to avoid conflicting class labels. This procedure resulted in a
training set of 156,119 NPs and 161,378 SMs represented by Morgan2 fingerprints, and in a training set of
108,393 NPs and 157,162 SMs represented by MACCS keys.
      Morgan2 fingerprints (1024 bits) [48,49] and MACCS keys (166 bits) were calculated with RDKit,
and 206 two-dimensional physicochemical property descriptors were calculated with MOE. Random
forest classifiers (RFCs) were generated with scikit-learn [50,51] using default settings, except for
“n_estimators”, which was set to “100”, and “class_weight”, which was set to “balanced”.
      The NP-likeness calculator [30,31,52] was trained on atom signatures derived from the identical
NP and SM data sets, used for training the RFCs. Subsequently, the NP-likeness score was calculated
for each molecule in the test set, according to the atom signatures. All calculations used a signature
height of 3, resulting in scores ranging from −3 to 3. Molecules with a score greater than 0.0 were
labeled as NPs, and molecules with a score lower, or equal to 0.0 were labeled as SMs. NP class
probabilities (and AUCs) were derived by normalizing these scores to a range from 0.0 to 1.0.

2.4. Similarity Maps
    Similarity maps were computed with the RDKit [37] Chem.Draw.SimilarityMaps module based
on RFCs derived from Morgan2 fingerprints (1024 bits).

3. Results

3.1. Compilation of Data Sets for Model Development
      An NP reference data set of 201,761 unique NPs was compiled from 18 virtual NP libraries and
nine physical NP databases. The reference data set is identical to that compiled as part of our previous
work [8], with two amendments: First, the compounds of the DNP [42] were not included in the data
set, as they serve as an external test set in this work, and second, the recently published Natural
Products Atlas database [53] was added as a new data source. An overview of the NP data sources
utilized in this work is provided in Table 1. The table also reports the number of molecules that are
contained in the individual databases prior to, and after, data preprocessing. This is a procedure that
includes the removal of salt components and stereochemical information, the filtering of molecules
composed of uncommon elements, and with a molecular weight (MW) below 150 Da or above 1500
Da, and the removal of duplicate molecules (see Methods for details). An equal amount (i.e., 201,761)
of synthetic organic molecules (SMs) was collected from the “in-stock” subset of ZINC [41] by
random selection.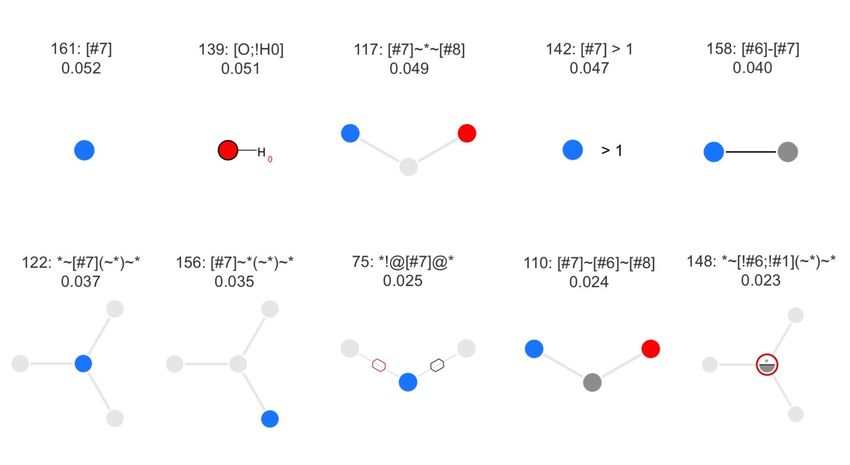
Biomolecules 2019, 9, 43                                                                                           4 of 17

                      Table 1. Size of the individual data sets prior to and after data preprocessing.

                               Number of Molecules in SMILES                                      Scientific Literature
                                                                   Number of Unique Molecules
            Name 1             Notation Successfully Parsed with                                     and/or Online
                                                                    After Data Preprocessing
                                            RDKit                                                      Presence
            UNPD                            229,140                           161,228                    [54,55]
 TCM Database@Taiwan                         56,325                           45,422                     [56,57]
           NP Atlas                          20,018                           18,358                      [53]
            TCMID                            13,188                           10,918                     [58,59]
            TIPdb                             8838                             7620                      [60–62]
      Ambinter and
                                              7905                             6680                      [63,64]
    Greenpharma NPs
  AnalytiCon Discovery
                                              4315                             4063                       [65]
         MEGx
           NANPDB                             6841                             3734                      [66,67]
          StreptomeDB                         3990                             3353                      [68,69]
     NPs of PubChem
                                              3533                             2638                      [70,71]
    Substance Database
            NuBBE                             1856                             1637                      [72,73]
     Pi Chemicals NPs                         1783                             1511                       [74]
           NPCARE                             1613                             1479                      [75,76]
            NPACT                             1516                             1376                      [77,78]
    InterBioScreen NPs                        1359                             1116                       [79]
            AfroDb                            954                              865                       [80,81]
    TargetMol Natural
                                              850                              745                        [82]
    Compound Library
             HIM                              1284                             641                       [83,84]
           SANCDB                             623                              588                       [85,86]
  UEFS Natural Products                       493                              469                  via ZINC [40,87]
           p-ANAPL                            538                              456                        [88]
 NCI/NIH DTP NP set IV                        419                              394                        [89]
             HIT                              707                              362                       [90,91]
          AfroCancer                          388                              352                       [92,93]
      AfroMalariaDB                           265                              250                       [94,95]
     AK Scientific NPs                        242                              177                        [96]
  Selleck Chemicals NPs                       173                              163                        [97]
   NP data set TOTAL                           -                              201761
      1UNPD: the Universal Natural Products Database; TCM Database@Taiwan: the Traditional Chinese
Medicine Database@Taiwan; NP Atlas: the Natural Products Atlas; TCMID: the Traditional Chinese Medicine
Integrated Database; TIPdb: the Taiwan Indigenous Plant Database; NANPDB: the Northern African
Natural Products Database; StreptomeDB: Streptome Database; NuBBE: Nuclei of Bioassays, Ecophysiology and
Biosynthesis of Natural Products Database; NPCARE: Database of Natural Products for Cancer Gene Regulation;
NPACT: the Naturally Occurring Plant-based Anti-Cancer Compound-Activity-Target Database; AfroDb: NPs
from African medicinal plants; HIM: the Herbal Ingredients in-vivo Metabolism Database; UEFS Natural
Products: the natural products database of the State University of Feira De Santana; p-ANAPL: the Pan-African
Natural Products Library; NCI/NIH DTP NP set IV: the NP (plated) set IV of the Developmental
Therapeutic Program of the National Cancer Institute/National Institutes of Health; HIT, the Herbal
Ingredients’ Targets Database; AfroCancer, the African Anticancer Natural Products Library; AfroMalariaDB,
the African Antimalarial Natural Products Library.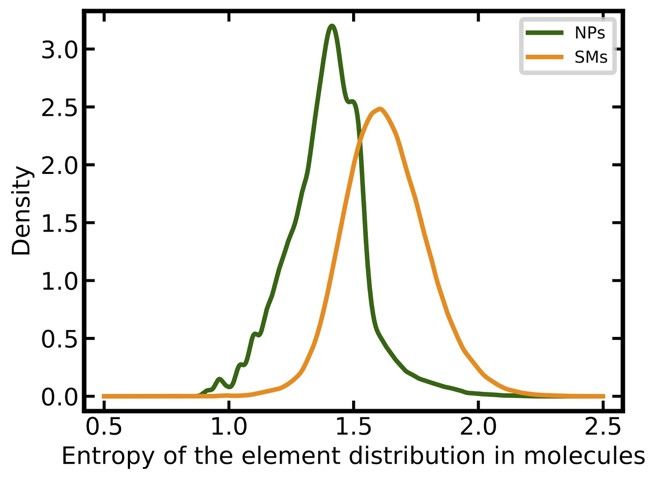
Biomolecules 2019, 9, 43 5 of 17
3.2. Analysis of the Physicochemical Properties of Natural Products and Synthetic Molecules
Prior to model development, we compared the chemical space covered by the 201,761 unique
NPs, and the equal number of unique SMs, using principal component analysis (PCA), based on 15
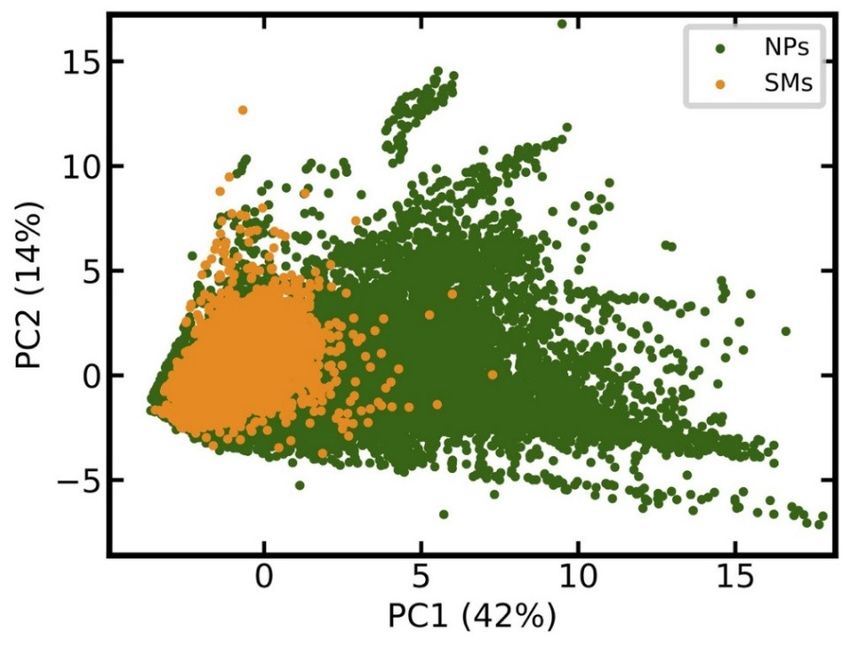
relevant physicochemical properties (see Methods for details). The score plot in Figure 1 shows that
the chemical space of SMs is essentially a sub-space of NPs.
Figure 1. Comparison of the chemical space covered by natural products (NPs) and synthetic organic
molecules (SMs). The score plot is based on the principle component analysis (PCA) of all molecules
in the data set, characterized by 15 calculated physicochemical properties. PCA was performed on the
full data sets. For the sake of clarity, only a randomly selected 10% of all data points are reported in
the score plot. The percentage of the total variance explained by the first two principal components is
reported in the respective axis labels.
NPs have on average a higher MW than SMs (506 Da vs 384 Da) and a larger proportion of heavy
compounds (38% vs. 10% of all molecules have a MW greater than 500 Da; Figure 2a). SMs have a
narrower distribution of calculated log P values as compared to NPs (Figure 2b) but their averages
are comparable (3.31 versus 3.25). SMs and NPs show clear differences in the entropy of element
distributions in molecules, with NPs having, on average, a lower entropy than SMs (1.39 versus 1.63;
Figure 2c). NPs tend to have more chiral centers (mean 6.66 vs. 0.75; Figure 2d), substantially fewer
nitrogen atoms than SMs (mean 0.76 vs. 2.94; Figure 2e), and more oxygen atoms (mean 7.39 vs. 2.88;
Figure 2f) [7,10,12–15,17].
(a) (b)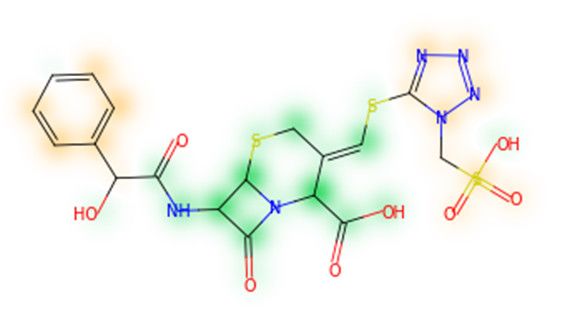
Biomolecules 2019, 9, 43                                                                                    6 of 17

                           (c)                                                       (d)

                           (e)                                                       (f)

      Figure 2. Distributions of key physicochemical properties among NPs and SMs: (a) Molecular weight;
      (b) log P (o/w); (c) entropy of the element distribution in molecules; (d) number of chiral centers; (e)
      number of nitrogen atoms; (f) number of oxygen atoms.

3.3. Model Development and Selection
     Random forest classifiers [98] were trained on three different descriptor sets: 206 two-
dimensional physicochemical property descriptors calculated with MOE [47], Morgan2 fingerprints
(1024 bits) [48,49] calculated with RDKit [37], and MACCS keys (166 bits), also calculated with RDKit.
Model performance was characterized utilizing the Matthews correlation coefficient (MCC) [99] and
area under the receiver operating characteristic curve (AUC). The MCC is one of the most robust
measures for evaluating the performance of binary classifiers, as it considers the proportion of all
classes in the confusion matrix (i.e., true positives, false positives, true negatives, and false negatives).
The AUC was used to measure how well the models are able to rank NPs early in a list.
     As reported in Table 2, the models derived from any of the three descriptor sets performed very
well. The AUC values, that were obtained during 10-fold cross-validation, were between 0.996 and
0.997; the MCC values were 0.950 or higher. No noticeable increase in performance was obtained by
the further increase in the number of estimators (n_estimators) and the optimization of the maximum
fraction of features considered per split (max_features; data not shown). Therefore, we chose to use
100 estimators, and the square root of the number of features, as the most suitable setup for model
generation.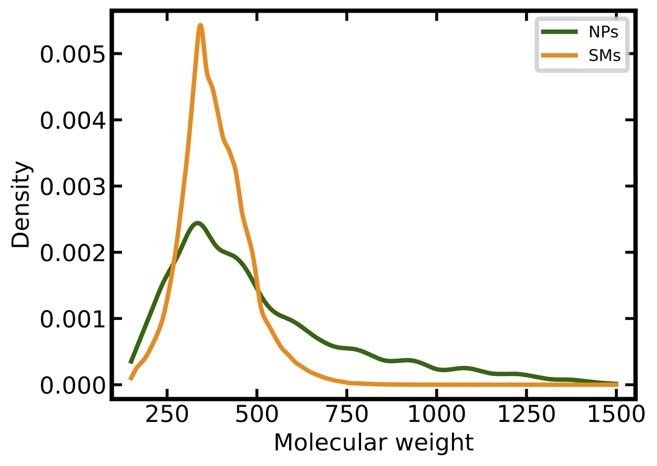
Biomolecules 2019, 9, 43                                                                                      7 of 17

                 Table 2. Performance of models derived from different descriptors or fingerprints.

                                       MOE Two-
                                                       Morgan2 Fingerprints      MACCS           NP-Likeness
     Test Method           Metric 1   Dimensional
                                                           (1024 Bits)            Keys            Calculator
                                      Descriptors

                            AUC          0.997                 0.997               0.996                /
     10-fold cross-
      validation
                            MCC          0.953                 0.958               0.950                /

                            AUC          0.997                 0.997               0.997              0.997
 Independent test set
                            MCC          0.954                 0.960               0.960              0.959

     1   AUC: area under the receiver operating characteristic curve: MCC: Matthews correlation coefficient.

3.4. Model Validation
     In a first step, the performance of the selected models was tested on an independent test set. The
AUC and MCC values, that were obtained for the selected models on this independent test set, are
comparable with those obtained for the 10-fold cross-validation: AUC values were 0.997 for models
based on any of the three types of descriptors and MCC values were 0.954 or higher.
     Given the fact that the type of descriptor, used for model generation, did not have a substantial
impact on model performance, we opted to select the model based on MACCS keys as the primary
model for further experiments, because of its low complexity and good interpretability. This model
achieved a very good separation of NPs and SMs for the independent test set, as shown in Figure 3a.
Approximately 63% of all NPs were assigned an NP class probability of 1.0, whereas 51% SMs were
assigned an NP class probability of 0.0. Only approximately 1% of all compounds were assigned
values close to the decision threshold of 0.5 (i.e., between 0.4 and 0.6).
     The model’s ability to identify NPs was also tested using the DNP as an external validation set.
By definition, the DNP should consist exclusively of NPs. After the removal of any molecules present
in the training data (based on canonicalized SMILES), the preprocessed DNP consisted of 60,502
compounds. Approximately 95% of these compounds were predicted as NPs by the model,
demonstrating the model’s capacity to identify NPs with high sensitivity (Figure 3b).

                              (a)                                                   (b)
      Figure 3. Predicted NP class probabilities distributions for (a) the independent test set (stacked
      histogram), (b) the DNP (after the removal of any compounds present in the training set). Note that
      the y-axis is in logarithmic scale.

3.5. Comparison of Model Performance with the NP-Likeness Calculator
     We compared the performance of the model derived from MACCS keys to the NP-likeness
calculator (based on the Natural-Product-Likeness Scoring System; see Introduction), which we
trained and tested on the identical data sets used for the development of our models. On the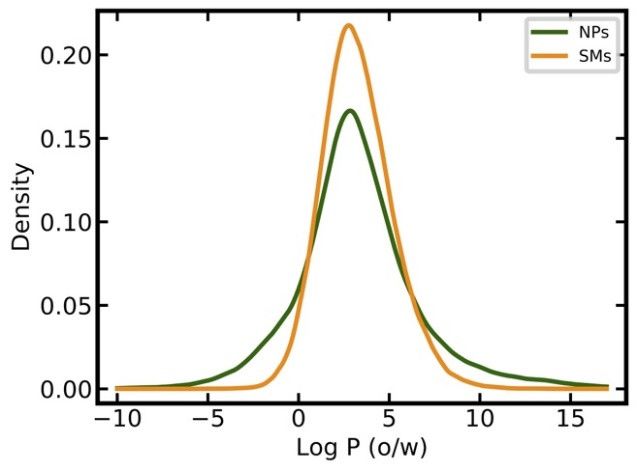
Biomolecules 2019, 9, 43                                                                                   8 of 17

independent test set, the NP-likeness calculator performed equally well as our model, with an AUC
of 0.997 and an MCC of 0.959 (Table 2). Approximately 95% of all compounds of the DNP were
classified as NPs (i.e., having assigned an NP-likeness score greater than 0; see Figure S1), which is
comparable to the classification obtained with our model based on MACCS keys.

3.6. Analysis of Class Probability Distributions for Different Data Sets
     In addition to the above experiments, we used the model based on MACCS keys for profiling
the ChEMBL database and a subset thereof. The ChEMBL database [44] primarily contains SMs, and
87% of all compounds stored in ChEMBL were predicted as such (Figure 4a). Interestingly, 42,949
molecules (~3%) were assigned an NP class probability of 1.0, and therefore likely are NPs. This
finding is in agreement with our previous study, which identified approximately 40,000 NPs in the
ChEMBL database, by overlapping the database with a comprehensive set of known NPs [19].

                           (a)                                                      (b)

                                                        (c)
      Figure 4. Predicted NP class probability distributions for (a) the ChEMBL database, (b) a subset of the
      ChEMBL database composed of molecules originating from the Journal of Natural Products, and (c)
      the natural products subset of ZINC. Note that the y-axis is in logarithmic scale.

     A subset of the ChEMBL database containing molecules originating from the Journal of Natural
Products [45] has been used as a source of genuine NPs to train models for the prediction of NP-
likeness [31]. Our model based on MACCS keys predicts a small percentage of the molecules (less
than 4%) in this data set as not NP-like (Figure 4b). Closer inspection of the compounds predicted as
not NP-like reveals that these are, for example, SMs used as positive controls in biochemical assays.
They include the drugs celecoxib, glibenclamide and linezolid, all of which are predicted with an NP
class probability of 0.0. This experiment demonstrates that the classifiers can be used as powerful
tools for the identification of NPs or SMs in mixed data sets with high accuracy.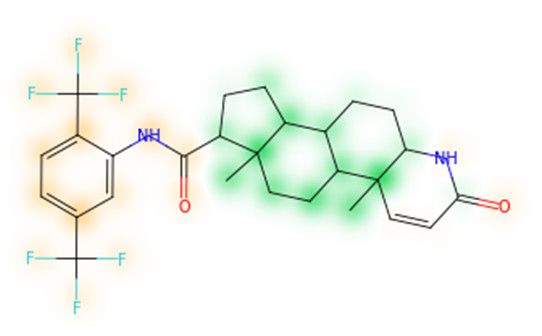
Biomolecules 2019, 9, 43                                                                                         9 of 17

    A second example of a data set that by its name is assumed to consist exclusively of NPs is the
natural products subset of ZINC [46]. The class probability distribution calculated for this subset
however is similar to that obtained for the complete ChEMBL, indicating the presence of a substantial
number of SMs (including NP derivatives and NP analogs) in this subset (Figure 4c): Only
approximately 43% of all compounds in the NPs subset of ZINC were classified as NPs; around 23%
were assigned an NP class probability of 1.0.

3.7. Analysis of Discriminative Features of Natural Products and Synthetic Molecules
      The most discriminative features were determined, based on the feature_importances_
attributes computed with scikit-learn (see Methods for details). For the classifier based on MOE two-
dimensional molecular descriptors, the three most important features were the number of nitrogen
atoms (a large fraction of NPs has no nitrogen atom; see Figure 2e), the entropy of the element
distribution in molecules (NPs have on average lower element distribution entropy than SMs; see
Figure 2c), and the number of unconstrained chiral centers (NPs have on average more chiral centers
than SMs; see Figure 2d). An overview of the ten most important features is provided in Table 3.

            Table 3. Feature importance for the random forest classifier based on MOE two-dimensional
                                                    descriptors.

  Identifier Used by         Feature
                                                                          Description
         MOE               Importance 1

           a_nN               0.103                               Number of nitrogen atoms.

          a_ICM               0.051                   Entropy of the element distribution in the molecule.

          chiral_u            0.045                         Number of unconstrained chiral centers.

                                           Descriptor derived from graph distance adjacency matrices utilizing atomic
   GCUT_SLOGP_0               0.045
                                                                     contribution to log P.

                                           Surface area descriptor taking into account the contributions of individual
      SlogP_VSA0              0.044
                                                                         atoms to log P.

           chiral             0.042                                Number of chiral centers.

                                           Descriptor derived from graph distance adjacency matrices utilizing atomic
   GCUT_SLOGP_3               0.036
                                                                     contribution to log P.

           a_nO               0.025                              The number of oxygen atoms.

                                           Descriptor derived from graph distance adjacency matrices utilizing partial
    GCUT_PEOE_0               0.025
                                                       equalization of orbital electronegativities charges.

                                           Surface area descriptor taking into account the contributions of individual
      SlogP_VSA1              0.024
                                                                         atoms to log P.

      1 From the feature_importances_ attribute of the classifier based on MOE two-dimensional
      descriptors. The higher, the more important the feature is.

     For the classifier based on MACCS keys, the 15 most important features are reported in Figure
5. In agreement with the differences observed in the physiochemical property distributions of NPs
versus SMs (see Analysis of the Physicochemical Properties of Natural Products and Synthetic
Molecules), the most important MACCS keys describe the presence or absence of nitrogen atoms,
such as key 161, matching molecules containing at least one nitrogen atom, key 142, matching
molecules with at least two nitrogen atoms, and keys 117, 158, 122, 156, 75, 110, 133, 92 and 80,
matching molecules containing specific nitrogen-containing substructures. Also several oxy gen-
containing substructures are among the most important features, such as keys 139, 117, 110, 92.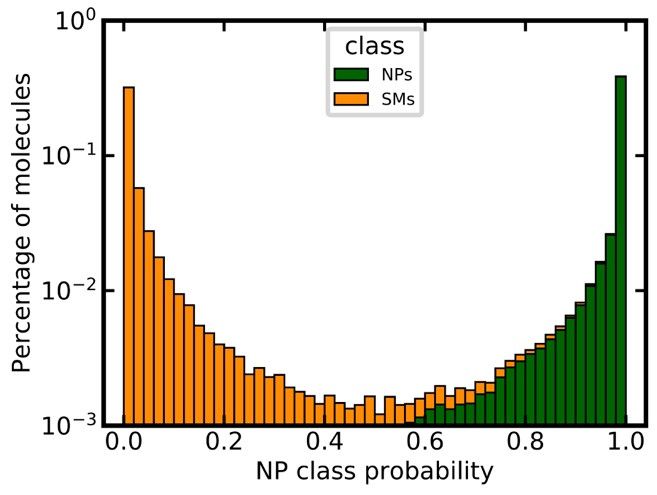
Biomolecules 2019, 9, 43                                                                               10 of 17

      Figure 5. The 15 most relevant MACCS keys, sorted by decreasing feature importance. Above each
      diagram, the first line reports the index of the respective MACCS key and its SMARTS pattern. The
      second line reports the feature importance (feature_importances_ attribute). The figure was produced
      with SMARTSviewer [100,101].

3.8. Similarity Maps
     Similarity maps [36] allow the visualization of the atomic contribution of molecular fingerprints
and can be extended to visualize the “atomic weights” of the predicted probability of the machine
learning model. During several test runs with different Morgan fingerprint, radii, and bit vector
lengths, we identified a radius of 2 and a bit vector length of 1024 bits as the most suitable setup for
generating fine-grained similarity maps. The examples of similarity maps, generated with this
descriptor, and the random forest approach, are reported in Table 4 for representative molecules,
none of which have been part of model training. In this similarity maps, green highlights mark atoms
contributing to the classification of a molecule as NP, whereas orange highlights mark atoms
contributing to the classification of a molecule as SM. As expected, the similarity maps for the NP
arglabin are mostly green, whereas for the synthetic drugs, bilastine and perampanel, are mostly
Biomolecules 2019, 9, 43 11 of 17
orange. For NP derivatives and mimetics, the similarity maps are more heterogeneous and show
green, as well as orange areas. The thrombin receptor antagonist vorapaxar is a derivative of the
piperidine alkaloid himbacine. Vorapaxar shares a decahydronaphtho[2,3-c]furan-1(3H)-one scaffold
with himbacine, but has the piperidine ring replaced by a pyridine, besides other modifications. The
similarity map generated for vorapaxar shows that the model correctly identifies the
decahydronaphtho[2,3-c]furan-1(3H)-one as NP-like, whereas it associates the modified areas with
synthetic molecules. In the case of empagliflozin, which mimics the flavonoid phlorozin, the model
correctly recognizes the C-glycosyl moiety as NP-like, whereas other atoms in the molecule are
associated with synthetic molecules.
Table 4. Examples of similarity maps generated by the NP classifier based on Morgan2 fingerprints.
NP Class Disease Year
Similarity Map 1 Name Source 2
Probability Indication Introduced
arglabin N 1.0 anticancer 1999
cefonicid
ND 0.34 antibacterial 1984
sodium
benign prostatic
dutaseride ND 0.18 2001
hypertrophy
coronary artery
vorapaxar ND 0.30 2014
disease
antidiabetic
empagliflozin S*/NM 0.67 2014
(diabetes 2)Biomolecules 2019, 9, 43 12 of 17
belinostat S*/NM 0.09 anticancer 2014
febuxostat S/NM 0.19 hyperuricemia 2009
zalcitabine S* 0.46 antiviral 1992
bilastine S 0.17 antihistamine 2011
perampanel S 0.16 antiepileptic 2012
1Green highlights mark atoms contributing to the classification of a molecule as NP, whereas orange
highlights mark atoms contributing to the classification of a molecule as SM. 2 N: Unaltered NP; ND:
NP derivative; S*: Synthetic drug (NP pharmacophore); S: Synthetic drug; NM: Mimic of NP.
Definitions according to ref [5].
3.9. NP-Scout Web Service
A web service named “NP-Scout” is accessible free of charge via http://npscout.zbh.uni-
hamburg.de/npscout. It features the random forest model, based on MACCS keys for the
computation of NP class probabilities and the random forest model, based on Morgan2 fingerprints
(with 1024 bits) for the generation of similarity maps.
Users can submit molecular structures for calculation, by entering SMILES, uploading a file with
SMILES or a list of SMILES, or drawing the molecule with the JavaScript Molecule Editor (JSME)
[102]. The results page (Figure 6) presents the calculated NP class probabilities and similarity maps
of submitted molecules in a tabular format. The results can be downloaded in CSV file format.
Calculations of the NP class probabilities and the similarity maps take few seconds per compound
and approximately 15 min for 1000 compounds. Users may utilize a unique link provided upon job
submission to return to the website after all calculations have been completed.Biomolecules 2019, 9, 43 13 of 17
Figure 6. Screenshot of the result page of NP-Scout.
4. Conclusions
In this work, we introduced a pragmatic machine learning approach for the discrimination of
NPs and SMs and for the quantification of NP-likeness. As shown by validation experiments using
independent and external testing data, the models reach a very high level of accuracy. An interesting
and relevant new aspect of this work is the utilization of similarity maps to visualize atoms in
molecules making decisive contributions to the assignment of compounds to either class. A free web
service for the classification of small molecules and the visualization of similarity maps is available
at http://npscout.zbh.uni-hamburg.de/npscout.
Supplementary Materials: The following are available online at www.mdpi.com/xxx/s1, Figure S1: Distribution
of calculated NP-likeness scores for the DNP (after removal of any compounds present in the training set).
Author Contributions: Conceptualization, Y.C. and J.K.; methodology, Y.C. and J.K.; software, Y.C., C.S., and
S.H.; validation, Y.C.; formal analysis, Y.C; investigation, Y.C., C.S., and S.H.; resources, J.K.; data curation, Y.C.;
writing—original draft preparation, Y.C., C.S., S.H., and J.K.; visualization, Y.C. and S.H.; supervision, J.K.;
project administration, J.K.; funding acquisition, Y.C. and J.K.
Funding: Y.C. is supported by the China Scholarship Council, grant number 201606010345. C.S. and J.K. are
supported by the Deutsche Forschungsgemeinschaft (DFG, German Research Foundation), project number KI
2085/1-1. J.K. is also supported by the Bergens Forskningsstiftelse (BFS, Bergen Research Foundation), grant
number BFS2017TMT01.
Acknowledgments: Gerd Embruch from the Center of Bioinformatics (ZBH) of the Universität Hamburg is
thanked for his technical support with the web service.
Conflicts of Interest: The authors declare no conflict of interest. The funders had no role in the design of the
study; in the collection, analyses, or interpretation of data; in the writing of the manuscript, and in the decision
to publish the results.
References
1. Cragg, G.M.; Newman, D.J. Biodiversity: A continuing source of novel drug leads. J. Macromol. Sci. Part A
Pure Appl. Chem. 2005, 77, 7–24.
2. Rodrigues, T.; Reker, D.; Schneider, P.; Schneider, G. Counting on natural products for drug design. Nat.
Chem. 2016, 8, 531–541.
3. Harvey, A.L.; Edrada-Ebel, R.; Quinn, R.J. The re-emergence of natural products for drug discovery in the
genomics era. Nat. Rev. Drug Discov. 2015, 14, 111–129.
4. Shen, B. A new golden age of natural products drug discovery. Cell 2015, 163, 1297–1300.Biomolecules 2019, 9, 43 14 of 17
5. Newman, D.J.; Cragg, G.M. Natural products as sources of new drugs from 1981 to 2014. J. Nat. Prod. 2016,
79, 629–661.
6. Grabowski, K.; Baringhaus, K.-H.; Schneider, G. Scaffold diversity of natural products: Inspiration for
combinatorial library design. Nat. Prod. Rep. 2008, 25, 892–904.
7. Ertl, P.; Schuffenhauer, A. Cheminformatics analysis of natural products: Lessons from nature inspiring
the design of new drugs. Prog. Drug Res. 2008, 66, 219–235.
8. Chen, Y.; de Lomana, M.G.; Friedrich, N.-O.; Kirchmair, J. Characterization of the chemical space of known
and Readily Obtainable Natural Products. J. Chem. Inf. Model. 2018, 58, 1518–1532.
9. Chen, H.; Engkvist, O.; Blomberg, N.; Li, J. A comparative analysis of the molecular topologies for drugs,
clinical candidates, natural products, human metabolites and general bioactive compounds. Med. Chem.
Commun. 2012, 3, 312–321.
10. Camp, D.; Garavelas, A.; Campitelli, M. Analysis of physicochemical properties for drugs of natural origin.
J. Nat. Prod. 2015, 78, 1370–1382.
11. Koch, M.A.; Schuffenhauer, A.; Scheck, M.; Wetzel, S.; Casaulta, M.; Odermatt, A.; Ertl, P.; Waldmann, H.
Charting biologically relevant chemical space: A structural classification of natural products (SCONP).
Proc. Natl. Acad. Sci. USA 2005, 102, 17272–17277.
12. Stratton, C.F.; Newman, D.J.; Tan, D.S. Cheminformatic comparison of approved drugs from natural
product versus synthetic origins. Bioorg. Med. Chem. Lett. 2015, 25, 4802–4807.
13. Wetzel, S.; Schuffenhauer, A.; Roggo, S.; Ertl, P.; Waldmann, H. Cheminformatic analysis of natural
products and their chemical space. CHIMIA Int. J. Chem. 2007, 61, 355–360.
14. López-Vallejo, F.; Giulianotti, M.A.; Houghten, R.A.; Medina-Franco, J.L. Expanding the medicinally
relevant chemical space with compound libraries. Drug Discov. Today 2012, 17, 718–726.
15. Feher, M.; Schmidt, J.M. Property distributions: Differences between drugs, natural products, and
molecules from combinatorial chemistry. J. Chem. Inf. Comput. Sci. 2003, 43, 218–227.
16. Clemons, P.A.; Bodycombe, N.E.; Carrinski, H.A.; Wilson, J.A.; Shamji, A.F.; Wagner, B.K.; Koehler, A.N.;
Schreiber, S.L. Small molecules of different origins have distinct distributions of structural complexity that
correlate with protein-binding profiles. Proc. Natl. Acad. Sci. USA 2010, 107, 18787–18792.
17. Henkel, T.; Brunne, R.M.; Müller, H.; Reichel, F. Statistical investigation into the structural complementarity of
natural products and synthetic compounds. Angew. Chem. Int. Ed. Engl. 1999, 38, 643–647.
18. Lee, M.L.; Schneider, G. Scaffold architecture and pharmacophoric properties of natural products and trade
drugs: Application in the design of natural product-based combinatorial libraries. J. Comb. Chem. 2001, 3,
284–289.
19. Chen, Y.; de Bruyn Kops, C.; Kirchmair, J. Data resources for the computer-guided discovery of bioactive
natural products. J. Chem. Inf. Model. 2017, 57, 2099–2111.
20. Rupp, M.; Schroeter, T.; Steri, R.; Zettl, H.; Proschak, E.; Hansen, K.; Rau, O.; Schwarz, O.; Müller-Kuhrt,
L.; Schubert-Zsilavecz, M.; et al. From machine learning to natural product derivatives that selectively
activate transcription factor PPARγ. ChemMedChem 2010, 5, 191–194.
21. Maindola, P.; Jamal, S.; Grover, A. Cheminformatics based machine learning models for AMA1-RON2
abrogators for inhibiting Plasmodium falciparum erythrocyte invasion. Mol. Inform. 2015, 34, 655–664.
22. Chagas-Paula, D.A.; Oliveira, T.B.; Zhang, T.; Edrada-Ebel, R.; Da Costa, F.B. Prediction of anti-
inflammatory plants and discovery of their biomarkers by machine learning algorithms and metabolomic
studies. Planta Med. 2015, 81, 450–458.
23. Reker, D.; Perna, A.M.; Rodrigues, T.; Schneider, P.; Reutlinger, M.; Mönch, B.; Koeberle, A.; Lamers, C.;
Gabler, M.; Steinmetz, H.; et al. Revealing the macromolecular targets of complex natural products. Nat.
Chem. 2014, 6, 1072–1078.
24. Rodrigues, T.; Sieglitz, F.; Somovilla, V.J.; Cal, P.M.S.D.; Galione, A.; Corzana, F.; Bernardes, G.J.L.
Unveiling (−)-englerin A as a modulator of L-type calcium channels. Angew. Chem. Int. Ed. Engl. 2016, 55,
11077–11081.
25. Merk, D.; Grisoni, F.; Friedrich, L.; Gelzinyte, E.; Schneider, G. Computer-assisted discovery of retinoid X
receptor modulating natural products and isofunctional mimetics. J. Med. Chem. 2018, 61, 5442–5447.
26. Schneider, P.; Schneider, G. De-orphaning the marine natural product (±)-marinopyrrole A by
computational target prediction and biochemical validation. Chem. Commun. 2017, 53, 2272–2274.
27. Merk, D.; Grisoni, F.; Friedrich, L.; Schneider, G. Tuning artificial intelligence on the de novo design of natural-
product-inspired retinoid X receptor modulators. Commun. Chem. 2018, 1, 68.Biomolecules 2019, 9, 43 15 of 17
28. Friedrich, L.; Rodrigues, T.; Neuhaus, C.S.; Schneider, P.; Schneider, G. From complex natural products to simple
synthetic mimetics by computational de novo design. Angew. Chem. Int. Ed. Engl. 2016, 55, 6789–6792.
29. Grisoni, F.; Merk, D.; Consonni, V.; Hiss, J.A.; Tagliabue, S.G.; Todeschini, R.; Schneider, G. Scaffold
hopping from natural products to synthetic mimetics by holistic molecular similarity. Commun. Chem. 2018,
1, 44.
30. Ertl, P.; Roggo, S.; Schuffenhauer, A. Natural product-likeness score and its application for prioritization
of compound libraries. J. Chem. Inf. Model. 2008, 48, 68–74.
31. Jayaseelan, K.V.; Moreno, P.; Truszkowski, A.; Ertl, P.; Steinbeck, C. Natural product-likeness score
revisited: An open-source, open-data implementation. BMC Bioinform. 2012, 13, 106.
32. Jayaseelan, K.V.; Steinbeck, C. Building blocks for automated elucidation of metabolites: Natural product-
likeness for candidate ranking. BMC Bioinform. 2014, 15, 234.
33. RDKit NP_Score. Available online: https://github.com/rdkit/rdkit/tree/master/Contrib/NP_Score (accessed
on 27 November 2018).
34. Yu, M.J. Natural product-like virtual libraries: Recursive atom-based enumeration. J. Chem. Inf. Model. 2011,
51, 541–557.
35. Zaid, H.; Raiyn, J.; Nasser, A.; Saad, B.; Rayan, A. Physicochemical properties of natural based products
versus synthetic chemicals. Open Nutraceuticals J. 2010, 3, 194–202.
36. Riniker, S.; Landrum, G.A. Similarity maps—A visualization strategy for molecular fingerprints and
machine-learning methods. J. Cheminform. 2013, 5, 43.
37. RDKit Version 2017.09.3: Open-source cheminformatics software. Available online: http://www.rdkit.org
(accessed on 22 May 2018).
38. Stork, C.; Wagner, J.; Friedrich, N.-O.; de Bruyn Kops, C.; Šícho, M.; Kirchmair, J. Hit Dexter: A machine-
learning model for the prediction of frequent hitters. ChemMedChem 2018, 13, 564–571.
39. MolVs Version 0.1.1. Available online: https://github.com/mcs07/MolVS (accessed on 12 July 2018).
40. Sterling, T.; Irwin, J.J. ZINC 15-Ligand discovery for everyone. J. Chem. Inf. Model. 2015, 55, 2324–2337.
41. ZINC “in-stock” subset. ZINC15. Available online: http://zinc15.docking.org/ (accessed on 21 August
2018).
42. Dictionary of Natural Products, version 19.1; Chapman & Hall/CRC: London, UK, 2010.
43. Bento, A.P.; Gaulton, A.; Hersey, A.; Bellis, L.J.; Chambers, J.; Davies, M.; Krüger, F.A.; Light, Y.; Mak, L.;
McGlinchey, S.; et al. The ChEMBL bioactivity database: An update. Nucleic Acids Res. 2014, 42, D1083–D1090.
44. ChEMBL Version 24_1. Available online: https://www.ebi.ac.uk/chembl/ (accessed on 30 July 2018).
45. ChEMBL Version 23. Available online: https://www.ebi.ac.uk/chembl (accessed on 6 June 2017).
46. Natural products subset of ZINC. ZINC15. Available online: http://zinc15.docking.org/substances/subsets/
(accessed on 7 November 2018).
47. Molecular Operating Environment (MOE), version 2016.08; Chemical Computing Group: Montreal, QC,
Canada, 2016.
48. Morgan, H.L. The generation of a unique machine description for chemical structures-A technique
developed at Chemical Abstracts Service. J. Chem. Doc. 1965, 5, 107–113.
49. Rogers, D.; Hahn, M. Extended-connectivity fingerprints. J. Chem. Inf. Model. 2010, 50, 742–754.
50. Pedregosa, F.; Varoquaux, G.; Gramfort, A.; Michel, V.; Thirion, B.; Grisel, O.; Blondel, M.; Prettenhofer, P.; Weiss,
R.; Dubourg, V.; et al. Scikit-learn: Machine learning in Python. J. Mach. Learn. Res. 2011, 12, 2825–2830.
51. Scikit-Learn: Machine Learning in Python, version 0.19.1.
52. Natural Product Likeness Calculator Version 2.1. Available online: https://sourceforge.net/projects/np-
likeness/ (accessed on 5 October 2018).
53. Natural Products Atlas. Available online: https://www.npatlas.org/ (accessed on 20 August 2018).
54. Gu, J.; Gui, Y.; Chen, L.; Yuan, G.; Lu, H.-Z.; Xu, X. Use of natural products as chemical library for drug
discovery and network pharmacology. PLoS ONE 2013, 8, e62839.
55. Universal Natural Products Database (UNPD). Available online: http://pkuxxj.pku.edu.cn/UNPD
(accessed on 17 October 2016).
56. Chen, C.Y.-C. TCM Database@Taiwan: The world’s largest traditional Chinese medicine database for drug
screening in silico. PLoS ONE 2011, 6, e15939.
57. TCM Database@Taiwan. Available online: http://tcm.cmu.edu.tw (accessed on 17 October 2016).
58. Xue, R.; Fang, Z.; Zhang, M.; Yi, Z.; Wen, C.; Shi, T. TCMID: Traditional Chinese medicine integrative
database for herb molecular mechanism analysis. Nucleic Acids Res. 2013, 41, D1089–D1095.Biomolecules 2019, 9, 43 16 of 17
59. Traditional Chinese Medicine Integrated Database (TCMID). Available online:
www.megabionet.org/tcmid (accessed on 19 October 2016).
60. Lin, Y.-C.; Wang, C.-C.; Chen, I.-S.; Jheng, J.-L.; Li, J.-H.; Tung, C.-W. TIPdb: A database of anticancer,
antiplatelet, and antituberculosis phytochemicals from indigenous plants in Taiwan. Sci. World J. 2013,
2013, 736386.
61. Tung, C.-W.; Lin, Y.-C.; Chang, H.-S.; Wang, C.-C.; Chen, I.-S.; Jheng, J.-L.; Li, J.-H. TIPdb-3D: The three-
dimensional structure database of phytochemicals from Taiwan indigenous plants. Database 2014, 2014, bau055.
62. Taiwan Indigenous Plant Database (TIPdb). Available online: http://cwtung.kmu.edu.tw/tipdb (accessed
on 19 October 2016).
63. Ambinter. Available online: www.ambinter.com (accessed on 2 June 2017).
64. GreenPharma. Available online: www.greenpharma.com (accessed on 2 June 2017).
65. AnalytiCon Discovery. Available online: www.ac-discovery.com (accessed on 14 November 2017).
66. Ntie-Kang, F.; Telukunta, K.K.; Döring, K.; Simoben, C.V.; A Moumbock, A.F.; Malange, Y.I.; Njume, L.E.;
Yong, J.N.; Sippl, W.; Günther, S. NANPDB: A resource for natural products from Northern African
sources. J. Nat. Prod. 2017, 80, 2067–2076.
67. Northern African Natural Products Database (NANPDB). Available online: www.african-
compounds.org/nanpdb (accessed on 5 April 2017).
68. Klementz, D.; Döring, K.; Lucas, X.; Telukunta, K.K.; Erxleben, A.; Deubel, D.; Erber, A.; Santillana, I.;
Thomas, O.S.; Bechthold, A.; et al. StreptomeDB 2.0—An extended resource of natural products produced
by streptomycetes. Nucleic Acids Res. 2015, 44, D509–D514.
69. StreptomeDB. Available online: http://132.230.56.4/streptomedb2/ (accessed on 13 April 2017).
70. Ming, H.; Tiejun, C.; Yanli, W.; Stephen, B.H. Web search and data mining of natural products and their
bioactivities in PubChem. Sci. China Chem. 2013, 56, 1424–1435.
71. Natural products subset. PubChem Substance Database. Available online:
http://ncbi.nlm.nih.gov/pcsubstance (accessed on 7 April 2017).
72. Pilon, A.C.; Valli, M.; Dametto, A.C.; Pinto, M.E.F.; Freire, R.T.; Castro-Gamboa, I.; Andricopulo, A.D.;
Bolzani, V.S. NuBBE: An updated database to uncover chemical and biological information from Brazilian
biodiversity. Sci. Rep. 2017, 7, 7215.
73. Núcleo de Bioensaios, Biossíntese e Ecofisiologia de Produtos Naturais (NuBBE). Available online:
http://nubbe.iq.unesp.br/portal/nubbedb.html (accessed on 19 April 2017).
74. PI Chemicals. Available online: www.pipharm.com (accessed on 5 May 2017).
75. Choi, H.; Cho, S.Y.; Pak, H.J.; Kim, Y.; Choi, J.-Y.; Lee, Y.J.; Gong, B.H.; Kang, Y.S.; Han, T.; Choi, G.; et al.
NPCARE: Database of natural products and fractional extracts for cancer regulation. J. Cheminform. 2017, 9, 2.
76. Database of Natural Products for Cancer Gene Regulation (NPCARE). Available online:
http://silver.sejong.ac.kr/npcare (accessed on 20 February 2017).
77. Mangal, M.; Sagar, P.; Singh, H.; Raghava, G.P.S.; Agarwal, S.M. NPACT: Naturally Occurring Plant-based
Anti-cancer Compound-Activity-Target database. Nucleic Acids Res. 2013, 41, D1124–D1129.
78. Naturally Occurring Plant-based Anti-cancer Compound-Activity-Target database (NPACT). Available
online: http://crdd.osdd.net/raghava/npact (accessed on 13 April 2017).
79. InterBioScreen. Available online: www.ibscreen.com (accessed on 14 November 2017).
80. Ntie-Kang, F.; Zofou, D.; Babiaka, S.B.; Meudom, R.; Scharfe, M.; Lifongo, L.L.; Mbah, J.A.; Mbaze, L.M.;
Sippl, W.; Efange, S.M.N. AfroDb: A select highly potent and diverse natural product library from African
medicinal plants. PLoS ONE 2013, 8, e78085.
81. AfroDb. Available online: http://african-compounds.org/about/afrodb (accessed on 18 October 2016).
82. TargetMol. Available online: www.targetmol.com (accessed on 17 May 2017).
83. Kang, H.; Tang, K.; Liu, Q.; Sun, Y.; Huang, Q.; Zhu, R.; Gao, J.; Zhang, D.; Huang, C.; Cao, Z. HIM-herbal
ingredients in-vivo metabolism database. J. Cheminform. 2013, 5, 28.
84. Herbal Ingredients In-Vivo Metabolism database (HIM). Available online:
http://binfo.shmtu.edu.cn:8080/him (accessed on 13 April 2017).
85. Hatherley, R.; Brown, D.K.; Musyoka, T.M.; Penkler, D.L.; Faya, N.; Lobb, K.A.; Tastan Bishop, Ö.
SANCDB: A South African natural compound database. J. Cheminform. 2015, 7, 29.
86. South African Natural Compound Database (SANCDB). Available online: http://sancdb.rubi.ru.ac.za
(accessed on 8 February 2017).Biomolecules 2019, 9, 43 17 of 17
87. UEFS Natural Products Catalog. ZINC15. Available online: http://zinc15.docking.org (accessed on 26 May
2017).
88. Ntie-Kang, F.; Amoa Onguéné, P.; Fotso, G.W.; Andrae-Marobela, K.; Bezabih, M.; Ndom, J.C.; Ngadjui,
B.T.; Ogundaini, A.O.; Abegaz, B.M.; Meva’a, L.M. Virtualizing the p-ANAPL library: A step towards drug
discovery from African medicinal plants. PLoS ONE 2014, 9, e90655.
89. Natural Products Set IV of the Developmental Therapeutic Program of the National Cancer
Institute/National Institutes of Health. Available online:
http://dtp.cancer.gov/organization/dscb/obtaining/available_plates.htm (accessed on 20 October 2016).
90. Ye, H.; Ye, L.; Kang, H.; Zhang, D.; Tao, L.; Tang, K.; Liu, X.; Zhu, R.; Liu, Q.; Chen, Y.Z.; et al. HIT: Linking
herbal active ingredients to targets. Nucleic Acids Res. 2011, 39, D1055–D1059.
91. Herbal Ingredients’ Targets database (HIT). Available online: http://lifecenter.sgst.cn/hit (accessed on 13
April 2017).
92. Ntie-Kang, F.; Nwodo, J.N.; Ibezim, A.; Simoben, C.V.; Karaman, B.; Ngwa, V.F.; Sippl, W.; Adikwu, M.U.;
Mbaze, L.M. Molecular modeling of potential anticancer agents from African medicinal plants. J. Chem. Inf.
Model. 2014, 54, 2433–2450.
93. AfroCancer. Available online: http://african-compounds.org/about/afrocancer (accessed on 10 February
2017).
94. Onguéné, P.A.; Ntie-Kang, F.; Mbah, J.A.; Lifongo, L.L.; Ndom, J.C.; Sippl, W.; Mbaze, L.M. The potential
of anti-malarial compounds derived from African medicinal plants, part III: An in silico evaluation of drug
metabolism and pharmacokinetics profiling. Org. Med. Chem. Lett. 2014, 4, 6.
95. AfroMalariaDB. Available online: http://african-compounds.org/about/afromalariadb (accessed on 10
February 2017).
96. Natural products subset of AK Scientific. AK Scientific. Available online: www.aksci.com (accessed on 19
April 2017).
97. Natural products of Selleck Chemicals. Selleck Chemicals. Available online: www.selleckchem.com
(accessed on 14 November 2017).
98. Breiman, L. Random forests. Machine Learning 2001, 45, 5–32.
99. Matthews, B.W. Comparison of the predicted and observed secondary structure of T4 phage lysozyme.
Biochim. Biophys. Acta 1975, 405, 442–451.
100. Schomburg, K.; Ehrlich, H.-C.; Stierand, K.; Rarey, M. From structure diagrams to visual chemical patterns.
J. Chem. Inf. Model. 2010, 50, 1529–1535.
101. SMARTSview. Available online: http://smartsview.zbh.uni-hamburg.de/ (accessed on 30 November 2018).
102. Bienfait, B.; Ertl, P. JSME: A free molecule editor in JavaScript. J. Cheminform. 2013, 5, 24.
© 2019 by the authors. Licensee MDPI, Basel, Switzerland. This article is an open access
article distributed under the terms and conditions of the Creative Commons Attribution
(CC BY) license (http://creativecommons.org/licenses/by/4.0/).You can also read