3D assessment of a coral reef at Lalo Atoll reveals varying responses of habitat metrics following a catastrophic hurricane
←
→
Page content transcription
If your browser does not render page correctly, please read the page content below
www.nature.com/scientificreports
OPEN 3D assessment of a coral reef
at Lalo Atoll reveals varying
responses of habitat metrics
following a catastrophic hurricane
Kailey H. Pascoe1*, Atsuko Fukunaga2,3, Randall K. Kosaki3 & John H. R. Burns1
Extreme disturbances such as hurricanes can cause reductions in coral cover and three-dimensional
(3D) structural complexity of coral reefs. We examined changes in structural complexity utilizing
3D reconstruction of a coral-reef site before and after Hurricane Walaka passed through Lalo of the
Northwestern Hawaiian Islands. This event resulted in complete destruction of the coral-reef habitat,
with dramatic changes in benthic cover from pre-hurricane tabulate coral to post-hurricane rubble.
Rugosity and mean slope decreased after the hurricane, while structural complexity, captured by
vector ruggedness measure (VRM), showed resolution-specific responses. This metric captured the
structural complexity of rubble at a high raster resolution of 1 cm and that of tabulate coral at lower
resolutions, resulting in decreases in mean VRM values at 2- and 4-cm resolutions but an increase at
1-cm resolution. Variability in profile and planform curvature was reduced after the hurricane due to
a disappearance of extreme curvature values created by the tabulate coral after the hurricane. This
study highlights the varying responses of habitat complexity metrics to the complete destruction of
a coral reef and provides us with insights into how choices of habitat complexity metrics can affect
quantitative assessments of 3D habitat structure.
Extreme natural disturbance events, such as hurricanes and cyclones, are projected to increase in frequency and
severity in the f uture1.The waves generated by hurricanes are larger and more powerful than those experienced
under normal conditions and are the primary cause of hurricane-related damage to coral r eefs2–5. For example,
Hurricane Allen was one of the strongest recorded Category 5 hurricanes in the Caribbean and produced waves
up to 12-m high causing significant damage to shallow-water coral reefs2. Loss of live coral cover and habitat
structural complexity caused by such disturbance events can lead to detrimental losses in the abundance and
diversity of reef organisms, which in turn impact the health and function of coral reef ecosystems6,7. Long-term
monitoring of coral reefs allows for pre- and post-disturbance comparisons and can be used to assess reductions
in the abundance of live coral cover and resulting declines in the three-dimensional (3D) structural complexity
of coral r eefs8.
The vulnerability of corals to storms differs among species, with delicate morphologies typically becoming
increasingly vulnerable to dislodgment and mortality as they grow in s ize9,10. Structurally complex branching
or tabulate corals are generally more vulnerable to wave damage than corals with more robust and stable growth
forms, such as mounding and encrusting corals11. In addition, coral communities that exhibit high diversity
and richness often show a greater resistance to physical disturbance than monotypic communities7,12. This is
especially concerning for areas with low species richness and diversity, such as the Hawaiian archipelago. Due to
the isolation of the Hawaiian Islands, coral reefs in this area show lower species richness and higher endemism
than those found in Indo-Pacific or Caribbean13. Thus, Hawai ‘i’s monotypic reef habitats that are comprised
primarily of coral colonies with delicate morphologies are of particular interest when assessing the potential
impacts of storm disturbances.
Historically, coral reef ecosystems in the Northwestern Hawaiian Islands (NWHI), contained within the
Papahānaumokuākea Marine National Monument, were rarely in the track of tropical storms and h urricanes13. In
October 2018, Hurricane Walaka, which is ranked as the second strongest tropical cyclone in the Central Pacific
1
Marine Science Department, University of Hawai’i at Hilo, Hilo, HI 96720, USA. 2Joint Institute for Marine and
Atmospheric Research, University of Hawai’i aat Manoa, Honolulu, HI 96822, USA. 3Papahanaumokuakea Marine
National Monument, Office of National Marine Sanctuaries, National Ocean Service, National Oceanic and
Atmospheric Administration, Honolulu, HI 96818, USA. *email: kpascoe@hawaii.edu
Scientific Reports | (2021) 11:12050 | https://doi.org/10.1038/s41598-021-91509-4 1
Vol.:(0123456789)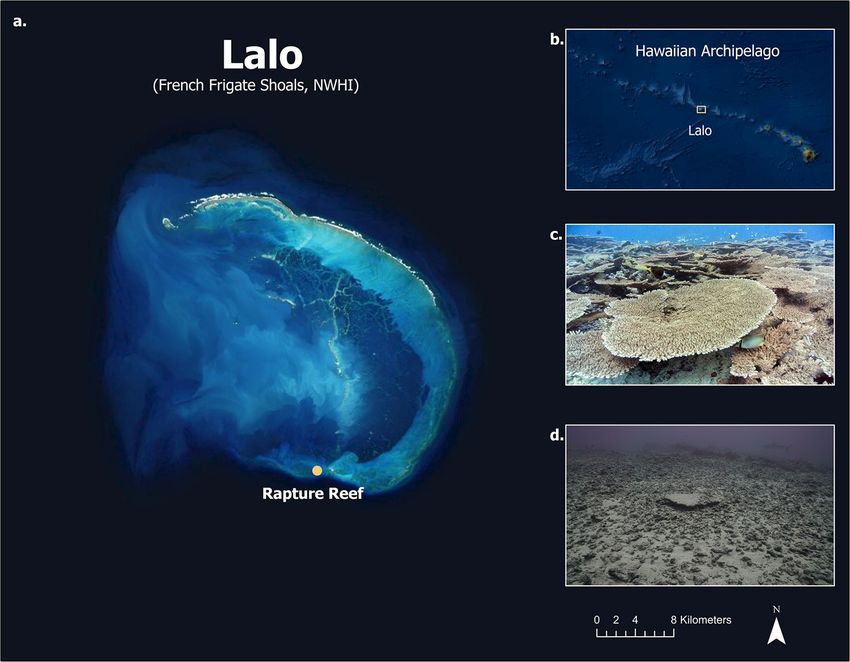
www.nature.com/scientificreports/
Figure 1. Aerial imagery of (a) Rapture Reef, Lalo (French Frigate Shoals) within the Northwestern Hawaiian
Islands. Inset map of (b) the Hawaiian Archipelago and Lalo’s location. Images showing coral and fish
abundance at Rapture Reef (c) before (September 2017) and (d) after (July 2019) Hurricane Walaka.
to date, passed through the NWHI reaching and travelling along a high latitude of 23° N orth14,15. Walaka origi-
nated from an area of low pressure south-southeast of Hawai‘i Island and strengthened as it entered the Central
Pacific, eventually becoming a Category 5 hurricane on the Saffir-Simpson Hurricane Scale. Hurricane Walaka
produced maximum high winds of 205 km/h, and the wave heights associated with the hurricane while it passed
through Lalo (French Frigate Shoals) in the NWHI on 3 October 2018 are estimated to have been 11–15 m (per
comms. Central Pacific Hurricane Center). The hurricane caused severe damage to coral reefs on the southern
end of the shoal and destroyed a unpopulated island of Lalo named East I sland14,15.
We applied photogrammetric techniques to quantify structural changes caused by Hurricane Walaka to an
iconic coral-reef study site referred to as Rapture Reef (Fig. 1; 23.63509° N, 166.1857° W) on the southern end of
Lalo. Due to their isolation, scientists rarely have the opportunity to thoroughly document impacts of hurricane
and storm events on the coral reef ecosystems of the NWHI. Our existing 3D reconstruction data collected from
Rapture Reef in 2017, as part of a long-term reef morning project, provided us with a unique opportunity to
quantitatively examine changes in benthic cover and 3D habitat structure before and after the hurricane using the
high-resolution habitat models. We examined 3D habitat metrics at specific resolutions using analytical methods
that have been validated in previous studies to capture habitat architecture created by live c orals16,17. The main
objective of this study was to examine how different habitat metrics responded to the complete destruction of
the study site. The photogrammetry and data processing techniques presented here are valuable to any marine
ecologists requiring detailed quantitative analyses of changes occurring to 3D habitat complexity and can be
easily adapted into existing coral reef monitoring efforts.
Materials and methods
3D photogrammetry surveys. Rapture Reef is located at 20 ~ 30-m depth on the southern end of Lalo,
which is the largest atoll in the NWHI with a crescent-shaped reef that stretches approximately 32 km (Fig. 1).
Prior to Hurricane Walaka, Rapture Reef was well known for having high cover of tabulate Acropora coral that
supported an abundant and diverse population of reef fish18,19. This site has permanent pins at 26-m depth that
are used to facilitate long-term monitoring for several research objectives. Overlapping imagery were collected
to monitor a 10 × 5-m2 plot at this long-term monitoring site in September 2017 and July 2019 (i.e. before and
after the hurricane on 3 October 2018). Images were taken from a planar angle approximately 1 m above the
substrata in a boustrophedonic (lawn mower) pattern with 70 ~ 80% overlap between images (see Table 1 for
Scientific Reports | (2021) 11:12050 | https://doi.org/10.1038/s41598-021-91509-4 2
Vol:.(1234567890)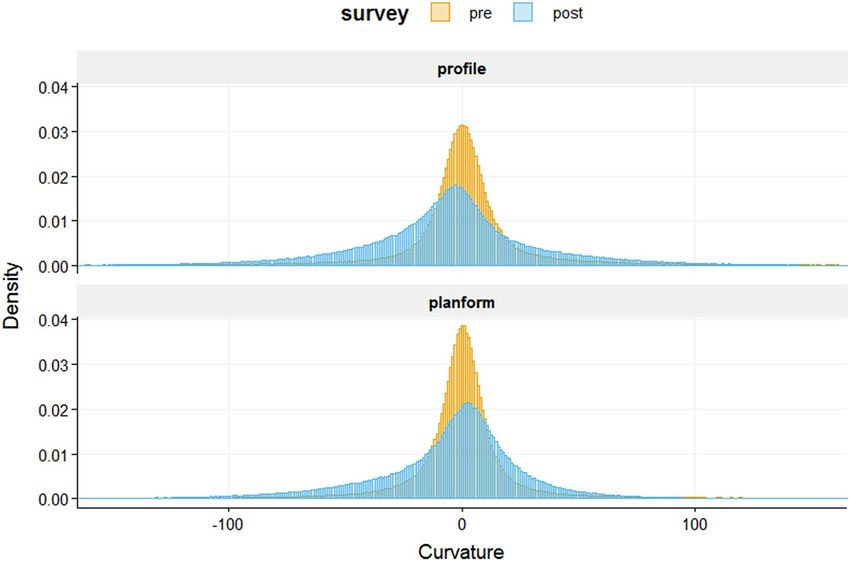
www.nature.com/scientificreports/
Camera specifications and settings
Camera Canon 5D III (2017), Sony Alpha 7 IIIR (2019)
Camera Lens 24-70 mm
Dome Port 8 in
Focal Length 24 mm
Shutter Speed 1/250 s
ISO Auto ISO
Aperture f/10
Table 1. Camera specifications and settings used for photogrammetry surveys.
Process Settings
Align photos High accuracy, generic preselection enabled, 50,000 key point limit, 5,000 tie point limit
Optimize camera alignment Use all the ones selected by the software
Build dense cloud Medium quality, mild depth filtering, reuse depth maps disabled
Build mesh Arbitrary surface type, high face count, interpolation enabled, calculate vertex colors enabled
Build texture Adaptive orthophoto mapping mode, mosaic blending mode, texture size/count 16,384, enable hole filling
Table 2. Settings used to generate 3D models in Agisoft Photoscan/Metashape Professional software.
details of camera specifications and settings). Scale bars with coded targets were placed at the corners of the plot
for orthorectification of the resulting 3D reconstructions.
Structure-from-motion (SfM) photogrammetry methods were used to create 3D reconstructions of the coral-
reef plot before and after the hurricane using Agisoft Photoscan/Metashape Professional software (Agisoft LLC.,
St. Petersburg. Russia) following the methods described in Burns et al.20 (Table 2). The software used the coded
targets on the scale bars to assign reference points to scale the models to a known local coordinate system. After
self-calibrating bundle adjustments were completed using the known reference points to optimize the alignment
of images, a dense point cloud and solid triangulated mesh were rendered. An orthophotomosaic and a Digital
Elevation Model (DEM) were then generated for each survey year and used for further analysis in CoralNet
website (coralnet.ucsd.edu) and statistical software R v.3.5.3 (R core team 2019), r espectively21.
Quantification of benthic cover. Two-dimensional orthophotomosaics were imported into CoralNet
website to compute the percent cover of corals, other invertebrates, algae and abiotic features. For each ortho-
photomoasic, 1000 random points were generated for manual annotation without any assistance from Coral-
Net’s auto-annotation function. All live coral were identified down to genus and morphology. Percent cover
was obtained for each survey by dividing the number of points for each category by the total annotation points.
Annotation points that landed on a transect tape, scale bars and mobile fauna were removed from total number
of annotation points.
Quantification of structural complexity. DEMs were exported at 1-cm raster resolution, which was
determined to be the smallest possible cell size while ensuring to be reasonably well within the range of model
accuracy (i.e. millimeter-level accuracy) as reported in the results by the ground sampling distance and Root
Mean Squared Error (RMSE) values obtained from ground control points (i.e. objects/features of known dis-
tances/dimensions) in the models. Both DEMs were processed in R using raster22 and rgeos23 packages follow-
ing the procedure of Fukunaga et al.24 to obtain the following habitat metrics (Data S1): surface complexity,
slope, vector ruggedness measure (VRM) and profile and planform c urvature22–24. We extracted habitat metrics
from 2.5-dimensional DEMs, which captured the reef habitats from a single projected overhead angle, rather
than Digital Surface Models (DSMs) due to the computational difficulties associated with quantifying 3D mesh
surfaces. Analyzing DEMs is a conventional approach for geospatial analyses of topographic features, and our
recent research has found the structural metrics used in this study to be highly correlated when extracted from
either a DEM or DSM17.
Surface complexity is analogous to reef rugosity measured by the classic chain-and-tape method and is cal-
culated for each DEM as the ratio of the total 3D surface area to 2D planar a rea25. Slope measures an elevational
change in degree (i.e. steepness) for each cell of a DEM using 3 × 3 raster cell windows (i.e. calculation of each cell
value is based on the elevation value of the cell and those of the surrounding eight cells)26,27. Vector ruggedness
measure is a computation of surface ruggedness based on the variability in the surface directions of DEM cells,
which are determined by a combination of slope and aspect (face direction), and is calculated for each cell using
3 × 3 cell windows27,28. Curvature measures the rate of change in slope; profile curvature looks at the direction
parallel to slope and planform curvature looks at the direction perpendicular to slope29. Similar to slope and
VRM, profile and planform curvature are calculated for each cell of a DEM using 3 × 3 cell windows.
Scientific Reports | (2021) 11:12050 | https://doi.org/10.1038/s41598-021-91509-4 3
Vol.:(0123456789)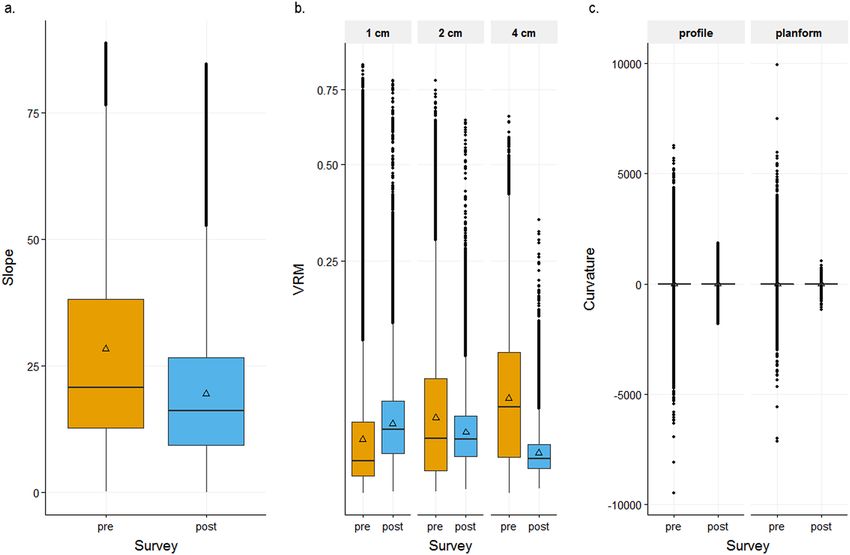
www.nature.com/scientificreports/
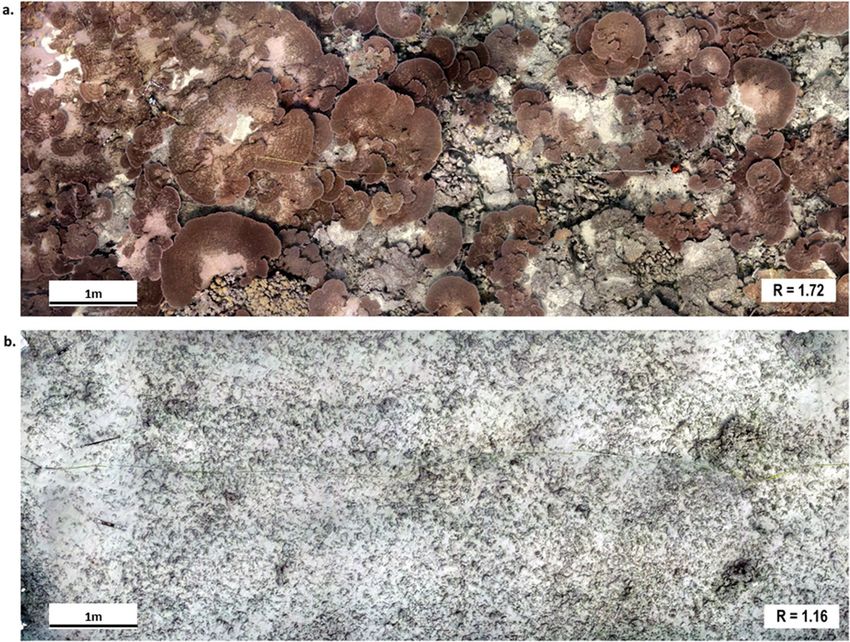
Figure 2. Orthophotomosaic (10 × 5-m) of the coral reef habitat and reef rugosity measurements (R) at Rapture
Reef (a) before (September 2017) and (b) after (July 2019) Hurricane Walaka.
All habitat metrics were computed at 1-cm DEM resolution. Additionally, the aggregate function in the
raster package was used to calculate VRM at 2- and 4-cm resolutions as VRM at these resolutions have varying
capacity to capture the structural complexity of certain coral morphologies, other sessile benthic organisms or
topographic features16,17. For example, this metric captures the structural complexity of branching corals at a
high resolution of 1 cm as the resolution is fine enough to capture coral branches17. The structural complexity of
mounding corals is, on the other hand, better captured at a low resolution of 4 cm, as this resolution can capture
the smooth convex surface of mounding morphology well and is course enough not to be affected by finer struc-
tures (e.g. coral branches)17. The habitat metrics computed in the present study were, therefore, reef rugosity at
1-cm resolution, slope at 1-cm resolution, VRM at 1-cm, 2-cm and 4-cm resolutions and profile and planform
curvature at 1-cm resolution. We aimed to capture the architectural complexity of branching and encrusting
corals with VRM at 1- or 2-cm resolution and the complexity of mounding and tabulate corals with VRM at
4-cm resolution16. Curvature was included as this metric has the potential to capture the structural complexity
of the survey plot created by surface topography such as holes and small ledge-like s tructure17.
The use of DEMs allowed us to utilize the entire DEM cells to calculate habitat metrics for the given area (i.e.
the reef plot), thus the entire distribution of each habitat metric could be compared before and after the hurri-
cane. We did not use any statistical tests to compare these values as we obtained the habitat metrics utilizing the
entire population (i.e. every single cell of the DEMs) within the reef plot, not random draws of samples from the
population. The mean and standard deviation values reported in the present study are the true mean and standard
deviation values of the population, not their estimates based on sample mean and standard deviation values, thus
any changes in these values before and after the hurricane are real changes that occurred within the reef plot.
Results
The change in the benthic community of Rapture Reef before and after the hurricane was striking and visually
apparent in site photographs (Fig. 1) and orthophotomosaics generated from the 3D reconstruction of the study
site (Fig. 2). These images highlight the dominance of live Acropora coral on the benthos before the hurricane,
while no live corals are evident after the hurricane. Numerically, the survey plot was comprised of 69.7% tabu-
late Acropora (mostly A. cytherea), 0.8% encrusting Porites, 0.1% encrusting Montipora, 1.7% crustose coralline
algae, 0.7% sand and 27.0% turf algae on hard substrata before the hurricane. Benthic cover after the hurricane
was 67.9% turf algae on rubble and 31.8% sand. There were no other invertebrates detected in the survey year
2017 or 2019.
Scientific Reports | (2021) 11:12050 | https://doi.org/10.1038/s41598-021-91509-4 4
Vol:.(1234567890)www.nature.com/scientificreports/
Figure 3. Boxplots of DEM cell values for each habitat metric before (pre) and after (post) Hurricane Walaka,
showing the ranges of (a) slope, (b) terrain ruggedness measure (VRM) at 1-, 2- and 4-cm resolutions with the
y axis in square-root scale and (c) planform and profile curvature. Mean values are displayed with a triangle
symbol within each boxplot.
Ground sampling distance (GSD) values (resolution/pixel) for the 3D reconstructions generated for survey
years 2017 and 2019 were 0.00128 m/pix and 0.00039 m/pix, with errors of 0.003 pixels and 0.073 pixels, respec-
tively. Root mean standard error (RMSE) values for ground control points for the 2017 and 2019 survey years
were 0.00143 m and 0.00136 m, respectively. Reef rugosity obtained at 1-cm DEM resolution decreased from 1.72
to 1.16 following Hurricane Walaka (Fig. 2). The mean value of slope also decreased from 28.13 to 19.44, as well
as the overall range and the standard deviation (SD) from 21.50 to 13.38 (Fig. 3a). Similarly, mean VRM values
at 2- and 4-cm resolutions decreased from 0.045 (SD = 0.069) to 0.023 (SD = 0.028) and from 0.062 (SD = 0.076)
to 0.010 (SD = 0.015), respectively (Fig. 3b). Conversely, mean VRM at 1-cm resolution increased from 0.027
(SD = 0.055) to 0.030 (SD = 0.034) (Fig. 3b). For curvature, mean planform curvature and mean profile curvature
decreased from 1.52 to − 5.75 and from 1.58 to − 5.75, respectively, but more notably, the overall ranges of both
profile and planform curvature dramatically decreased (Fig. 3c). The distribution of curvature values before the
hurricane exhibited higher standard deviation, thus variance (SD = 270.62 and 59.31 before and after the hurri-
cane, respectively, for profile curvature and 127.13 and 38.88 for planform curvature), as well as a higher density
of values close to 0 (i.e. flat; Fig. 4) in comparison to values extracted after the hurricane.
Discussion
This study used SfM photogrammetric techniques to quantify benthic community composition and 3D habitat
structural complexity of Rapture Reef before and after Hurricane Walaka. The destruction of live coral at Rapture
Reef after the hurricane, particularly the complete loss of the tabulate coral Acropora spp., was apparent from the
site photos (Fig. 1) and orthophotomosaics (Fig. 2). As the change in the benthic community composition was
so visually obvious, the use of orthophotomosaics to enumerate benthic cover might be deemed unnecessary in
this case. Nevertheless, it offered additional quantitative information, particularly about organisms that were not
dominant and visually-obvious components of the community (i.e. encrusting corals, crustose coralline algae
and turf algae), and the procedure is valuable for other studies that have to deal with subtle changes in benthic
community compositions caused by disturbance events.
The loss of Acropora coral at Rapture Reef was comparable to the severe damage to shallow coral reefs caused
by Hurricane Allen, a Category 5 hurricane, in Jamaica in 1980. Studies conducted after the impact of Hurricane
Allen found that 99% of all branching Acropora species were damaged on coral reefs at 6-m depth in comparison
with 9% mounding and 23% encrusting and plating morphologies2. In the present study, while the surf height
during Hurricane Walaka could only be estimated without a reliable means to measure, the surf and surge were
Scientific Reports | (2021) 11:12050 | https://doi.org/10.1038/s41598-021-91509-4 5
Vol.:(0123456789)www.nature.com/scientificreports/
Figure 4. Density plot showing distribution of planform and profile curvature values between − 100 and 100
before (pre) and after (post) Hurricane Walaka. Note that the density was calculated for each curvature type
using the entire data, not just those between − 100 and 100.
clearly large enough to obliterate the live coral at a depth of 26 m. Structurally complex and fragile branching or
tabulate corals are physically susceptible to breakage from wave actions, and tabulate corals are also easily sub-
jected to full mortality by dislodgement due to their large, top-heavy morphology11. The dominance of tabulate
Acropora prior to the hurricane likely made Rapture Reef particularly susceptible to the impact of the intense
wave energy created by the hurricane.
The shift in the benthic community composition at Rapture Reef resulted in changes in the structural com-
plexity of the habitat. An overall decrease in reef rugosity at 1-cm resolution was detected after the hurricane.
Decreases in mean slope at 1-cm resolution, mean VRM at 2- and 4-cm resolutions and mean profile and plan-
form curvature at 1-cm resolution were also detected. Conversely, mean VRM at 1-cm resolution increased after
the hurricane (Fig. 3). These different metrics possess unique properties in capturing the structural complexity
of a coral-reef h abitat17. Collectively examining metrics of 3D structural complexity provides us with important
insights into the impact of Hurricane Walaka on the habitat architecture of Rapture Reef. The decrease in reef
rugosity represents an overall decrease in 3D surface area after the hurricane, while the decrease in mean slope
is likely due to loss of vertical relief resulting from live corals (mostly tabulate Acropora) turning into rubble as
slope is the measure of steepness26,27 (Table 3).
VRM quantifies the variability in the slope and aspect of each DEM cell and ranges from 0 (no variation) to
1 (highest variation), with most natural environments exhibiting VRM values of less than 0.4028. The resolution-
specific response of the VRM metric (Fig. 3b) was consistent with our previous studies where we found the
structural complexity of branching corals and rubble being captured at relatively high resolutions, encrusting
corals and crustose coralline algae at intermediate resolutions and tabulate and mounding corals at relatively low
resolutions16,17 (Table 3). The increase in mean VRM at 1-cm resolution after the hurricane in the present study
can be explained by high variability in aspects and slopes created by individual pieces of rubble being captured
at this resolution. The decrease in the mean VRM at 4-cm resolution was due to the complete loss of Acropora,
as this lower resolution more effectively captured variability in slope and aspect associated with the overhang
structure created by the tabulate coral morphology (Table 3).
Curvature metrics do not monotonically respond to changes in structural complexity, as a flat surface has a
curvature value of 0 and the value increases towards either the positive or negative direction depending on the
concavity/convexity of the surface29. In coral-reef habitats, the juxtaposition of concavity and convexity makes
interpretation of mean curvature values difficult. The overall distribution of curvature values obtained from the
DEM offers more meaningful information for interpreting the complexity of coral-reef h abitats17 (Table 3). In
the present study, the variance in curvature values at 1-cm resolution dramatically decreased following Hurri-
cane Walaka, with extreme positive and negative values being observed in the pre-hurricane DEM disappearing
in the post-hurricane DEM (Fig. 3c). Such extreme curvature values derive from sudden changes in slope and
are likely generated by the tabulate Acropora coral in the present s tudy17. As our DEMs were rendered from a
planar perspective, an abrupt drop in elevation and sudden change in slope occurs at the edge of the table-top
Scientific Reports | (2021) 11:12050 | https://doi.org/10.1038/s41598-021-91509-4 6
Vol:.(1234567890)www.nature.com/scientificreports/
3D habitat metric Resolution Statistic Suited to capture Supporting references Original references
Overall changes in 3D surface area 22 23
Surface complexity 1 cm N/A , present study
relative to 2D planar area
Overall changes in vertical relief
22,29 24,25
Slope 1 cm Mean (including loss of tabulate and , present study
mounding corals)
Vector ruggedness measurement Structural complexity of branching, 28,29 25,26
1 or 2 cm Mean , present study
(VRM) encrusting corals, and rubble
Structural complexity of mounding 28,29
4 cm Mean , present study
and tabulate corals
Holes and ledges, including the 29 27
Profile and planform curvature 1 cm Range/Variance , present study
"drops" created by tabulate corals
1–8 or 16 cm for corals, but range is Overall structural complexity of 22,28,29 34,35
Fractal dimension N/A
case dependent corals and crustose coralline algae
Table 3. Summary table showing properties of different habitat metrics that are recommended for
characterization of coral-reef habitats. Listed are the recommended habitat metrics and resolutions, statistic
(n/a means that there is only a single value produced per DEM), suitable benthic features to capture, references
that support this recommendation, and original references of each metric.
structure of the Acropora coral (Table 3). Tabulate corals can also create the illusion of leveled (i.e. flat) surface,
as 1-cm resolution is too coarse to capture the fine-scale structures of small interlacing branches and tube-like
corallites. This can explain the higher proportion of DEM cells having curvature values closer to 0 before the
hurricane than after the hurricane (Fig. 4).
The present study quantified structural damage caused by Hurricane Walaka at a single site of Lalo (i.e.
Rapture Reef) and was not designed to assess the overall impacts of the hurricane. Rather, with the presence
of pre-hurricane 3D reconstruction from a long-term monitoring project, it utilized the unique opportunity to
determine how the complete destruction of the living coral community and entire loss of aggregate carbonate
reef structure affected metrics of 3D structural complexity. The entire loss of aggregate carbonate habitat presents
a novel scenario as other studies examining changes in 3D habitat structure following large-scale coral mortality
studied habitats that retained the carbonate reef structure from the coral s keletons8,30,31. The use of the DEMs
rendered from the planar (overhead) angle in the present study meant that the habitat created under the tabulate
Acropora at the reef site (mostly A. cytherea) would not be effectively captured in the DEMs. Nevertheless, the
presence of Acropora in the pre-hurricane plot and its loss in the post-hurricane plot were sufficiently captured
by the changes in mean slope, mean VRM at 4-cm resolution and the range in curvature values. The varying (i.e.
resolution-specific) responses of VRM also highlights the importance of understanding the unique properties
of different habitat metrics; if VRM at 1-cm resolution was the only metric to be used to quantify the changes in
the structural complexity before and after the hurricane, we would have reached, counterintuitively, a conclusion
of an increase in the structural complexity of the reef site. This study illustrates the value of examining metrics
of 3D habitat complexity across a range of scales and resolutions to accurately measure how changes in benthic
composition will impact the architectural complexity of coral reef habitats, and in turn, affect reef biodiversity.
Table 3, which synthesizes and summarizes findings from our previous and current studies, should provide some
guidance to identify appropriate habitat metrics and resolutions to quantify specific habitat features.
The importance of reef rugosity or surface complexity to the health and function of coral-reef ecosystems has
been known for decades, with many studies documenting positive associations between the structural complexity
of habitats and reef fish a ssemblages6,25,32,33. Acropora cytherea creates structurally complex habitats due to the
distinct tabulate morphology and associated overhangs where reef fishes are often found in high a bundance19,20.
Despite the high abundance and diversity of reef fish at Rapture Reef prior to the hurricane18,19, no reef fish was
observed at the site during the 2019 survey with the exception of a single shark (K.H.P. personal observation),
highlighting the potentially devastating impact of the loss of structural complexity and microhabitat created by
tabulate Acropora on the reef ecosystem. The post-hurricane data in the present study can now serve as baseline
data to document the potential recovery of iconic Rapture Reef in coming years, being contingent upon successful
coral recruitment onto the unstable substratum consisting of unconsolidated rubble. Proper understanding of
unique properties of different 3D habitat metrics, with varying capacity to capture the structural complexity of
different morphologies and topographic features, is vital when quantifying the structural changes in coral-reef
habitats over time. As extreme weather events are expected to increase in frequency and severity due to climate
change, such understanding is essential to continuous long-term monitoring and assessment of ecologically,
economically, and culturally important coral reef ecosystems.
Received: 17 December 2020; Accepted: 26 May 2021
References
1. Hoegh-Guldberg, O. et al. Coral reefs under rapid climate change and ocean acidification. Science 318, 1737–1742 (2007).
2. Woodley, J. D. et al. Hurricane Allen’s impact on Jamaican coral reefs. Science 214, 749–755 (1981).
3. Scoffin, T. P. The geological effects of hurricanes on coral reefs and the interpretation of storm deposits. Coral Reefs 12, 203–221
(1993).
Scientific Reports | (2021) 11:12050 | https://doi.org/10.1038/s41598-021-91509-4 7
Vol.:(0123456789)www.nature.com/scientificreports/
4. Browning, T. N. et al. Widespread deposition in a Coastal Bay following three major 2017 Hurricanes (Irma, Jose, and Maria). Sci.
Rep. 9, 7101. https://doi.org/10.1038/s41598-019-43062-4 (2019).
5. Rogers, C. S. Immediate effects of hurricanes on a diverse coral/mangrove ecosystem in the US Virgin Islands and the potential
for recovery. Diversity 11, 130 (2019).
6. Graham, N. A. J. & Nash, K. L. The importance of structural complexity in coral reef ecosystems. Coral Reefs 32, 315–326 (2013).
7. Newman, S. P. et al. Reef flattening effects on total richness and species responses in the Caribbean. J. Anim Ecol. 84, 1678–1689
(2015).
8. Burns, J. H. et al. Assessing the impact of acute disturbances on the structure and composition of a coral community using innova-
tive 3D reconstruction techniques. Methods Oceanogr. 15, 49–59 (2016).
9. Massel, S. R. & Done, T. J. Effects of cyclone waves on massive coral assemblages on the Great Barrier Reef: Meteorology, hydro-
dynamics and demography. Coral Reefs 12(3–4), 153–166 (1993).
10. Madin, J. S. & Connolly, S. R. Ecological consequences of major hydrodynamic disturbances on coral reefs. Nature 444(7118),
477–480 (2006).
11. Madin, J. S., Baird, A. H., Dornelas, M. & Connolly, S. R. Mechanical vulnerability explains size-dependent mortality of reef corals.
Ecol. Lett. 17(8), 1008–1015 (2014).
12. Bellwood, D. R. & Hughes, T. P. Regional-scale assembly rules and biodiversity of coral reefs. Science 292, 1532–1535 (2001).
13. Friedlander, A. et al. The state of coral reef ecosystems of the Northwestern Hawaiian Islands. The state of coral reef ecosystems
of the United States and Pacific Freely Associated States. PLoS ONE 73, 263–306 (2005).
14. Houston, S. & Birchard, T. Central Pacific Hurricane Center Tropical Cyclone Report, Hurricane Walaka. https://www.nhc.noaa.
gov/data/tcr/CP012018_Walaka.pdf (2020).
15. Nugert, A. D. et al. Fire and rain: The legacy of Hurricane Lane in Hawai ‘i. Bull. Am. Meteorol. Soc. 101, 954–967 (2020).
16. Fukunaga, A., Burns, J. H. R., Pascoe, K. H. & Kosaki, R. K. Associations between benthic cover and habitat complexity metrics
obtained from 3D reconstruction of coral reefs at different resolutions. Remote Sens. 12, 1011 (2020).
17. Fukunaga, A. & Burns, J. H. R. Metrics of coral reef structural complexity extracted from 3D mesh models and digital elevation
models. Remote Sens. 12, 2676 (2020).
18. Meyer, C. G., Holland, K. N. & Papastamatiou, Y. P. Seasonal and diel movements of giant trevally Caranx ignobilis at remote
Hawaiian atolls: Implications for the design of marine protected areas. Mar. Ecol. Prog. Ser. 12(333), 13–25 (2007).
19. Fukunaga, A., Kosaki, R. K. & Hauk, B. B. Distribution and abundance of the introduced snapper Lutjanus kasmira (Forsskål,
1775) on shallow and mesophotic reefs of the Northwestern Hawaiian Islands. Bioinvasions Rec. 6, 259–268 (2017).
20. Burns, J. H., Delparte, D., Gates, R. D. & Takabayashi, M. Integrating structure-from-motion photogrammetry with geospatial
software as a novel technique for quantifying 3D ecological characteristics of coral reefs. PeerJ 3, e1077. https://doi.org/10.7717/
peerj.1077 (2015).
21. R Core Team. R: A Language and Environment for Statistical Computing, v. 3.5.3 (R Foundation for Statistical Computing, 2019).
https://www.R-project.org (2019).
22. Hijmans, R. J. raster: Geographic Data Analysis and Modeling, R package Version 2.9-5, https://C RAN.R-p rojec t.o
rg/p
ackag e=r aster
(2019)
23. Bivand, R. & Rundel, C. rgeos: Interface to Geometry Engine—Open Source (GEOS), R package version 0.4-3. https://CRAN.R-proje
ct.org/package=rgeos (2019).
24. Fukunaga, A., Burns, J. H. R., Craig, B. K. & Kosaki, R. K. Integrating three-dimensional benthic habitat characterization techniques
into ecological monitoring of coral reefs. J. Mar. Sci. Eng. 7, 27 (2019).
25. Risk, M. J. Fish diversity on a coral reef in the Virgin Islands. Atoll Res. Bull. 153, 1–4 (1972).
26. Horn, B. K. P. Hill shading and the reflectance map. Proc. IEEE 69, 14–47 (1981).
27. Walbridge, S., Slocum, N., Pobuda, M. & Wright, D. J. Unified geomorphological analysis workflows with Benthic Terrain Modeler.
Geosciences 8, 94 (2018).
28. Sappington, J. M., Longshore, K. M. & Thompson, D. B. Quantifying landscape ruggedness for animal habitat analysis: A case
study using bighorn sheep in the Mojave Desert. J. Wildl. Manage. 71, 1419–1426 (2007).
29. Zevenbergen, L. W. & Thorne, C. R. Quantitative analysis of land surface topography. Earth Surf. Process Landf. 12, 47–56 (1987).
30. Couch, C. S. et al. Mass coral bleaching due to unprecedented marine heatwave in Papahānaumokuākea Marine National Monu-
ment (Northwestern Hawaiian Islands). PLoS ONE 12(9), e0185121. https://doi.org/10.1371/journal.pone.0185121 (2017).
31. Magel, J. M. T., Burns, J. H., Gates, R. D. & Baum, J. K. Effects of bleaching-associated mass coral mortality on reef structural
complexity across a gradient of local disturbance. Sci. Rep. 9, 2515. https://doi.org/10.1038/s41598-018-37713-1 (2019).
32. Luckhurst, B. E. & Luckhurst, K. Analysis of the influence of substrate variables on coral reef fish communities. Mar. Biol. 49(4),
317–323 (1978).
33. Graham, N. A. J. et al. Dynamic fragility of oceanic coral reef ecosystems. Proc. Natl. Acad. Sci. USA 103, 8425–8429 (2006).
34. Mandelbrot, B. B. & Mandelbrot, B. B. The Fractal Geometry of Nature Vol. 1 (WH Freeman, 1982).
35. Young, G. C. et al. Cost and time-effective method for multi-scale measures of rugosity, fractal dimension, and vector dispersion
from coral reef 3D models. PLoS ONE 12, e0175341. https://doi.org/10.1371/journal.pone.0175341 (2017).
Acknowledgements
We would like to thank officers and crew of NOAA Ships Hi‘ialakai and Rainier and NOAA Papahānaumokuākea
Marine National Monument for their support and field assistance. We would also like to thank Brianna Craig,
Taylor Williams and Heather Spalding for field work assistance, and meteorologists at the Central Pacific Hur-
ricane Center for their estimation of Hurricane Walaka’s wave height. Image and data processing were completed
in the University of Hawai‘i at Hilo Multiscale Environmental Graphical Analysis (MEGA) Lab. Two anonymous
reviewers improved the manuscript through their input. This study was funded by NOAA’s Office of National
Marine Sanctuaries through the Papahānaumokuākea Marine National Monument, by the National Science
Foundation under the CREST-PRF Award #1720706 and EBSCoR Program Award OIA #1557349 to J.H.R.
Burns, and by the National Fish and Wildlife Foundation under Award # NFWF-UHH-059023 to J.H.R. Burns.
The scientific results and conclusions, as well as any views or opinions expressed herein, are those of the authors
and do not necessarily reflect the views of NOAA or the Department of Commerce.
Author contributions
K.H.P., A.F., and J.H.R.B. conceived the study; K.H.P. and A.F. methodology; K.H.P collected and processed
data; K.H.P., A.F. formal analysis; K.H.P. original draft preparation; K.H.P., A.F., R.K.K., and J.H.R.B. writing,
review and editing; K.H.P. and A.F. Figures and Tables; R.K.K. and J.H.R.B. funding acquisition. All authors
edited this manuscript.
Scientific Reports | (2021) 11:12050 | https://doi.org/10.1038/s41598-021-91509-4 8
Vol:.(1234567890)www.nature.com/scientificreports/
Competing interests
The authors declare no competing interests.
Additional information
Supplementary Information The online version contains supplementary material available at https://doi.org/
10.1038/s41598-021-91509-4.
Correspondence and requests for materials should be addressed to K.H.P.
Reprints and permissions information is available at www.nature.com/reprints.
Publisher’s note Springer Nature remains neutral with regard to jurisdictional claims in published maps and
institutional affiliations.
Open Access This article is licensed under a Creative Commons Attribution 4.0 International
License, which permits use, sharing, adaptation, distribution and reproduction in any medium or
format, as long as you give appropriate credit to the original author(s) and the source, provide a link to the
Creative Commons licence, and indicate if changes were made. The images or other third party material in this
article are included in the article’s Creative Commons licence, unless indicated otherwise in a credit line to the
material. If material is not included in the article’s Creative Commons licence and your intended use is not
permitted by statutory regulation or exceeds the permitted use, you will need to obtain permission directly from
the copyright holder. To view a copy of this licence, visit http://creativecommons.org/licenses/by/4.0/.
© The Author(s) 2021
Scientific Reports | (2021) 11:12050 | https://doi.org/10.1038/s41598-021-91509-4 9
Vol.:(0123456789)You can also read