TROPICAL HURRICANES In the age of global warming - Paul Homewood - The Global Warming Policy Foundation
←
→
Page content transcription
If your browser does not render page correctly, please read the page content below

TROPICAL HURRICANES
In the age of global warming
                      Paul Homewood

The Global Warming Policy Foundation
GWPF Briefing 37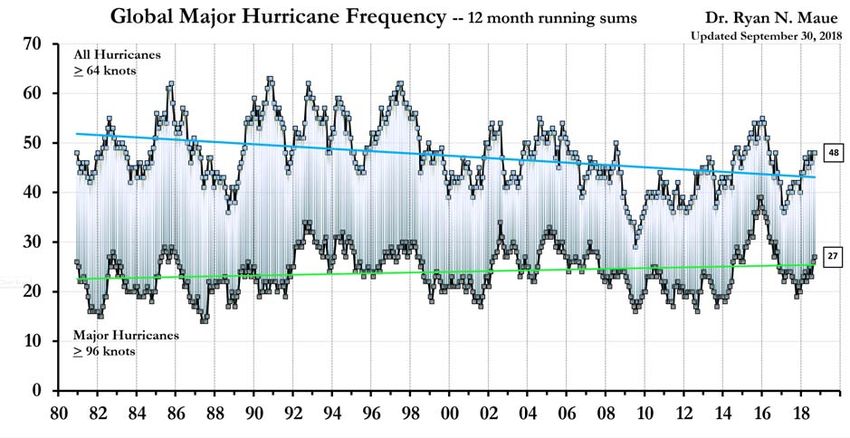
TROPICAL HURRICANES
In the age of global warming
Paul Homewood

© Copyright 2019 The Global Warming Policy Foundation
Contents

 About the author                                            vi
 Executive summary                                           vii
 1    Introduction                                            1
 2    Are hurricanes getting worse? – the theoretical case    1
 3    What does the IPCC say?                                 3
 4    Changes in observation methodology                      4
 5    US landfalling hurricanes                               6
 6    Atlantic hurricanes                                     6
 7    The Atlantic Multidecadal Oscillation                   6
 8    Global trends                                          10
 9    Tropical cyclone rainfall                              11
 10   Conclusions                                            12
 Notes                                                       13
About the author
Paul Homewood had a career as an accountant in industry. He has been writing on climate
and energy issues since 2011.

vi
Executive summary
2017 saw a particularly severe hurricane season in the North Atlantic. In addition, economic
losses from hurricanes are much greater than even a few decades ago. Together with 24/7
news coverage, these observations have led to renewed claims that global warming is lead-
ing to more frequent and more intense hurricanes. This idea is based on the concept that
hurricanes feed off warm waters: the warmer the waters, the more intense the hurricane. In
addition, economic losses from hurricanes are much greater than even a few decades ago,
simply because of greater wealth and urbanisation of vulnerable coastal areas. But what
does the actual data tell us?
     One of the problems in evaluating long-term hurricane trends is that there have been
wholesale changes in observation methodology since the 19th century. Until the 1940s,
there were only ships’ logs and ad-hoc land observations. Aircraft reconnaissance began
in the Atlantic in 1944, but there has only been full systematic coverage by satellites and
buoys since the 1970s. As a result, many hurricanes in earlier decades were not recorded at
all; others had their peak wind speeds underestimated. Several studies have been carried
out to try to ascertain the real underlying trends, and these were carefully considered by the
IPCC in their Fifth Assessment Report in 2013. Their verdict was clear:
      In summary, [there is] low confidence that any reported long-term (centennial) increases
      in tropical cyclone activity are robust, after accounting for past changes in observing
      capabilities. More recent assessments indicate that it is unlikely that annual numbers
      of tropical storms, hurricanes and major hurricanes counts have increased over the past
      100 years in the North Atlantic basin. Evidence, however, is for a virtually certain increase
      in the frequency and intensity of the strongest tropical cyclones since the 1970s in that
      region.
Since 2013, observational evidence has continued to support this assessment, as has new
studies.
     The longest and most reliable database of hurricanes is of US landfalling ones. NOAA’s
Hurricane Research Division has carefully reanalysed the original records of all hurricanes
up to 1960. Its HURDAT database shows that there has been no increase in the frequency of
hurricanes or major hurricanes (Category 3 and over) since the start of the record in 1851.
Prior to Harvey, no major hurricane had hit the US since Wilma in 2005, the longest such
period on record. In 2017, for instance, two major landfalling hurricanes – Harvey and Irma –
hit the US, but this is not unusual. In 1893, for instance, there were three, a number repeated
in 1909. The record year for landfalling hurricanes was 1886, when there were seven. Only
three Category 5 hurricanes have hit the US mainland: the Labor Day hurricane in 1935,
Camille in 1969, and Andrew in 1992.
     Data provided by HURDAT also shows that recent hurricane activity in the North Atlantic
has not been unusual by historical standards. In 2017, there were six major Atlantic hur-
ricanes, but the highest total recorded was eight in 1950. Of last year’s six, two were Cate-
gory 5 – Irma and Maria – but again, this is not unusual, having occurred five times previously,
including in 1932 and 1933.
     Historical data shows that Atlantic hurricanes, particularly major ones, were much more
common between about 1930 and 1960 than in the following three decades. Since 1990, the
numbers have returned to the earlier levels. It is widely accepted that this pattern is linked
to the Atlantic Multidecadal Oscillation (AMO), a natural reoccurring cycle of temperature
changes in the sea surface temperatures.

                                                                                                      vii
A database of global hurricanes is kept, with data going back to 1970. This shows an
increase in the number of major hurricanes and their accumulated energy between 1970
and 1993. This is associated with the AMO cycle too. Since 1993, there has been a decline in
the frequency of all hurricanes, major hurricanes and accumulated energy.
In summary, there is little evidence that global warming has resulted in more hurricanes,
or more intense ones in recent years. On the contrary, available evidence confirms that hur-
ricane and major hurricane frequency has been similar in many prior periods.
viii1 Introduction
Hurricanes are giant, spiralling tropical storms that can pack wind speeds of over 160 mph
and unleash more than 2.4 trillion gallons of rain a day. The Atlantic Ocean’s hurricane sea-
son peaks from mid-August to late October and averages five to six hurricanes per year.
Centuries ago, the Spanish used the term huracan, an indigenous word for evil spirits and
weather gods, for the storms that sank their ships in the Caribbean. Today ‘hurricane’ is one
of three names for a rotating tropical storm with winds of at least 74 mph (64 knots). These
storms are called ‘hurricanes’ when they develop over the Atlantic or eastern Pacific Oceans.
They are ‘cyclones’ when they form over the Bay of Bengal and the northern Indian Ocean,
and they are ‘typhoons’ when they develop in the western Pacific. All further references in
this paper will be to ‘hurricanes’, rather than cyclones/typhoons, for the sake of clarity.
It is natural that hurricanes tend to get more attention than ever nowadays, purely be-
cause of 24/7 media. However, it is also important to note that ever more people are liv-
ing in areas vulnerable to hurricanes, and that there is much more in the way of infrastruc-
ture, housing and general wealth at risk. Consequently, financial losses from these events,
whether insured or not, appear to be growing ever greater, even when inflation and GDP
growth are taken into account. But are hurricanes actually getting worse, either in terms
of frequency or severity? This paper is intended to review scientific research on hurricane
activity, including the Fifth Assessment Report of the Intergovernmental Panel on Climate
Change (IPCC AR5), and examine observational evidence, in the light of changes in observa-
tional practices since the 19th century.
Basic theory suggests that, as the oceans and atmosphere become warmer, hurricane
activity should become more intense, although projections of hurricane frequency are less
certain. Section 2 looks at some of these arguments in more detail.
Section 3 summarises the findings of the IPCC in AR5, and also considers relevant papers
published since.
Over the years, the way that hurricanes have been observed has changed radically. As a
result, many hurricanes are now recorded that would have been missed in the past. Further-
more, satellites are now able to continually assess wind speeds, thus recording peak wind
speeds that may have been missed in pre-satellite days. Section 4 discusses many of these
changes and their implications.
The longest and most consistent database of hurricanes is that of US landfalling hurri-
canes, for which NOAA’s Hurricane Research Division keeps data going back to 1851, and
these are analysed in Section 5. Its data for Atlantic hurricanes are discussed in Section 6.
As the IPCC reported in AR5, evidence shows that there has been an increase in the fre-
quency and intensity of the strongest hurricanes since the 1970s. Section 7 examines the
role of the Atlantic Multidecadal Oscillation in the phenomenon.
Section 8 looks at global hurricane trends since 1970, whilst Section 9 reviews studies
concerning trends in hurricane rainfall.
2 Are hurricanes getting worse? – the theoretical case
The claim that hurricanes are becoming worse is made so frequently these days, both by
scientists and media, that it seems to have been accepted as a universal truth. Only recently,
the MIT Technology Review talked about ‘hyperactive hurricanes’, resulting from an ‘altered
world’,1 while MIT’s Professor Kerry Emmanuel claimed that global warming increased the
1of risk Hurricane Harvey-level rainfall. 2 Dr Michael Mann claimed that Harvey was almost
certainly more intense than it would have been in the absence of human-caused warming,
which means stronger winds, more wind damage and a larger storm surge. 3 And so on and
so forth. Such claims revolve around the concept that hurricanes feed off warm waters. If
seas are getting warmer as a result of climate change, so the argument goes, surely hurri-
canes must increase in intensity as a result.
However, in AR5, the IPCC found that there was low confidence in basin-scale and global
projections of trends in hurricane frequency to the mid 20th century. 4 They also went on to
say that although some studies project near-term increases in the frequency of the strongest
(Category 4–5) hurricanes, there is low confidence in near-term intensity projections in all
ocean basins.
As a specific exercise, Dr Roy Spencer compared major hurricane landfalls in Texas with
Gulf of Mexico sea surface temperatures, and found little correlation (Figure 1).
1.0
0.6
0.2
-0.2
-0.6
-1.0
1870 1890 1910 1930 1950 1970 1990 2010
Figure 1: Sea surface temperatures and hurricanes.
Blue line: Sea surface temperature anomaly in western Gulf of Mexico (25–30°N, 90–100°W).
Red dots: years of major hurricane strikes in Texas. Source: Roy Spencer.
As he pointed out, the Gulf is warm enough every summer to produce a major hurricane.
Many other factors are involved, and reasons why systems intensify are not well understood. 5
Many complex factors determine hurricane formation. Julian Heming, the Met Office’s trop-
ical prediction scientist, has offered some reasons why Irma became such a big hurricane in
2017:6
2• The wind shear (change in wind with height) is low, meaning air can flow in up and
out of the hurricane very efficiently, thus promoting intensification.
• There are no drying influences at present, such as pockets of Saharan dust which
sometimes drift out over the Atlantic.
• Irma is moving fast enough to prevent cool water up-welled under the hurricane
from having any impact on the continued feed of warm, moist air into the hurri-
cane.
• Up until now there has been no interaction with large land masses that might dis-
rupt intensification due to cutting off the moisture supply.
Research has revealed that periods of intense Atlantic hurricane activity coincide with abun-
dant Sahel rainfall. And, of course, the reverse is true – Sahel droughts coincide with low
hurricane-intense periods. These events are not coincidental; they are all part and parcel of
the same climatic regime.7
What is apparent from even this small selection of observations is that the topic is an
extremely complex one. But, of course, all of the discussion so far concerns the theory. But
what do the actual observations tell us?
3 What does the IPCC say?
The IPCC Fifth Assessment Report considered the science in great detail, and concluded:
[There is] low confidence that any reported long-term (centennial) increases in tropi-
cal cyclone activity are robust, after accounting for past changes in observing capabili-
ties. More recent assessments indicate that it is unlikely that annual numbers of tropical
storms, hurricanes and major hurricanes counts have increased over the past 100 years
in the North Atlantic basin. Evidence, however, is for a virtually certain increase in the
frequency and intensity of the strongest tropical cyclones since the 1970s in that re-
gion.8
Since AR5, there have been two papers of note. Msadek et al. (2015) reviewed past,
present and future North Atlantic hurricane activity, based on an analysis of observational
records and models projections. They stated that, when adjusted for likely missed tropical
cyclones, the observational record shows no significant increase or decrease in North At-
lantic hurricane frequency.9 Then, in 2016, Walsh et al. reported as follows:
. . . geological records of past climates have shown century-long variations in [hurricane]
numbers. While no significant trends have been identified in the Atlantic since the late
19th century, significant observed trends in [hurricane] numbers and intensities have
occurred in this basin over the past few decades, and trends in other basins are increas-
ingly being identified. However, understanding of the causes of these trends is incom-
plete, and confidence in these trends continues to be hampered by a lack of consistent
observations in some basins.10
The overall message is quite clear – that there is little evidence of long-term trends. Two
specific issues emerge though:
• There have been changes in observation methods.
• There have been important North Atlantic trends since 1970.
These will be addressed later in this paper.
34 Changes in observation methodology
Since the 19th century, the way we observe, monitor and measure hurricanes has changed
out of all recognition (Figure 2), as Hagen and Landsea summarised: 11
The Atlantic hurricane database (or HURDAT) extends back to 1851. However, because
tropical storms and hurricanes spend much of their lifetime over the open ocean – some
never hitting land – many systems were ‘missed‘ during the late 19th and early 20th cen-
turies (Vecchi and Knutson 2008). Starting in 1944, systematic aircraft reconnaissance
was commenced for monitoring both tropical cyclones and disturbances that had the
potential to develop into tropical storms and hurricanes. This did provide much im-
proved monitoring, but still about half of the Atlantic basin was not covered (Sheets
1990). Beginning in 1966, daily satellite imagery became available at the National Hur-
ricane Center, and thus statistics from this time forward are most complete (McAdie et
al. 2009). For hurricanes striking the USA Atlantic and Gulf coasts, one can go back fur-
ther in time with relatively reliable counts of systems because enough people have lived
along coastlines since 1900.12
In the Pacific and Indian Oceans, early coverage was even less comprehensive. Full satellite
coverage may not have been available till around 1980. 13
QuikSCAT
AMSU
Aircraft satellite data link
Ocean data buoys
Aircraft launched dropsondes
Geostationary satellites
Polar orbiting satellites
NOAA aircraft reconnaissance
Coastal radar network (conventional)
Military aircraft reconnaissance
Radiosonde network
Transmitted ship observations
Ships’ logs and land observations
1850 1900 1910 1920 1930 1940 1950 1960 1970 1980 1990 2000
Figure 2: Changes in hurricane detection technologies.
The grey bar in the period 1944–53 is the baseline for period against which Category 5 activity
is measured. Adapted from McAdie et al. (2009).
This lack of coverage has a particular impact on the reporting of short-lived storms, which
would often have been ‘missed’ in earlier decades. Vecchi and Knutson made allowance for
this, and concluded that (see Figure 3):
. . . there is a small nominally positive upward trend in tropical storm occurrence from
1878–2006. But statistical tests reveal that this trend is so small, relative to the variability
in the series, that it is not significantly distinguishable from zero. . . Thus the historical
4tropical storm count record does not provide compelling evidence for a greenhouse
warming induced long-term increase. 14
60
Number of Atlantic storms in 5-yr period
40
20
Moderate-duration storms
adjusted for missing records
Short-duration storms
0
1880 1900 1920 1940 1960 1980 2000
Figure 3: Effect of better observations.
Count of Atlantic hurricanes lasting more than 2 days is not increasing. Count of storms lasting
less than 2 days has increased sharply, probably due to better observations. Adapted from
Landsea et al. (2009).
It is not only the number of storms which has tended to be underestimated. Hagen and
Landsea demonstrated that the strength of the most intense, Category 5 hurricanes were
also underestimated prior to the satellite era:
Observations of the peak intensity in strong hurricanes were much less common during
the late 1940s/early 1950s when compared with recent years because the ability to mea-
sure the central pressure and peak winds in major hurricanes was very limited during the
late 1940s/early 1950s. A Category 5 designation would be possible if a hurricane made
landfall as a Category 5 at or very near a weather station, or if a ship passed through the
center while at Category 5 intensity. Aircraft reconnaissance was generally only capable
of recording Category 4 conditions at most because of the inability to penetrate intense
hurricanes.11
They re-analysed ten Category 5 hurricanes, which occurred between 1992 and 2007, and
found that, using 1940s’ technology, only two would have been categorised as Category 5.
Both of these, Andrew and Mitch, made landfall at Category 5. They concluded that, prior
to the satellite era, several Category 4 and 5 hurricanes were probably misclassified as being
weaker.
It is clear from all of the above that both the frequency and intensity of hurricanes were
underestimated prior to the satellite era, making the measurement of long-term trends ex-
tremely difficult.
55 US landfalling hurricanes
The longest database of hurricanes is for those striking the USA Atlantic and Gulf Coasts. As
the Hurricane Research Division (HURDAT) states:
For hurricanes striking the USA Atlantic and Gulf coasts, one can go back further in
time with relatively reliable counts of systems because enough people have lived along
coastlines since 1900. Thus, the following records for the period of reliable data hold for
the entire Atlantic basin (from 1966–2016) and for the USA coastline (1900–2016). 12
HURDAT actually keep records going back to 1851, and have carefully reanalysed all hurri-
canes up to 1960, as original measurements of wind speeds may not have been accurate,
particularly in the earlier years. The reanalysed data is shown in Figure 4a. There is no sug-
gestion that hurricanes are becoming more frequent. The series average is 2.2 hurricanes
per year. Since 2000, there have been 28, an average of 1.5 per year. The busiest year was
1886, when there were seven.
Again, with major hurricanes (Category 3 and stronger), there is no apparent trend (Fig-
ure 4b). The years of 2004 and 2005 were unusually busy ones, but the gap between those
and the next major hurricane in 2017 is the longest period on record without a major hur-
ricane. (Note that the categories refer to the wind speed at landfall). There is no evidence
that either event is not due to natural factors.
Only three Category 5 storms have hit the US mainland:
• Labor Day – 1935
• Camille – 1969
• Andrew – 1992.
This number is too small to allow conclusions to be drawn.
6 Atlantic hurricanes
According to HURDAT, the period of reliable data held for the entire Atlantic basin is 1966–
2016.12 Even though some hurricanes were missed prior to 1966, it is clear that earlier peri-
ods, such as the 1940s and 1950s, were comparable to the last two decades (Figure 5). For
instance, between 2009 and 2018 there have been 69 hurricanes, of which 28 were major.
During the 1950s, there were also 69 hurricanes, including 39 major ones. Although 2017
was a busy year, it was by no means unprecedented, either in total hurricanes or majors.
7 The Atlantic Multidecadal Oscillation
The increase in the frequency and intensity of hurricanes in the North Atlantic since the
1970s, as identified by the IPCC, is very clearly shown in Figure 5. But it is equally clear that
this is part of a cyclical pattern, with greater frequency and intensity in the 1940s and 1950s.
This is also borne out in the US landfalling data. This cycle corresponds closely with the At-
lantic Multidecadal Oscillation (AMO; Figure 6). During the 1950s and 1960s, and again since
around 1995, the AMO was in its warm phase. In contrast, the quiet hurricane years of the
1960s to 1980s marked the cold phase. NOAA explain the effects of the AMO on Atlantic
hurricanes:
. . . during warm phases of the AMO, the numbers of tropical storms that mature into se-
vere hurricanes is much greater than during cool phases, at least twice as many. Since
68
7
6
Number of hurricanes
5
4
3
2
1
0
1850 1870 1890 1910 1930 1950 1970 1990 2010
(a) All hurricanes
4
Number of hurricanes
3
2
1
0
1850 1870 1890 1910 1930 1950 1970 1990 2010
(b) Intense hurricanes (Category 3 and above)
Figure 4: Continental US landfalling hurricanes 1851–2018.
Source: Hurricane Research Division data.
716
14
12
Number of hurricanes
10
8
6
4
2
0
1850 1870 1890 1910 1930 1950 1970 1990 2010
(a) All hurricanes
9
8
7
Number of hurricanes
6
5
4
3
2
1
0
1850 1870 1890 1910 1930 1950 1970 1990 2010
(b) Intense hurricanes (Category 3 and above)
Figure 5: Atlantic hurricanes 1851–2018.
Source: Hurricane Research Division data.
80.4
0.3
0.2
0.1
0
-0.1
-0.2
-0.3
-0.4
-0.5
1900 1920 1940 1960 1980 2000
Figure 6: Atlantic Multidecadal Oscillation 1895–2017.
Jan–Dec average. y -axis is an anomaly scale.
the AMO switched to its warm phase around 1995, severe hurricanes have become much
more frequent and this has led to a crisis in the insurance industry.
The frequency of weak-category storms – tropical storms and weak hurricanes – is not
much affected by the AMO. However, the number of weak storms that mature into ma-
jor hurricanes is noticeably increased. Thus, the intensity is affected, but, clearly, the
frequency of major hurricanes is also affected. In that sense, it is difficult to discrimi-
nate between frequency and intensity and the distinction becomes somewhat mean-
ingless.15
They also state that:
. . . instruments have observed AMO cycles only for the last 150 years. However, studies
of paleoclimate proxies, such as tree rings and ice cores, have shown that oscillations
similar to those observed instrumentally have been occurring for at least the last millen-
nium. This is clearly longer than modern man has been affecting climate, so the AMO is
probably a natural climate oscillation.
Landsea also found that much of the multidecadal hurricane activity can be linked to the
Atlantic Multidecadal Mode.16 In 1991, he also noted that hurricane activity during different
phases of the AMO were intrinsically tied in with Western Sahel rainfall patterns – low Atlantic
hurricane activity and Sahel drought during the cold phase of the AMO were part of the
same weather patterns, just as more intense hurricane activity and greater Sahel rainfall were
associated during the warm phase. 17
Walsh et al. also observe that the Atlantic basin has significant multidecadal variability
in hurricane activity levels, with a more active period from the mid-1870s to the late 1890s
as well as from the mid-1940s to the late 1960s. These periods may have had levels of activ-
ity similar to what has been observed since the mid-1990s. 10 Both of these earlier periods
coincided with the warm phase of the AMO.
9Wang et al. also showed that during the cold phase of the AMO, reduced rainfall in the
Sahel led to a higher concentration of dust over the North Atlantic, which in turn led to fewer
Atlantic hurricanes.18
Finally, a new study by Balaguru et al. has identified that in the last 30 years, rapid inten-
sification of North Atlantic hurricanes has been occurring more frequently in the central and
eastern Atlantic because of the AMO shift. 19
As noted in Section 3, IPCC AR5 reported that there has been an increase in the frequency
of very intense hurricanes in the North Atlantic since the 1970s. Whether this can be wholly
explained by the AMO cannot be known at this stage. It would require several cycles of the
AMO, with comprehensive availability of hurricane data, to be able to draw any conclusions
with confidence.
8 Global trends
As noted, daily satellite imagery did not become available until 1966, and comprehensive
coverage probably did not occur till around 1980. However, Dr Ryan Maue keeps track of
global tropical cyclone data, going back to 1970 (Figure 7). 20 There is little evident trend in
Figure 7: Global major hurricane frequency.
Source: Ryan Maue.20
the frequency of all hurricanes, but an apparent increase in the number of major ones.
Maue also monitors accumulated cyclone energy (ACE), a measure used by various agen-
cies including NOAA, to express the activity of individual tropical cyclones and entire tropical
cyclone seasons. It uses an approximation of the wind energy of a tropical system over its
lifetime and is calculated every six hours. The ACE of a season is the sum of the ACEs for
each storm and thus takes into account the number, strength, and duration of all the tropi-
cal storms in the season.
Figure 7 indicates that the increase in ACE since the 1970s has been confined to the
Northern Hemisphere. We have seen in Figure 4 that the frequency of major hurricanes
101200
Accumulated cyclone energy (104 knots2 )
1000
800
600
400
200
0
1970 1978 1986 1994 2002 2010 2018
Global Northern Hemisphere Southern Hemisphere
Figure 8: Global hurricane ACE.
Source: Ryan Maue.20
in the North Atlantic has increased significantly since the 1970s, correlating with the AMO
cycle. Both the frequency of global major hurricanes and the increase in Northern Hemi-
sphere ACE fit into this pattern. Both exhibit a step change in the 1990s, since when trends
have changed little. Again, this fits in with the North Atlantic data. By contrast, trends in
the Southern Hemisphere have been flat since 1970. Maue believes that the large-scale
ocean cycles play a major role in the variability of ACE. His 2011 paper, ‘Recent historically
low global tropical cyclone activity’ found evidence of considerable variability in tropical cy-
clone ACE, associated with the evolution of large-scale climate mechanisms including the El
Niño Southern Oscillation and the Pacific Decadal Oscillation. 21
9 Tropical cyclone rainfall
The purpose of this paper is to evaluate trends in the frequency and strength of tropical
cyclones. However it is worth a quick look at rainfall from hurricanes. It is generally accepted
that models project a tendency for hurricane rainfall to increase with greenhouse warming. 22
However, Walsh et al. concluded that there have not yet been any detected global trends in
hurricane rainfall rates.10 High rainfall rates often occur because of slow-moving weather
systems, as with Hurricane Harvey last year. Chang et al. looked at this phenomenon with
regard to hurricane systems affecting Taiwan, and could not find a mechanism that would
attribute this trend to anthropogenic climate change. 23
1110 Conclusions
The IPCC AR5 made the following conclusions about hurricanes:
[There is] low confidence that any reported long-term (centennial) increases in tropi-
cal cyclone activity are robust, after accounting for past changes in observing capabili-
ties. More recent assessments indicate that it is unlikely that annual numbers of tropical
storms, hurricanes and major hurricanes counts have increased over the past 100 years
in the North Atlantic basin. Evidence, however, is for a virtually certain increase in the
frequency and intensity of the strongest tropical cyclones since the 1970s in that region.
The evidence produced in this paper strongly supports this conclusion. In addition, the ob-
servational record since AR5 was published in 2013 is also consistent with this view. The
data does show an increase in both the frequency and intensity of hurricanes in the North
Atlantic. However, both observations and research find that there is little evidence of longer-
term trends there. This paper refers to several studies which find a direct relationship be-
tween hurricane trends since 1970 and the Atlantic Multidecadal Oscillation.
Changes in the methods of observation, as well as the lack of any observations in many
regions in earlier decades, make it difficult to come to any robust conclusions about global
trends. It is clear though that actual observations have severely underestimated both the
frequency and intensity of hurricanes prior to around 1970 in the North Atlantic, and maybe
as late as 1980 for hurricanes in other parts of the world.
A more reliable longer-term record is available for US landfalling hurricanes, dating back
to 1851. NOAA’s Hurricane Research Division has carefully reanalysed all hurricane data be-
tween 1851 and 1960 in order to ensure wind speeds and intensity are as accurate as pos-
sible. Their database shows that there has been no increase in the number of hurricanes or
major hurricanes over the period.
Globally, there is consistent data only since about 1970. There is little evidence of any
increasing frequency of hurricanes since then. Major hurricane frequency increased during
the 1970s and 1980s, due to North Atlantic hurricanes. However, since around 1990 major
hurricane frequency and accumulated energy have remained essentially unchanged.
In summary, there is little evidence that global warming has resulted in more hurricanes,
or more intense ones. On the contrary, available evidence confirms that hurricane and major
hurricane frequency has been as great in many prior periods as it has been recently.
12Notes 1. MIT Technology Review https://www.technologyreview.com/s/609642/the-year-climate-chang e-began-to-spin-out-of-control/. 2. Kerry Emmanuel http://www.pnas.org/content/114/48/12681.full. 3. Michael Mann https://www.theguardian.com/commentisfree/2017/aug/28/climate-change-hur ricane-harvey-more-deadly. 4. IPCC AR5 WG1 (11.3) pp. 992–993 https://ipcc.ch/report/ar5/wg1/. 5. Roy Spencer http://www.drroyspencer.com/2017/08/texas-major-hurricane-intensity-not-relat ed-to-gulf-water-temperatures/. 6. Julian Heming http://www.telegraph.co.uk/news/2017/09/08/hurricane-irma-many-hurricanes -will-future-asked-experts/. 7. Christopher Landsea http://www.aoml.noaa.gov/hrd/Landsea/sahel/index.html. 8. IPCC AR5 WG1 pp. 216-17 https://ipcc.ch/report/ar5/wg1/. 9. Msadek et al. (2015) North Atlantic hurricane activity: past, present and future http://www.worlds cientific.com/doi/abs/10.1142/9789814579933_0018. 10. Walsh et al. (2016) Tropical cyclones and climate change. WIREs Clim Change ; 7: 65–89. 11. Hagen and Landsea (2012) On the classification of extreme Atlantic hurricanes utilizing mid- twentieth-century monitoring capabilities. http://journals.ametsoc.org/doi/full/10.1175/JCLI-D-11- 00420.1. 12. Hurricane Research Division http://www.aoml.noaa.gov/hrd/tcfaq/E11.html. 13. Judith Curry https://www.thegwpf.org/gwpf-tv-climate-hysteria-vs-hurricane-resilience/. 14. Vecchi and Knutson. Historical changes in Atlantic hurricane and tropical storms. https://www. gfdl.noaa.gov/historical-atlantic-hurricane-and-tropical-storm-records/. 15. NOAA. Atlantic Multidecadal Oscillation http://www.aoml.noaa.gov/phod/faq/amo_faq.php#f aq_6 16. Landsea C. (1999) Atlantic Basin hurricanes – indices of climate changes https://link.springer.co m/article/10.1023/A:1005416332322. 17. Landsea C. (1992) The strong association between western Sahel monsoon rainfall and intense Atlantic hurricanes http://www.aoml.noaa.gov/hrd/Landsea/sahel/index.html. 18. Wang et al. (2012) Multidecadal covariability of North Atlantic sea surface temperature, African dust, Sahel rainfall, and Atlantic hurricanes. https://notalotofpeopleknowthat.files.wordpress.com/2 017/09/wang_etal_2012_jc.pdf 19. Balaguru et al. (2018) Increasing magnitude of hurricane rapid intensification in the central and eastern tropical Atlantic. https://agupubs.onlinelibrary.wiley.com/doi/full/10.1029/2018GL077597. 20. Ryan Maue. Global tropical cyclone activity http://www.policlimate.com/tropical/. 21. Ryan Maue (2011) Recent historically low global tropical cyclone activity. http://onlinelibrary.wi ley.com/doi/10.1029/2011GL047711/abstract. 22. Scoccimarro et al. (2017) Tropical cyclone rainfall changes in a warmer climate. https://link.sprin ger.com/chapter/10.1007/978-3-319-47594-3_10. 23. Chang C-P et al. (2013) Large increasing trend of tropical cyclone rainfall in Taiwan and the roles of terrain. J Clim ; 26: 4138–4147.
About the Global Warming Policy Foundation
The Global Warming Policy Foundation is an all-party and non-party think tank and a reg-
istered educational charity which, while openminded on the contested science of global
warming, is deeply concerned about the costs and other implications of many of the poli-
cies currently being advocated.
     Our main focus is to analyse global warming policies and their economic and other im-
plications. Our aim is to provide the most robust and reliable economic analysis and advice.
Above all we seek to inform the media, politicians and the public, in a newsworthy way, on
the subject in general and on the misinformation to which they are all too frequently being
subjected at the present time.
     The key to the success of the GWPF is the trust and credibility that we have earned in the
eyes of a growing number of policy makers, journalists and the interested public. The GWPF
is funded overwhelmingly by voluntary donations from a number of private individuals and
charitable trusts. In order to make clear its complete independence, it does not accept gifts
from either energy companies or anyone with a significant interest in an energy company.

Views expressed in the publications of the Global Warming Policy Foundation are those
of the authors, not those of the GWPF, its trustees, its Academic Advisory Council mem-
bers or its directors.
THE GLOBAL WARMING POLICY FOUNDATION Director Benny Peiser BOARD OF TRUSTEES Lord Lawson (Chairman) Lord Lilley Lord Donoughue Charles Moore Lord Fellowes Baroness Nicholson Rt Revd Dr Peter Forster, Bishop of Chester Graham Stringer MP Sir Martin Jacomb Lord Turnbull ACADEMIC ADVISORY COUNCIL Professor Christopher Essex (Chairman) Professor Ross McKitrick Sir Samuel Brittan Professor Robert Mendelsohn Sir Ian Byatt Professor Garth Paltridge Dr John Constable Professor Ian Plimer Professor Vincent Courtillot Professor Gwythian Prins Professor Freeman Dyson Professor Paul Reiter Christian Gerondeau Dr Matt Ridley Professor Larry Gould Sir Alan Rudge Professor Ole Humlum Professor Nir Shaviv Professor Terence Kealey Professor Henrik Svensmark Bill Kininmonth Professor Anastasios Tsonis Professor Deepak Lal Professor Fritz Vahrenholt Professor Richard Lindzen Dr David Whitehouse
GWPF BRIEFINGS
     1  Andrew Turnbull            The Really Inconvenient Truth or ‘It Ain’t Necessarily So’
     2  Philipp Mueller            The Greening of the Sahel
     3  William Happer             The Truth about Greenhouse Gases
     4  Gordon Hughes              The Impact of Wind Power on Household Energy Bills
     5  Matt Ridley                The Perils of Confirmation Bias
     6  Philipp Mueller            The Abundance of Fossil Fuels
     7  Indur Goklany              Is Global Warming the Number One Threat to Humanity?
     8  Andrew Montford            The Climate Model and the Public Purse
     9  Philipp Mueller            UK Energy Security: Myth and Reality
     10 Andrew Montford            Precipitation, Deluge and Flood
     11 Susan Crockford            On the Beach
     12 Madhav Khandekar           Floods and Droughts in the Indian Monsoon
     13 Indur Goklany              Unhealthy Exaggeration
     14 Susan Crockford            Twenty Good Reasons not to Worry about Polar Bears
     15 Various                    The Small Print
     16 Susan Crockford            The Arctic Fallacy
     17 Indur Goklany              The Many Benefits of Carbon Dioxide
     18 Judith Curry               The Climate Debate in the USA
     19 Indur Goklany              The Papal Academies’ Broken Moral Compass
     20 Donoughue and Forster      The Papal Encyclical: a Critical Christian Response
     21 Andrew Montford            Parched Earth Policy: Drought, Heatwave and Conflict
     22 David Campbell             The Paris Agreement and the Fifth Carbon Budget
     23 Various                    The Stern Review: Ten Years of Harm
     24 Judith Curry               Climate Models for the Layman
     25 Fritz Vahrenholt           Germany’s Energiewende : a Disaster in the Making
     26 Hughes, Aris, Constable    Offshore Wind Strike Prices
     27 Michael Miersch            Truly Green?
     28 Susan Crockford            20 Good Reasons not to Worry About Polar Bears: Update
     29 Mikko Paunio               Sacrificing the Poor: The Lancet on ‘pollution’
     30 Mikko Paunio               Kicking Away the Energy Ladder
     31 Bill Gray                  Flaws in Applying Greenhouse Warming to Climate Variability
     32 Mikko Paunio               Save the Oceans: Stop Recycling Plastic
     33 Andy Dawson                Small Modular Nuclear: Crushed at Birth
     34 Andrew Montford            Quakes, Pollution and Flaming Faucets
     35 Paul Homewood              DEFRA vs Met Office: Factchecking the State of the UK Climate
     36 J. Ray Bates               Deficiencies in the IPCC’s Special Report on 1.5 Degrees
     37 Paul Homewood              Tropical Hurricanes in the Age of Global Warming

For further information about the Global Warming Policy
Foundation, please visit our website at www.thegwpf.org.
The GWPF is a registered charity, number 1131448.
You can also read