BRIEFING NOTE: ON 1Q 2020 DATA - IMPACTS OF COVID-19 PANDEMIC
←
→
Page content transcription
If your browser does not render page correctly, please read the page content below
BRIEFING NOTE:
IMPACTS OF COVID-19 PANDEMIC
      ON 1Q 2020 DATA
FOR LARGE INDUSTRIAL COMPANIES

         Area Studi Mediobanca

          Milano, 12 Maggio 2020
THE VIRUS: SARS-COV-2
A pneumonia of unknown cause detected in Wuhan, China, was first reported to the
World Health Organization Country Office in China on 31 December 2019
The outbreak was declared a Public Health Emergency of International Concern on 30
January 2020
On 11 February 2020, World Health Organization announced a name for the new
Coronavirus disease: COVID-19, caused by a virus, known as SARS-CoV-2
The World Health Organization declared the pandemic on 11 March 2020
This briefing note is intended to provide a view on 1Q 2020 for large industrial companies
worldwide, in order to explore the developing situation and the implications for them
Coming soon: another briefing note is going to be released next week, in order to provide
a view on 1Q 2020 for the Italian FTSE MIB industrial companies
2SUMMARY
1. Abstract: A Crisis Like No Other
2. Global economic impact
3. Italian economic impact
4. Data relating to 1Q 2020: large industrial
companies worldwideABSTRACT: A CRISIS LIKE NO OTHER Section 1
FIRST AND FOREMOST A HUMAN TRAGEDY

    The COVID-19 pandemic is first and foremost a human tragedy of
    potentially biblical proportions, affecting hundreds of thousands of people
    throughout the world, and causing thousands of deaths.

    Sadly, as of Sunday 10 May 2020, the official death toll from the COVID-19
    pandemic has increased to 283k and the total number of confirmed cases
    exceeds 4.1m globally. Over 1.4m people who had contracted the illness
    had been successfully treated and released from hospitals.
    In Italy, the number of cases rose to 219.070, of which 105.186 had been
    successfully treated and released from hospitals. Deaths increased to
    30.560.

5
SOME DEFINITIONS FOR A GLOBAL CRISIS IN AN INTERCONNECTED WORLD
Key words: interconnection, speed, uncertainty
The magnitude and speed of collapse in activity that has followed is unlike
anything experienced in our lifetimes
This is a crisis like no other, and there is substantial uncertainty about its impact
on people’s lives and livelihoods
Definitions:
A Crisis Like No Other
These are truly unprecedented events with no adequate historical example
A crisis of unprecedented proportions, unlike anything experienced in our lifetimes
This is a truly global crisis as no country is spared
This crisis is a world-changing event
A crisis of an unprecedented scale, duration and geographic extent
A deep and uneven recession
6GLOBAL ECONOMIC IMPACT Section 2
GLOBAL SHOCKS

The severe containment measures being taken to contain the COVID-19 epidemic in
many countries worldwide have caused various shocks:
1. To supply: with the closure of businesses, and disruption to supply chains;
2. To demand: the global nature of the shock has effects on demand, especially in
   tourism, transport, goods etc.; the closure of businesses has effects on household
   income; containment measures have effects on consumer decisions; and so forth;
3. Shock for increased uncertainty that hits companies and consumers: important
   investment decisions, new openings, increased employment, etc. will have to be
   postponed; reduction of non essential costs;
4. To financial assets, with strong tensions on financial markets: flight to safety, increase in
   volatility, worsening of financial conditions, credit crunch risk, increase in spreads and
   interest rates;
5. To public finance: lower tax revenues and higher spending, hence increased public
   debt.

8
IMF FORECASTS
«The outlook for global growth for 2020 is negative, but we expect recovery in 2021. The global
economic impact is and will be severe, but the faster the virus stops, the quicker and stronger the
recovery will be»
                                       (IMF Managing Director Kristalina Georgieva, 23 March 2020)

«The world is facing the worst economic downturn since the Great Depression, and far
worse than the Global Financial Crisis» (IMF, 14 April 2020)

    IMF, World Economic Outlook, 14 April 2020. The assumption is that the pandemic and required containment peaks in the second
9
    quarter for most countries in the world, and recedes in the second half of this year
AROUND 9 TRILLION DOLLARS LOST:
GREATER THAN THE ECONOMIES OF JAPAN AND GERMANY, COMBINED
«The cumulative loss to global GDP over 2020 and 2021 from the pandemic crisis could
be around 9 trillion dollars, greater than the economies of Japan and Germany,
combined» (IMF, 14 April 2020)
IMF, World Economic Outlook, 14 April 2020. The assumption is that the pandemic and required containment peaks in the second
10
quarter for most countries in the world, and recedes in the second half of this yearA TRULY GLOBAL CRISIS: NO COUNTRY IS SPARED
Real GDP, annual percentage change
9.2
7.4
6.6
5.8 6.1
4.5 4.7 4.7
4.2
3.7
2.9 3.0
2.3 1.9
1.7
1.2 1.2
0.7
-1.0
-3.0
-5.2
-6.1 -5.9
-7.5
World Advanced Emerging Euro Area United States Japan China India
Economies markets and
developing
economies
2019 2020 2021
IMF, World Economic Outlook, 14 April 2020. The assumption is that the pandemic and required containment peaks in the second
11
quarter for most countries in the world, and recedes in the second half of this yearABSTRACT OF 2020 GDP FORECASTS
Expected declines in GDP for 2020 (%)
-3.0 -2.8
-3.9
-5.0
-7.0
-7.5
Euro Area World
More pessimistic are European Commission forecasts relating to the Euro Area economy which will
contract by a record 7.7% in 2020 and grow by 6.3% in 2021 (Spring 2020 Economic Forecast, 6 May 2020)
12 Reports published iin April 2020ITALY: “WORST IN CLASS” AMONG MAIN EUROPEAN COUNTRIES
Real GDP, annual percentage change
5.2
4.8
4.5 4.3
4.0
2.0
1.3 1.4
0.6
0.3
-6.5
-7.0 -7.2
-8.0
-9.1
Germany France Italy Spain United Kingdom
2019 2020 2021
IMF, World Economic Outlook, 14 April 2020. The assumption is that the pandemic and required containment peaks in the second
13
quarter for most countries in the world, and recedes in the second half of this year. Greece: -10,0%, the worst country in Euro AreaITALY AND EURO AREA: THE DIFFERENCES
Italy was the first European country to be hit violently by the pandemic, and has adopted severer
restrictions as a result;
Tourism, which globally speaking has been one of the worst-hit sectors, occupies a significant
position in the Italian economy, accounting directly for 6% of Italian GDP in 2019, and indirectly for
as much as 13%;
The industrial fabric of Italy mainly consists of small and medium-sized enterprises which again have
been the worst hit by the crisis;
Italian bureaucracy is renowned for its slowness;
Lower fiscal support measures in place than the Northern European countries mostly
14ITALIAN ECONOMIC IMPACT Section 3
FOR ITALY: THE WORST CRISIS SINCE THE II WORLD WAR
Real GDP, annual negative percentage change from 1861 to 2020E
-0.3
-0.8
-0.8
-1.0
-1.0
-1.2
-1.6
-1.6
-1.6
-1.7
-1.8
-1.9
-1.9
-2.1
-2.5
-2.9
-3.0
-3.2
-3.6
-3.6
-4.7
-5.3
-5.4
-5.5
-5.7
-7.8
-9.1
-10.3
-15.2
-19.3
1867
1871
1872
1876
1884
1889
1914
1915
1918
1919
1921
1927
1930
1931
1933
1934
1936
1940
1941
1942
1943
1944
1945
1975
1993
2008
2009
2012
2013
2020E
Italy: The biggest reductions in
GDP from the unification of Italy -3.6
-5.4 -5.7 -4.7 -5.5 -5.3
(1861) to the present (annual
-7.8
percentage change) -9.1
-10.3
-15.2
-19.3
1867 1914 1915 1919 1930 1942 1943 1944 1945 2009 2020E
16 ISTAT and IMF forecastTHE WORST AND THE BEST YEARS FROM 1870 TO THE PRESENT
Real GDP, annual percentage change
52.1
34.9
20.2
-21.1
-19.3
1918 1946
1944 1946
-63.3
1946 1950
11.8 The worst GDP drops occured
10.0
during the world wars (civil war
in Spain) and were followed by
material bounce-back
-10.9
-23.5
1936 1961 1919 1940
17 ISTAT, Maddison (2018) and IMF (2020)ABSTRACT OF ITALIAN GDP FORECASTS (2020-2021)
Basically, the greater is the expected drop for 2020, the greater is the bounce-back for 2021
6.5
4.8 4.7 4.5
3.7 3.8 3.3 3.5
-6.5 -6.0
-8.0 -8.0 -7.5 -7.5
-9.5 -9.1
European IMF DEF Fitch Ratings Consensus Oxford Prometeia Centro Studi
Commission Economics Economics Confindustria
2020 2021
Forecasts for 2020 Italian GDP range from a -6.0% drop (loss of €107 bn which is roughly equal to
Campania region GDP) to -9.5% drop (loss of €170 bn which is roughly equal to Veneto region GDP)
Reports published in March and April 2020 except for European Commission (6 May 2020)
18
DEF: Documento di Economia e Finanza (Ministero dell’Economia e delle Finanze), 24 April 2020GDP PRELIMINARY ESTIMATES FOR 1Q 2020
Real GDP, annual percentage change
The preliminary estimate of quarterly GDP is
affected by the obstacles posed by the
ongoing pandemic emergency to the
collection of basic data, which represent the
-3.8 input for national accounts estimates. As in
-4.7
-5.2 current practice, data released on 30 April
-5.8
2020 will be subject to revision in next
calendar releases, as further information
sources become available. These revisions are
Euro Area France Italy Spain expected to be larger than usual.
19 Eurostat and ISTAT (data released on 30 April 2020). Germany: n.a.ITALIAN CONSUMPTION IN MARCH 2020
According to data published by Confcommercio, consumption in Italy has gone down by -31.7% in
March 2020 when compared to the same month in 2019; the same indicator over the first quarter 2020
has recorded -10.4% following restrictions imposed as a result of the pandemic.
Consumption, March 2020/March 2019, percentage change
9.6 8.0
4.0 3.5
-44.0
-60.1
-66.2 -67.4 -68.4
-75.0
-81.0
-85.4
Food & drinks Telco Pharma & Tobacco Fuels Recreational Furniture, Clothing & Restaurants & Hotels Air transports Cars
health care goods and textiles and footwear bars
services home
furnishings
20 Congiuntura Confcommercio, 14 April 2020, and UNRAE data, 30 April 2020MEDIOBANCA SECURITIES FORECASTS A U-SHAPED RECOVERY Unlike latest available consensus, that still seems to anticipate a V-shaped recovery, Mediobanca Securities’ estimates indicate a U-shaped one. The Covid-19 pandemic is a significant headwind that is likely to continue affecting global economies and the market until we start to have visibility on the time needed to contain the contagion together with a coordinated, articulated and credible European response. This leads its 2020-22E net profit trend (excluding Italian Banks) to take the form of a U-shaped recovery, with 2022E profits close to 2019 vs consensus forecasting higher profits in 2022 vs. 2019 (+12%). Mediobanca Securities have also cut EPS estimates (excluding Italian banks) by -30% in 2020 and -21% in 2021 mainly in cyclical stocks. 21
DATA RELATING TO 1Q 2020: LARGE INDUSTRIAL
COMPANIES WORLDWIDE
Section 4
HIGHLIGHTS: THE 1Q 2020 SCENARIO

     The 1Q 2020 scenarios reflect the different timings of the spread of the COVID-19 pandemic in the
     various geographic regions in the world. Companies which generate most of their turnover from
     China and Asia in general have seen the highest reductions in total sales in January and February
     2020, whereas those which generate most of their turnover from Europe and the North and South
     America will suffer a larger reduction in 2Q 2020. Early signs of recovery in China can be seen from
     the end of 1Q 2020
     For European and American companies, the figures for February show the initial impact of the
     COVID-19 pandemic, and the March figures provided a better reflection. The bulk of the economic
     impact should be felt in 2Q
     The largest impact of COVID-19 will be seen in 1H 2020 and a recovery is expected in 2H, set to be
     more visible in 4Q. Most of companies have declared that for 2020, the impacts of the COVID-19
     epidemic are currently difficult to assess, as the scale, duration and geographic extent of the crisis
     evolve every day

23
HIGHLIGHTS: THE 1Q 2020 DATA
In this worldwide challenge, major corporations released their 1Q 2020 data starting at mid-April
2020. Performances were quite dispersed through different sectors in which companies mainly
operate
Revenues growth in 1Q 2020/19. Sectors up: WebSoft, large-scale distribution and pharma; sectors
down: aircrafts manufacturers, oil&energy and fashion. The world companies average is equal to
zero: increases in some sectors are offset by decreases in others
EBIT growth in 1Q 2020/19. Sectors up: large-scale distribution, pharma and WebSoft; sectors down:
aircrafts manufacturers, oil&energy, fashion and automotive. The world companies average is equal
to -18.9%
Ebit margin 1Q 2020. At the top: electronic payments (28.4%), pharma (26.8%) and electronics
(22.0%); at the bottom: aircrafts manufacturers (-3.8%), oil&energy (1.2%) and automotive (1.5%). The
world companies average EBIT in 1Q 2020 is equal to 14.3% (-2.4 percentage points on 1Q 2019).
Aircrafts and Fashion: double-digit decreases in EBIT margin percentage points in 1Q 2020/2019
Net profit growth in 1Q 2020/19. Sectors up: large-scale distribution, pharma and WebSoft; sectors
down: aircrafts manufacturers, oil&energy, automotive and fashion
Worst in class. Oil&energy, fashion and means of transport recorded double-digit drop in revenues,
EBIT and net profits in 1Q 2020/19
Dividends. Most of the best-performing companies (those with revenues increasing in 1Q 2020)
confirmed their 2019 dividends for 2020 as well, or increased them by an average of 10%. Most of the
worst-performing companies (revenues decreased in 1Q 2020) suspended dividends for 2020 or at
least reduced them
The appetite for buyback schemes has continued, among WebSoft and electronic payments
companies in particular, not least because most of them are American (from the United States)
24OUTLOOK
The 1Q 2020 scenarios reflect the different timings of the spread of the COVID-19 pandemic in
the various geographic regions in the world. Companies which generate most of their
turnover from China and Asia in general have seen the highest reductions in total sales in
January and February 2020, whereas those which generate most of their turnover from Europe
and the North and South America will suffer a larger reduction in 2Q 2020. Early signs of
recovery in China, Taiwan and South Korea can be seen from the end of 1Q 2020
For European and American companies, the figures for February show the initial impact of the
COVID-19 pandemic. In February exports to Asian markets suffered, but there was basically no
impact in Europe and the USA. The March figures provided a better reflection of the COVID-
19 pandemic worldwide. The bulk of the economic impact should be felt in 2Q: both top- and
bottom-line declines in the 2Q 2020 are expected to be more pronounced than those
recorded in 1Q 2020
25EARLY SIGNS OF RECOVERY FROM CHINA
The positive piece of news is that many companies reopened their stores and production sites in
China starting from mid-March 2020: the environment in China is gradually improving, although not
yet back to normal. Early signs of recovery in China, Taiwan and South Korea can be seen from the
end of 1Q 2020
The recovery in China, albeit limited, is encouraging, suggesting that containment measures can
succeed in controlling the epidemic and pave the way for a resumption of economic
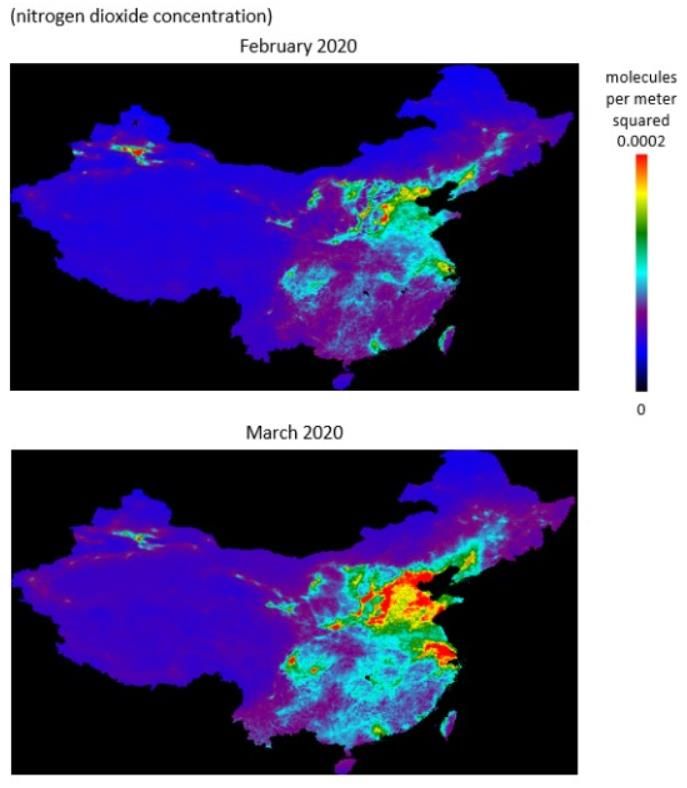
Satellite data show recent increases in nitrogen dioxide
concentration over China in March, suggesting a pick-up in
industrial and transport activity compared to the previous
month (source: European Space Agency)
26 Nitrogen dioxide concentration in the athmosphere is an indicator of emissions from fossil fuel and biomass burning. As such, it can be
a proxy measure for changes in industrial and transportation activityCEOS: WHAT ABOUT FISCAL YEAR 2020 RESULTS?
But there is still huge uncertainty about the future path of the pandemic and a resurgence of its
spread in China and other countries cannot be ruled out. Chinese consumers will be keen to start
buying again, in what is known as “revenge spending”. But it is less likely to be the case for
consumers in Italy and the rest of Europe. In other words, it will take Italy and Europe in general the
same amount of time as it takes China to emerge from the crisis situation, but it will probably take
more time for spending to return to their previous levels
Most of the companies’ Boards of Directors believe that the progress of the emergency,
accompanied by the uncertainties related to further development in terms of impact on public
health and on the country’s production, economic and social system do not currently allow any
further quantification of the effects on the fiscal year 2020 results. The resulting negative effect on
sales and earnings are impossible to quantify at this stage: a reliable prediction of the business
performance in 2020 is not possible
Most of the companies have revised their estimates assuming the largest impact of COVID-19 in 1H
2020 and recovering in 2H, set to be more visible in 4Q, and have cut their FY2020 projections.
Capex will be generally lowered. CEOs generally consider 2H 2020 as a semester of stabilization,
and a rebound hopefully in 2021
Most of companies have declared that for 2020, the impacts of the COVID-19
epidemic are currently difficult to assess, as the scale, duration and geographic
extent of the crisis evolve every day
271Q 2020 LARGE INDUSTRIAL COMPANIES
Change net sales Change EBIT Change Net profit
In this worldwide Industrials (multinational 1Q 2020/1Q 2019 1Q 2020/1Q 2019 1Q 2020/1Q 2019
challenge, major companies aggregates)
corporations released (%) (%) (%)
their 1Q 2020 results
WebSoft 17.4 17.6 14.9
starting at mid-April 2020.
Performances were quite Large-scale distribution 9.1 33.6 34.8
dispersed through Pharma 6.1 18.1 20.5
different sectors in which Electronic payments 4.7 -8.9 -17.0
companies mainly Electronics 4.5 10.9 10.0
operate. Food & drinks 2.0 -8.3 -5.1
Regarding revenues in of which: food 3.4 -3.4 -17.3
1Q 2020/1Q 2019, drinks -0.1 -10.1 0.4
WebSoft, large-scale Media & Entertainment -0.5 -7.7 -28.3
distribution and pharma Telco -2.6 -5.9 -20.4
companies are at the
Means of transport -10.8 -88.0 neg./pos.
top end of the spectrum,
of which: automotive -9.1 -75.8 -92.4
while aircrafts
aircrafts -22.1 neg./pos. neg./pos.
manufacturers,
oil&energy and fashion Fashion -14.1 -81.5 -92.0
companies are at the Oil & energy -15.9 -87.8 neg./pos.
bottom. Average 0.0 -18.9 n.c.
281Q 2020 EBIT MARGIN
Change ebit
Ebit margin Ebit margin
Industrials (multinational margin 1Q 2020/1Q
1Q 2020 1Q 2019
companies aggregates) 2019
(%) (%) p.p.
Electronic payments 28.4 32.6 -4.2
Pharma 26.8 24.2 2.6
Electronics 22.0 20.9 1.1
Telco 18.5 19.1 -0.6
Media & Entertainment 17.9 19.3 -1.4
WebSoft 17.3 17.3 0.0
Food & drinks 15.0 16.9 -1.9
of which: drinks 20.0 22.2 -2.2
food 9.3 10.2 -0.9
Large-scale distribution 6.6 5.6 1.0
Fashion 2.9 13.6 -10.7
Oil & energy 1.2 8.3 -7.1
Means of transport 0.8 6.1 -5.3
of which: automotive 1.5 5.8 -4.3
aircrafts -3.8 7.8 -11.6
Average 14.3 16.7 -2.4
291Q 2020 NET PROFIT MARGIN
Net profit Net profit Change net profit
Industrials (multinational margin 1Q margin 1Q margin
companies aggregates) 2020 2019 1Q 2020/1Q 2019
(%) (%) p.p.
Electronic payments 20.2 25.5 -5.3
Pharma 21.1 18.7 2.4
Electronics 15.6 14.9 0.7
WebSoft 13.2 13.5 -0.3
Media & Entertainment 9.4 13.0 -3.6
Telco 9.4 11.5 -2.1
Food & drinks 9.0 9.8 -0.8
of which: drinks 12.2 12.1 0.1
food 5.4 6.9 -1.5
Large-scale distribution 4.6 3.9 0.7
Fashion 0.9 9.4 -8.5
Means of transport -0.1 5.5 -5.6
of which: automotive 0.4 5.4 -5.0
aircrafts -4.0 6.0 -10.0
Oil & energy -2.8 5.0 -7.8
Average 9.1 11.9 -2.8
30REVENUES GROWTH IN 1Q 2020/2019
Net sales 1Q 2020/2019, percentage change – Multinational companies by sectors
17.4
9.1
6.1
4.7 4.5 3.4
-0.1 -0.5
-2.6
-9.1
-14.1
-15.9
-22.1
WebSoft Large-scale Pharma Electronic Electronics Food Drinks Media & Telco Automotive Fashion Oil & energy Aircrafts
distribution payments Entertainment
The world companies average is equal to zero: increases in some sectors are offset by
decreases in others
31EBIT GROWTH IN 1Q 2020/2019
EBIT 1Q 2020/2019, percentage change – Multinational companies by sectors
33.6
18.1 17.6
10.9
neg./pos.
-3.4 -5.9 -7.7 -8.9 -10.1
-75.8
-81.5
-87.8
Large-scale Pharma WebSoft Electronics Food Telco Media & Electronic Drinks Automotive Fashion Oil & energy Aircrafts
distribution Entertainment payments
The world companies average is equal to -18.9%
32 WebSoft companies’ without Amazon (which is at 38% of total 1Q 2020 revenues and has a -9.8% decrease in EBIT margin in 1Q
2020/19): EBIT increased by +22.5% in 1Q 2020-19EBIT MARGIN 1Q 2020
Ebit margin 1Q 2020 (columns) and change in ebit margin 1Q 2020/19 (percentage points) – Multinational companies by sectors
-4.2 +2.6 +1.1 -2.2 -0.6 -1.4 +0.0 -0.9 +1.0 -10.7 -4.3 -7.1 -11.6
28.4
26.8
22.0
20.0
18.5 17.9 17.3
9.3
6.6
2.9
1.5 1.2
-3.8
Electronic Pharma Electronics Drinks Telco Media & WebSoft Food Large-scale Fashion Automotive Oil & energy Aircrafts
payments Entertainment distribution
The world companies average EBIT in 1Q 2020 is equal to 14.3% (-2.4 percentage points)
Aircrafts and Fashion: double-digit decreases in EBIT margin percentage points
WebSoft companies’ without Amazon (which is at 38% of total 1Q 2020 revenues and has the lowest EBIT margin): the Ebit margin
33
increased by +2.0 percentage points, and the EBIT margin is equal to 24.7% in 1Q 2020NET PROFIT GROWTH IN 1Q 2020/2019
Net profit 1Q 2020/2019, percentage change – Multinational companies
34.8
20.5
14.9
10.0
0.4 neg./pos. neg./pos.
-17.0 -17.3 -20.4
-28.3
-92.0 -92.4
Large-scale Pharma WebSoft Electronics Drinks Electronic Food Telco Media & Fashion Automotive Oil & energy Aaircrafts
distribution payments Entertainment
34 WebSoft companies’ without Amazon (which is at 38% of total 1Q 2020 revenues): the net profit margin increased by +23.0%
The world companies average cannot be calculated as means of transport and oil&energy sectors became negative in 1Q 2020WEBSOFT: REVENUES DRIVEN BY CLOUD SERVICES, NEW SUBSCRIPTIONS
AND E-COMMERCE
For WebSoft companies, 1Q 2020 results were positively impacted by the COVID-19 pandemic, with
the sector being driven by cloud services, new subscriptions, increased users’ search activity and e-
commerce (partially offset by travel online sales).
Global revenues can be broken down as follows: advertising revenues (which are at 29% of the total
net sales), online stores (28%), cloud services (18%), subscription services (8%) and other revenues (the
remain 17%). WebSoft companies’ global revenues for 1Q 2020-19 increased by +17.4%, of which
cloud services +27.4%, news subscriptions +26.5%, online stores +22.8%, and advertising revenues
+13.5%. All revenues’ components increased in 1Q 2020, with the exception of travel online sales (-
18.4%) and related advertising (-28.1%).
EBIT increased by +17.6% and net profit by +14.9% in 1Q 2020-19. The Ebit margin remained stable,
and net profit margin slightly decreased by -0.3 percentage points. For e-commerce channel,
shipping costs increased by roughly +49% in 1Q 2020 and they increased to 14.5 as a percentage of
net sales in 1Q 2020 (12.3% in 1Q 2019). The increase in shipping costs was partially offset by the
increase of online sales in 1Q 2020 related to the “stay at home”.
Most of the WebSoft companies have confirmed their FY 2019 dividends for 2020 as well, or increased
them by an average of 11%. The appetite for buyback schemes has continued, and almost doubled.
The positive trend of WebSoft companies is expected to continue in the 2Q 2020.
The worldwide public cloud services market is expected to grow at least 17% in 2020 (according to
Fabio Pavan, Mediobanca Securities).
WebSoft companies’ without Amazon (which is at 38% of total 1Q 2020 revenues and has the lowest EBIT margin): EBIT increased by
35 +22.5% and net profit by +23.0% in 1Q 2020-19; the Ebit margin increased by +2.0 percentage points, and net profit margin increased
by +1.6 percentage points; the EBIT margin is equal to 24.7% in 1Q 2020 and to 22.7% in 1Q 2019
The Italian cloud market is expecting to grow at least at a 20% pace in the coming years (Fabio Pavan, Mediobanca Securities)LARGE-SCALE DISTRIBUTION: CHANGES IN CONSUMERS’ BUYING BEHAVIORS
The COVID-19 epidemic resulted in an unprecedented growth in demand directed for large-scale
distribution, and particularly for the formats convenience, urban stores and e-commerce.
The effect of COVID-19 pandemic on large-scale distribution is connected with significant changes in
consumers’ buying behaviors. Food sales strongly increased, driven by packaged, long-life products,
giving the perception of increased protection and hygiene (with the demand accentuated by
stocking patterns); para-pharmaceutical products’ sales increased too, driven by a strong demand
for personal protective, hygiene and other healthcare equipments. At the opposite end of the
spectrum, non-food sales were down, penalized by certain categories such as apparel, which is not
considered a priority. It can be noticed a sharp drop in the Cash & Carry segment sales too, a trend
that will continue until the end of the containment measures, when bars and restaurant services will
be reopened. In 2Q 2020 a reversal trend towards destocking is expected.
The lockdown measures favored proximity and supermarkets, which are closer to home and more
accessible, at the expense of hypermarkets. Across all formats, the number of store visits was
reduced, while average basket and average value sales increased significantly for the cancellation
of promotions. Several specific measures were introduced to meet core mission of securing food
supply for people: capacity uplift for home delivery, click & collect and e-commerce solutions have
been strengthened. Logistic costs increased, resulting from distancing requirements, rising
transportation costs and other logistic constraints.
Global revenues for 1Q 2020-19 increased by +9.1%, and growth of food e-commerce on average
reached more than +40% in Q1 2020 in Europe. EBIT for 1Q 2019-20 increased by +33.6% and net
profit by +34.8%. The Ebit margin increased by +1.0 percentage points, and net profit margin
increased by +0.7 percentage points. Most of the companies have confirmed their FY 2019 dividends
for 2020 as well, or increased them by an average of 10%.
36PHARMA: THE IMPORTANCE OF RESEARCH AGAINST CORONAVIRUS
For pharma companies, 1Q 2020 has been impacted positively by the COVID-19 pandemic, with the
sector being driven by respiratory system medications in particular. The increase in certain categories
of product (i.e. respiratory system and anti-viral drugs) has been partly offset by the negative impact
on demand for other products, as a result of the reduction in medical examinations and surgical
procedures; a trend which could become even more pronounced in 2Q 2020.
Global revenues for 1Q 2020-19 increased by 6.1%, EBIT by 18.1% and net profit by 20.5%. The Ebit
margin increased by 2.6 percentage points, and the net profit margin by 2.4 percentage points.
Most companies in the pharma sector have confirmed their FY 2019 dividends for 2020 as well, or
increased them by an average of 8%.
Most companies are experimenting with vaccines and other drugs to combat Coronavirus, which
can lead to a material impact on pharmaceutical companies’ sales if successful. On 1 May the
American Food and Drug Administration has given emergency use authorization to the antiviral drug
Remdesivir (produced by Gilead Sciences) to treat hospitalized patients with the Coronavirus. These
recent positive findings are a starting point in the fight against the respiratory disease.
Remdesivir is an investigational nucleotide analog with broad-spectrum antiviral activity both in vitro and in vivo in animal models
37 against multiple emerging viral pathogens, including Ebola, Marburg, MERS and SARS. In vitro testing conducted by Gilead Sciences (a
research-based biopharmaceutical company, with headquarters in California) has demonstrated that Remdesivir is active against the
virus that causes COVID-19.ELECTRONIC PAYMENTS: REVENUES DRIVEN BY THE EFT TRANSACTIONS
Regarding electronic payments companies, 1Q 2020 results were positively impacted by the COVID-
19 pandemic, with the sector being driven by the EFT (electronic funds transfer) transactions and
related services. The increase in the EFT transactions revenues was partially offset by fewer ATM
transactions and the global decline in consumers’ purchasing power. Money Transfer transactions
experienced the impacts of consumer movement restrictions, especially at retail outlets; however,
digital product offerings played a key role in offsetting the retail-based transaction declines. The
pandemic resulted in the widespread reduction of business activity, adversely impacting consumers,
suppliers and business partners. Additionally, the increase in travel restrictions, social distancing
measures and unemployment lead to a change in consumer and commercial behavior.
Global revenues for 1Q 2020-19 increased by +4.7%, of which Transaction and Data Processing
+5.4%, and related services +2.3%, partially offset by the negative performance of Transfer Money (-
8.3%). Bitcoin sector saw an accelerating growth in 1Q 2020 by triple-digit rate (+364%), even if it‘s
only at 1.1% of total revenues.
Most of the companies have confirmed their FY 2019 dividends for 2020 as well, or increased them by
an average of 20%. The appetite for buyback schemes has continued, and more than doubled.
38ELECTRONICS: REVENUES DRIVEN BY SEMICONDUCTORS DEMAND
For electronic companies, demand for data centers, semiconductors and microprocessor increased,
demand for memories was solid mainly for server and PC and steady for mobile in 1Q 2020. Devices’
shipments fell as COVID-19 impacts started taking effect globally toward the end of the quarter.
Electronic sector performance is connected with the large presence of Asian companies (mainly
based in China, Taiwan and Korea).
Global revenues for 1Q 2020-19 increased by 4.5%, driven by a more than +20% increase in sales of
semiconductors and microprocessors and decelerated by around +2% increase in sales of electronic
devises connected with store closures. In 1Q 2020/19 EBIT increased by 10.9% and net profit by 10.0%.
The Ebit margin increased by 1.1 percentage points, while net profit margin increased by 0.7
percentage points.
Most of companies have confirmed their FY 2019 dividends for 2020 as well, or slightly increased
them. Most of companies declared that electronic business will continue as usual and results in 1Q
2020 have been almost in line with expectations.
For 2020, demand for data centers, semiconductors and microprocessors is expected to remain
strong in 1H 2020, and a weaker Enterprise & Government demand is expected in 2H 2020. 2Q 2020
market demand for new devices is expected to decline and competition among global
manufactures will be intensified with offer differentiation and new model launches also by
introducing 5G models to mass-markets. On average net profits are expected to register a single-
digit growth in 2Q 2020 and revenues from semiconductors and microprocessors is expected to
increase by 20% again.
39FOOD & DRINKS: SHIFT FROM OUT-OF-HOME TO IN-HOME CONSUMPTION
The effect of COVID-19 pandemic on food&drinks companies is connected with significant changes
in consumers’ buying behaviors, with unprecedented swings in weekly demand accentuated by
stocking patterns in the first weeks of lockdown, as well as shifting preferences to larger pack sizes
and packaged, long-life products, giving the perception of increased protection and hygiene, and
a significant shift from out-of-home to in-home consumption. The effect of COVID-19 pandemic also
varies by geography, product category and sales channel, depending on the timing of the
pandemic, the scope of restrictions and consumer behavior.
Global revenues for 1Q 2020-19 increased by +2.0%, EBIT decreased by -8.3%, and net profit by -
5.1%. The Ebit margin decreased by -1.9 percentage points, and the net profit margin by -0.8
percentage points.
Out-of-home channels posted negative growth, in-home channels posted positive growth and e-
commerce sales grew with sharp increasing investments
Most of the companies in the food & drinks sector have confirmed their FY 2019 dividends for 2020 as
well, or – for food companies - increased them by an average of 10%.
The challenge for this sector has been to maintain service levels and address the reduced efficiency
of the supply chain resulting from distancing requirements, lower productivity, rising transportation
costs and other logistics constraints. Most of companies have reduced and reallocated marketing
expenses: consumer communication has been adapted to support activities that help on-trade
customers and reflect social distancing.
40MEDIA& ENTERTAINMENT: PENALIZED BY THE ADVERTISING MARKET
The Media & Entertainment companies generally recorded lower advertising revenues, and at the
opposite end of the spectrum they experienced a good increase in audience for TV and digital
services. Moreover much of production of new contents has been curtailed or suspended in
response to lockdown, social distancing and health guidelines. A significant negative impact on
business has caused also by postponement or cancellation of sporting events, theatrical and theme
parks closures and the suspension of entertainment content production. On the positive side, the
world turns to the internet for information and entertainment more than ever before. However the
bulk of the economic impact should be felt in 2Q especially because most of companies are
American.
Global revenues can be broken down as follows: pay and streaming TV subscriptions (which is at 35%
of total net sales), advertising (25%), new contents production and distribution (14%), theme parks,
digital services and other revenues (the remain 26%). Media & Entertainment companies’ global
revenues for 1Q 2020-19 declined by -0.5%, of which theme parks -29%, advertising revenues -3%,
new contents production and distribution -2%, partially offset by new subscriptions (driven by
streaming TV) +1% and digital services +8%.
The drop for advertising market translated into a visible impact at margins’ level: EBIT were down by -
7.7% and net profit even more by -28.3%. The Ebit margin decreased by -1.4 percentage points, and
the net profit margin by -3.6 percentage points.
Most of companies have suspended dividends for 2020.
41TELCO COMPANIES: AN ESSENTIAL ROLE
The role of telco companies is essential in this new environment, where demand for new services
(smart working apps, video-conference tools, cloud services, gaming) and more data (voice and
video traffic) through internet has increased.
In almost all countries, the largest increases in traffic volume occurred immediately after public
policy announcements such as school closures or stay-at-home orders, and this can also be seen as
a reflection of changes in internet use. There are still large differences between countries in traffic
volume increases: at the bottom end of the spectrum the United States (+20%) and Japan (+31%),
and at the top end of the spectrum Italy: using traffic on 18 February, as a baseline, traffic in Italy
increased by 109.3% over the roughly one-month period from 20 February to 31 March. But the global
increase in traffic volumes had limited impact at top-line given the bundle offer. As most shops were
closed (on average 75% closed), there were lower sales of devices. Moreover, still on the negative
side, most telco companies, as media industry, recorded lower advertising revenues. On the positive
side, sector experienced an increased demand for new services (contents are a strong
differentiating factor) and more data which translated into an increased demand for fixed-line and
mobile services. Once the crisis will fade away, there could be room to monetize new services and
increase in traffic volumes, which is likely to stay. Borrowings evolution has to be monitored carefully,
with SMEs and shops closed.
Revenues for 1Q 2020-19 declined by -2.6%, EBIT by -5.9% and net profit by -20.4%; the net profit drop
is partly due to exchange rate losses. The Ebit margin decreased by -0.6 percentage points, and the
net profit margin by -2.1 percentage points. On average, telco companies have confirmed their FY
2019 dividends for 2020 as well.
42MEANS OF TRANSPORT: DOUBLE DIGIT DROP IN VOLUMES, REVENUES AND MARGINS
Distinction between aircraft manufacturers and automotive: on the former, the impact of COVID-19
pandemic has been even more negative.
Aircraft manufacturers: as the pandemic continues to reduce airline passenger traffic, the sector’s
companies see significant impact on the demand for new commercial airplanes and services:
revenues for 1Q 2020-19 dropped sharply by -22.1%, while both EBIT and net profit turned negative.
Car sales in 1Q 2020/2019
Automotive: negative impact on the automotive
sector too, leading to the third drop in a row after
the poor performance already reported in 2018
and 2019 when global volumes were down 2% -20.3
-23.3
-26.3
and 4% respectively: in 1Q 2020 global demand for -31.0 -31.0
-35.5 -34.1
cars -23.3%. Europe -26.3%. Italy worst in class in
Europe: -35.5% (-85.4% in March 2020)
As for automotive sector, revenues for 1Q 2020-19 declined by -9.1%, EBIT by -75.8% and net profit by -
92.4%. The Ebit margin decreased by -4.3 p.p., and the net profit margin by -5.0 p.p. Most of companies
suspended dividends for 2020, reduced or deferred research and development and capital
expenditures and reduced CEO and Chairman pay for 2020.
Although many worldwide car markets should gradually stabilize as the year progresses, it is likely to
have a significant decrease in the global car market: the volume of global demand for new vehicles in
2020 is expected to be between 15 and 20% lower than it was the previous year (around -25% in Europe
and -10% China). This assumes a very sharp decline in the second quarter followed by a swift recovery
in the third quarter of 2020 and a fourth quarter that almost reaches the previous year’s figures. COVID-
19 epidemic is likely to have a material negative impact on the automotive sector in 2020.
43FASHION: A SOLID SECTOR, BUT MATERIALLY IMPACTED BY THE CRISIS
Regarding fashion companies, they have been affected by the closures of a significant portion of stores and
production sites, as well as the cancellation or postponement of fashion shows and the suspension of international
travels.
For supply chains, more than 40% of global luxury-goods production happens in Italy—and all the Italian factories,
including small, family-based façonniers have temporarily shut down in March and April 2020.
Most of companies delayed or cancelled store renovations and new openings, and consequently registered lower
capital expenditure, and prioritized investments in high-return projects, notably in digital.
In terms of sectors, watches&jewellery and apparels appeared less resilient than leather goods and footwear. Eyewear
industry appeared more resilient.
In terms of channels, wholesale was generally more negative impacted by lockdown measures than retail.
Performances by geographical areas reflected the different timing of the outbreak, with China store traffic dropped
since late January, while Europe and The United States later, as lockdown period started in mid-March.
Global revenues declined by -14.1% in 1Q 2020-19. Online sales generally grew at a very high rate (on average roughly
+25% in 1Q 2020) and partially mitigated sales fall, even if the e-commerce growth cannot in any way compensate for
the revenue loss in the other channels because the share of online business is at less than 10% of sales on average. The
majority of online stores saw an accelerating growth in April 2020 (generally by-double-digit growth rates and in some
cases even by triple-digit growth rates). China traffic and sales have improved since March 2020, showing early signs of
recovery, confirming the “revenge spending” phenomenon.
Fashion companies’ EBIT declined by -81.5% and net profit by -92.0% in 1Q 2020-19. The Ebit margin decreased by -10.7
percentage points, and net profit margin decreased by -8.5 percentage points. Most companies registered
impairment charges as a result of decreased cash flow projections associated with the COVID-19 pandemic.
Most of fashion companies suspended dividends for 2020 or at least reduced them (by around -30% on average).
2020 is and will continue to be a difficult year for fashion companies. Most of companies expect all markets to recover
by the end of the year and 2021 to be a year of growth again. The fashion industry is expected to be in a relative
strong position after the crisis, driven by a generalized excellent financial solidity, even if some exceptions are not
excluded, especially companies with less liquidity. Capital expenditure was updated to be around -40% on average
less than 2019.
44OIL&ENERGY: A DROP DRIVEN BY THE OIL PRICES
Regarding oil market and energy companies, the impact of this new situation on oil prices has been
deep. The reduction in global oil demand has resulted in oversupplied markets and unprecedented
pressure on commodity prices and margins.
The last time the price of oil dived was in 2016, when it plummeted to 43.7 dollars a barrel after years
of relative stability. Today, the price of oil is crashing again down from 64.3 dollars a barrel in 2019,
due to the negative impact COVID-19: 50.3 dollars a barrel in 1Q 2020, with drops to 33.7 dollars a
barrel in March 2020 and to 26.6 dollars a barrel in April 2020. A new era of stagnant oil prices has
begun, and its political effects may reveal deeper than the economic ones. Lower oil prices (38.3
dollars a barrel in 2020 and 39.6 dollars a barrel in 2021) weight on outlook.
The significant demand decrease for jet fuel and gasoline impacted results in the 1Q 2020,
contributing sharp falls in refining margins.
Revenues for 1Q 2020-19 dropped sharply by -15.9% and EBIT by 87.8%, while net profit turned
negative driven by impairments related to inventory valuation impact resulting from lower
commodity prices and to reduced market value of goodwill and equity companies. The Ebit margin
decreased by 7.1 percentage points, and the net profit margin by -7.8 percentage points. Most of
oil&energy companies reduced capital expenditures on average by 25%.
The pressure on refining margins is going to continue in the next months of 2020. Looking forward,
there remains an exceptional level of uncertainty regarding the near-term outlook for prices and
product demand. Second quarter production is expected to be lower compared to the first quarter,
and more material impacts on refined margins are expected in the second quarter.
45BRENT CRUDE OIL PRICES AND NET SALES ENERGY COMPANIES
Brent crude oil prices and net sales energy multinational companies – Index number 2008=100,0
127.4
117.5 118.4 118.9
111.0
100.0 102.8
114.7 115.0 112.0
90.3 88.8
102.1 86.5
100.0 81.1
74.2 74.2 75.5
67.3
81.9
73.2
63.4 66.3
54.1 56.0
51.8
45.0
39.5 40.8
2008 2009 2010 2011 2012 2013 2014 2015 2016 2017 2018 2019 1Q 2020 2020E 2021E
Brent crude oil price Net sales (world energy companies)
Platt's Oilgram data (Brent average annual price)
46
2020E and 2021E from DEF: Documento di Economia e Finanza (Ministero dell’Economia e delle Finanze), 24 April 2020BRENT CRUDE OIL PRICES IN THE FIRST FOUR MONTHS 2020
Brent crude oil prices – Index number January 2020=100,0
100.0
87.1
60.2 62.2
53.0
41.8
jan-20 feb-20 mar-20 apr-20 2020E 2021E
47 2020E and 2021E from DEF: Documento di Economia e Finanza (Ministero dell’Economia e delle Finanze), 24 April 2020Thank you!
Area Studi Mediobanca
www.mbres.itYou can also read