QUANTIFYING THE IMPACTS OF COVID-19 MOBILITY RESTRICTIONS ON RIDERSHIP AND FAREBOX REVENUES: THE CASE OF MASS RAPID TRANSIT IN JAKARTA, INDONESIA ...
←
→
Page content transcription
If your browser does not render page correctly, please read the page content below
LPEM-FEBUI Working Paper - 062      ISSN 2356-4008
   July 2021

   QUANTIFYING THE IMPACTS OF
COVID-19 MOBILITY RESTRICTIONS ON
RIDERSHIP AND FAREBOX REVENUES:
THE CASE OF MASS RAPID TRANSIT IN
       JAKARTA, INDONESIA

              Yusuf Sofiyandi
          Yusuf Reza Kurniawan
       Khoirunurrofik Khoirunurrofik
           Prayoga Wiradisuria
          Dikki Nur Ahmad Saleh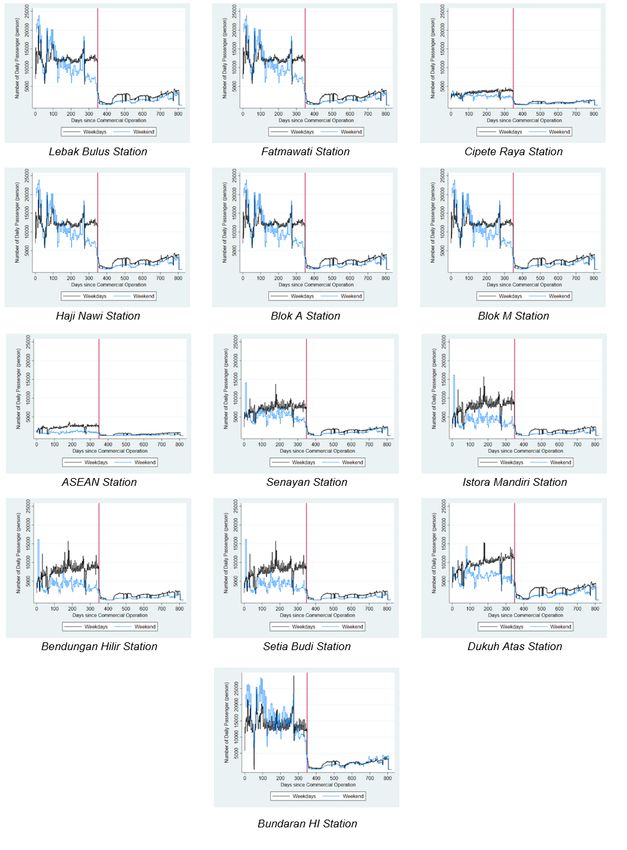
LPEM-FEB UI Working Paper 062

Chief Editor : Riatu M. Qibthiyyah
Editors      : Kiki Verico
Setting      : Rini Budiastuti

© 2021, July
Institute for Economic and Social Research
Faculty of Economics and Business
Universitas Indonesia (LPEM-FEB UI)

Salemba Raya 4, Salemba UI Campus Jakarta, Indonesia 10430
Phone : +62-21-3143177
Fax : +62-21-31934310
Email : lpem@lpem-feui.org
Web : www.lpem.org
LPEM-FEB UI Working Paper 062, July 2021
                                                                                                                      ISSN 2356-4008

Quantifying the Impacts of COVID-19 Mobility
Restrictions on Ridership and Farebox Revenues:
The Case of Mass Rapid Transit in Jakarta,
Indonesia∗
Yusuf Sofiyandi1,F, Yusuf Reza Kurniawan1, Khoirunurrofik Khoirunurrofik1,
Prayoga Wiradisuria2, and Dikki Nur Ahmad Saleh2

 Abstract
  This paper studies the impact of mobility restriction on daily mass rapid transit (MRT) ridership in Jakarta-Indonesia, and
  its implication for the farebox revenues during the pandemic COVID-19 outbreak. For the analysis, we primarily used the
  fare cost and daily passenger datasets of 156 origin-destination pair routes from April 2019 to May 2021. Three types of
  mobility restrictions are examined: (i) 50% of maximum passenger capacity setting, (ii) station closures, and (iii) changes
  in service operating hours. A panel dynamic fixed-effects regression model was fitted to quantify the economic losses on
  farebox revenue due to the mobility restrictions. We find that the average daily MRT ridership decrease by 56.6% due to
  capacity restriction, 32.6% due to station closures, and 1.7% due to a one-hour decrease in service operating hours. The
  station closures lead to a route diversion with a significant increase in ridership among other stations. While the effects of
  capacity restriction and changes in service operation hours have a larger impact during weekdays, the effect of station
  closure is more pronounced during the weekend. Our estimation results also reveal that the mobility restrictions during
  the COVID-19 pandemic have caused a loss of IDR 179.4 billion or equal to USD12.4 million in terms of potential farebox
  revenues to the MRT train service operator. This amount could contribute to 65.6% of total realized farebox revenues in
  2019–2020. This finding suggests the importance of adjusting the tariff subsidy policy in times of crisis, considering that
  the company still bears the operating costs despite decreasing operating hours. It also advises the company to take this
  crisis as momentum to enhance operational efficiency and expand the business prospect from non-fare box revenue.

  JEL Classification: L92; O18; R40
  Keywords
  COVID-19 — pandemic — public transport — MRT — ridership — mobility restriction
 1 Institute
         for Economic and Social Research, Faculty of Economics and Business, Universitas Indonesia
 2 PT.
     MRT Jakarta
 F Corresponding address: Institute for Economic and Social Research (LPEM) Universitas Indonesia Building. Campus UI Salemba,

 Salemba Raya St., No. 4, Jakarta, 10430, Indonesia. Email: yusuf.sofiyandi@lpem-feui.org.

                        1. Introduction                                           to a significant decline in daily ridership (e.g., Eisenmann
                                                                                  et al., 2021; Jenelius & Cebecauer, 2020; Tiikkaja & Viri,
The coronavirus 2019 (COVID-19) outbreak has posed un-                            2020).
precedented serious threats to global society by not only                             Recent works of literature have examined the relation-
affecting the health condition of people but also slowing eco-                    ship between COVID-19 and government interventions on
nomic growth for almost all economic sectors. To prevent                          human mobility and public transport ridership. Park (2020)
the spread of the virus from getting wider and to mitigate                        found that the social distancing decreases the mean daily
the negative impact of COVID-19 on economic activities,                           number of passengers in all subway stations in Seoul, South
many governments and authorities in cities or countries have                      Korea by or 40.6% by the first week of the COVID-19
taken a substantial number and variety of policies, includ-                       pandemic. Fatmi (2020) revealed that individuals’ partic-
ing lockdowns, zonal quarantines, and social distancing at                        ipation in daily out-of-home activities in Canada was re-
different scales over a period of months (Cheng et al, 2020).                     duced by more than 50% during COVID-19. Almlöf et al.
In the urban transport sector, there are imposed restrictions                     (2020) found that decreases in public transport use during
on people’s mobility especially for those who use public                          the COVID-19 pandemic in Sweden are linked to areas
transport because the public transit facilities are recognized                    with a population of high socioeconomic status. Travel sat-
as high-risk environments for the transmission of COVID-                          isfaction during the COVID-19 outbreak also significantly
19 virus particles (i.e., Gutiérrez et al., 2020; Shen et al.,                   influences public transport ridership (Dong et al., 2021;
2020; Zhen et al., 2020). The travel restrictions thus lead                       Khaddar & Fatmi, 2021).
   * The views expressed in this article are those of the authors alone and
                                                                                      From the perspective of urban transport operators, the
do not necessarily reflect the official views of the Institute for Economic       travel restriction and social distancing policy during the
and Social Research.                                                              pandemic crisis clearly has influenced the financial perfor-

                                                                              1
Quantifying the Impacts of COVID-19 Mobility Restrictions on Ridership and Farebox Revenues: The Case of Mass
Rapid Transit in Jakarta, Indonesia∗ — 2/11
mance of transport service companies in a negative direction. 2. Mobility Restrictions and the Trend of
Decreasing daily ridership rates due to either authorities’ re- Daily MRT Ridership During the
strictions or travelers’ own choices would imply economic
COVID-19 Pandemic
losses (both directly and indirectly) for companies by gener-
ating lower farebox and non farebox revenues. The situation The MRT has been projected as a promising rail-based
can be more difficult and raises awareness about the finan- urban transport mode and it has the potential to become the
cial risks for some early-stage public transport companies, at backbone of integrated public transportation systems in a
least in the short term, especially when considering that the metropolitan city like Jakarta. The infrastructure of MRT
granted subsidy for public services obligation could become are relatively newly established and still have more than
smaller and the operating cost likely remains unchanged or two phases of development for the next 5-10 years. In 2019,
slightly increases. the average daily MRT ridership is approximately 86,200
passengers per day and grew by about 2.8% percent per
In the context of public transport services provided by an month and by a long-term projection the average daily MRT
early-stage public transport company, the case of mass rapid ridership in Jakarta will reach one million passengers in
transit (MRT) development in Jakarta, can be a fascinating 2030 (MRT, 2020a).
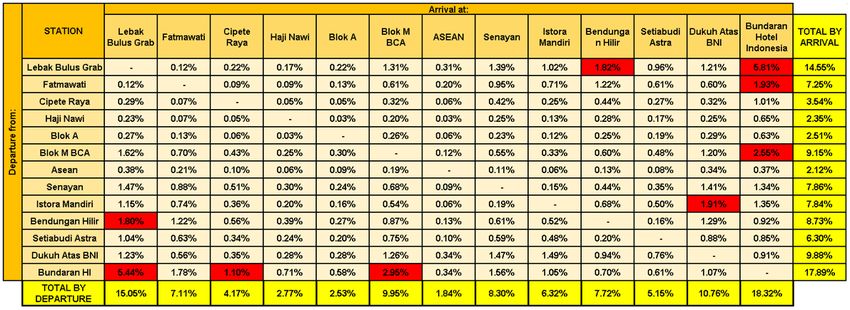
example to examine how the government policy response Figure 1 shows the matrix of share of the daily passen-
related to COVID-19 has a consequence on the farebox gers of MRT by the origin-destination pair routes in 2019.
revenue of the rail-based transport operator through the The red-highlighted cells indicate the most popular origin-
ridership channel. The MRT was started to operate in March destination pair routes (i.e., 1.5 times above the standard
2019, exactly one year before the first case of COVID-19 in deviation of total daily ridership). It can be shown that the
Indonesia. passenger flows are less dispersed across routes. The reason
is that some of these routes are not only connected to larger
Since the national government of Indonesia and the employment and shopping centers but also other mass pub-
regional government of Jakarta took one of the limited avail- lic transport facilities. For example, a public bus terminal or
able options for Health Quarantine Action called PSBB a commuter train station. At the station level, Lebak Bulus
or “Large-Scale Social Restrictions” in April 2020, the Grab and Bundaran HI are the two busiest MRT stations. A
daily ridership rate of MRT in Jakarta has been dramati- combined share of these two stations is equal to as much as
cally declining. The limitations on operational hours and one-third of the total daily passenger.
maximum seat capacity as well as station closures are three Since the beginning of its full commercial operation in
among other interventions of mobility restrictions related to 2019, the MRT train service is available from 05:00 to 24:00.
COVID-19 protocol which have significantly contributed to In a normal pre-COVID19 situation, the MRT train headway
the low ridership issue. departures every 5 minutes during rush hours at 07:00-09:00
(only from Monday to Friday) and every 10 minutes during
The aim of this paper is to estimate the impact of COVID- normal hours. However, to respond to the implementation
19 mobility restrictions on the daily MRT ridership in Jakarta of the PSBB due to the COVID-19 pandemic outbreak in
and to measure the potential farebox revenue losses resulted Jakarta, the MRT operator company has set adjustments
from the implementation of three types of mobility restric- in terms of 50 percent of maximum capacity load, station
tions as the response from the newly emerged rail-based closures, and operational hours of MRT train fleets. Few
company. By primarily utilizing the datasets of fare cost stations were shut down gradually and the adjustments of
per trip and the daily MRT ridership from April 2019 to operating hours were varied along with the upward and
May 2021, our study addresses the following questions: (1) downward trends of COVID-19 infections in the city. We
how does each type of COVID-19 related intervention on summarize the sequence of station closures and adjustments
mobility restriction influence the daily MRT ridership on of operating hours in Table 2 and Table 3, respectively. Due
average? and (2) how much do the potential farebox revenue to the pandemic COVID-19 outbreak, the average daily
losses result from each intervention? MRT ridership dropped by about 68%. The rate of ridership
is equal to 27,100 passengers per day in 2020.
Figure 2 shows the changes in the trend of average daily
To the best of our knowledge, this is the first study to
MRT ridership before and after the implementation of PSBB
estimate the effect of COVID-19 related mobility restriction
in Jakarta (separated by the red line) for each station during
on ridership and to evaluate the monetary impact in terms
weekdays and weekends. All stations are visually having a
of farebox revenue generation using a case of mass rapid
similar pattern but with various gaps. Before the PSBB was
transit.
implemented, there was a significant difference between
weekdays and weekends. The average ridership per day for
The rest of the paper is organized as follows. Section weekdays is 1.3 times as higher as for weekends. The ratio
2 describes the interventions related to the COVID-19 pro- increases to 2.1 after the PSBB was implemented. It sug-
tocol on mobility restriction for MRT users and the trend gests that the work and school commuters play a critical
of MRT ridership during pandemic COVID-19. Section 3 role in shaping the gap of travel demand for MRT train
describes the data and the methodology used to estimate the service as the real impact exceeds the actual 50% maximum
impacts. Section 4 presents the estimation results. The last capacity restriction. Changes in people behavior for doing
section concludes the paper. their daily routine activities such as work, school, and shop-
LPEM-FEB UI Working Paper 062, July 2021Quantifying the Impacts of COVID-19 Mobility Restrictions on Ridership and Farebox Revenues: The Case of Mass
Rapid Transit in Jakarta, Indonesia∗ — 3/11
Figure 1. Share of Daily Passenger of MRT Jakarta (Phase 1) by Origin-Destination Route, 2019
Source: MRT Jakarta, unpublished data (authors’ calculation)
ping into work-from-home (WFH), distance learning, and 3. Data and Methodology
online shopping explain why the real impact is beyond than
expected. 3.1 Dataset
For the purpose of analysis in this study, we construct and
Table 1. MRT Station Closures in 2020
combine the dataset from various sources. First, the main
Station Period Length of Days
interest of data is the amount of ridership at each of 13
Haji Nawi 20 April 2020–4 June 2020 45 days stations of the North-South Line MRT Jakarta (Phase 1). We
Blok A 20 April 2020–4 June 2020 45 days
obtained the ridership data from the MRT operator company.
ASEAN 20 April 2020–4 June 2020 45 days
Istora Mandiri 23 April 2020–4 June 2020 42 days The daily ridership is based on passenger counting data. The
Setiabudi Astra 23 April 2020–4 June 2020 42 days data we use for the analysis covers the period from April
Senayan 27 April 2020–4 June 2020 38 days 2019 to May 2021 on a daily basis. Next, the information
Bendungan Hilir 27 April 2020–4 June 2020 38 days
about the time of station closures and changes in MRT
Source: Annual Report of PT MRT Jakarta (2020, pp. 173)
operating hours during pandemic COVID-19 outbreak were
obtained from the Annual Report 2019–2020 of the Mass
Rapid Transit Jakarta Ltd. For the period beyond 2020, we
obtain the information from the company’s official press
release, which can be found at MRT Jakarta’s website (https:
//jakartamrt.co.id/id/siaran-pers).
We also collect additional information regarding the
fare cost per trip and the list of the date of public holidays.
The fare cost per trip for each origin-destination route was
publicly available to download from the MRT Jakarta Web-
site at https://jakartamrt.co.id/id/tarif-mrt-jakarta, while the
list of public holidays in 2019–2021 can be retrieved from
https://publicholidays.co.id.
Using google maps, we manually record the latitude and
longitude location of MRT stations in order to be able to
calculate the geographical distance to the nearest station of
other two urban mass transport mode facilities in the Jakarta
area (i.e., TransJakarta - Bus Rapid Transit bus stop and
KRL Commuter Line - train station). We provide a brief
summary and the descriptive statistic of variables in Table 1
and 2, respectively.
3.2 Empirical Model
We employ a panel dynamic regression estimator with origin-
destination (OD) pair route and daily fixed effects as the
main strategy in our analysis. We choose the fixed-effects
estimator to control for time-invariant heterogeneity of OD
pair routes and time-variant shocks that may simultaneously
affect all the OD pair routes in order to be able to reduce
any potential endogeneity issue.
LPEM-FEB UI Working Paper 062, July 2021Quantifying the Impacts of COVID-19 Mobility Restrictions on Ridership and Farebox Revenues: The Case of Mass
Rapid Transit in Jakarta, Indonesia∗ — 4/11
Table 2. Adjustments to the Operational Hours of MRT Trains in 2020–2021
Operating Hours Length of Operating Hours
Year Month Period
Weekdays Weekend Weekdays Weekend
2020 April 1–9 April 06:00–20:00 06:00–20:00 14 hours 14 hours
10–19 April 06:00–18:00 06:00–18:00 12 hours 12 hours
20–30 April 06:00–18:00 06:00–18:00 12 hours 12 hours
May 1–31 May 06:00–18:00 06:00– 18:00 12 hours 12 hours
June 1–4 June 06:00–18:00 06:00–18:00 12 hours 12 hours
05–June 05:00–21:00 05:00–21:00 16 hours 16 hours
6–30 June 05:00–21:00 06:00–20:00 16 hours 14 hours
July 1–31 July 05:00–21:00 05:00–20:00 16 hours 15 hours
August 1–31 August 05:00–22:00 06:00–20:00 17 hours 14 hours
September 1–16 September 05:00–22:00 06:00–20:00 17 hours 14 hours
17–20 September 05:00–20:00 05:00–20:00 15 hours 15 hours
21–30 September 05:00–19:00 05:00–19:00 14 hours 14 hours
October 1–11 October 05:00–19:00 05:00–19:00 14 hours 14 hours
12–31 October 05:00–21:00 06:00–20:00 16 hours 14 hours
November 1–30 November 05:00–21:00 06:00–20:00 16 hours 14 hours
December 1–17 December 05:00–21:00 06:00–20:00 16 hours 14 hours
18–31 December 05:00–20:00 06:00–20:00 15 hours 14 hours
2021 January 1–10 January 05:00–20:00 06:00–20:00 15 hours 14 hours
11–25 January 05:00–20:00 06:00–20:00 15 hours 14 hours
26–31 January 05:00–21:00 06:00–20:00 16 hours 14 hours
February 1–10 February 05:00–21:00 06:00–20:00 16 hours 14 hours
11–28 February 05:00–22:00 06:00–20:00 17 hours 14 hours
March 1–9 March 05:00–22:00 06:00–20:00 17 hours 14 hours
10–31 March 05:00–22:00 06:00–21:00 17 hours 15 hours
April 1–18 April 05:00–22:00 06:00–21:00 17 hours 15 hours
19–30 April 05:00–23:00 06:00–21:00 18 hours 15 hours
May 1–20 May 05:00–23:00 06:00–21:00 18 hours 15 hours
21–23 May 05:00–22:00 06:00–21:00 17 hours 15 hours
24–31 May 05:00–21:30 06:00–21:00 16,5 hours 15 hours
Source: Annual Report of PT MRT Jakarta (2020, pp. 163) and authors’ compilation of MRT official press releases during 2021
Table 3. List of Variables
Dependent variable
ridership Total daily ridership counts (in persons)
Independent variables
hour Length of MRT operation hours at day i-th (hours)
fare Fare cost per trip per person (in IDR)
pandemic Dummy for COVID-19 outbreak/PSBB declaration (since March 2020)
closure Dummy for station closure at day i-th
pubholiday Dummy for public holiday at day i-th
access brt Dummy for access to TransJakarta bus stop within a radius of 500 m
access rail Dummy for access to KRL Commuter Line train station within a radius of 500 m
Table 4. Descriptive Statistic of Variables
Variable Observations Mean Std. Dev. Min Max
ridership 114,494 294.86 547.52 0 15,648
hour 114,494 17.39 2.18 12 19
fare 114,494 6,615.39 2,949.29 3 14
pandemic 114,494 0.65 0.48 0 1
closure 114,494 0.05 0.21 0 1
pubholiday 114,494 0.11 0.31 0 1
access brt 114,494 0.15 0.36 0 1
access rail 114,494 0.15 0.36 0 1
In addition, OD pair route fixed-effects capture any se- OD pair route level as the daily ridership is not evenly
lection biases which may arise due to the over-representation distributed across OD pair routes and also to obtain robust
of popular routes in the ridership data distribution as a re- standard errors a remedial measure for heteroscedasticity.
sult of their location characteristics. For example, the ac- Given the availability of data, our analysis is restricted
cessibility to other mass public transit facilities, distance to to the time period 1 April 2019–31 May 2021. Note that, in
employment and shopping centers, etc. some cases, we also shorten the period of observations and
Daily fixed-effects arrest the effects of time-varying aggregate the daily ridership data of each OD pair route into
factors common to all OD pair routes such as the period of station level and line level to conduct appropriate analysis.
COVID-19, the implementation of PSBB, the application Our model covers 13 MRT stations and 156 OD pair routes.
of three types of intervention on mobility restriction. Time- To answer our first research question, we use a model
fixed effects are jointly significant. Errors are clustered at of the panel dynamic fixed-effects regression method that
LPEM-FEB UI Working Paper 062, July 2021Quantifying the Impacts of COVID-19 Mobility Restrictions on Ridership and Farebox Revenues: The Case of Mass
Rapid Transit in Jakarta, Indonesia∗ — 5/11
Figure 2. The Trend of the Daily Boarding Passenger in Each MRT Station During Weekdays and Weekends
(Before and After the Declaration of PSBB in April 2020)
Source: PT. MRT Jakarta, unpublished data (authors’ calculation)
can be written into the following equation: ridershipit is the total daily ridership counts (measured in
7 persons) in OD pair route i for day t. We included seven pe-
ln(ridershipit ) = β0 + βk ∑ ln(ridershipi,t−k ) riods lagged of total daily ridership as explanatory variables
k=1 because it can reasonably be assumed that the ridership level
+β8 . ln( f arei ) + β9 .hourt is determined by its past level and to defend the existence
+β10 .pandemict + β11 .closureit of autocorrelation in the regression. One may argue that
+β12 .pubholidayt + β13 .access brt j the use of a lagged dependent variable in the fixed effects
+β14 .access rail j + θi + θ j + θt
+θm + θy + εit (1) LPEM-FEB UI Working Paper 062, July 2021Quantifying the Impacts of COVID-19 Mobility Restrictions on Ridership and Farebox Revenues: The Case of Mass
Rapid Transit in Jakarta, Indonesia∗ — 6/11
estimator may cause a serious problem as by construction 4.1 The Effect of COVID-19 Capacity Restriction
lagged dependent variable and error term are correlated. on Daily MRT Ridership
The negative biases on estimates for positive coefficients Table 3 reports the panel fixed-effect estimation results of
may arise in short panels with small time periods. Since our the effect of COVID-19 capacity restriction – which applied
daily dataset is a panel with long time periods, we thus can under the implementation of large-scale social restriction,
address the negative bias issue. Moreover, we still obtain on the average daily MRT ridership at three different pe-
consistent results when the specification is modeled without riods (i.e., 2019–2020, 2020–2021, 2019–2021) and three
including the lagged dependent variable. different levels (i.e., origin-destination pair routes-level,
f arei is the fare cost per trip per person (in IDR unit) station-level, and line-level) with robust standard errors. The
for a trip of OD pair route i, while houri is the number of different estimation periods will help to identify whether
MRT operation hours for day t. In addition, pandemict is a the effect of capacity restriction is increasing along with the
dummy variable equal to one if the observation is measured trend of COVID-19 infections in the city, while the different
during the period of COVID-19 outbreak or after the first estimation levels will enable us to examine to what extent
day of PSBB declaration in March 2020 and zero other- the scale of such effect could be consistent.
wise. A consequence of the large-scale social restriction Our estimation results confirm that the COVID-19 ca-
is to put the capacity restriction for public transport sec- pacity restriction has an extremely negative effect on daily
tor – that is, allowing the public transit vehicle to operate MRT ridership for all estimation levels and their magnitudes
only at 50% of maximum passenger capacity. Hence, we are significantly increasing over time. At the line level, the
employ pandemict as a variable indicating the implementa- daily MRT ridership on average decreases by 68.6% during
tion of capacity restriction during the period of COVID-19 2019-2020 and 85.6% during 2020–2021. The average esti-
outbreak. mated effect decreases to 56.6% as we expand the period
closuret is a dummy variable equal to one if the trips of observations. The effect is also more pronounced at the
for OD pair route i not available due to station closure at station and origin-destination pair routes levels, which are
day t and zero otherwise. pubholidayt is a dummy variable respectively about 5% and 6% higher than the line level.
equal to one if the day t is a public holiday and zero oth- It indicates that the magnitude of the effect of COVID-19
erwise. access brt j and access train j are dummy variables capacity restriction on daily ridership is disproportionally
which equal to one if the station j is accessible from a Tran- distributed over stations and origin-destination pair routes.
sjakarta BRT bus stop and a KRL Commuter Line train For example, the reduction in total daily passengers will be
station within a radius of 500 meters and zero otherwise, smaller for any MRT station connected or nearly located
respectively. Terms θi , θ j , θt , θm , and θy are sequentially to other urban mass transit facilities (e.g., train stations or
the OD pair route, station, day, month, and year fixed effects. BRT bus stops) within a radius less than 500 meters.
εit is the independently and identically error term. In Table 4, we divide the estimation results based on
An additional dependent variable is required in order to weekdays and weekends. On average, the COVID-19 ca-
be able to answer our second research question. We later pacity restriction reduces the daily MRT ridership by 61%
compute the farebox revenue generated from OD pair route and 50.6% at the line level during weekdays and weekends,
i at day t by multiplying the number of ridership counts respectively. In contrast with the station and line levels,
and the fare cost per trip per person. Therefore, we rewrite the magnitude at the origin-destination pair routes level
Equation (1) as follows: is almost similar between weekdays and weekend trips. It
suggests that the implementation of COVID-19 capacity
7 restriction under the PSBB scheme causes an indifferent
revenueit = β0 + βk ∑ ln(revenuei,t−k ) + β8 .hour jt effect for all origin-destination pair routes regardless of the
k=1
day of trips.
+β9 .pandemict + β10 .closureit
+β11 .pubholidayt + β12 .access brt j 4.2 The Effect of Station Closures on Daily MRT
+β13 .access rail j + θi + θ j + θt + θm Ridership
+θy + εit (2) Table 5 shows our estimation results for the effect of sta-
tion closures during the COVID-19 outbreak on daily MRT
For the case of estimating the effect of changes in MRT ridership at three different levels based on weekdays and
operation hours on the potential farebox revenue losses, weekends. We limit the estimation to the period of 1 Jan
we first set a standard of 15-hours of operating time. This 2020–31 Dec 2020 as the sequence of station closures in
standard follows the restrictions under the implementation our dataset took place in 2020 only. In addition, we drop the
of PSBB for the public transport sector. A variance resulted temporarily closed stations from the observations to obtain
from the difference between the standard and actual MRT more accurate effect estimates as our interest in the first
train operation hours will be treated as the multiplying factor place is to know the consequences for the remaining opened
to compute the potential gains or losses of farebox revenue. or active stations.
That is, the gains or losses which should be generated if the The results show that the station closures have decreased
MRT operation hours deviate from the standard. the daily MRT ridership in other active stations by approxi-
mately 32.6% at the line level. The size is still reasonable
because the share of passenger in all six temporarily closed
4. Results stations is around 34.6%.
At the station level, the impact of station closures on
LPEM-FEB UI Working Paper 062, July 2021Quantifying the Impacts of COVID-19 Mobility Restrictions on Ridership and Farebox Revenues: The Case of Mass
Rapid Transit in Jakarta, Indonesia∗ — 7/11
Table 5. Effects of COVID-19 Capacity Restriction on Daily MRT Ridership
Dependent variable: Ridership at OD Pair Route Level Ridership at Station Level Ridership at Line Level (Phase 1)
ln(ridership) 2019/21 a) 2019/20 b) 2020/21 c) 2019/21 a) 2019/20 b) 2020/21 c) 2019/21 a) 2019/20 b) 2020/21 c)
COVID19 -0.626*** -0.778*** -0.958*** -0.618*** -0.738*** -0.949*** -0.566*** -0.686*** -0.856***
(0.042) (0.038) (0.045) (0.050) (0.044) (0.052) (0.014) (0.012) (0.008)
Constant 1.072*** 0.580*** 1.841*** 1.508*** 0.711*** 2.479*** 1.785*** 0.842*** 2.804***
(0.115) (0.133) (0.100) (0.187) (0.178) (0.130) (0.083) (0.025) (0.049)
Observations 114,494 91,235 72,902 114,494 91,235 72,902 114,494 91,235 72,902
R2 0.924 0.931 0.899 0.943 0.951 0.924 0.960 0.965 0.947
R2 Within 0.882 0.893 0.853 0.934 0.942 0.919 0.959 0.964 0.946
Note: a) Between 1 Apr 2019–31 May 2021, b) Between 1 Apr 2019–31 Dec 2020, c) Between 1 Jan 2020–31 May 2021.
Clustered standard error at station level in parentheses. Included control variables are not shown.
Significance level: * p < 0.01, ** p < 0.05, *** p < 0.01.
Table 6. Effects of COVID-19 Capacity Restriction on Daily MRT Ridership During Weekdays and Weekends
Dependent variable: Ridership at OD Pair Route Level Ridership at Station Level Ridership at Line Level (Phase 1)
ln(ridership) Weekdays Weekends Weekdays Weekends Weekdays Weekends
COVID19 -0.609*** -0.606*** -0.642*** -0.540*** -0.610*** -0.506***
(0.042) (0.056) (0.046) (0.066) (0.024) (0.008)
Constant 1.245*** 0.265* 1.963*** 0.559** 2.312*** 0.830***
(0.073) (0.123) (0.101) (0.210) (0.128) (0.056)
Observations 81,773 32,721 81,773 32,721 81,773 32,721
R2 0.925 0.914 0.941 0.957 0.964 0.971
R2 Within 0.896 0.886 0.941 0.957 0.964 0.970
Note: All estimates are between 1 Apr 2019–31 May 2021. Clustered standard error at station level in parentheses.
Included control variables are not shown. Significance level: * p < 0.01, ** p < 0.05, *** p < 0.01.
ridership rate for remaining opened stations is about 10.2% The results show that the average rate of daily MRT rid-
lower on average than compared to days where all MRT ership would increase by approximately 1.7%–2.1% when
stations were fully operated. In contrast to our previous esti- the MRT train service operates for a one-hour deviation
mation results in Table 5, the magnitudes for both estimation above the standard of 15-hours operation hours during the
levels are lower during the weekdays (17.7%–40.2%) rela- implementation of PSBB. Our estimation results are con-
tive to weekends (27.1%–44.2%). One plausible reason is sistent and have similar patterns at the station and OD pair
that the MRT users who travel to/from the closed stations routes levels.
might have a set of preferences (e.g., trip profile, travel The effect is even more substantial if the MRT operator
motivation) toward a weekend trip and such preferences changes the operating hours during the weekdays (i.e., 5.1%–
are correlated to the location-specific unobserved character- 8.4%). A contradictory situation occurs if the changes in
istics. We admit that we are unable to explain the pattern operation hours take place during the weekends, where the
because there is no information available about the trip average rate of daily MRT ridership would decrease by
profile and travel motivation from the dataset. 10.2%–13.8%. With the increasing gap in the average rate
Surprisingly, the impact of station closure on ridership of daily MRT ridership between weekdays and weekend
rate is positive at origin-destination pair routes-level among periods, these findings would justify a reason for the MRT
active stations. It is easily understood that the station closure operator to set shorter operation hours to optimize the daily
has led to a route diversion for a short-term period and MRT ridership during the weekend.
hence increase the ridership for the remaining active stations
by 11.8%. When a station closure occurs, the MRT users 4.4 Implications of COVID-19 Mobility Restrictions
choose the nearest alternative departure/arrival station given for Farebox Revenues
the additional travel cost. The fact that the ridership rate Table 7 presents our results in estimating the potential fare-
increases by about 9% during the weekdays imply that the box revenue losses due to public transport maximum capac-
route diversion effect is stronger for work commuters. ity restriction during the COVID-19 outbreak. The farebox
revenue losses occur because the MRT train service cannot
4.3 The Effect of Changes in MRT Operation Hours load passengers at its full capacity. The estimation results
on Daily Ridership would reflect the annual farebox revenue that could be gen-
Table 6 presents the estimation results of the effect of erated as if the pandemic COVID-19 either outbreak or the
changes in MRT operation hours on the average rate of large-scale social restriction did not exist.
daily MRT ridership, followed by the implementation of We estimate that the MRT operator company have lost
PSBB during the COVID-19 outbreak. We again separate the potential farebox revenues by approximately IDR413
the analysis into three different estimation levels based on million (USD28,480) per day due to the capacity restriction
weekdays and weekends. We expand the period of estima- during the COVID-19 outbreak. This amount is equal to
tion from 1 Jan 2020 to 31 May 2020 as the changes in IDR183.4 billion (USD12.7 million) during the period of
MRT operation hours still were continued until May 2021. 2020–2021. In 2020, the potential farebox revenue losses
LPEM-FEB UI Working Paper 062, July 2021Quantifying the Impacts of COVID-19 Mobility Restrictions on Ridership and Farebox Revenues: The Case of Mass
Rapid Transit in Jakarta, Indonesia∗ — 8/11
Table 7. Effects of Station Closure on Daily MRT Ridership
Dependent variable: Ridership at OD Pair Route Level Ridership at Station Level Ridership at Line Level (Phase 1)
ln(ridership) All Weekdays Weekends All Weekdays Weekends All Weekdays Weekends
Station 0.118*** 0.090** -0.084** -0.102** -0.177*** -0.271*** -0.326*** -0.402*** -0.442***
closure (0.022) (0.026) (0.029) (0.036) (0.039) (0.033) (0.001) (0.002) (0.001)
Constant 1.539*** 1.941*** 0.417** 2.274*** 3.039*** 0.647** 3.640*** 4.272*** 1.907***
(0.160) (0.166) (0.118) (0.182) (0.168) (0.235) (0.004) (0.007) (0.009)
Observations 24,098 17,226 6,872 24,098 17,226 6,872 24,098 17,226 6,872
R2 0.927 0.916 0.915 0.955 0.945 0.973 0.968 0.965 0.989
R2 Within 0.900 0.905 0.919 0.954 0.954 0.984 0.967 0.964 0.989
Note: All estimates are for the period from 1 Jan 2020 to 31 Dec 2020, when the sequence of station closure was implemented.
Only active OD pair routes are estimated. Clustered standard error at station level in parentheses.
Included control variables are not shown. Significance level: * p < 0.01, ** p < 0.05, *** p < 0.01.
Table 8. Effects of Station Closure on Daily MRT Ridership
Dependent variable: Ridership at OD Pair Route Level Ridership at Station Level Ridership at Line Level (Phase 1)
ln(ridership) All Weekdays Weekend All Weekdays Weekend All Weekdays Weekend
Operating 0.021** 0.051*** -0.108*** 0.026*** 0.073*** -0.138*** 0.017*** 0.084*** -0.102***
hours (0.007) (0.006) (0.013) (0.007) (0.006) (0.014) (0.002) (0.001) (0.010)
Observations 37,163 26,441 10,722 37,163 26,441 10,722 37,163 26,441 10,722
R2 0.859 0.828 0.822 0.886 0.825 0.935 0.924 0.914 0.968
R2 Within 0.743 0.696 0.699 0.870 0.840 0.943 0.921 0.909 0.967
Note: All estimates are for the period from 1 Jan 2020 to 31 May 2021, when adjustment of operating hours was implemented.
All OD pair routes are estimated. Clustered standard error at station level in parentheses.
Intercept and included control variables are not shown. Significance level: * p < 0.01, ** p < 0.05, *** p < 0.01.
due to the capacity restriction during the COVID-19 out- In aggregate, the MRT operator’s decision to temporar-
break is approximately IDR 399 million (USD27,515) per ily close several stations during the year 2020 has lost the
day or IDR117 billion (USD8.1 million) in total. This eco- potential farebox revenue by approximately IDR2.5 billion
nomic loss is equal to 142.6% and 61.1% of total realized in total. This amount is equal to 3.1% and 1.3% of total
farebox revenues in 2020 and 2019, respectively. Neverthe- realized farebox revenue in 2020 and 2019, respectively.
less, it is important to note that we still have not excluded We admit that our estimation might produce a little
the farebox revenue losses by the effects of station closures underestimated results in the first place because we have not
and changes in MRT operation hours from these estimates. taken into account the potential farebox revenue losses on
The potential farebox revenue loss at the rate of week- zero ridership for any trip from the closed station. Yet our
days trips is 2.5–3.1 times higher as much as the rate of interest is to measure the indirect impact of station closure,
weekends trips. If the MRT daily ridership can persistently the estimation results are still convincing and consistent in
increase at the rate of weekdays trips for a full year, the describing the potential farebox revenue losses borne by
potential farebox revenue losses could be equal to IDR199.1 other remaining active stations.
billion (USD13.7 million) at maximum. Meanwhile, if the To obtain full-size impact of station closure, we extend
MRT daily ridership can persistently increase at the rate the analysis by calculating the average farebox revenues per
of weekend trips for a full year, the potential farebox rev- day for all temporarily closed stations as if there was no
enue losses only reach IDR78.9 billion (USD5.4 million) at closure at any period – which is equal to IDR32.9 million
maximum. (USD2,269) per day. By combining both direct and indirect
Table 8 provides our results in estimating the potential impacts of station closure in 2020, we reveal that the total
farebox revenue losses per day due to a sequence of MRT potential farebox revenue losses reached IDR3.8 billion
station closures during the year 2020. The potential farebox (USD0.3 million). Given that the realized farebox revenues
revenue losses occur because of unavailable trips from and in 2019 and 2020 were IDR191.6 billion (USD13.2 million)
to the closed stations. Thus, it is important to note that and IDR82 billion (USD5.7 million) (MRT, 2020b), the
our estimation results reflect the indirect impact of station total potential farebox revenue losses is respectively equal
closures on other remaining active stations. to 4.7% and 2.0% of total actual farebox revenues in 2020
We estimate that the MRT operator company have lost and 2019.
the potential farebox revenue losses by approximately IDR Table 9 presents our estimation results on the potential
848,000 (USD58.5) per day for each remaining active sta- farebox revenue losses per day due to changes in MRT oper-
tion until the temporarily closed stations are reopened. The ation hours during the COVID-19 pandemic outbreak. The
potential farebox revenue losses from weekdays trips is potential farebox revenue losses occur because of unavail-
larger than weekend trips because the previous estimation able trips during certain time periods. In that case, the users
results show that there is a difference in ridership rate be- may cancel their trips as the MRT operator changes train
tween the two groups of travel days. The potential potential operation hours periodically.
farebox revenue losses from weekdays trips is almost twice We find that that the MRT operator company have lost
higher as much as from weekdays trips. the potential farebox revenues by approximately IDR311,000
LPEM-FEB UI Working Paper 062, July 2021Quantifying the Impacts of COVID-19 Mobility Restrictions on Ridership and Farebox Revenues: The Case of Mass
Rapid Transit in Jakarta, Indonesia∗ — 9/11
Table 9. Indirect Impact of COVID-19 Capacity Restriction on Potential Farebox Revenue Losses
Dependent variable: Farebox revenue per day 2020 2020–2021
(million IDR) All Weekdays Weekend All Weekdays Weekend
COVID-19 public - 399.156*** - 566.216*** -180.794** -413.044**** -545.527*** -216.249***
transport capacity restriction (0.483) (0.578) (0.089) (0.227) (0.807) (0.191)
Observations 49,643 35,489 14,154 72,902 51,981 20,921
R2 0.960 0.981 0.993 0.957 0.978 0.971
R2 Within 0.960 0.981 0.993 0.957 0.978 0.971
Note: All estimates are for the period from 1 Jan 2020 to 31 May 2021. All OD pair routes are estimated.
Clustered standard error at station level in parentheses. Intercept and included control variables are not shown.
Significance level: * p < 0.01, ** p < 0.05, *** p < 0.01.
Table 10. Indirect Impact of Station Closures on Potential Farebox Revenue Losses
Dependent variable: Farebox revenues
All Weekdays Weekend
per active station per day (IDR)
Station closure -848,594*** -945,301*** -472,917**
(0.201) (0.279) (0.185)
Observations 37,163 26,441 10,722
R2 0.895 0.913 0.856
R2 Within 0.814 0.820 0.797
Note: All estimates are for the period from 1 Jan 2020 to 31 Dec 2020, when the
sequence of station closure was implemented.
Only active OD pair routes are estimated.
Clustered standard error at station level in parentheses.
Intercept and included control variables are not shown.
Significance level: * p < 0.01, ** p < 0.05, *** p < 0.01.
(USD21.5) per one-hour deviation below the standard of (USD0.3 million) in 2020 and IDR 19.9 billion (USD1.4
15-hours operation hours for each OD pair route, vice versa. million) in 2021.
As previously mentioned, the effect of changes in MRT Based on the estimation results from Table 8, 9, and
operation hours is going in a different direction if the es- 10, we are finally able to calculate the aggregate potential
timation was separated between weekdays and weekends. farebox revenue losses borne by the MRT operator due to the
During the weekdays, a one-hour deviation below the stan- implementation of three types of mobility restrictions during
dard of 15-hours operation hours for each OD pair route the pandemic COVID-19 outbreak. Table 10 provides the
will lead to a potential farebox revenue loss by IDR211,000 summary of our calculations.
(USD14.6) (vice versa). Meanwhile, the farebox revenues
losses during the weekends will occur only if there is a one-
hour deviation above the standard of 15-hours operation 5. Conclusion
hours for each OD pair route – which is almost equal to
From the perspective of urban transport operators, the COVID-
IDR191,000 (USD13.2) (vice versa). These findings would
19 related travel restrictions have been significantly affect-
justify a reason for the MRT operator to act differently – that
ing people’s mobility which directly leads to a decrease in
is, by setting a shorter operating hour during the weekends
the public transit ridership as well as the financial perfor-
to reduce the size of economic losses on farebox revenues.
mance of transport service companies, particularly for the
In aggregate, the MRT operator decision to changes the fare-box items. Lower ticket revenues could bring unwanted
train operation hours periodically due to the implementa- consequences to the financial health of public transport com-
tion of the COVID-19 mobility restriction (i.e., by operating panies and the government who provide funding to support
below and above the standard of 15-hours operation hours the public transport services.
during weekdays and weekends respectively) has caused the In this paper, we investigate the effect of mobility re-
potential farebox revenue losses by around IDR5.4 billion striction on daily mass rapid transit (MRT) ridership and
(USD0.4 million) in 2020 and IDR7.2 billion (USD0.5 mil- its implication for the farebox revenues after the imple-
lion) until end of May 2021. The potential farebox revenue mentation of the Health Quarantine Action called PSBB
losses in 2020 is equal to 6.6% and 2.8% of total realized or “Large-Scale Social Restrictions” as the response to the
farebox revenues in 2020 and 2019, respectively. pandemic COVID-19 outbreak in Jakarta (Indonesia). We
However, it is noteworthy that – at a particular time – employ the datasets of fare cost and passenger counting for
the MRT operator also gained potential benefits on fare- 156 origin-destination pair routes across 13 stations within
box revenues by operating above and below the standard MRT Line Phase 1 in the period from April 2019–May 2021.
of 15-hours operation hours during weekdays and week- Our study is the first to estimate the effect of COVID-19
ends. The estimated benefit of such a reverse decision is related mobility restriction on ridership and to evaluate the
approximately IDR9.7 billion (USD0.7 million) in 2020 monetary impact in terms of farebox revenues generation
and IDR27.1 billion (USD1.9 million) in 2021. Therefore, using a case of mass rapid transit in Jakarta, Indonesia.
the changes in MRT train operation hours actually result in We examine three types of mobility restrictions imple-
positive net benefits of farebox revenues by IDR4.3 billion mented during the pandemic COVID-19 outbreak. The first
LPEM-FEB UI Working Paper 062, July 2021Quantifying the Impacts of COVID-19 Mobility Restrictions on Ridership and Farebox Revenues: The Case of Mass
Rapid Transit in Jakarta, Indonesia∗ — 10/11
Table 11. Impacts of Changes in MRT Operation Hours on Potential Farebox Revenue Losses
Dependent variable: Farebox revenues
All Weekdays Weekend
per hour deviation (IDR)
Operating hours 311,308*** 211,403*** -190,892***
(0.015) (0.010) (0.007)
Observations 37,163 26,441 10,722
R2 0.879 0.860 0.936
R2 Within 0.877 0.855 0.934
Note: All estimates are for the period from 1 Jan 2020 to 31 May 2021, when
adjustment of operating hours was implemented.
All OD pair routes are estimated. Estimates are at line level.
Clustered standard error at station level in parentheses.
Intercept and included control variables are not shown.
Significance level: * p < 0.01, ** p < 0.05, *** p < 0.01.
Table 12. Aggregated Potential Farebox Revenue Losses Due to COVID-19 Mobility Restrictions
Type of COVID-19 related Year 2020 Year 2021
mobility restrictions Economic Losses on Ratio to Realized Farebox Economic Loss on Ratio to Realized Farebox
Farebox Revenue*) Revenue in 2019**) Farebox Revenue Revenue in 2020**)
Capacity restriction on public transport 107.8 56.3% 55.2 67.3%
Station closures 3.8 2.0% - -
Changes in operation hours 5.4***) 2.8% 7.2***) 8.8%
Total 117 61.1% 62.4 76.1%
Note: *) Measurement unit in IDR biilion
**) Based on the Annual Report of PT MRT Jakarta (2020, pp. 187), the realized farebox revenues were IDR191.55 billion (2019) and
IDR82.03 billion (2020).
***) Exclude the estimates of economic gains
restriction is the limitation on maximum passenger capacity are considered as economic losses because they reflect the
where public transport providers are only allowed to load annual farebox revenues that could be generated as if the
passengers at 50% of maximum vehicle capacity. The next pandemic COVID-19 either outbreak or the large-scale so-
restriction is the closure events of few MRT stations. The cial restriction did not exist. Such economic losses occur
last restriction is the changes in MRT train service operat- because of the inability of MRT train fleets to load pas-
ing hours. For the purpose of analysis, we develop a panel sengers at the full capacity, the unavailability of providing
dynamic fixed-effects regression model to quantify the po- services from and to the closed stations, and the unavailabil-
tential economic losses on farebox revenues due to these ity of providing trips for certain time periods. Regarding
mobility restrictions. the size of the potential farebox revenue losses during the
period of COVID-19 outbreaks, the capacity restriction has
Based on the estimation results, we have three main find-
the largest effect followed by changes in operating hours
ings regarding the impacts on daily MRT ridership. First, the
and the station closure event.
restriction on maximum passenger capacity has significantly
decreased the daily MRT ridership at the line level by 56.6% Finally, this study provides evidence of the negative im-
on average. The magnitude of the effect is disproportionally pact of COVID-19 on the transportation sector. However,
distributed over stations as well as origin-destination pair these findings also illustrate how the decline in economic
routes and tends to increase over time. The accessibility activity of MRT passengers, especially in the trade, retail,
from the MRT station to other mass transit facilities is the financial, and corporate services sectors, which are the pri-
key to offset the negative effect of capacity restriction on the mary industries on the current MRT route. Additionally, the
daily ridership. Secondly, the station closures have signifi- results show that the restriction policy has decreased the
cantly decreased the daily MRT ridership at the line level potential revenue of the MRT by almost 66 percent from
by 32.6% on average but simultaneously created a trip route the farebox. Hence, it is suggested that the burden should
diversion which is indicated by a significant increase in be shared between the local government and the company.
ridership at the origin-destination pair route level for other Local governments can consider the subsidy reformulate in
remaining active stations by 11.8%. Lastly, the one-hour times of crisis, considering that the MRT still bears the oper-
reduction of the standard of 15-hours in MRT train service ational and maintenance costs. As the pandemic continues,
operation hours under the COVID-19 protocol significantly there is a serious concern about the financial risk of lower
influences the daily MRT ridership at the line level by 1.7% ticket revenues. The provincial government of Jakarta has
on average with a positive impact for weekday trips, but been granted a subsidy through a public service obligation
negative for weekend trips. scheme is equivalent to IDR534.1 billion (USD36.8 million)
in 2019 and IDR620.8 billion (USD42.8 million) in 2020
Our estimation results also reveal that the mobility re-
to support the operation of MRT train services in the short
striction during the COVID-19 pandemic has caused the
term.
MRT train service operator to lose the potential farebox rev-
enues of IDR179.4 billion (USD12.4 million) in total from On the other hand, the MRT must continuously improve
March 2020 until May 2021. The potential farebox revenues its operational efficiency by taking the crisis period as mo-
LPEM-FEB UI Working Paper 062, July 2021Quantifying the Impacts of COVID-19 Mobility Restrictions on Ridership and Farebox Revenues: The Case of Mass
Rapid Transit in Jakarta, Indonesia∗ — 11/11
mentum in carrying out business strategies, especially for Park, J. (2020). Changes in subway ridership in re-
earning revenue from non-farebox opportunities. Finding sponse to COVID-19 in Seoul, South Korea: Implica-
innovations of business strategies to balance ticket revenues tions for social distancing. Cureus, 12(4), e7668. doi:
with non-farebox revenue sources while keeping the high https://dx.doi.org/10.7759/cureus.7668.
levels of service and reducing the COVID-19 transmission Shen, J., Duan, H., Zhang, B., Wang, J., Ji, J. S.,
Wang, J., ... & Shi, X. (2020). Prevention and control
risks at the same time will be challenging for the MRT oper-
of COVID-19 in public transportation: Experience from
ator company. To support this, further analysis to understand China. Environmental Pollution, 266, Part 2, 115291. doi:
the implication of COVID-19 on the non-farebox revenues https://doi.org/10.1016/j.envpol.2020.115291.
is still required. We leave the research for future work. Tiikkaja, H., & Viri, R. (2021). The effects of COVID-
19 epidemic on public transport ridership and frequen-
Acknowledgements cies. A case study from Tampere, Finland. Transportation
The authors are greatly indebted to PT. MRT Jakarta for Research Interdisciplinary Perspectives, 10, 100348. doi:
providing the daily ridership dataset under the consideration https://doi.org/10.1016/j.trip.2021.100348.
of non-disclosure agreement in the framework of coopera- Zhen, J., Chan, C., Schoonees, A., Apatu, E., Thabane, L., &
tion between respective parties. The authors are grateful for Young, T. (2020). Transmission of respiratory viruses when
using public ground transport: A rapid review to inform
many valuable, and constructive comments to Muhammad
public health recommendations during the COVID-19 pan-
Halley Yudhistira, Andhika Putra Pratama, and academic
demic. South African Medical Journal, 110(6), 478-483. doi:
colleagues from the Research Cluster of Urban and Trans- https://doi.org/10.7196/SAMJ.2020.v110i6.14751.
port Economics.
References
Almlöf, E., Rubensson, I., Cebecauer, M., & Jenelius, E.
(2020). Who continued travelling by public transport dur-
ing COVID-19? Socioeconomic factors explaining travel be-
haviour in Stockholm 2020 based on smart card data. doi:
https://dx.doi.org/10.2139/ssrn.3689091.
Cheng, C., Barceló, J., Hartnett, A. S., Kubinec, R., & Messer-
schmidt, L. (2020). COVID-19 government response event
dataset (CoronaNet v. 1.0). Nature Human Behaviour, 4(7),
756-768. doi: https://doi.org/10.1038/s41562-020-0909-7.
Dong, H., Ma, S., Jia, N., & Tian, J. (2021). Under-
standing public transport satisfaction in post COVID-
19 pandemic. Transport Policy, 101, 81-88. doi:
https://doi.org/10.1016/j.tranpol.2020.12.004.
Eisenmann, C., Nobis, C., Kolarova, V., Lenz, B., & Winkler,
C. (2021). Transport mode use during the COVID-19 lock-
down period in Germany: The car became more important,
public transport lost ground. Transport Policy, 103, 60-67. doi:
https://doi.org/10.1016/j.tranpol.2021.01.012.
Fatmi, M. R. (2020). COVID-19 impact on urban mobil-
ity. Journal of Urban Management, 9(3), 270-275. doi:
https://doi.org/10.1016/j.jum.2020.08.002.
Gutiérrez, A., Miravet, D., & Domènech, A. (2020). COVID-
19 and urban public transport services: emerging chal-
lenges and research agenda. Cities & Health, 1-4. doi:
https://doi.org/10.1080/23748834.2020.1804291.
Jenelius, E., & Cebecauer, M. (2020). Impacts of COVID-
19 on public transport ridership in Sweden: Analysis of
ticket validations, sales and passenger counts. Transporta-
tion Research Interdisciplinary Perspectives, 8, 100242. doi:
https://doi.org/10.1016/j.trip.2020.100242.
Khaddar, S., & Fatmi, M. R. (2021). COVID-19: Are you
satisfied with traveling during the pandemic?. Transporta-
tion Research Interdisciplinary Perspectives, 9, 100292. doi:
https://doi.org/10.1016/j.trip.2020.100292.
MRT. (2020a, September). Feasibility Study for Phase 2B Section
of Jakarta MRT North-South Line Project (Kota – West Ancol).
2020. unpublished. PT MRT Jakarta (Perseroda).
MRT. (2020b). Annual Report of PT MRT Jakarta: Build-
ing resilience, driving innovation: Membangun ketang-
guhan, mendorong inovasi. PT MRT Jakarta (Perseroda).
https://jakartamrt.co.id/sites/default/files/2021-05/AR%
20MRT%20Jakarta%202020 Lowres compressed.pdf.
LPEM-FEB UI Working Paper 062, July 2021Gedung LPEM FEB UI Jl. Salemba Raya No. 4, Jakarta 10430 Phone : +62-21 3143177 ext. 621/623; Fax : +62-21 3907235/31934310 Web : http://www.lpem.org/category/publikasi/workingppers/
You can also read