Niche models at inter and intraspecific levels reveal hierarchical niche differentiation in midwife toads - Nature
←
→
Page content transcription
If your browser does not render page correctly, please read the page content below
www.nature.com/scientificreports
OPEN Niche models at inter‑
and intraspecific levels reveal
hierarchical niche differentiation
in midwife toads
1*
Eduardo José Rodríguez‑Rodríguez , Juan F. Beltrán 1, Miguel Tejedo 2,
Alfredo G. Nicieza 3,4, Diego Llusia 5,6
, Rafael Márquez 7 & Pedro Aragón 8
Variation and population structure play key roles in the speciation process, but adaptive intraspecific
genetic variation is commonly ignored when forecasting species niches. Amphibians serve as
excellent models for testing how climate and local adaptations shape species distributions due to
physiological and dispersal constraints and long generational times. In this study, we analysed the
climatic factors driving the evolution of the genus Alytes at inter- and intraspecific levels that may
limit realized niches. We tested for both differences among the five recognized species and among
intraspecific clades for three of the species (Alytes obstetricans, A. cisternasii, and A. dickhilleni). We
employed ecological niche models with an ordination approach to perform niche overlap analyses
and test hypotheses of niche conservatism or divergence. Our results showed strong differences in
the environmental variables affecting species climatic requirements. At the interspecific level, tests
of equivalence and similarity revealed that sister species were non-identical in their environmental
niches, although they neither were entirely dissimilar. This pattern was also consistent at the
intraspecific level, with the exception of A. cisternasii, whose clades appeared to have experienced a
lower degree of niche divergence than clades of the other species. In conclusion, our results support
that Alytes toads, examined at both the intra- and interspecific levels, tend to occupy similar, if not
identical, climatic environments.
Climatic factors may act as ecological barriers that can determine the distribution of animal and plant s pecies1.
This may explain why incipient speciation processes often can be inferred from the analysis of patterns of niche
divergence2. Genetic variation, species spatial structure resulting from landscape barriers to gene flow, and
intraspecific evolutionary processes (e.g., local adaptation) are the major drivers of speciation. Therefore, it is not
surprising that genetic studies combined with ecological niche models have been proven to be powerful tools to
study evolutionary processes and resolve biodiversity conservation p roblems3. In addition, the characterization
of environmental niches is essential to understanding species distributions and patterns of biological diversity.
Correlative ecological niche m odelling33 is a common tool used to approach this c haracterization3. However, is
the species level the most adequate level for this approach? Smith et al.4 suggest that we must consider local adap-
tations as evolutionary factors affecting niche requirements, and therefore, inclusion of evolutionary relationships
below and above the species level should be considered. For this reason, it is informative to compare niche modes
across taxa in a separate way, considering species and local genetic lineages. Amongst vertebrates, amphibians
are ideal organisms to analyse this question because their physiology is highly constrained by environmental
1
Departamento de Zoología, Facultad de Biología, Universidad de Sevilla, Sevilla, Spain. 2Departamento de
Ecología Evolutiva, Estación Biológica de Doñana, CSIC, Sevilla, Spain. 3Departamento de Biología de Organismos
Y Sistemas, Universidad de Oviedo, Oviedo, Spain. 4Unidad Mixta de Investigación en Biodiversidad (UO-CSIC-PA),
Mieres, Spain. 5Departamento de Ecología, Facultad de Ciencias. Terrestrial Ecology Group, Universidad
Autónoma de Madrid, Madrid, Spain. 6Centro de Investigación en Biodiversidad Y Cambio Global (CIBC‑UAM),
Universidad Autónoma de Madrid, Madrid, Spain. 7Fonoteca Zoológica, Departamento de Biodiversidad Y Biología
Evolutiva, Museo Nacional de Ciencias Naturales, CSIC, Madrid, Spain. 8Departamento de Biodiversidad, Ecología
Y Evolución, Universidad Complutense de Madrid, Madrid, Spain. *email: edurodrodbio@gmail.com
Scientific Reports | (2020) 10:10942 | https://doi.org/10.1038/s41598-020-67992-6 1
Vol.:(0123456789)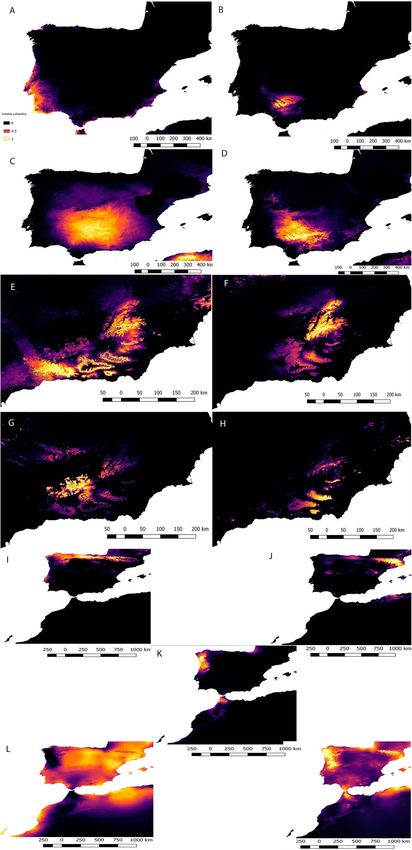
www.nature.com/scientificreports/
factors5,55, and they have low dispersal abilities. This combination of characteristics is expected to promote the
evolution of local adaptations to match the spatial complexity of environmental v ariation7.
It is well known that vicariant events can drive divergence by limiting genetic exchange among evolution-
ary units8, but currently, there is evidence that environmental factors can also play a key role in biological
diversification9–11. Although habitat suitability models and niche similarity comparisons have been previously
conducted at interspecific and intraspecific levels for the midwife toads (Alytes sp.), these models have been
implemented only in A. obstetricans9. However, other Mediterranean species, such as A. cisternasii and A. dick-
hilleni, have not been studied using nested models (inter- and intraspecific climatic niche divergence schemes)
despite the fact that their genetic and phylogenetic discontinuities are well d ocumented12,13. Furthermore, an
interspecific perspective of climatic niches for all the species in the genus is crucial for a better understanding
of climatic determinants and the differentiation processes involved.
Recent studies on niche modelling have shown that environmental conditions can drive evolution across
geographical ranges and affect patterns of genetic structure14,9,15. Moreover, genetic isolation and local adapta-
tion can synergistically influence the fate of species16, and biogeographic and vicariant events can drive species
differentiation (see Martínez-Solano et al.17). However, the environmental factors involved in the maintenance
of the current differenciation of species and evolutionary units have not been tested as a whole. Tectonic fac-
tors, with the formation of a mountain range in the Gibraltar Strait during the Upper Tortonian stage, played
an important role in the speciation of the genus Alytes 18,17. In fact, the geographic isolation of A. muletensis and
A. maurus might have strongly affected their environmental niches. Finally, recent work suggests that a more
complex geological scenario might have affected the evolutionary history of Alytes in its southern range, with a
Pliocene volcanic archipelago between Cabo de Gata and the eastern Rif coast19.
The major aims of this study were (1) to characterize the realized niche differences and environmental fac-
tors that promote the differentiation and the observed distribution of Alytes species, and (2) to investigate the
importance of niche evolution by testing the hypotheses niche conservatism, as the maintenance of ancestral
requirements among species with a common ancestor20, and niche divergence, as the appearance of divergences
among these s pecies2. Additionally, we tested whether the observed patterns of niche environmental evolution
were consistent at two phylogenetic scales: interspecific and intraspecific (i.e., genetic lineages from Dias et al.12;
Gonçalves et al.13; and Maia-Carvalho et al.9). We assumed the existence of differentiation at both inter- and
intraspecific levels as a consequence of climatic niche differentiation. In this scheme, intra- and interspecific
differentiation may be influenced by climate and geographic barriers throughout genetic variation and structure.
Finally, We also aimed to determine whether the processes of niche and phylogenetic evolution were parallel by
predicting whether subclades would show a phylogenetic signal.
Methods
Organism presence records and environmental data. The genus Alytes Wagler 1829 currently con-
tains five living species. Alytes obstetricans (Laurenti, 1768) has the broadest geographical range of all the species
in this group. Alytes cisternasii Boscá 1879 is endemic to the south-western region of the Iberian Peninsula.
Alytes muletensis (Sanchiz & Adrover 1979) has a narrower distributional range and is endemic to the northern
part of Mallorca Island. Alytes (Baleaphryne) dickhilleni Arntzen & García-París 1995 is endemic to the Betic
Region on the south-eastern Iberian Peninsula. Finally, Alytes maurus Pasteur & Bons 1962, is a species dis-
tributed in some regions of the Rif and Middle Atlas of Morocco. Additionally, four recognized subspecies of
A. obstetricans have been described: A. o. almogavarii Arntzen & García-París, 1995, from southern France to
the Ebro River; A. o. obstetricans (Laurenti 1768), from Western Europe to north of the Iberian Peninsula; A. o.
boscai Lataste 1879, in central and northern Portugal; and finally A. o. pertinax García-París & Martínez-Solano,
2001, on the eastern Iberian Peninsula.
The habitats of these five species show a large degree of differentiation. A. obstetricans requires areas with high
amounts of precipitation and occupy a wide range of habitats, from mountain ranges to crops21. A. muletensis is
only known in a few localities on northern Mallorca I sland22, whereas A. maurus is restricted to a few localities
in the Rif and Middle Atlas Mountains of Morocco and typically occupies humid sites in karst and steep areas23.
Regarding the two Iberian endemics, A. dickhilleni is restricted to the Betic region in southeastern S pain24. A.
cisternasii occupies the central-south-western sector of the Iberian Peninsula, usually between 0 and 700 m25,
and, in comparison to the other species of this genus, it is associated with a hotter and drier c limate26.
We used 676 localities to build ecological niche models. A total of 319 A. dickhilleni presence points were
surveyed by the authors within all their Andalusian distribution areas. We identified 170 local population loca-
tions of A. cisternasii (including our own collection data and data from Amphibiaweb27), 162 of A. obstetricans
(our data, Amphibiaweb, and in addition, revised data from www.observation.org), 14 of A. maurus (our data,
Amphibiaweb and Donaire et al.23), and 11 of A. muletensis (our data and Amphibiaweb). All populations were
separated by at least 200 m. Figure 1 shows the distribution of points selected for all five species.
To establish intraspecific comparisons among A. cisternasii, A. dickhilleni and A. obstetricans, we used pres-
ence data for the genetic lineages reported for these species. Presence data were assigned to lineages according
to Gonçalves et al. (A. cisternasii)13, Dias et al. (A. dickhilleni)12, and Maia-Carvalho et al. (A. obstetricans)9 (the
central-eastern lineage of A. obstetricans was excluded because of the low number of presence points). Some
local populations could not be assigned to any of the reported lineages, as these locations are in contact zones
our outside the areas surveyed in the cited studies, and therefore, these were removed from the data set. We
excluded 42 locations of A. dickhilleni and 6 of A. cisternasii. For the geographically restricted A. muletensis and
A. maurus, the low number of records and lack of adequate genetic lineage information precluded intraspecific
analysis. Even in a well-designed data survey across all of the range of a species, model outputs are sensitive to
sampling bias28. To reduce this bias, we used a sub-sample representing 25% of the populations of each species
Scientific Reports | (2020) 10:10942 | https://doi.org/10.1038/s41598-020-67992-6 2
Vol:.(1234567890)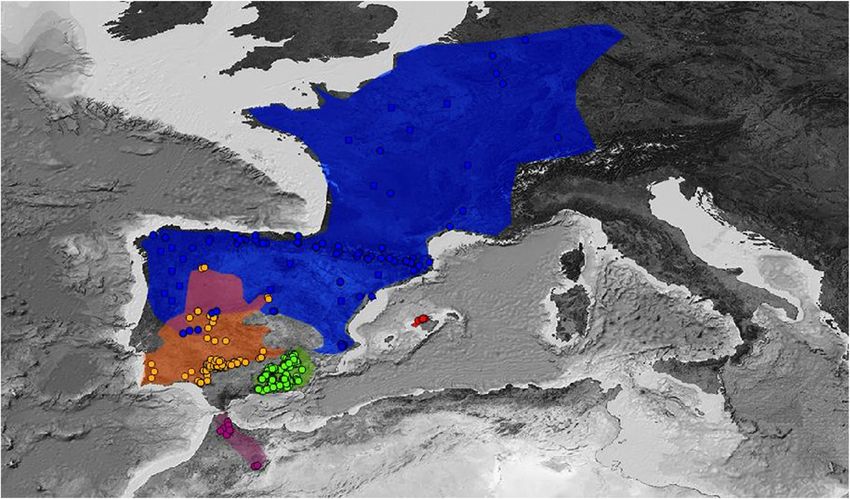
www.nature.com/scientificreports/
Figure 1. Records of presence included in this study. We considered populations in all the distribution
areas, and we only selected populations separated by at least 200 m. A: Alytes dickhilleni, B: Alytes cisternasii,
C: Alytes maurus, D: Alytes obstetricans, and E: Alytes muletensis. Figure created with QGIS Chugiak 2.4.0
(QGIS Development Team. 2018. QGIS Geographic Information System. Open Source Geospatial Foundation
Project. https://qgis.osgeo.org). Background map modified from GEBCO Compilation Group (2019) GEBCO
2019 Grid (https://doi.org/10.5285/836f016a-33be-6ddc-e053-6c86abc0788e).
and lineages included in the study (random selection by MaxEnt). In addition, intraspecific figures show the
presence points that were selected for each lineage and then used in the intraspecific correlative model.
We considered climatic and topographic factors to explain the realized distributions and niches of the five
Alytes species. Climatic variables were obtained from WorldClim version 2 database at 30 s 29, and topographic
data were obtained from SRTM (https://www2.jpl.nasa.gov/srtm/dataprelimdescriptions.html). The study area
was fixed to the distribution limits of the Alytes sp. Genus, and in order to avoid a high correlation and redun-
dancy among the predictors, we performed pairwise Pearson correlations, and for r > 0.6, the variable with
lower biological relevance was excluded. The final data set included five climatic variables: mean diurnal range,
isothermality, minimum temperature of the coldest month, mean temperature of the driest quarter, and pre-
cipitation of the wettest month.
Niche model analyses. We performed two different modelling approaches: ecological niche models
(ENMs) and an ordination t echnique30. First, of the different ENMs types, we selected the widely used machine
learning method MaxEnt (version 3.4.1) to build the SDMs 31. The model was fitted using hinge, product, linear,
and quadratic features with a maximum of 10,000 background points, 1,000 replicates, and clamping. Models
were fitted by using the area under the ROC curve (AUC and ROC represents “receiver operating characteris-
tic”31). We used the Cloglog output format. Although this measure has been extensively used to fit models, its
usefulness has been criticized, especially for presence/background models such as MaxEnt. Thus, in addition to
AUC, we present the values of its components, sensitivity and/or s pecificity32. To obtain these two indices, the
continuous MaxEnt output was transformed into a categorical variable (predicted presence/absence). For this
transformation, we applied the threshold of the minimum training presence (the lowest suitability scores associ-
ated with the populations of each lineage/species) given in the MaxEnt output sheet. We calculated the specificity
from the confusion m atrix33. This is a conservative and realistic threshold since it may include even small suit-
ability scores whenever the lineages/species are present34. In this case, a calculation of sensitivity was not neces-
sary since the applied threshold was fixed at the maximum. In addition, we have followed the Raes and Ter Steege
validation method57, including 95% I.C AUC values of null models created with random points of the same
size of the presences included in our models. ENM AUC values that are higher than their corresponding 95%
CI AUC value of the fitted null model, significantly deviate from what would be expected by chance (p < 0.05).
The ordination technique approach was applied to perform niche overlap analyses, either between pairs of the
five species or between pairs of the lineages within A. cisternasii, A. dickhilleni and A. obstetricans. We used the
tool Ecospat, which incorporates null hypotheses35. For these analyses, we performed the following tests: niche
equivalency tests (are niches identical?), similarity tests (are niches more similar than expected by chance?),
and niche principal component analysis (PCA). As a measurement of the realized niche overlap, we calculated a
Schoener’s D index through the niche-PCA. This index ranges from 0 to 1 to reflect no overlap to total overlap,
respectively 36. For both the niche equivalency and similarity tests, we used the argument = ”greater” (overlap
greater than expected by chance) to test the conservatism hypothesis and the argument = ”lower” (overlap lower
than expected by chance) to test the divergence hypothesis35. We performed 1,000 permutations for each analysis.
Additionally, we integrated phylogenies (inter- and intraspecific levels) using the age-range correlation function
Scientific Reports | (2020) 10:10942 | https://doi.org/10.1038/s41598-020-67992-6 3
Vol.:(0123456789)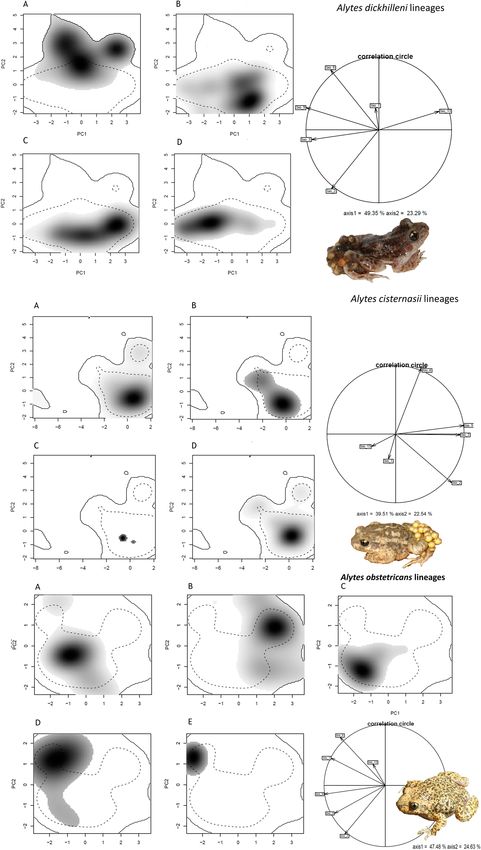
www.nature.com/scientificreports/
Figure 2. Potential distributions of predicted suitability by Maxent models for Alytes obstetricans (A), Alytes
cisternasii (B), Alytes dickhilleni (C), Alytes muletensis (D) and Alytes maurus (E). The colour bar is the scale
of habitat suitability. Maps created using MaxEnt 3.4.131 and improved with Qgis Chugiak 2.4.0 (QGIS
Development Team. 2018. QGIS Geographic Information System. Open Source Geospatial Foundation
Project. https://qgis.osgeo.org).
A. A.
A. dickhilleni A. dickhilleni A. dickhilleni A. dickhilleni A. cisternasii A. cisternasii A. cisternasii obstetricasn A. obstetrcans muletensis
versus A. versus A. versus A. versus A. versus A. versus A. versus A. versus A. versus A. versus A.
cisternasii obstetricans muletensis maurus obstetricans muletensis maurus muletensis maurus maurus
Schoener’s D 0.061 0.106 0 0.013 0.052 0.001 0.018 0.003 0.283 0.014
Equivalency p
1/0.009* 1/0.009* 1/0.009* 1/0.009* 1/0.009* 1/0.009* 1/0.009* 1/0.009* 1/0.217 1/0.010*
values (C/D)
Similarity p
0.48/0.57 0.52/0.46 1/0.54 0.77/0.2 0.544/0.34 0.26/0.66 0.643/0.31 0.18/0.81 0.69/0.79 0.23/0.81
values (C/D)
Table 1. Schoener’s D and p values of the five species of Alytes (similarity and equivalence tests p values for
niche conservatism (C) and divergence (D) hypotheses). *Significant p values (boldface).
of the Phyloclim p ackage38. This function is used to test for phylogenetic signals in patterns of niche overlap.
Slopes and intercepts derived from a linear model can be used to characterize speciation mode (allopatric versus
sympatric) or niche evolution (conservatism versus flexibility) in the c lade39.
Regarding the choice of the geographical extent (and as a consequence, environmental background), we
used the software Q GIS40 to compile and process environmental data using the extension point sampling t ool41.
Analyses were conducted using R 42. The study area for the interspecific analysis with MaxEnt and ECOSPAT was
adapted to the total distribution of the genus to allow comparisons. At the intraspecific level, we used the same
area in each cluster of lineages (the species ranges).
Results
At the interspecific level, the Maxent outputs are shown in Fig. 2. The variables with a relatively higher percent-
age of contribution in the Maxent models were isothermality (62.5%; A. obstetricans), mean temperature of the
driest quarter (56.3%; A. cisternasii), mean temperature of the driest quarter (40.2%; A. dickhilleni), precipitation
of the wettest month (90.4%; A. muletensis) and, finally, precipitation of the wettest month (73.8%; A. maurus).
The AUC, 95% I.C. AUC of null model and specificity values were 0.90 ± 0.03, 0.86 and 0.65 (A. obstetricans);
0.92 ± 0.10, 0.84 and 0.40 (A. cisternasii); 0.94 ± 0.02, 0.90 and 0.67 (A. dickhilleni), 0.88 ± 0.16, 0.78 and 0.83 (A.
muletensis), and 0.98 ± 11, 0.92 and 0.95 (A. maurus), respectively. The results of the niche overlap (Schoener’s D)
and similarity and equivalency analyses are shown in Table 1. We found minimal niche overlap with significant
p values for the equivalency test in the divergence hypothesis, except for the overlap between A. obstetricans and
A. maurus. The magnitude and sign of the variables in the principal component plots of the niche are shown
in Fig. 3.
Maxent outputs for intraspecific A. cisternasii, A. dickhilleni and A. obstetricans indicate differences in cli-
matic suitability among lineages. The model outputs are shown in Fig. 4, and the ENM AUC, 95% I.C. AUC of
Scientific Reports | (2020) 10:10942 | https://doi.org/10.1038/s41598-020-67992-6 4
Vol:.(1234567890)www.nature.com/scientificreports/
Figure 3. Niches of the five Alytes species in the environmental space of the European study area represented
along the first principal components (PC) from Ecospat. (a) A. dickhilleni, (b) A. cisternasii, (c) A. obstetricans,
(d) A. muletensis and (e) A. maurus. (f) The contribution of the environmental variables to the two axes of the
PC analysis and the percentage of variation explained by the two axes. Variables: annual mean temperature
[Bio_1], mean diurnal range [Bio_2], isothermality [Bio_3], minimum temperature of the coldest month
[Bio_6], mean temperature of the driest quarter [Bio_9], and precipitation of the wettest month [Bio_13].
fitted null models and specificity values are shown in Supplementary material 1. The variables with relatively
higher contributions in each lineage of A. cisternasii were minimum temperature of the coldest month (66.2%)
and isothermality (29.7%) for the western lineage, mean diurnal range (47.7%) and precipitation of the wettest
month (24.1%) for the southern lineage, mean temperature of the driest quarter (52.3%), isothermality (24.3%)
and mean diurnal range (23.4%) for the eastern lineage, and temperature of the driest quarter (45.9%) and mean
diurnal range (31.5%) for the northern lineage. For A. dickhilleni, the most relevant variables were the mean
temperature of the driest quarter (37.8%), precipitation of the wettest month (30%) and isothermality (26.3%)
for the southern lineage; annual mean temperature (72.5%) for the northern lineage; precipitation of the wettest
month (33.7%), annual mean temperature (29.9%) and isothermality (22.8%) for the western lineage; and annual
mean temperature (50.1%) and temperature of the driest quarter (36.6%) for the eastern lineage. Finally, for A.
obstetricans, the most relevant variables were precipitation of wettest month (90.9%) for the central-western
lineage; precipitation of wettest month (36.9%) and annual mean temperature (24%) for the north-eastern
lineage, precipitation of wettest month (60.5%) and annual mean temperature (26.7%) for the north-western
lineage, mean diurnal range (63.9%) for the south-eastern lineage, and precipitation of wettest month for the
south-western lineage.
The results of niche overlap (Schoener’s D) and similarity and equivalency analyses showed low to medium
values depending on the pair of lineages compared and the species (see Table 2 for A. dickhilleni and A. cisternasii
and Table 3 for A. obstetricans). The south-western lineage of A. dickhilleni has lower overlap values than those
of the other lineages, and in the equivalency test, we obtained significant results for the divergence hypothesis
compared with the niches of the other two lineages (equivalency test, divergence hypothesis, Table 2). There
were no significant divergences or convergences between the niches of A. cisternasii lineages (Table 2). For A.
obstetricans, we found significant values in the equivalency test between most lineage comparisons, but we also
obtained several significant results for the niche conservatism hypothesis (Table 3). The magnitude and sign of
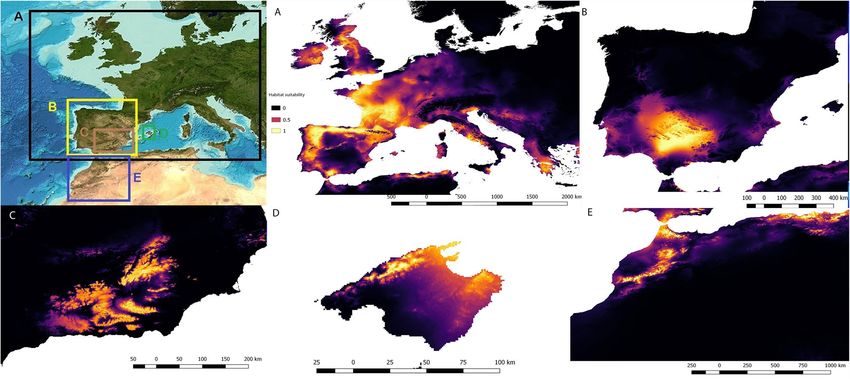
variables in the principal component plots of the niche are provided in Fig. 5. We did not obtain any significance
in the age-range correlation test, both at inter- and intraspecific levels (see Supplementary material 2, p values of
0.60 [interspecific], 0.28 [A. cisternasii], 0.98 [A. obstetricans], and 0.64 [A. dickhilleni]). In Supplementary mate-
rial 2 we also provide cluster dendrograms based on niche overlap for both, intraspecific and interspecific levels.
Scientific Reports | (2020) 10:10942 | https://doi.org/10.1038/s41598-020-67992-6 5
Vol.:(0123456789)www.nature.com/scientificreports/
Figure 4. Intraspecific Maxent models of Iberian endemics. A. cisternasii. A: Western lineage, B: southern
lineage, C: eastern lineage, D: and northern lineage; A. dickhilleni. E: Southern lineage, F: northern lineage,
G: western lineage, and H: eastern lineage; A. obstetricans. I: North-western lineage, J: north-eastern lineage,
K: central-western lineage, L: south-western lineage, and M: south-eastern lineage. The colour bar is the
scale of habitat suitability. Maps created using MaxEnt 3.4.131 and improved with Qgis Chugiak 2.4.0 (QGIS
Development Team. 2018. QGIS Geographic Information System. Open Source Geospatial Foundation
Project. https://qgis.osgeo.org).
Scientific Reports | (2020) 10:10942 | https://doi.org/10.1038/s41598-020-67992-6 6
Vol:.(1234567890)www.nature.com/scientificreports/
Eastern lineage
Southern lineage Southern lineage Southern Lineage Northern Vs Eastern Northern lineage versus Western
A.dickhilleni versus Eastern lineage versus Nortern lineage versus Western lineage lineage versus Western lineage lineage
Schoener’s D 0.087 0.032 0.049 0.461 0.342 0.197
Equivalency p value
1/0.0099* 1/0.0099* 1/0.0099* 1/0.092 1/0.099 1/0.098
(C/D)
Similarity p value (C/D) 0.722/0.248 0.811/0.214 0.643/0.294 0.168/0.859 0.138/0.815 0.366/0.849
Southern lineage versus Southern lineage versus Southern lineage versus Eastern lineage versus Eastern lineage versus Western lineage versus
A. cisternasii
eastern lineage Western lineage Northern lineage Western lineage Northern lineage Northern lineage
Schoener’s D 0.255 0.010 0.481 0.015 0.279 0.016
Equivalency p value
0.818/0.363 1/0.091 1/0.091 1/0.090 0.727/0.363 1/0.090
(C/D)
Similarity p value (C/D) 0.306/0.683 0.257/0.683 0.267/0.772 0.158/0.881 0.416/0.683 0.257/0.772
Table 2. Schoener’s D and p values (similarity and specificity for niche conservatism (C) and niche divergence
(D) hypothesses of intraspecific lineages for A. dickhilleni and A. cisternasii. *Significant p values (boldface).
Alytes obstetricans Schoener’s D Equivalency p value (C/D) Similarity p value(C/D)
North-western versus North-eastern 0.051 1/0.009* 0.665/0.366
North-western versus South-eastern 0.436 1/0.138 0.043*/0.971
North-western versus South-western 0.240 0.831/0.099 0.333/0.633
North-western versus Central-western 0.009 1/0.009* 0.406/0.594
North-eastern versus South- eastern 0.026 1/0.009* 0.673/0.336
North-eastern versus South-western 0.022 1/0.009* 0.643/0.287
North-eastern versus Central-western 0.000 1/0.009* 1/0.386
South-eastern versus South-western 0.165 0.029*/0.0398* 0.415/0.613
South-eastern versus Central-western 0.038 0.009*/0.009* 0.564/0.673
South-western versus Central-eastern 0.194 0.881/0.128 0.137/0.920
Table 3. Schoener’s D and p values (similarity and specificity for niche conservatism (C) and niche divergence
(D) hypotheses of intraspecific lineages for A. obstetricans. *Significant p values (boldface).
Discussion
Our results showed a clear spatial niche segregation when we examined interspecific niche variation in Alytes
toads. On the Iberian Peninsula, the distribution outputs of the MaxEnt models fit neatly in some places,
although they exhibited a slight overlap in certain areas that coincides with the present sympatric distributional
area between A. cisternasii and A. obstetricans. The pattern derived from niche similarity and equivalence tests
revealed that each Alytes species occupies a non-identical environmental niche since no significant p values were
found for the hypothesis of complete niche overlap (equivalence test), but instead, highly significant distinctions
occurred for the divergence hypothesis (equivalence test) for any pair-species comparisons with the exception
of the A. obstetricans versus A. maurus contrast. This suggests an evolutionary scenario where niches are less
equivalent (identical) than expected by chance in relation to different non-exclusive processes, including local
adaptation. In addition, we did not find significant results in the similarity test (conservatism hypothesis), reject-
ing the hypothesis of retained similarity. We also did not find significance in the case of the divergence hypothesis
for the similarity test, indicating no greater than expected divergence. However, rejecting the retained similarity,
determining that the divergence was not greater than expected was already relatively divergent. A. cisternasii
has been described as the most phylogenetically distant group within the genus Alytes17. This is compatible
with an evolutionary scenario where the complex formed by A. obstetricans, A. maurus, A. muletensis, and A.
dickhilleni share a more recent natural history and, consequently, they could also share similar environmental/
climatic requirements to a high degree. However, our results did not support this prediction, thus suggesting
that the niches of these species evolved in a complex scenario, creating a wide diversity of adaptations. A. maurus
and A. obstericans presented the widest climatic range (see Fig. 2). In comparison to the other species (with the
exception of A. maurus), A. obstetricans inhabits colder areas with higher precipitation. A. cisternasii occupies
warmer areas with relatively high precipitation (at least in the wettest period); A. maurus faces a wider range of
temperatures and a high rainfall amount but with the widest variable range. It is important to remark that our
models shows two separate areas in the ecological niche models (Ecospat) of A.maurus, this being possibly this
an artefact due to the lack of knowledge about the distribution or alternatively the isolation of the two extant
populations56. In turn, in comparison to A. cisternasii and A. muletensis, A. dickhilleni is present in colder and
drier areas. Finally, A. muletensis occupies warm and dry areas, although the distribution of this species was
much wider in the p ast44; in addition, the current distribution may be restricted to highly isolated populations
due to non-climatic factors such as intense predation pressure by the introduced water snake Natrix maura43.
This scenario may bias the output of our correlative model, which relies on distributional and climatic factors. A
Scientific Reports | (2020) 10:10942 | https://doi.org/10.1038/s41598-020-67992-6 7
Vol.:(0123456789)www.nature.com/scientificreports/
Figure 5. Niches of the phylogenetic lineages of Alytes dickhilleni and Alytes cisternasii in the environmental space of the
Iberian Peninsula and represented along the first principal components axis (PC) from Ecospat under present and climatic
change scenarios. For A. dickhilleni: (a) southern, (b) northern, (c) eastern, and (d) western lineages. For A. cisternasii: (a)
southern, (b) eastern, (c) western, and (d) northern lineages. The contributions of the climatic variables to the two axes of
the PC analysis and the percentage of the variation explained by the two axes are also provided. Variables: annual mean
temperature [Bio_1], mean diurnal range [Bio_2], isothermality [Bio_3], minimum temperature of the coldest month
[Bio_6], mean temperature of the driest quarter [Bio_9], and precipitation of the wettest month [Bio_13]. A. dickhilleni and A.
cisternasii images from the authors and A. obstetricans images courtesy of Rafael Carmona González.
Scientific Reports | (2020) 10:10942 | https://doi.org/10.1038/s41598-020-67992-6 8
Vol:.(1234567890)www.nature.com/scientificreports/
process to determine the robustness of our approach could be to implement mechanistic physiologically based
models and to examine the congruence of both a pproaches55.
When examining the degree of environmental niche evolution at the intraspecific level, we found contrasting
patterns across and within species. The four clades of A. cisternasii tended to exhibit slight niche differentiation
differences between the four genetically distinct clades, although correlative models showed different predicted
distributions of the four lineages, with the western lineage being the most different, as it is associated with more
humid conditions, than those the three other lineages that form a complex with reduced niche differentiation, in
agreement with the phylogenetic tree proposed by Gonçalves et al.13. However, a contrasting pattern was found
in A. dickhilleni, whose southern lineage exhibited significant non-equivalence with respect to the other three
lineages, reflecting a more separated evolutionary history for this clade. Interestingly, this southern lineage dif-
ferentiation in climatic requirements, characterized by a reduced diurnal range and mild winters (temperature
of the coldest month) whereas the other three lineages exhibited differentiation in their climatic niches, fits well
with the observed pattern of genetic divergence, by which the southern clade formed a sister group to a complex
containing the other three lineages12. Finally, clades of the widespread Alytes obstetricans exhibited the highest
diversity in the pattern of climatic niche evolution with high niche conservatism. The two southernmost lineages
between the north-western and south-eastern lineages (in the similarity test) suggest a diminished importance
of niche divergence for the intraspecific lineages described for this species. In addition, we did not find support
for the existence of phylogenetic signals in the age-range correlation tests (both at interspecific and intraspecific
levels). This allowed us to consider the flexibility in the niche evolution hypothesis as opposed to niche con-
servatism reported for other groups36.
Climatic conditions are important factors influencing both the inter- and intraspecific evolution of Alytes and
consequently its ecological niche segregation. The evolutionary history of this genus seems to be the result of a
combination of vicariant factors influenced by both landscape and geographic f actors17. Our results for Alytes
reinforce the idea that intraspecific variability can be one of the major drivers of b iodiversity46. Our results also
match the conclusions of Maia-Carvalho et al. about the ongoing processes of differentiation in A. obstetricans
9
but provide a more general, wider view of the generation of diversity. Thus, vicariant and geographic barriers
explain the current patterns (inter- and intraspecific) of diversification; environmental and geographical factors
can act synergistically to drive differentiation at multiple scales. The intraspecific differences may be explained by
the most commonly accepted evolutionary alternatives: (A) niche conservatism that may be the consequences of
natural selection47. We observed a lower intraspecific niche divergence in A. cisternasii than in A. dickhilleni and,
at the same time, a higher phylogenetic influence (p value lower). This may possibly be induced by its specialized
thermophilic physiology that may constrain uplift dispersion to mountain r anges48 (Rodríguez-Rodríguez et al.
unpublished data). B) Other selective sources affect relatively lower dispersal ability due to ecomorphological
constraints. A. cisternasii is the shortest-limbed species in group 25, and indirectly, this may be associated with
a lower dispersal ability than that of the other Alytes species49,50.
Regarding the phylogenetic analysis results, we conclude that no phylogenetic signal was detected at either
interspecific or intraspecific levels. This fact is congruent with the conclusions the remaining tests that supported
the rejection of retained niche similarity (conservatism), suggesting a nom parallelism of phylogenetic inertia
and niche evolution.
Our results support a model of hierarchical niche differentiation in midwife toads. This model helps to under-
stand the evolution of this primitive genus of amphibians, but most importantly, this approach has widespread
application in conservation biology. First, it demonstrates the need for a modelling strategy based on targets
below the species level. Second, it shows that the identification of a relatively reduced series of bioclimatic vari-
ables can enable the identification of the most sensitive taxa or lineages52. This emphasizes the importance of
evolutionary distinctiveness53 and the need to connect species range projections with the concept of evolutionar-
ily significant units ( ESUs54) to prioritize conservation efforts.
Data availability
The datasets generated during and/or analysed during the current study are available from the corresponding
author upon reasonable request.
Received: 31 October 2019; Accepted: 15 June 2020
References
1. Janzen, D. H. Why mountain passes are higher in the tropics. Am. Nat. 101(919), 233–249 (1967).
2. Ackerly, D. D., Schwilk, D. W. & Webb, C. O. Niche evolution and adaptive radiation: Testing the order of trait divergence. Ecology
87(7), S50–S61 (2006).
3. Razgour, O. et al. Considering adaptive genetic variation in climate change vulnerability assessment reduces species range loss
projections. Proc. Natl. Acad. Sci. 116(21), 10418–10423 (2019).
4. Smith, A. B., Godsoe, W., Rodríguez-Sánchez, F., Hsiao-Hsuan, W. & Warren, D. Niche estimation above and below the species
level. Trends Ecol. Evol. https://doi.org/10.1016/j.tree.2018.10.012 (2018).
5. Bovo, R. P., Navas, C. A., Tejedo, M., Valença, S. E. & Gouveia, S. F. Ecophysiology of amphibians: Information for best mechanistic
models. Diversity 10(4), 118 (2018).
6. Cushman, S. A. Effects of habitat loss and fragmentation on amphibians: A review and prospectus. Biol. Cons. 128(2), 231–240
(2006).
7. Sänem, K. R., Laurila, A. & Merilä, J. Geographic variation in acid stress tolerance of the moor frog Rana arvalis. I. Local adapta-
tion. Evolution 57(2), 352–362 (2003).
8. Hewitt, G. M. Genetic consequences of climatic oscillations in the quaternary. Philos. Trans. R. Soc. Lond. B Biol. Sci. 359, 183–195
(2004).
Scientific Reports | (2020) 10:10942 | https://doi.org/10.1038/s41598-020-67992-6 9
Vol.:(0123456789)www.nature.com/scientificreports/
9. Maia-Carvalho, B. et al. The roles of allopatric fragmentation and niche divergence in intraspecific lineage diversification in the
common midwife toad (Alytes obstetricans). J. Biogeogr. 45(9), 2146–2158 (2018).
10. Alberdi, A. et al. Contrasting population-level responses to Pleistocene climatic oscillations in an alpine bat revealed by complete
mitochondrial genomes and evolutionary history inference. J. Biogeogr. 42(9), 1689–1700 (2015).
11. Tocchio, L. J., Gurgel-Gonçalves, R., Escobar, L. E. & Peterson, A. T. Niche similarities among white-eared opossums (Mammalia,
Didelphidae): Is ecological niche modelling relevant to setting species limits?. Zoolog. Scr. 44, 1–10 (2015).
12. Dias, G. et al. Limited gene flow and high genetic diversity in the threatened Betic midwife toad (Alytes dickhilleni): Evolutionary
and conservation implications. Conserv. Genet. 16(2), 459–476 (2015).
13. Gonçalves, H. et al. High levels of population subdivision in a morphologically conserved Mediterranean toad (Alytes cisternasii)
result from recent, multiple refugia: Evidence from mtDNA, microsatellites and nuclear genealogies. Mol. Ecol. 18, 5143–5160
(2009).
14. Antunes, B. et al. Combining phylogeography and landscape genetics to infer the evolutionary history of a short-range Mediter-
ranean relict Salamandra salamandra longirostris. Conserv. Genet. 19(6), 1411–1424 (2018).
15. Tarroso, P., Pereira, R. J., Martínez-Freiría, F., Godinho, R. & Brito, J. C. Hybridization at an ecotone: Ecological and genetic bar-
riers between three Iberian vipers. Mol. Ecol. 23, 1108–1123 (2014).
16. Lobo, A. et al. Local adaptation through genetic differentiation in highly fragmented Tilia cordata populations. Ecol. Evol. 8,
5968–5976 (2018).
17. Martínez-Solano, I., Gonçalves, H. A., Arntzen, J. W. & García-París, M. Phylogenetic relationships and biogeography of midwife
toads (Discoglossidae: Alytes). J. Biogeogr. 31, 603–618 (2004).
18. Carranza, S., Arnold, E. N., Wade, E. & Fahd, S. Phylogeography of the false smooth snakes, Macroprotodon (Serpentes, Colubri-
dae): mitochondrial DNA sequences show European populations arrived recently from Northwest Africa. Mol. Phylogenet. Evol.
33(3), 523–532 (2018).
19. Booth-Rea, G., Ranero, C. R. & Grevemeyer, I. The Alboran volcanic-arc modulated the Messinian faunal exchange and salinity
crisis. Sci. Rep. 8(1), 13015 (2018).
20. Wellenreuther, M., Larson, K. W. & Svensson, E. I. Climatic niche divergence or conservatism? Environmental niches and range
limits in ecologically similar damselflies. Ecology 93(6), 1353–1366 (2012).
21. Bosch, J. Sapo partero común -Alytes obstetricans. (eds. Salvador, A., Martínez-Solano, I.) Enciclopedia Virtual de los Vertebrados
Españoles. (Museo Nacional de Ciencias Naturales, Madrid, 2014).
22. Oliver, J.A. Ferreret – Alytes muletensis. (eds. Salvador, A., Martínez-Solano, I.) Enciclopedia Virtual de los Vertebrados Espa-
ñoles. (Museo Nacional de Ciencias Naturales, Madrid, 2014)
23. Donaire-Barroso, D., El Mouden, E. H., Slimani, T. & González de la Vega, J. P. On the meridional distribution of Alytes maurus
Pasteur and Bons, 1962 (Amphibia, Discoglossidae). Herpetol. Bull. 96, 12 (2006).
24. Salvador, A. Sapo partero bético - Alytes dickhilleni. (eds. Salvador, A., Martínez-Solano, I.) Enciclopedia Virtual de los Vertebrados
Españoles. https://www.vertebradosibericos.org/ (Museo Nacional de Ciencias Naturales, Madrid, 2015)
25. Márquez, R. Sapo partero ibérico -Alytes cisternasii. (eds. Salvador, A., Martínez-Solano, I.) Enciclopedia Virtual de los Vertebrados
Españoles. https://www.vertebradosibericos.org/ (Museo Nacional de Ciencias Naturales, Madrid, 2017).
26. Márquez, R., Crespo, E.G. Alytes cisternasii. (eds. Pleguezuelos, J. M., Márquez, R., Lizana, M.) Atlas y Libro Rojo de los Anfibios y
Reptiles de España. (Dirección General de Conservación de la Naturaleza- Asociación Herpetológica Española, Madrid, 2002).
27. Amphibiaweb.org. AmphibiaWeb. [online]. https://Amphibiaweb.org (2018).
28. Araujo, M. B. & Guisan, A. Five (or so) challenges for species distribution modelling. J. Biogeogr. 33(10), 1677–1688 (2006).
29. Fick, S., Hijmans, R. Bioclimatic variables/ WorldClim-Global Climate Data. [online] Worldclim.org. https://www.worldclim.org/
bioclim (2018)
30. Guisan, A., Petitpierre, B., Broennimann, O., Daehler, C. & Kueffer, C. Unifying niche shift studies: insights from biological inva-
sions. Trends Ecol. Evol. 29, 260–269 (2014).
31. Steven J. Phillips, Miroslav Dudík, Robert E. Schapire. [Internet] Maxent software for modeling species niches and distributions
(version 3.4.1). https://biodiversityinformatics.amnh.org/open_source/maxent/.
32. Lobo, J. M., Jiménez-Valverde, A. & Real, R. AUC: a misleading measure of the performance of predictive distribution models.
Glob. Ecol. Biogeogr. 17(2), 145–151 (2008).
33. Fielding, A. H. & Bell, J. F. A review of methods for the assessment of prediction errors in conservation presence/absence models.
Environ. Conserv. 24, 38–49 (1997).
34. Fitze, P. S. et al. Integrative analyses of speciation and divergence in Psammodromus hispanicus (Squamata: Lacertidae). BMC Evol.
Biol. 11, 347 (2011).
35. Di Cola, V. et al. Ecospat: an R package to support spatial analyses and modeling of species niches and distributions. Ecography
40(6), 774–787 (2017).
36. Warren, D. L., Glor, R. E. & Turelli, M. Environmental niche equivalency versus conservatism: quantitative approaches to niche
evolution. Evol. Int. J. Organ. Evol. 62(11), 2868–2883 (2008).
37. Dufresnes, C., & Martínez-Solano, Í. (2019). Hybrid zone genomics supports candidate species in Iberian Alytes obstetri-
cans. Amphibia-Reptilia, 1(aop), 1–8.
38. Heibl, C., Calenge, C. Integrating Phylogenetics and Climatic Niche Modeling (2018)
39. Fitzpatrick, B. M. & Turelli, M. The geography of mammalian speciation: mixed signals from phylogenies and range maps. Evolu-
tion 60, 601–615 (2006).
40. QGIS Development Team. QGIS Geographic Information System. Open Source Geospatial Foundation Project. https: //qgis.osgeo
.org (2018)
41. Jurgiel, B. Point Sampling Tool. QGIS Python Plugins Repository. https://plugins.qgis.org/plugins/pointsamplingtool/ (2018).
42. R Development Core Team. R: A language and environment for statistical computing. R Foundation for Statistical Computing,
Vienna, Austria. ISBN 3-900051-07-0. https://www.R-project.org. (2008)
43. Moore, R. D., Griffiths, R. A. & Román, A. Distribution of the Mallorcan midwife toad (Alytes muletensis) in relation to landscape
topography and introduced predators. Biol. Cons. 116(3), 327–332 (2004).
44. Alcover, J.A., Mayol, D., Jaume, D., Alomar, G., Pomar, G., Jurado, J. Biología i ecología de les poblacions relictes de Baleaphryne
muletensis a la muntaya mallorquina. (eds. Hemmer, H., Alcover, J.A.) Life History of the Mallorcan Midwife Toad. 129–152.
(Editorial Moll, 1984).
45. Aragón, P., Baselga, A. & Lobo, J. M. Global estimation of invasion risk zones for the western corn rootworm Diabrotica virgifera
virgifera: integrating distribution models and physiological thresholds to assess climatic favourability. J. Appl. Ecol. 47(5), 1026–1035
(2010).
46. Sánchez-Fernández, D., Aragón, P., Bilton, D. T. & Lobo, J. M. Assessing the congruence of thermal niche estimations derived from
distribution and physiological data. A test using diving beetles. PLoS One 7(10), 48163 (2012).
47. Violle, C. et al. The return of the variance: intraspecific variability in community ecology. Trends Ecol. Evol. 27(4), 244–252 (2012).
48. Losos, J. B. Phylogenetic niche conservatism, phylogenetic signal and the relationship between phylogenetic relatedness and
ecological similarity among species. Ecol. Lett. 11(10), 995–1003 (2008).
49. Hutter, C. R., Guayasamin, J. M. & Wiens, J. J. Explaining Andean megadiversity: the evolutionary and ecological causes of glassfrog
elevational richness patterns. Ecol. Lett. 16(9), 1135–1144 (2013).
Scientific Reports | (2020) 10:10942 | https://doi.org/10.1038/s41598-020-67992-6 10
Vol:.(1234567890)www.nature.com/scientificreports/
50. Pough, H. & Magnusson, W. E. Behavioral energetics. In Environmental Physiology of the Amphibians (eds Feder, M. E. & Warren,
W. B.) (University of Chicago Press, Chicago, 1992).
51. Phillips, B. L., Brown, G. P., Webb, J. K. & Shine, R. Invasion and the evolution of speed in toads. Nature 439(7078), 803 (2006).
52. Hof, C., Araújo, M. B., Jetz, W. & Rahbek, C. Additive threats from pathogens, climate and land-use change for global amphibian
diversity. Nature 480(7378), 516 (2011).
53. Cadotte, M. W. & Jonathan, D. T. Rarest of the rare: advances in combining evolutionary distinctiveness and scarcity to inform
conservation at biogeographical scales. Divers. Distrib. 16(3), 376–385 (2010).
54. Casacci, L. P., Barbero, F. & Balletto, E. The, “Evolutionarily Significant Unit” concept and its applicability in biological conserva-
tion. Ital. J. Zool. 81(2), 182–193 (2014).
55. Enriquez‐Urzelai, U., Kearney, M. R., Nicieza, A. G., & Tingley, R. Integrating mechanistic and correlative niche models to unravel
range‐limiting processes in a temperate amphibian. Glob. Change Biol. (2019).
56. Caeiro-Dias, G. et al. Lack of congruence of genetic and niche divergence in Podarcis hispanicus complex. J. Zool. Syst. Evol. Res.
56(4), 479–492 (2018).
57. Raes, N. & ter Steege, H. A null-model for significance testing of presence-only species distribution models. Ecography 30(5),
727–736 (2007).
Acknowledgements
Research funds provided by the following projects of Spanish Ministry of Science and Innovation: CGL 2008–
04814-C02/BOS (JFB), CGL2011-25062 (RM), CGL2017-86924-P (MT and AGN), CGL2017-88764-R (DLL)
and and CGL2014-56416-P (PA). DLL also acknowledges a post-doctoral study grant by the Comunidad de
Madrid (Atracción de Talento Investigador, 2016-T2/AMB-1722, CAM, Spain).
Author contributions
EJRR and JFBG collected and analysed the data, produced the figures, and wrote the preliminary manuscript.
MT,RM, AN, PA, DL and PA contributed with the data collection and discussed conceptual issues, revised the
text and language and contributed to the final version of the manuscript.
Competing interests
The authors declare no competing interests.
Additional information
Supplementary information is available for this paper at https://doi.org/10.1038/s41598-020-67992-6.
Correspondence and requests for materials should be addressed to E.J.R.-R.
Reprints and permissions information is available at www.nature.com/reprints.
Publisher’s note Springer Nature remains neutral with regard to jurisdictional claims in published maps and
institutional affiliations.
Open Access This article is licensed under a Creative Commons Attribution 4.0 International
License, which permits use, sharing, adaptation, distribution and reproduction in any medium or
format, as long as you give appropriate credit to the original author(s) and the source, provide a link to the
Creative Commons license, and indicate if changes were made. The images or other third party material in this
article are included in the article’s Creative Commons license, unless indicated otherwise in a credit line to the
material. If material is not included in the article’s Creative Commons license and your intended use is not
permitted by statutory regulation or exceeds the permitted use, you will need to obtain permission directly from
the copyright holder. To view a copy of this license, visit http://creativecommons.org/licenses/by/4.0/.
© The Author(s) 2020
Scientific Reports | (2020) 10:10942 | https://doi.org/10.1038/s41598-020-67992-6 11
Vol.:(0123456789)You can also read