Neural coincidence detection strategies during perception of multi-pitch musical tones
←
→
Page content transcription
If your browser does not render page correctly, please read the page content below
Neural coincidence detection strategies during perception of multi-pitch
                                                                              musical tones
                                                                                                        Rolf Bader

                                                                                          Institute of Musicology
                                                                                          University of Hamburg
                                                                                Neue Rabenstr. 13, 20354 Hamburg, Germany
arXiv:2001.06212v1 [q-bio.NC] 17 Jan 2020

                                                                                                    January 20, 2020

                                                                                                          Abstract

                                                    Multi-pitch perception is investigated in a listening test using 30 recordings of musical sounds with two tones played
                                                 simultaneously, except for two gong sounds with inharmonic overtone spectrum, judging roughness and separateness as the
                                                 ability to tell the two tones in each recording apart. 13 sounds were from a Western guitar playing all 13 intervals in one
                                                 octave, the other sounds were mainly from non-Western instruments comparing familiar with unfamiliar instrument sounds
                                                 for Western listeners. Additionally the sounds were processed in a cochlear model transferring the mechanical basilar
                                                 membrane motion into neural spikes followed by a post-processing simulating different degrees of coincidence detection.
                                                 Separateness perception showed a clear distinction between familiar and unfamiliar sounds, while roughness perception
                                                 did not. By correlating perception with simulation different perception strategies were found. Familiar sounds correlated
                                                 strongly positive with high degrees of coincidence detection, where only 3-5 periodicities were left, while unfamiliar sounds
                                                 correlated with low coincidence levels. This corresponds to an attention to pitch and timbre respectively. Additionally,
                                                 separateness perception shows an opposite correlation between perception and neural correlates between familiar and
                                                 unfamiliar sounds. This correlates with the perceptional finding of the distinction between familiar and unfamiliar sounds
                                                 with separateness.

                                            1     Lead Paragraph                                                   the sound increases, and reasoned the musical major scale
                                                                                                                   to consist of such intervals with least roughness 17 , which
                                            Brain dynamics during perception is often found to hap-                are musical fifth, fourth, third, etc. He calculated rough-
                                            pen in self-organizing neural fields rather than concen-               ness as musical beating, as amplitude modulation when
                                            trating on single brain areas or even single neurons. Ad-              two partials are close to each other with a maximum
                                            ditionally the old notion of subcortical neural structures             roughness at a partial frequency distance of 33 Hz, de-
                                            to be unconsicous is challenged especially in the auditory             creasing to zero when partials align, or when they are
                                            pathway, where pitch and timbre appear in complex neu-                 spaced wider apart. Other roughness estimation algo-
                                            ral fields, and higher cortical brain regions seem to be               rithms use similar approaches . Roughness calculations
                                            responsible for associative musical tasks like rhythm ex-              built to estimate industrial noise perception often fail to
                                            traction, musical tension or music theory. Although the                estimate musical roughness (for a review see 24 ).
                                            field notion of perception in the auditory pathway works
                                                                                                                      Another feature of musical sound perception is tonal fu-
                                            very well with single musical tones, complex musical inter-
                                                                                                                   sion 25 . A harmonic overtone spectrum consists of many
                                            vals, chords or polyphonic music will lead to more complex
                                                                                                                   partials or frequencies, still subjects perceive only one mu-
                                            behaviour due to the strong nonlinearity of the cochlear
                                                                                                                   sical pitch which is a fusion of all partials. Contrary, inhar-
                                            and neural networks. As the auditory pathway is reducing
                                                                                                                   monic overtones are clearly separated by perception where
                                            the auditory input through coincidence detection of neu-
                                                                                                                   the single frequencies can be perceived separately. In a
                                            rons, we investigate the process of coincidence detection
                                                                                                                   multi-pitch case of musical intervals or chords, trained lis-
                                            of multi-pitch sounds both in a listening test as well as by
                                                                                                                   teners can clearly distinguish the musical notes, they sep-
                                            cochlear and neural simulations.
                                                                                                                   arate them. Still some multi-pitch sounds are perceived
                                                                                                                   as so dense that separation is not trivial. Therefore a cer-
                                                                                                                   tain degree of perceptual separateness exists, which is a
                                            II     Introduction                                                    subject of this investigation.
                                            Multi-pitch sound consists of more than one musical tone,                In auditory perception pitch and timbre are clearly
                                            where each tone has a harmonic overtone spectrum con-                  distinguished, where Multidimensional Scaling Method
                                            stituting musical intervals, chords or polyphonic textures.            (MDS) listening tests showed pitch to be more salient
                                            Helmholtz suggested that in such cases the roughness of                than timbre (for a review see 6 . This salience of pitch

                                                                                                              1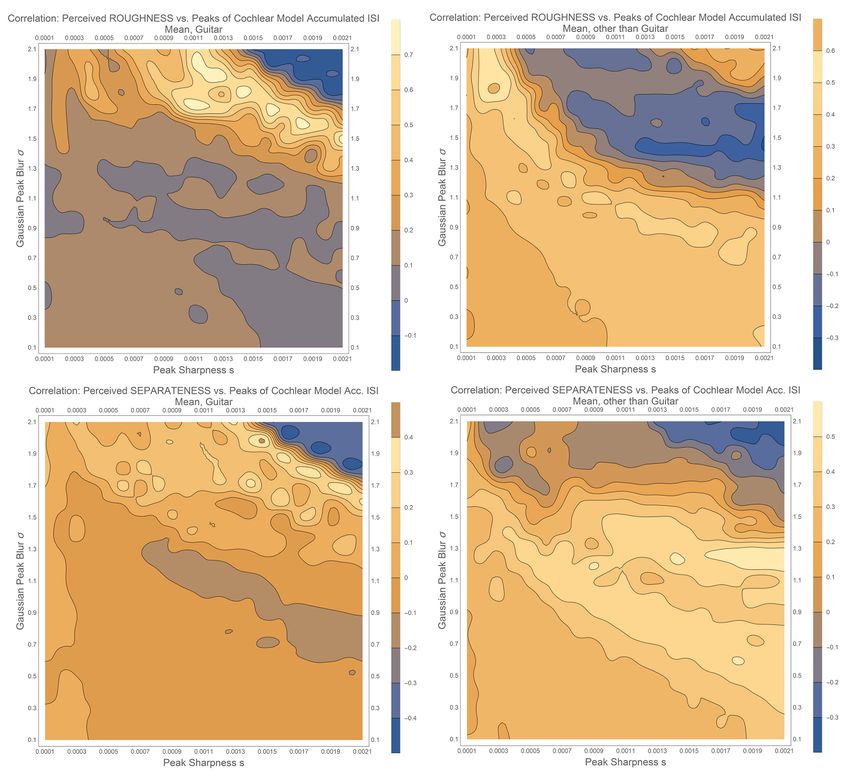
perception was interpreted as the massive presence of the            to spike bursts up to about 300 - 700 Hz, depending on
pitch periodicity as interspike-intervals (ISI) in the au-           the neural input strength 3 .
ditory pathway over all tonotopic auditory neural chan-                 Indeed the cochlear seems very effectively tuned to de-
nels in the presence of a sound with harmonic overtones              tect mechanisms and useful information on acoustic pro-
or partials (in the literature overtones are called the fre-         cesses of the outside world. Modern theories of effective
qeuencies above the fundamental frequency, alternatively             auditory coding have been proposed using a cochlea model
a sound consists of partials, where the fundamental is the           and correlating its output to a template modeling psy-
first partial) 4 . This is caused by drop-outs of spikes at          choacoustic data 11 12 . Efficient coding was found with
higher frequencies, therefore constituting subharmonics.             the cat auditory nerve compromising between ambient
All energy-transferring auditory channels constituting a             and crackling noise using gammatones 22 . Applying this
field of neighbouring neurons represent pitch much more              method to a single sound shows that very few gammatones
prominent than timbre, as the ISI of the fundamental pe-             are needed to code entire sounds 6 . Mechanisms for the fu-
riodicity is present in all such channels, while timbre peri-        sion of sound into single pitch have been proposed as au-
odicities only appear in some of them. This might explain            tocorrelations of sounds or of common pitch denominators
the salience of pitch over timbre, which allows melodies or          like residual pitch 10 14 . The cochlear is also able to follow
a musical score, mainly representing pitches possible.               acoustical bifurcations on musical instrument sounds, like
   Such a field notion of perception and cognition was also          the surface tone of a cello very precisely 2 .
suggested for Gestalt perception and the binding problem.               The present study is investigating the perception and
Haken uses the mathematical framework of a Synergetic                neural correlates ot two-tone sounds, consisting of two
computer to model brain dynamics 15 . Taking categories              musical notes plated by the same instrument at the same
as feature vectors, associated with fields of neighbouring           time. Such sounds will be perceived with a certain amount
neurons, he successfully models completion of only par-              of roughness and separateness as the ability to hear both
tially present Gestalts. Baars suggests a global workspace           tones separately at the same time. These perceived psy-
dynamics to model levels of perception and binding be-               choacoustical parameters need to correlate with neural
tween all brain regions 1 . Self-organization was found to           spike patterns in the auditory pathway. Still the percep-
be the cause of visual binding in the cat visual cortex 13 .         tion is expected to follow different strategies depending on
   Global synchronization of neurons was also found to               the familiarity of musical instrument sounds. With famil-
be the cause for expectancy 9 . Using an Electronic Dance            iar instruments for Western listeners, like e.g. with the
Music (EDM) piece, where by several continuous increases             guitar, pitch extraction might be an easier task compared
of instrumentation density climaxes are composed which               to pitch extraction of unfamiliar sounds.
are expected by listeners in this genre, a synchronization              Due to the nonlinearity of the cochlear and the auditory
of many brain areas was found to peak at the climaxes,               pathway it is not expected that the pitch theory of the
decline afterwards, and built up with the next instrumen-            fundamental periodicity appearing in all energy-holding
tation density increase 16 .                                         nerve fibers due to drop-outs and subharmonics can work
   Perception represented as spatiotemporal patterns ap-             the same with two tones as with one tone by simply adding
pearing in a spatial field of neighbouring neurons have              the behaviour of each single tone together. Rather new
been found in the olfactory, auditory, or visual cortex 8 20 .       behaviour is expected and investigated in this paper.
An amplitude modulated (AM) pattern was found, where                    We first describe the method of listening test, spike
during the large amplitude phase of AM a spatiotempo-                model and spike post-processing, simulating coincidence
ral pattern is established in a neural field, which breaks           detection. Then the results of both methods are discussed.
down at the amplitude minimum of the AM. The patterns                Finally the correlation between perception and calculation
themselves have been shown to rotate through a large-                is presented.
amplitude cycle.
   A similar finding was made in the A1 of the auditory
cortex when training gebrils in terms of raising and falling
                                                                     III     Method
pitches in a discrimination task 23 . Using different audi-
tory stimuli and several training phases, a field of neigh-
                                                                     A     Listening Test
bouring neurons shows complex patterns. These patterns               In a listening test 30 musical sounds were presented to 28
differ for immediate perception after a few hundred mil-             subjects aged 19-42 with a mean of 24.9, 15 female and
liseconds and after about 4 seconds, which were inter-               13 male. They were students at the Institute of System-
preted as discrimination and categorization respectively.            atic Musicology at the University of Hamburg, all except
   Synchronization of auditory input is happening at sev-            of 5 played Western musical instruments like guitar, pi-
eral stages in the auditory pathway already. Phase align-            ano,trumpet or drums. There was only one mention of a
ment of frequencies in a sound with a harmonic overtone              non-Western instruments, the ukulele. Only five subjects
spectrum happens already at the transition of mechani-               indicated that they were trained in musical interval identi-
cal waves on the basilar membrane (BM) to spikes 5 . Fur-            fication. All sounds presented two musical tones played on
ther synchronization is performed in the nucleus cochlearis          real instruments (no samples used), except for two gong
and the trapezoid body 18 19 . Coincidence detection neu-            sounds, which were played as single gong tones. The gong
ral models are able to account for spike synchronization             sounds consist of inharmonic overtone spectra and were

                                                                 2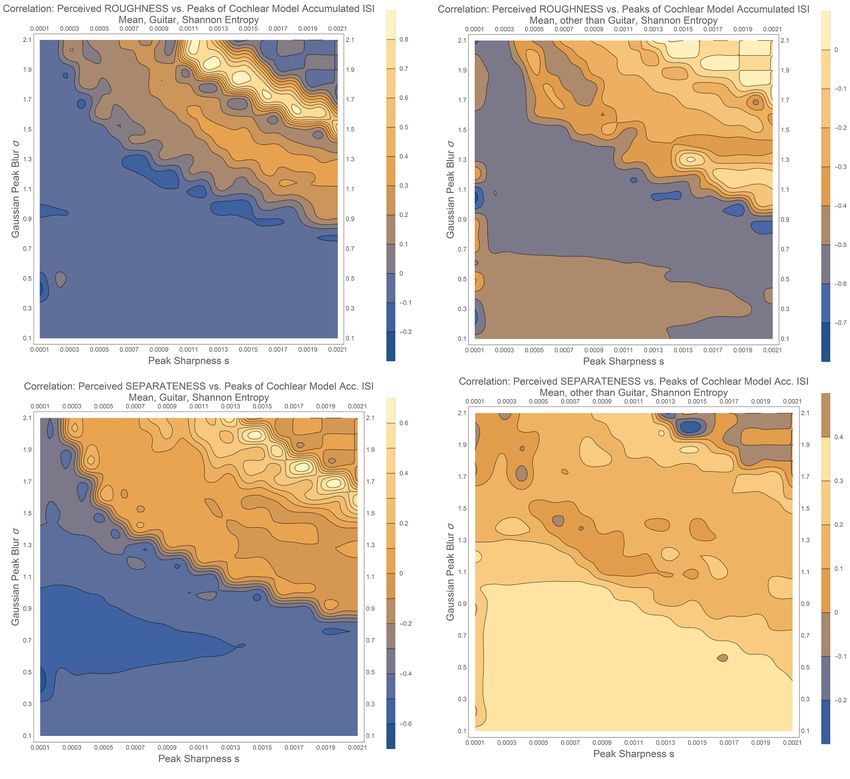
used to estimate a multi-pitch perception for percussion            Nr.      Instrument                 Pitches
instruments. Tab. 1 gives the instruments used together              1     Western guitar           Unisono, g3- g3
with the played intervals.                                           2     Western guitar       Minor Second, g3-g#3
   To have a systematic reference of all intervals within            3     Western guitar        Major Second, g3-a3
an octave, 13 sounds were played with a Western guitar,              4     Western guitar      Minor Third, g3-b flat3
all with lower pitch g3 and a second pitch above g3 in               5     Western guitar        Major Third, g3-b3
thirteen half-tone steps from unisono up to the octave g4.           6     Western guitar            Fourth, g3-c4
The pitches are in the middle range of guitar playing and            7     Western guitar          Tritone, g3-c#4
well within singing range. These pitches were assumed to             8     Western guitar             Fifth, g3-d4
be familiar to Western listeners.                                    9     Western guitar       Minor Sixth, g3-e flat4
   On the other side, nearly all other sounds were from             10     Western guitar         Major Sixth, g3-e4
non-Western instruments like the Chinese hulusi, a free-            11     Western guitar       Minor Seventh, g3-f4
reed wind instrument with three tubes, where two tubes              12     Western guitar       Major Seventh, g3-f#4
were played. There is no such instrument in the West.               13     Western guitar            Octave, g3-g4
Although the harmonica or the accordion are also free-              14      Saung Gauk          Minor Seventh, f#3-e4
reed instruments, the pitch of these instruments is deter-          15      Saung Gauk           Minor Sixth, f#3-d4
mined by the reed. With the hulusi on the other side the            16      Saung Gauk         Major Second, f#3-g#3
pitch is determined by length of a bamboo tube the reed             17          Dutar           Major Seventh, f#2-e3
is attached to. Using regular fingering technique different         18         Hulusi             Major Third, c4-e4
pitches can be played. The hulusi used was collected by
                                                                    19         Hulusi                 Fifth, a3-e4
the author in Lijiang, Yunnan, China.
                                                                    20         Hulusi             Minor Third, e4-g4
   The saung gauk is a Burmese arched harp. Its strings
                                                                    21         Hulusi           Minor Seventh, f#3-e4
are attached to an arched stick on both sides, where one
                                                                    22         Mbira              Minor Third, c4-e4
side of the stick is attached to a resonance box covered
                                                                    23     Bama Big Gong          Fundamental ∼ b2
with ox leather, which again is covered with heavy lac-
                                                                    24    Bama Small Gong        Fundamental ∼ g#2
quer. It is astonishing loud for a harp, which is caused
by resonances of the stick and the resonance body. For              25      Roneat Deik         Major Second, f#4-g4
the experiment a Mong crocodile saung gauk was used,                26      Ronest Deik            Two octaves plus
collected by the author in Yangon, Myanmar.                                                      major second, b3-c6
   The roneat deik used in the experiment is a metallo-             27        String Pad        MinorSecond, d#4-e4
phone consisting of 21 metal plates collected by the author         28        String Pad          Four octaves plus
in Phnom Penh, Cambodia. Although gong ensembles are                                            Major Third, f#2-a#6
common in Southeast Asia, the roneat deik is the seldom             29          Piano                 Fifth, c4-g4
case of a metal instrument, most other are made of bronze.          30       String Pade       Minor Seventh, c2-b flat2
The sound of each plate has an inharmonic overtone spec-
trum, still its fundamental is strong, making it possible to        Table 1: List of sounds used in analysis and listening
play melodies with it. Still it is expected that the sound            test. The guitar sounds cover the whole range of
of the instrument is unfamiliar to Western listeners.              half-tone steps in one octave. They are supposed to be
                                                                    familiar for Western listeners. The other sounds are
   The dutar used is a long-neck lute collected by the au-
                                                                   nearly all from non-Western instruments, and therefore
thor in Kashgar, Xinjiang, China. It is played as a folk
                                                                         taken to be unfamiliar for Western listeners.
instrument by the Uyghur people along the traditional silk
road. It has two strings, where two pitches are played at
the same time. Although it is a plucked string instru-
ments like the guitar, the sound is considerably different
from a guitar or a lute, caused by the unusual length of              Two other sounds have been used, a piano and a synth
the strings on a long-necked lute and the small resonance          pad sound. These sounds were created by a Kawai MP-13
body.                                                              keyboard. The pad sound was used as a continuous sound,
   The mbira is also known as thumb piano. It consists of          which most of the other sounds are not. The piano sound
9 metal plates attached to a wooden resonance box. Al-             was used because it is a standard instrument for musical
though the spectrum of the metal rods are inharmonic,              training. Pad sounds are generally familiar to Western
the fundamental frequencies of each spectrum is much               listeners. Still as synth sounds can be composed by any
stronger in amplitude than the higher partials, and there-         synthesis method with any parameters, these sounds were
fore melodies can be played on the instrument. Its origin          chosen to be unfamiliar. Also the piano sounds were cho-
is unkn own, but it was most likely built for Western mu-          sen to be added to the unfamiliar sounds in the analysis.
sicians in the World Music scene.                                  Although this is not perfectly correct, the advantage is
   The two gongs are collected by the author in Yangon,            to keep the 13 guitar sounds as a group of homogeneous
Myanmar, and are played within the hsain waing ensem-              sounds. There are only two piano sounds in the sound set
ble of traditional Bama music. The large gong has a di-            and taking them out does not change the results consid-
ameter of 54cm, the diameter of the small one is 26cm.             erably.

                                                               3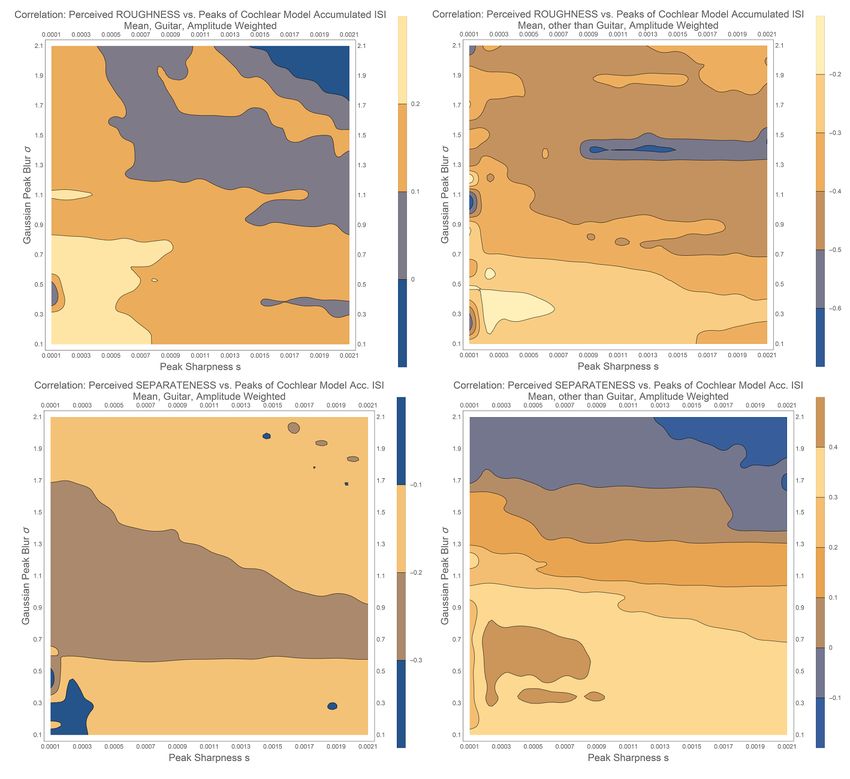
Subjects were presented all sound three times and asked          C     Post-processing of Cochlear Model
to rate their perception of the sounds roughness and sep-                 Output
arateness on a scale of 1-9 each, where 1 is no roughness /
no separateness and 9 is maximum roughness / maximum                The output of the cochlear model are spikes at certain
separateness. To give subjects an idea about where these            time points along the BM in the Bark bands. From here
maxima might be before the test several sounds used in              the interspike intervals (ISI) are calculated as the time in-
the test were played which in a pretest turned out to be            terval between two spikes at one nodal point, so two for
those perceived most rough and separate respectively.               each Bark band. Accumulating the ISI over a time inter-
   Additionally the subjects were asked to identify the mu-         val and transforming the ISI into frequencies like f=1/ISI,
sical interval of the sounds, e.g. fifth, fourth, etc. This         an ISI histogram of the amount of appearance or the am-
task was optional, as it was not clear how many subjects            plitude of certain frequencies or periodicities present in all
would have the capability of identifying the intervals and          Bark bands results. The accumulation interval was chosen
those with less capacity were asked not to wast time and            according to logarithmic pitch perception to be 10 cent,
attention to this task. A small questionnaire asking for            where one octave is 1200 cent.
age, gender and musical instrument played by subjects                  To simulate the coincidence detection found in neural
was presented before the listening test. There also musi-           nuclei subsequent to the cochlear, the ISI histograms as
cal interval training of subjects was asked for, where only         shown above are post-processed in three stages. First the
five subjects indicated they had intense training. Indeed           histograms of all time steps are summed up to build one
only five subjects answered some of the intervals, most of          single histogram for each sound. As shown in Fig. 1 and
them were wrong. Therefore in the follow it is not possi-           Fig. 2 the histograms change over time, mainly due to the
ble to correlate correct interval identification by subjects        temporal decay of the sound. They also show inharmonic-
with the other findings. Still we can state that nearly             ities during the initial transient. After temporal integra-
all subjects did not have a considerable musical interval           tion the ISI histogram is divided by the amplitude of its
identification capability.                                          largest peak, making the amplitude of this peak one. A
                                                                    threshold of th=0.01 is applied, making all peaks smaller
                                                                    than th zero. Additionally, all frequencies above 4kHz are
B    Cochlear Model                                                 not taken into consideration, as pitch perception is only
                                                                    present up to this upper frequency.
All sounds were processed using a cochlear model and                   Secondly, a Gauss blurring of the spectrum is per-
post-processing the cochlear output. The cochlear model             formed, where the spectrum is blurred using a Gauss
was used before in a study of phase-synchronization of              shape with standard deviation σ. This sums peaks which
partials in the transition between mechanical motion on             are very close to each other, and therefore performs coin-
the basilar membrane into neural spikes 5 , in a coincidence        cidence detection of periodicities close to each other. In a
detection model using a Iszikevich neural model 3 , when            second step only peaks with a certain sharpness s are used,
studying cello surface sounds 2 , or as foundation of a pitch       where s=0 selects all peaks and s¿0 selects only peaks,
theory 4 .                                                          where the negative second derivative of the spectrum is
   The model assumes the basilar membrane (BM) to con-              larger than s. This prohibits that after blurring the spec-
sist of 48 nodal points and uses a Finite-Difference Time-          trum very broad peaks are still taken as such peaks. To
Domain (FDTD) solution with a sample frequency of 96                estimate the amount of coincidence detection in the lis-
kHz to model the BM motion. The BM is driven by the                 tening test both values are varied in 21 steps between
ear channel pressure, which is assumed to act instanta-             0 ≤ σ ≤ 2, 0 ≤ s ≤ 0.002.
neously on the whole BM. This is justified as the sound                In a third step the ISI histogram is fused into a single
in the peri- and endolymph is about 1500 m/s, where the             number to make it comparable to the judgments of sep-
sound speed on the BM is only 100 m/s down to 10 m/s.               arateness and roughness of the listening tests, which are
The pressure acting on the BM is the input sound. The               also single numbers for each sound. Three methods were
output of the BM is a spike activity, where a spike is re-          used, the amount of peaks N, a sum of the peaks, each
leased at a maximum of the positive slope of the BM and             weighted with its amplitude like
a maximum slope in the temporal movement at one point
on the BM. This results in a spike train similar to mea-                                         N
                                                                                                 X
surements.                                                                                W =          ISIi ,                 (1)
   With periodic sounds the spikes are only present at the                                       i=1

respective Bark bands of best frequency of the periodic
                                                                        and a Shannon entropy like
sound. With harmonic overtone spectra all Bark bands of
the spectral components show spikes, while the other Bark                                        N
bands do not. Also the delay between the high frequency                           S = 1/ log N
                                                                                                 X
                                                                                                       ISIi log ISIi ,        (2)
spikes to the low frequencies at the BM apex is about 3-4                                        i=1
ms, consistent with experiments. The model does not add
additional noise. It also has a discretization of 48 nodal            where N is the amount of peaks and ISIi is the ampli-
points, which is two nodal points for each Bark band.               tude of the ith peak.

                                                                4
The three methods decide which perception process is Still we are interested in multi-pitched perception.
more likely to occur in listeners when correlating the re- Therefore a second example is that of a synthetic sound, a
sults with the separateness and roughness perception. string pad, playing a two-note interval of four octaves and
a major third (sound 28, f#2-a#6) with two fundamental
D Correlation between perception and frequencies at f1 = 93 Hz and f2 = 1762 Hz. This sound
is particularly interesting, as both pitches were perceived
calculation
most separate (see results of listening test below). Indeed
In a last step the mean values for the perception of sepa- the two pitches are clearly represented as major peaks in
rateness and roughness respectively over all subjects were the ISI histogram. In this plot and the following the ex-
correlated with the results of the simulation. To address pected peaks are indicated by solid lines starting from the
the hypothesis of different perception strategies for famil- top down to .7 of the plots hight. The precise frequencies
iar, in this case Western and unfamiliar instruments, the were calculated using a Morelet Wavelet transform of the
correlations were performed for two subsets of the 30 in- original sounds.
struments. One subset consists of all 13 guitar sounds, the
other subset are all other sounds. The 13 guitar sounds
form a consistent set, including all 13 intervals in the oc-
tave of a Western scale. The non-Western instruments
have different intervals, the two gongs consist of inhar- The third example is a Myanmar large buckle gong
monic spectra for comparison. In the follow the terms (sound 23). Its fundamental frequency is at f1 = 126 Hz.
Western and guitar sounds, as well as non-Western and Additionally the next two partials at f2 = 199 Hz and
non-guitar sounds as used synonymously. f3 = 252 Hz are indicated in the plot in Fig. 1 middle
So for each perception parameter, separateness and plot too. Such a gong has a basically inharmonic spec-
roughness, twelve cases exist, three summing methods N, trum, still many percussion instruments are carved such
W, and S, each for mean and standard deviation of the that the overtone spectrum is tuned with the gong. In
perception parameters, and each for the Western and non- an interview with a gong builder in Yangon during a field
Western subsets. Each of these twelve cases consist of 21 trip, the instrument maker explained that he is hammer-
× 21 = 441 correlations for all combinations of σ and s ing the gong in such a way to tune the third partial to the
used. For the sake of clarity, the combinations of σ and s fifth of the fundamental.
are combined in one plot.
IV Results
Indeed the gong is tuned very precisely. The relation
A ISI histogram f3 /f2 = 2 is a perfect octave, f2 /f1 = 1.58 is nearly a
perfect fifth. In the ISI histogram the lowest partial f1 is
Fig. 1 and Fig. 2 show six examples of ISI histograms, the strongest periodicity, f2 and f3 are nearly not present.
each consisting of adjacent time intervals, where each in- Still there is a residual around 63 Hz, the octave below
terval is an integration over the cochlear spike output in f1 , and two lighter ones two and three octaves below. In-
this interval. Five of these six examples have been used in deed we would expect a residual pitch to appear around
the listening test, only the top plot of Fig. 1 is presented 63 Hz, which is actually there. The Wavelet transform
as a single-note example to exemplify the pitch theory and does not show any energy below f1 of this gong. There-
the salience of pitch over timbre discussed above. fore this gong is similar to Western church bells, where
This single-note example is a single-line saxophone the hum note is a residual 21 . The ISI histogram at f1 is
melody. It appears that at all time intervals there is only also blurred, which most probably is caused by the beat-
one strong peak. Aurally this peak follows the played ing of the gong, which is not perfectly symmetric causing
melody very well. To verify this perception, in Fig. 3 degenerated modes.
an excerpt of Fig. 1 top plot is shown. It shows the
whole time but is restricted to the area of large peaks.
The continuous curve overlaying the ISI histogram plot is
the result of an autocorrelation calculation using the plain
sound time series as input. With 50 ms intervals the auto- Three other examples are shown in Fig. 2. All are two-
correlation of the sound time series is calculated, and the note intervals played on a classical guitar and all have the
interval between the autocorrelation beginning and the same low note g3 with a lowest partial at 193 Hz (called f1
first autocorrelation function peak is taken as fundamen- here to compare with the second note with lowest partial
tal periodicity. This is an established method for detecting at f2 ). Three intervals are shown, the octave at the top,
f0 in single melodies, and has e.g. be applied to analyze a fifth in the middle, and a major seventh at the bottom.
intonation of Cambodian Buddhist smot chanting 7 . Both Again the fundamental frequencies of the two notes were
functions, the autocorrelation and the ISI histogram align also determined using a Wavelet transform of the origi-
very well. Therefore the largest peak in the ISI histogram nal sound time series, and indicated with horizontal lines
can be used for f0 extraction in single melody lines. starting at the top of the plots.
5Figure 1: Temporal development of ISI histogram, Figure 2: Same as Fig. 1 for three two-note intervals
summing all ISI in all Bark bands and transferring them played on a classical guitar. All have the same
into frequencies f = 1 / ISI for three example sounds: fundamental pitch g at f1 = 193 Hz. Top: octave above
top: a single tone saxophone melody, middle: a string f1 at f2 = 393 Hz, middle: fifth above f1 at f2 = 294 Hz,
pad sound consisting of two notes with fundamental bottom: major seventh above f1 at f2 = 382 Hz. In all
frequencies f1 = 93 Hz and f2 = 1762 Hz, bottom: A cases f1 is clearly represented in the ISI histogram. With
large buckle gong with three lowest frequencies f1 = 126 the octave the f2 partial is nearly not present, with the
Hz, f2 = 199 Hz, and f3 = 252 Hz. The lines at the fifth f2 is again only slightly there, still a residual
upper part of the middle and bottom plots indicate these periodicity below f1 appears. With the major seventh
frequencies. The saxophone melody is perfectly again f2 is nearly not present, still many periodicities
represented by the strongest peak at all ISI histograms, above and below f1 are slightly present.
as shown in Fig. 3 in detail. The string pad sounds
fundamentals are also clearly represented by the ISI
histogram. The gongs lowest partial is clearly there, still
a residual ISI below this f1 is there, too.
6nuclei. This leads to the suggestions of a pitch perception,
which is caused by the magnitude of the pitch periodicities
present in the whole field of the nervous system carrying
these spikes. The strength and salience of pitch over tim-
bre, as found in many Multidimensional Scaling Method
(MDS) experiments and which makes melody and score
representation of sound with pitches possible at all, might
be caused by the salience of the fundamental periodicity
in the auditory pathway.
B Perception of Separateness and Rough-
ness
The mean perception over all subjects of separateness is
shown in Fig. 4, the mean perception of roughness in
Fig. 5 sorted by the musical interval present in the sound.
The familiar guitar sound subset include all intervals, and
to make this subset clearly visible the guitar tones are
connected with the yellow line.
The separateness perception shows nearly all unfamiliar
sounds perceived less separated than the guitar sounds.
Figure 3: Excerpt from Fig. 1 top of the single
This points to different perception strategies between
saxophone line, comparing the ISI histogram temporal
these two subsets, familiar and unfamiliar sounds. The
development with the results of an autocorrelation
only exception is the ’Strings 2 octaves’ sound which is
function of the sounds time series when using the first
shown with its ISI histogram in Fig. 1 middle plot. Here
peak of the autocorrelation as f0 at adjacent time
the two notes are separated by over an octave and the ISI
intervals. Both curves align very well. Therefore the
histogram shows clearly two distinguished peaks at the re-
strongest peak of the ISI histogram is representing the
spective fundamental frequencies of the two notes in this
fundamental pitch very precisely.
sound.mple split than with separateness perception.
When discussing instrument families the dutar and the
With the octave sound only one peak at f1 , the fun- saung gauk are both plucked stringed instruments like the
damental frequency of the low note appears. The fifth is guitar. Still both are lower than the guitar tones in terms
more complicated, there is energy at f1 , which is bifur- of separateness perception. Still this also holds for the
cating at first only to join after about 800 ms. There is two strings sounds, which are also supposed to be famil-
nearly no peak at the fundamental frequency of the second iar with Western listeners and which are also perceived
note, the fifth. Still the residual pitch expected at 101 Hz more fused than separated. Still these sounds are artifi-
(f2 − f1 ) is clearly present. With the major seventh in- cial string pad sounds, which have above already been dis-
terval as the bottom plot in Fig. 2 f1 , the fundamental of cussed as unfamiliar insofar, as such synth sounds can be
the low note is very strong. But there is nearly no energy produced with arbitrary synthesis methods and parame-
at the fundamental of f2 , the major seventh. Still many ters, which make these sounds unpredictable and therefore
small peaks are present, especially during the first about unfamiliar to listeners too. The only sound which is still
500 ms. familiar would then be the piano, which is indeed close to
It has been shown previously, that with periodic sounds, the guitar sound in terms of separateness. The least sep-
in the Bark band of the fundamental of the sound, ISI are arated sounds are the gongs and the roneat deik, which
present in all Bark bands with energy, not only at the are percussion instruments in the sense of an inharmonic
Bark band of the fundamental frequency. The reason for overtone spectrum, although the roneak deik is a pitched
this is straightforward. A periodic wave form has regions instrument. With the four instruments having a major
of strong and weak amplitudes during one period. Dur- seventh interval it is interesting to see how strong the in-
ing regions of weak amplitude not much energy is enter- fluence of the instrument sound is in terms of separateness
ing the cochlear, and therefore there is not much energy perception.
to trigger a nervous spike. So we expect drop-outs in The roughness perception shown in Fig. 5 does not
the series of spike in higher frequencies. These drop-outs show such a clear distinction between familiar and unfa-
are experimentally found and also appear in the present miliar sounds. The guitar tones show a roughness percep-
cochlear model. These drop-outs are subharmonics of the tion as expected, least with the unisono, octave, fourth,
frequency of the Bark bands, where the common subhar- and fifth, and strongest with the minor second, major sev-
monic to all Bark bands with energy is the fundamental enth, and tritone. It is interesting to see that all four hu-
frequency of the harmonic input sound. lusi sounds are above the guitar, so perceived more rough,
This means that the fundamental periodicity is present following the roughness perception of the guitar qualita-
in all Bark bands and is so transferred to higher neural tively (major seventh most rough, fifth least rough, etc.).
7Figure 4: Mean perception of separateness of all stimuli Figure 5: Mean roughness perception of all stimuli, again
sorted according their musical interval (gongs are sorted the guitar tones are connected with the yellow line. The
as unisono). As the guitar tones form the familiar roughness perception of the guitar sounds are as
subgroup and is the only instrument having all 13 expected, least with unisono, octave, fourth and fifth,
interval in the octave, they are connected with the yellow and strongest with minor second, major seventh, and
line. Except for the ’Strings 2 octaves’ sound, which is tritone. Still the non-familiar instruments are distributed
the string pad sound, which ISI histogram is shown in above and below the guitar sounds, and do not show
Fig. 1, all non-familiar sounds are perceived as well such a simple split than with separateness perception.
separate and therefore as more fused compared to the
familiar guitar sound. This points to a different
perception strategy of familiar and unfamiliar sounds. Fig. 6 shows the correlation between simulation and
Furthermore, the guitar sounds show least separateness separateness as well as roughness perception for the gui-
in unisono and octave as expected, and most tar and non-guitar sounds using entropy S. The upper
separateness with the major seventh. graphs are roughness, the lower two separateness corre-
lations, the left plots are the guitar and the right plots
the non-guitar sounds respectively. Each plot varies the
Also the gongs and the roneat deik are perceived with standard deviation σ of the ISI histogram blurring from
low roughness, they have also been perceived as low in 0 ≤ σ ≤ 2 and a peak sharpness s from 0 ≤ s ≤ .002 in 21
separateness. Still overall no such perception strategy can steps each (for details see above). Therefore the very left
be found with roughness as it clearly appears with sepa- lower corner of each plot is the unprocessed ISI histogram
rateness perception. which might contain many peaks, most of them with low
Comparing the guitar perception of roughness and sep- amplitude. With increasing σ a coincidence detection is
arateness is appears that they are counteracting up to the performed, summing neighbouring peaks to a single peak.
fifth and aligning from the fifth to the octave qualitatively. This reduces the amount of peaks, but blurs them. When
So above the fifth it is likely for familiar sounds to be per- increasing s only sharp peaks are used. Of course blurred
ceived separate when they are also perceived rough. Below peaks can only appear with higher values of σ. Therefore
the fifth it is likely that these two perceptions are oppo- higher values of s prevent that for large values of σ peaks
site. Therefore the perception parameter of separateness are detected which are so broad that they cannot reason-
is a different perception than that of roughness. ably have been built in a coincidence detection process as
they are too far apart.
C Correlation between perception and Examining the plots in Fig. 6, concentrating on the
simulation left upper plot of roughness correlated with guitar tones,
a ridge of positive correlation appears in the upper right
In the section above we have found a clear split between corner. The rest of the plot is structured accordingly with
familiar and unfamiliar sounds, pointing to two different a tendency of lower right to upper left ridges. Following
perception strategies. Therefore in this section correlating the ridge with the highest correlation starting at σ ∼ 1.5
perception to simulation, the two subgroups, familiar gui- on maximum s and ending at s = 0.0011 with maximum
tar sound and unfamiliar sounds are correlated separately σ, the trade-off between σ and s leads to a reduction of
with simulation. the amount of amplitudes down to 3-5 amplitudes in the
8post-processed ISI histogram only. This is a tremendous e.g. the range of the plots have been kept individual to
reduction taking into consideration that the amount of allow for maximum differentiation within the plots. Still
amplitudes in the unprocessed lower left corner of the plots this makes the comparison of plots more complex, as col-
is between 700-800 amplitudes. On the right lower side of oring of two neighbouring plots correspond to different
the ridge with strong positive correlation the peaks are not absolute values. Other color options have been tried too,
blurred to a maximum as sharpness is very rigid, allowing like absolute coloring, still again, as there are plots of low
only a few amplitudes. On the left upper side of the ridge overall range many colors need to be used making plots
the blurring is increased, still the sharpness criterion is with a wide range unreadable.
eased, resulting in about the same amount of amplitudes,
3-5. Indeed in the upper right corner only one or even no
amplitudes have survived.
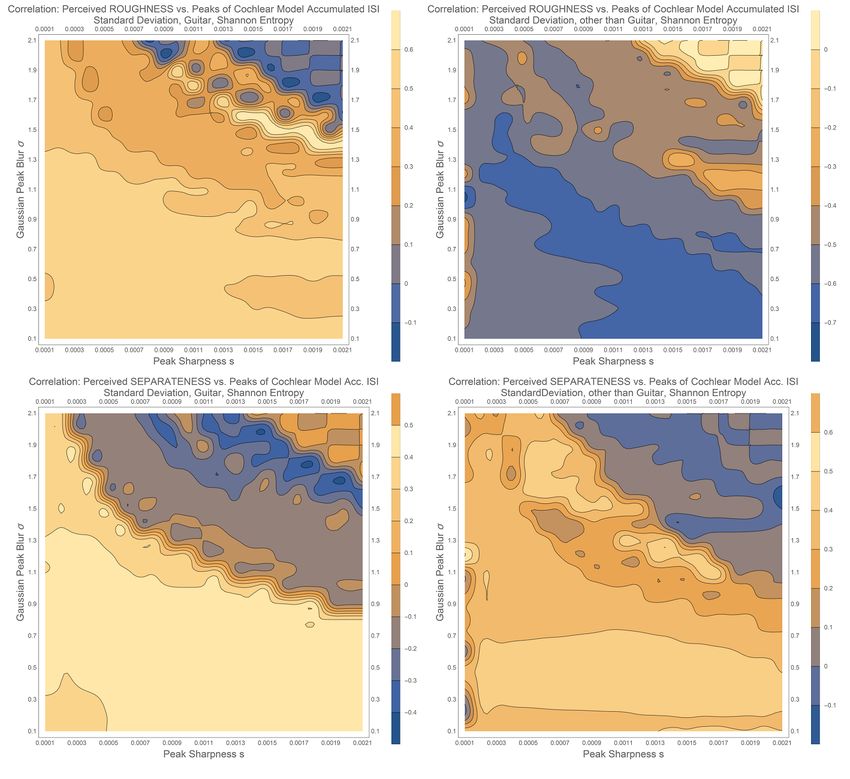
Figure 7: Same as Fig. 6 but correlation over number of
ISI histogram amplitudes N. For roughness the no-guitar
sounds on the right have a negative correlation in the
Figure 6: Correlation between perceived roughness upper right part and positive the the lower left, while the
(upper plots) as well as separateness (lower plots) for the guitar sounds on the left have a positive correlation on
guitar tones (left plots) and all other no-guitar sounds the upper right ridge, again pointing to an opposite
(right plots) and the entropy S of the accumulated ISI perception between familiar and unfamiliar sounds. For
spectrum, while post-processing the spectrum with a separateness the correlation between the no-guitar
Gaussian blurring with standard deviation σ and a peak sounds on the right is negative at the upper right part
sharpness s. All plots show a consistency or ridge from and positive the lower left, while for the guitar sounds is
right/bottom to left/top as expected (see text for more positive at the upper right ridge and slightly negative at
detail). For roughness the no-guitar sounds on the right the lower left part. Again this is an opposite behaviour,
have a negative correlation throughout, while the guitar although not that clear as with the entropy S in Fig. 6.
sounds on the left have a positive correlation, pointing to
an opposite perception between familiar and unfamiliar Now comparing the two roughness plots for guitar (left
sounds. For separateness the correlation between the upper) and non-guitar (right upper) sounds in Fig. 6 they
guitar sounds on the left is positive at the right upper show opposite correlations. While the ridge in the gui-
ridge and negative in the lower left side, while the tar plot has a positive correlation, the correlation at the
non-guitar sound on the left have a positive correlation ridge position with the non-guitar tones is slightly nega-
on this lower left side and negative correlation at the tive, this plot shows negative correlations throughout. A
upper right ridge, again showing opposite behaviour. similar behaviour holds for the separateness perception in
the lower two plots of this figure. On the left the guitar
Again examining this plot, the ridge shows a rippling, plot has a positive correlation at the ridge, while the non-
as does the region in the right upper corner. These are guitar tones have a slightly negative correlation there, and
artifacts of the visualization which uses an interpolation is positive in the lower left part. Still there is a difference
to smooth the plot. Without such interpolation the ridge between separateness and roughness. While the rough-
would consist of single points on a grid which is not dif- ness plot is negative in the lower right corner of the plots
ferent in content but more more unpleasant visually. The for both, guitar and non-guitar tones, the separateness
visualization of the plots have been varied to much extend, plots show negative correlations with the guitar and posi-
and the present version was considered the best choice. So tive ones with the non-guitar tones. In both cases, rough-
9ness and separateness, the ridge is positive with the guitar tion subjects performed, while low coincidence detection
tones and slightly negative with the non-guitar sounds. can be associated with timbre. Therefore high correla-
tions of perception with much coincidence, the ridges at
theright upper corners of the plots, means that subjects
had put their attention to pitch. Contrary, a high correla-
tion of perception with low coincidence detection, the left
lower part of the plots, indicates subjects attention to tim-
bre. This is expected as pitch is a much more consistent
perception than timbre.
Figure 8: Same as Fig. 6 but correlation over
amplitude-weighted ISI histogram W. The plots are
considerably different from the entropy S Fig. 6 and
number of amplitudes N in Fig. 7. Although the guitar
roughness plot on the left top shows a kind of ridge as
seen before, the correlations are very small. The
roughness non-guitar plot on the right top has large
negative correlations at a line at σ ∼ 1.4. The Figure 9: Correlation of the standard deviation of the
separateness guitar plot has again low correlations, while perceptual separateness and roughness with the ISI
the non-guitar separateness plot has larger positive histogram entropy S. The correlation shows slight
correlations in its lower part, slightly similar to the similarity with the mean value correlations of the
roughness non-guitar plot. Still it seems that perceptual dimensions.
amplitude-weighting is not reasonably correlating with
perception. It is also interesting to have a look at the standard de-
viations for the perception of roughness and separateness
Finally in Fig. 9 the standard deviations of the percep- shown in Fig. 10 and Fig. 11 respectively. For roughness
tual data with the ISI histogram entropy S is shown. It the guitar sounds have among the lowest values, while for
has some similarities with the plots of the mean of the per- separateness they have the highest compared to the non-
ceptual parameters. Roughness for the guitar sounds has guitar sounds. The correlation between mean and stan-
again a ridge at the upper right corner, still the lower right dard deviation of roughness perception is 0.62, pointing
side of the plot is slightly positive, not negative like with to increased uncertainty of judgments with higher values.
the mean values. Roughness for the non-guitar sounds Still the correlation between mean and standard devia-
is all negative, like the mean case. For separateness the tion for separateness is only 0.27 and so seem to be more
guitar sounds have a negative ridge and a positive lower independent.
left corner, contrary to the mean values, this contrary be- So we conclude three points.
haviour is also seen with the non-guitar sounds compared First, the familiar guitar sounds are perceived using
to the mean case. only a small amount of ISI histogram amplitudes, here
So overall a high standard deviation correlates positive 3-5, while the unfamiliar non-guitar tones are perceived
with high entropy values in the lower left corner and neg- using the broad range of many amplitudes in the ISI his-
ative with a low entropy in the upper right corner. There- togram. So the familiar sounds are perceived after intense
fore we can conclude that when subjects were concen- coincidence detection, while the non-familiar sounds are
trating on strong coincidence detection, their judgments perceived before coincidence detection, or only using a
were much more consistent intersubjectively compared to small part of it. As the main peaks of the ISI histogram
the cases where subjects put their attention to low coin- are associated with pitch and the smaller amplitudes with
cidence. The presence of only 3-5 amplitudes left after timbre, we can conclude that perception strategy of famil-
strong coincidence detection is pointing to a pitch percep- iar sounds is using pitch information and that of unfamil-
10iar sounds using timbre.
Second, separateness is correlated opposite between fa-
miliar (negative correlation) and unfamiliar (positive cor-
relation) sounds with low coincidence detection (lower
right plot corners), while roughness is correlated negative
in both cases. This corresponds to the findings above,
that separateness is perceived considerably stronger with
guitar tones than with non-guitar sounds, while roughness
does not show this clear distinction. So although for both
it holds the pitch/timbre difference, separateness uses op-
posite strategies of perception while roughness uses the
same correlation direction.
Third, judgments based on timbre are much more in-
consistent than those based on pitch, which appears in the
correlation between the standard deviation of the percep-
tual parameters and the entropy S of the ISI histograms.
These findings are based on the entropy calculated from
the post-processed ISI histogram. Fig. 7 shows the same
correlations only taking the number N of surviving ampli-
tudes into consideration. The results are similar in some
respect, but show differences too. With the roughness gui-
tar plot the ridge is again there, with negative correlation
Figure 10: Standard deviation for roughness perception. in the right left corner as before. Still now the unfamiliar
The guitar tones are among those sounds with lowest roughness case has a strong negative correlation when few
standard deviation. Three hulusi and one strings sound amplitudes remain in the upper right corner and strong
are considerably larger in their SD. positive correlations in the many amplitude case in the
lower left corner. Again the perception is opposite, but
much clearer than in the entropy case.
For separateness the cases reverses too, the opposite
correlation in the lower left corner disappear, in the fa-
miliar and unfamiliar case both regions correlate positive.
Here the ridge region changing correlation direction.
These findings contradict the findings from the percep-
tion test, namely the clear split of familiar and unfamiliar
sounds for separateness, pointing to an opposite percep-
tion strategy. Therefore we conclude that using only am-
plitude counting is not perfectly in correspondence with
the the listening test and therefore more unlikely to be
used by subjects to judge separateness.
Finally the third method of weighted amplitudes W is
shown in Fig.8. Here the smallest correlations occur. Also
the clear structures which have been found with entropy
S and number of amplitudes N does not appear. Only the
roughness guitar plot has some similarity with the ridge
structure seen before. Therefore we conclude that the
amplitude weighted ISI histogram is not correlating with
perception.
V Conclusions
The results point to two different perception strategies
Figure 11: Perceptual standard deviation of the when listeners are asked to judge separateness and rough-
separateness sounds. Here the guitar tones are among ness of familiar and unfamiliar sounds. With familiar
those sounds with the highest SD. The gongs and one sounds a strong coincidence detection seems to take place,
hulusi have considerably lower values. where listeners concentrate on the pitch extraction of
sounds. With unfamiliar sounds they use the raw input
much stronger without the coincidence detection reduc-
tion, concentrating on timbre. This corresponds to the
11overall experience with these sounds listeners reported for References
the unfamiliar sounds, namely that they could often not
tell if the sounds consisted of two or only one pitch, or [1] Baars, B.J., Franklin, S., Ramsoy, T.Z.: Global
could not clearly identify one of the pitches. Therefore workspace dynamics: cortical binding and propaga-
they needed to rely on timbre rather than on extracted tion enables conscious contents. Front Psychol 4, 200.
pitches. doi:10.3389/fpsyg.2013.00200. eCollection
A second perception strategy seem to happen when lis-
[2] Bader, R. & Mores, R.: Cochlear detection of double-
teners are asked to judge separateness or roughness of
slip motion in cello bowing. arXiv:1804.05695v1 [q-
sounds. With roughness timbre is the part listeners con-
bio.NC] 16 Apr 2018.
centrate on, with separateness perception the strategy
change between familiar and unfamiliar sounds. With un- [3] Bader, R.: Cochlear spike synchronization and coin-
familiar sounds separateness is correlated positive with a cidence detection model. Chaos 023105, 1-10, 2018.
complex sound, with familiar sounds timbre is correlated
negative. So in unfamiliar multi-pitch sounds the pitches [4] Bader, R.: Pitch and timbre discrimination
are perceived separate when the timbre is complex, while at wave-to-spike transition in the cochlea.
with familiar sounds the pitches are found separate when arXiv:submit/2066467 [q-bio.NC] 12 Nov 2017.
the timbre is more simple. It might be that listeners have
is easier with familiar sounds to separate pitches when the [5] Bader, R. (2015). Phase synchronization in the
timbre is more simple. Still if they are not familiar with cochlea at transition from mechanical waves to elec-
the sound and not able to extract pitches anyway, they trical spikes. Chaos 25, 103124.
find complex spectra more separate than fused.
[6] R. Bader, Nonlinearities and Synchronization in
In all cases judgments based on timbre are much more
Musical Acoustics and Music Psychology, Springer-
inconsistent between subjects than those based on pitch.
Verlag, Berlin, Heidelberg, Current Research in Sys-
In terms of neural correlates of roughness and separate-
tematic Musicology, vol. 2, (2013).
ness perception, the entropy of the ISI histogram is much
better able to explain perception compared to the num- [7] Bader, R.: Buddhism, Animism, and Entertainment
ber of amplitudes or, even worse, the weighted amplitude in Cambodian Melismatic Chanting smot. A. Schnei-
sum. This is expected, as entropy is a more complex way der & A. von Ruschkowski (eds.): Hamburg Yearbook
of summing a sensation into a single judgment or sepa- of Musicology 28, 283-305, 2011.
rateness or roughness than the other methods, as entropy
gives an estimation over the distribution of amplitudes in [8] Barrie, J.M., Freeman, W.J. & Lenhart, M.D.: Spa-
the spectrum and therefore their relation. Other methods tiotemporal analysis of prepyriform, visual, auditory,
might even be suited better, which is beyond the scope of and somesthetic surface EEGs in trained rabbits. J
the present paper to discuss. Neurophysiol 76, 520539, 1996.
Overall it appears that many judgments of subjects are
based on low-level parts of the auditory pathway before [9] Buhusi, C.V. & Meck, W.H.: What makes us tick?
extended coincidence detection. This points to the ne- Functional and neural mechanisms of interval timing.
cessity of perceiving timbre and pitch as a field of neural Nature Reviews Neuroscience, 6, 755765, 2005.
activity. [10] Cariani, P. (2001). Temporal Codes, Timing Nets,
and Music Perception. J. New Music Research, 30
(2), 107135.
[11] Dau, T., Püschel, & D., Kohlrausch, A. (1996). A
quantitative model of the ”effective” signal processing
in the auditory system. I. Model structure. J. Acoust.
Soc. Am., 99 (6), 3615-3622.
[12] Dau, T., Püschel, D. & Kohlrausch, A. (1996). A
quantitative model of the ”effective” signal process-
ing in the auditory system. II. Simulations and mea-
surements. J. Acoust. Soc. Am., 99 (6), 3623-31.
[13] Fries, P., Neuenschwander, S., Engel, A.K., Goebel,
R. & Singer, W.: Rapid feature selective neuronal
synchronization through correlated latency shifting.
Nature Neuroscience, vol. 4(2) 194-200, 2001.
[14] Goldstein, J.L., Gersen, A., Srulovicz, P., & Furst,
M. (1978). Verification of the Optimal Probabilistic
Basis of A
14[15] Haken, H.: Brain Dynamics, Springer Series in Syn-
ergetics, 2. ed., Springer, Heidelberg, 2008.
[16] Hartmann, L.: Neuronal synchronization of musical
large-scale form: an EEG-study. Proc. Mtgs. Acoust.
22, 035001 (2014); doi: 10.1121/2.0000042.
[17] von Helmholtz, H.: Die Lehre von den Tonempfind-
ungen als physiologische Grundlage fr die Theorie der
Musik [On the Sensations of tone as a physiological
basis for the theory of music]. Vieweg, Braunschweig
1863.
[18] Joris, P.X., Carney, L.H., Smith, P.H. & Yin, T.C.T.
(1994). Enhancement of neural synchronization in the
anteroventral cochlear nucleus. I. Responses to tones
at the characteristic frequency. J. Neurophysiol., 71
(3), 1022-1036.
[19] Joris, P.X., Carney, L.H., Smith, P.H. & Yin, T.C.T.
(1994). Enhancement of neural synchronization in the
anteroventral cochlear nucleus. II. Responses in the
tuning curve tail. J. Neurophysiol., 71 (3), 1037-1051.
[20] Kozma, R. & Freeman, W.J. (eds.): Cognitive
Phase Transitions in the Cerebral Cortex - Enhanc-
ing the Neuron Doctrine by Modeling Neural Fields,
Springer Series Studies, System, Decision, and Con-
trol, Springer, Heidelberg, 2016.
[21] Lau, B., Bader, R., Schneider, A. & Wriggers, P.:
Finite-Element transient calculation of a bell struck
by its clapper. In: Bader, R., Neuhaus, Ch, & Mor-
genstern, U. (eds.): Concepts, Experiments, and
Fieldwork: Studies in Systematic Musicology. Peter
Lang Verlag, Frankfurt a.M. 137-156, 2009.
[22] Lewicki, M.S. (2002). Efficient coding of natural
sounds. Nature Neuroscience, 5 (4), 356-363.
[23] Ohl, F.W.: On the Creation of Meaning in the Brain-
Cortical Neurodynamics During Category Learning.
In: Kozma, R. & Freeman, W.J. (eds.): Cognitive
Phase Transitions in the Cerebral Cortex - Enhanc-
ing the Neuron Doctrine by Modeling Neural Fields,
Springer Series Studies, System, Decision, and Con-
trol, Springer, Heidelberg, 147-159, 2016.
[24] Schneider, A.: Perception of Timbre and Sound
Color. In: Bader, R. (ed.): Springer Handbook
of Systematic Musicology. Springer, Heidelberg 687-
725, 2018.
[25] Schneider, A: Pitch and Pitch Perception. In: Bader,
R. (ed.): Springer Handbook of Systematic Musicol-
ogy. Springer, Heidelberg 605-685, 2018.
15You can also read