Estimation of skin optical parameters for real-time hyperspectral imaging applications
←
→
Page content transcription
If your browser does not render page correctly, please read the page content below
Estimation of skin optical parameters
                 for real-time hyperspectral imaging
                 applications

                 Asgeir Bjorgan
                 Matija Milanic
                 Lise Lyngsnes Randeberg

Downloaded From: https://www.spiedigitallibrary.org/journals/Journal-of-Biomedical-Optics on 14 Jan 2021
Terms of Use: https://www.spiedigitallibrary.org/terms-of-use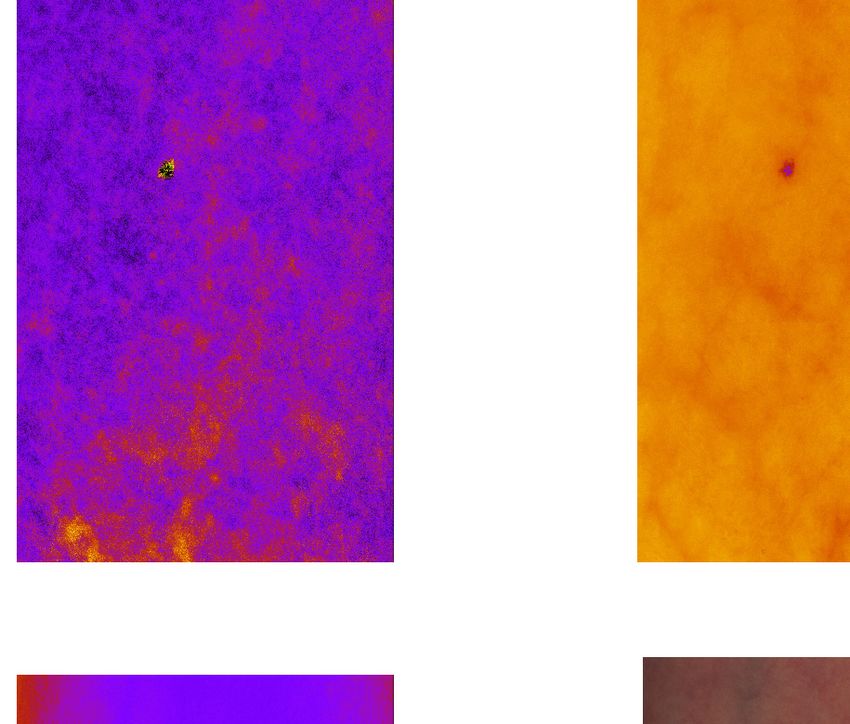
Journal of Biomedical Optics 19(6), 066003 (June 2014)

                Estimation of skin optical parameters for real-time
                hyperspectral imaging applications
                Asgeir Bjorgan,* Matija Milanic, and Lise Lyngsnes Randeberg
                Norwegian University of Science and Technology, Department of Electronics and Telecommunications, Trondheim 7491, Norway

                              Abstract. Hyperspectral imaging combines high spectral and spatial resolution in one modality. This imaging
                              technique is a promising tool for objective medical diagnostics. However, to be attractive in a clinical setting, the
                              technique needs to be fast and accurate. Hyperspectral imaging can be used to analyze tissue properties using
                              spectroscopic methods, and is thus useful as a general purpose diagnostic tool. We combine an analytic dif-
                              fusion model for photon transport with real-time analysis of the hyperspectral images. This is achieved by paral-
                              lelizing the inverse photon transport model on a graphics processing unit to yield optical parameters from diffuse
                              reflectance spectra. The validity of this approach was verified by Monte Carlo simulations. Hyperspectral images
                              of human skin in the wavelength range 400–1000 nm, with a spectral resolution of 3.6 nm and 1600 pixels across
                              the field of view (Hyspex VNIR-1600), were used to develop the presented approach. The implemented algo-
                              rithm was found to output optical properties at a speed of 3.5 ms per line of image data. The presented method is
                              thus capable of meeting the defined real-time requirement, which was 30 ms per line of data.The algorithm is a
                              proof of principle, which will be further developed. © The Authors. Published by SPIE under a Creative Commons Attribution 3.0
                              Unported License. Distribution or reproduction of this work in whole or in part requires full attribution of the original publication, including its DOI.
                              [DOI: 10.1117/1.JBO.19.6.066003]

                              Keywords: inverse skin model; tissue optics; reflectance spectroscopy; imaging spectroscopy; fast computing; graphics processing
                              unit.
                              Paper 130812PRR received Nov. 13, 2013; revised manuscript received Apr. 30, 2014; accepted for publication May 6, 2014; pub-
                              lished online Jun. 4, 2014.

                1     Introduction                                                                          It is valuable to estimate the concentrations of various tissue
                Hyperspectral imaging has been recently adopted for diagnostic                         components (blood, melanin, and water) for diagnostic purposes.
                imaging of human skin. Hyperspectral imaging combines high                             Spectral unmixing algorithms are frequently used to obtain con-
                spatial and spectral resolution in one modality, giving images                         centration maps of materials in remote sensing.9 Applying the
                                                                                                       same methods to analyze the hyperspectral images of skin is
                with full spectral resolution in every pixel.1,2 This makes it a
                                                                                                       challenging due to the turbid, layered nature of human skin.
                promising tool for tissue characterization and optical diagnos-
                                                                                                       One aim of this study is to develop a method for spectral unmix-
                tics.1,3,4 Flexible wide-field imaging options give the possibility
                                                                                                       ing of the hyperspectral images of human skin.
                of rapid scanning of both larger areas and samples and smaller
                                                                                                            Forward light transport models, such as Monte Carlo10 or the
                details, e.g., full body scans and close up imaging with micro-
                                                                                                       diffusion approximation,11–13 may be used to simulate light
                scopic resolution.5 The physical size of the equipment makes it
                                                                                                       transport in media such as human skin. These type of models
                possible to place it on a small trolley, and it can thus be used for
                                                                                                       have previously been used to extract optical properties of tis-
                bedside scanning.6 The hyperspectral camera used in this study
                                                                                                       sue.13–15 This has been typically done by comparing measured,
                is a push broom, line-scanning device with a capture speed of
                                                                                                       diffuse reflectance spectra to simulations, and tweaking the
                30 ms per line of data.
                                                                                                       input parameters of the simulations to obtain the best possible
                    The amount of collected data is an obstacle for fast hyper-
                                                                                                       fit. To our knowledge, these methods have never been applied to
                spectral data processing while scanning. With typical files being
                                                                                                       hyperspectral images in real-time during data collection. Some
                in the order of several gigabytes, processing time is prohibitive
                                                                                                       reports exist on the application of inverse photon transport mod-
                for advanced analysis. Time is a crucial parameter for the tech-
                                                                                                       els on hyperspectral images after image acquisition.16,17
                nique to be clinically relevant. Processing speed should preferably
                                                                                                            This paper presents a deterministic hyperspectral inverse mod-
                obey an external real-time deadline limit defined by the acqusition
                                                                                                       eling approach based on diffusion theory and spectral unmixing.
                speed of the hyperspectral camera. Commodity graphics process-
                                                                                                       These analytical methods are suitable for GPU implementation.
                ing units (GPUs) are well known to satisfy heavy computing
                                                                                                       The analysis chain fulfills the real-time requirements of the hyper-
                requirements.7,8 GPUs are normally used to process graphics on
                                                                                                       spectral imaging process. The optical properties are delivered line
                personal computers and are relatively inexpensive. Such graphics
                                                                                                       by line during data collection, and no additional computational
                cards can potentially boost processing speed due to the inherent
                                                                                                       time is needed beyond the time it takes to scan the sample.
                parallelizability of hyperspectral data processing.                                         The accuracy of the results obtained using the inverse model
                                                                                                       was evaluated against numerical simulations. However, as this is
                                                                                                       a proof of a new concept, real-time processing concerns were
                *Address all correspondence to: Asgeir Bjorgan, E-mail: asgeir.bjorgan@iet             given priority over simulation accuracy. This issue will be
                 .ntnu.no                                                                              addressed in further development of the concept.

                Journal of Biomedical Optics                                                 066003-1                                                      June 2014     •   Vol. 19(6)

Downloaded From: https://www.spiedigitallibrary.org/journals/Journal-of-Biomedical-Optics on 14 Jan 2021
Terms of Use: https://www.spiedigitallibrary.org/terms-of-use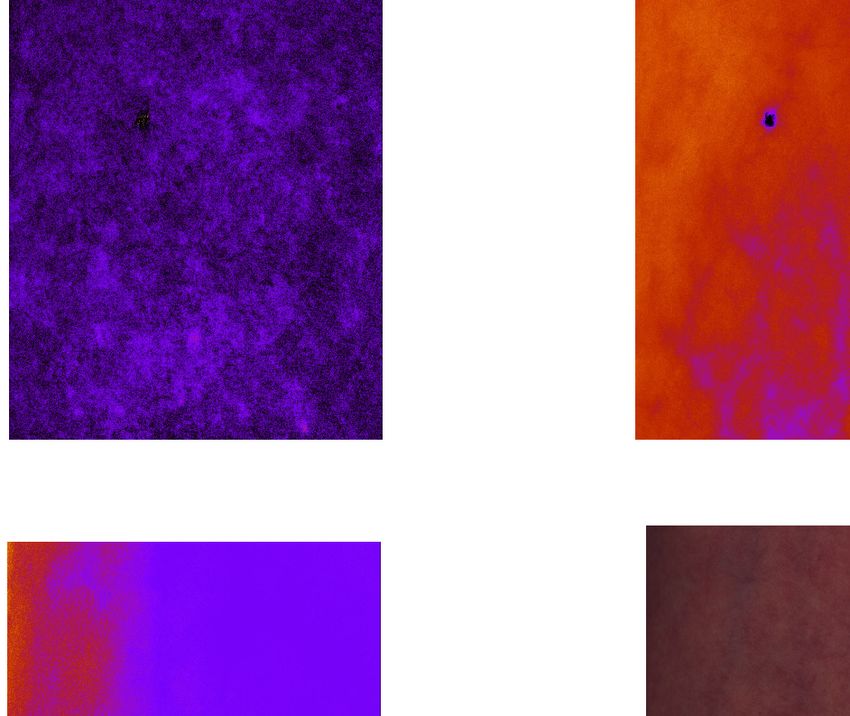
Bjorgan, Milanic, and Randeberg: Estimation of skin optical parameters for real-time hyperspectral imaging applications
10,0000
2 Materials and Methods Melanin
Oxy-Hb
1,0000 Deoxy-Hb
)
Water
−1
2.1 Background 1000 Purified fat
Absorption (m
The main objective of the study was to develop an algorithm 100
for extraction of skin properties from hyperspectral images in 10
real-time during scanning. This has been done using GPU par- 1
allelization. GPU hardware is essentially an SIMD (single
0.1
instruction and multiple data) vector processor.18 For maximum
parallelization, this requires the same sequence of instructions to 0.01
450 500 550 600 650 700 750 800
be independently applied to multiple data. Since the hyperspec- Wavelength (nm)
tral data are discretized in pixels and wavelengths, doing indi-
vidual processing on pixels and wavelengths is the natural way Fig. 1 The absorption coefficients of blood,22 water,23 fat,24 and
to parallelize the GPU processing. the melanin model13 for sun-protected north European skin
A photon transport model is iterated with respect to skin (μa;m;694 ¼ 350 m−1 ).
parameters, such as blood volume fraction and melanin concen- −b −4
tration. In order to apply the same sequence of GPU instructions λ Mie λ
μs0 ðλÞ¼100m−1 · aMie þaRay :
for all data, the iteration strategies will be limited to rather sim- 500nm 500nm
ple iteration strategies. To fulfill the independency requirement,
(2)
each pixel in the hyperspectral image is treated as an indepen-
dent diffuse reflectance spectrum measured on a laterally infinite Bashkatov et al.26 give aMie ¼ 18.780, aRay ¼ 17.6, and
layered medium. It is possible to achieve pixel interdependency bMie ¼ 0.22 as values for the coefficients in the expression.
and nondeterminism, but at the cost of reducing GPU processing This is based on data obtained from whole skin ex vivo samples,
optimality. This is not applied in this preliminary study. and is used for both dermis and epidermis. The anisotropy factor
The GPU code was designed for a computer with an Intel g is modeled as
Core i7 CPU (8 cores), 6 GB RAM and an NVIDIA GeForce
GTX 670 GPU. Debian GNU/Linux (jessie) was used as the gðλÞ ¼ 0.62 þ λ · 29 · 10−5 ; (3)
operating system. The code was integrated into a hyperspectral
streaming framework developed by the Norwegian Defence reported by Van Gemert et al.27 The index of refraction used for
Research Establishment.19 both skin layers was 1.4.
Light transport model. The light transport model is based
2.2 Optical Modelling on a diffusion model with isotropic source functions, derived
by Svaasand et al.11 This model is used to obtain diffuse reflec-
2.2.1 Inverse model
tance as a function of wavelength and skin optical parameters.
Skin model. The skin model applied in the inverse model is The diffusion model has fast, analytic solutions well suitable for
a two-layered model which was previously described by Spott a real-time computing environment. In the diffusion approxima-
et al.,13 Randeberg et al.,20,21 and Svaasand et al.11 In short, it tion, it is assumed that scattering dominates over absorption.
consists of two planar layers. The first layer represents an epi- This assumption is less valid below 600 nm for skin due to
dermal layer of finite thickness containing melanin and a small the high absorption coefficients for hemoglobin and melanin
amount of blood. Blood is added to the epidermal layer to cor- (see Fig. 1). It has been shown that the approximation still
rect for the depth variations of the papillae. The second layer is a results in reflectances close to Monte Carlo simulations for
homogeneous, semi-infinite dermal layer containing blood and the 450–800 nm spectral range.20
other chromophores evenly distributed throughout the layer. The error between the Monte Carlo model and the diffusion
The applied melanin absorption model was adapted from approximation was reported by Randeberg et al.20 to be mini-
Spott et al.13 and is given as mized by applying a constant scaling factor to the absorption
−3.46 coefficients in the diffusion model. This scaling factor has not
λ been explicitly applied. However, a constant deviation is present
μa;m ðλÞ ¼ μa;m;694 · : (1)
694 nm in all extracted parameters, as found by Randeberg et al.20 The
extracted parameters are thus expected to characterize the relative
The melanin content is denoted by the melanin absorption at variations of properties between different tissues well.
694 nm (μa;m;694 ) in units of m−1 . The absorption in blood is A Monte Carlo-based inverse model will not fulfill real-time
assumed to arise from deoxygenated and oxygenated hemo- requirements, even if they are GPU-accelerated.7 Typical com-
globins.22 It depends on the blood volume fraction (BVF) and puting times for 1600 pixels and 160 wavelengths, based on our
oxygen saturation (oxy). A constant background absorption of own experiences, are in the order of days.
25 m−1 was added to the model.11 Absorption spectra of hemo- The derivation of the diffusion model assumes a laterally
globin, fat, and melanin are shown in Fig. 1. homogeneous skin model within the range of a few mean trans-
In the model, the absorption spectra are multiplied by their port lengths. A valid application of the diffusion model to single
volume fractions and summed to yield the total wavelength- hyperspectral pixels would require the lateral broadening of the
dependent dermal absorption coefficient, μa;d ðλÞ. light to be smaller than the spatial width of the hyperspectral
The reduced scattering coefficient in the tissue is modeled by pixel. Since this is not the case, photons will be scattered
an expression given by Jacques25 from pixel to pixel. The properties extracted from a single
Journal of Biomedical Optics 066003-2 June 2014 • Vol. 19(6)
Downloaded From: https://www.spiedigitallibrary.org/journals/Journal-of-Biomedical-Optics on 14 Jan 2021
Terms of Use: https://www.spiedigitallibrary.org/terms-of-use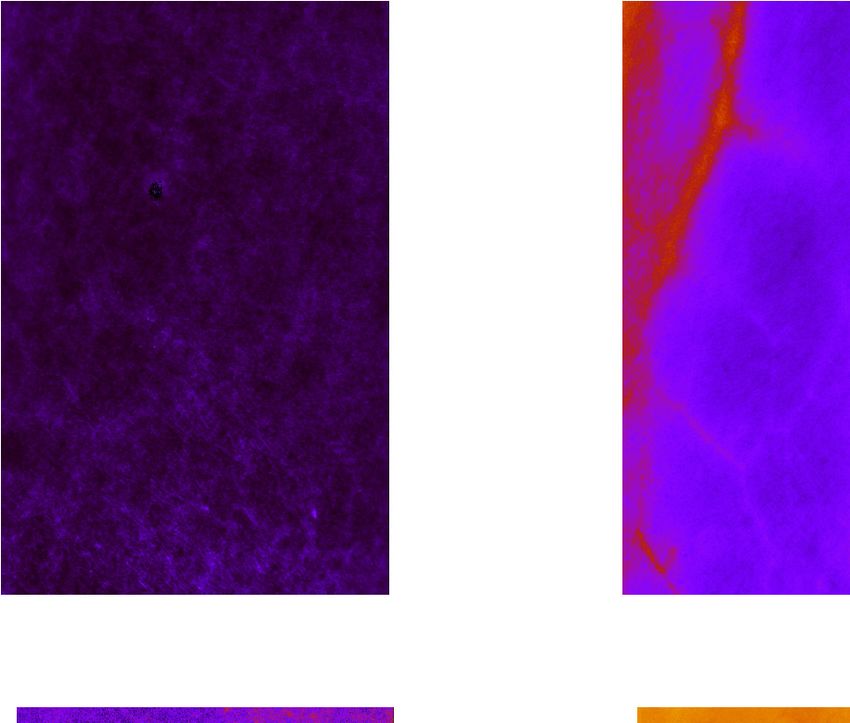
Bjorgan, Milanic, and Randeberg: Estimation of skin optical parameters for real-time hyperspectral imaging applications

                pixel will therefore be influenced by the surrounding pixels.                          The parameters used in Eq. (2) are assumed to have a slow
                This effect has been further investigated in this study.                           spatial variation for normal skin tissues and can be assumed
                                                                                                   fixed, although they may be different for different types of
                Fitting algorithm. The diffusion model is applied to calcu-                        tissues. The thickness of the epidermis varies by person and
                late the wavelength-dependent diffuse reflectance. By compar-                      location, and thickness under- or overestimation results in either
                ing the calculated reflectance against a measured reflectance, the                 a lowered or increased melanin content.
                skin parameters may be found iteratively. The iteration strategy                       The fitted parameters within the chosen skin model, as
                is designed with GPU implementation in mind, requiring inde-                       applied to a given wavelength interval, are:
                pendence across wavelengths and pixels and determinism in the
                set of instructions used. The iteration strategy is therefore based                    • melanin absorption in epidermis
                around the independent estimation of the epidermal and dermal                          • BVF in dermis
                absorption coefficients using Newton–Rhapson’s method28 and                            • oxygen saturation of the blood in dermis
                the spectral unmixing of these.
                                                                                                       • other chromophores (in this paper: water, fat, and constant
                    The number of layers is kept down to two layers in order to
                keep the number of fitted parameters down to a minimum, thus                               baseline absorption).
                simplifying the reflectance expression. It is known that the skin                      The basic fitting procedure is outlined in Fig. 3. The dermal
                is a nonhomogeneous organ and is approximated more accu-                           absorption coefficient μa;d is estimated and unmixed at two
                rately by three or more skin layers. The two-layered skin model                    wavelength intervals following determination of melanin in
                is, therefore, applied on separate wavelength ranges where the                     epidermis. The melanin extraction method is outlined in
                penetration depth can be assumed to be more or less uniform                        Fig. 4. The melanin absorption coefficient μa;m;694 is assumed
                across the given wavelength range. It is assumed that this                         to be 100 m−1 as a starting value.
                approach will yield the mean properties down to the given pen-                         The dermal absorption coefficients are derived for the wave-
                etration depth. This is illustrated in Fig. 2 and has been done                    length interval 730–830 nm. Melanin and hemoglobin are then
                previously by Randeberg et al.21 This approach is also similar                     fitted to the absorption coefficients. Next, the hemoglobin
                to work done by Tseng et al.29 and Saager et al.30 The two                         parameters are fixed and the epidermal absorption coefficients
                chosen fitting intervals are 510–590 and 690–820 nm. Light                         are derived. Melanin is then fitted to the epidermal absorption
                penetrates more superficially at the shorter wavelengths due to                    coefficients to get the corresponding melanin content. Using the
                the high absorption of hemoglobin and melanin, while light                         new melanin estimate, the method is run a second time to get the
                penetrates more deeply at the longer wavelengths (see Fig. 1).                     final estimate of the melanin content.
                The exact limits have been chosen through thorough testing on                          The wavelength-dependent dermal absorption coefficient is
                real data and close observation of the chromophore absorption                      then found across the entire spectral range. Due to a linear rela-
                spectra. Typical mean optical penetration depths through dermis                    tionship between the chromophore absorption coefficients and
                are estimated to around 200 μm for 510–590 nm and above                            the total dermal absorption, the chromophore contributions to
                500 μm for 690–820 nm.                                                             the dermal absorption spectrum are found using a spectral
                    The fixed parameters within the chosen skin model are:                         unmixing algorithm.
                                                                                                       The chromophore spectra for this unmixing procedure are
                    • scattering coefficients [Eq. (2)]                                            known a priori and only estimation of chromophore volume
                    • thickness of the layers (100 μm for epidermis).
                                                                                                   fractions is desired for the spectral unmixing part. For a single
                                                                                                   pixel, the derived dermal absorption can be written as

                                                                                                   μ~ a;d ¼ A~x;                                                       (4)

                                                                                                   where the matrix A consists of the chromophore absorption
                                                                                                   spectra and ~x are the concentrations fx0 ; x1 ; x2 ; : : : g of each
                                                                                                   material to be found under a non-negativity constraint.
                                                                                                      The sequential coordinate-wise algorithm for non-negative
                                                                                                   least-squares problems (SCA)31 is used to estimate the solutions
                                                                                                   to Eq. (4), and thus unmix the absorption spectra. This algorithm
                                                                                                   has no proven convergence guarantees, but is reportedly fast. It

                Fig. 2 Illustration of the two-layered skin model applied to a three-lay-
                ered situation. The two-layered skin model approximates the proper-
                ties of multiple, inhomogeneous layers to a single, homogeneous and
                semi-infinite (s.i.) layer where the derived properties are distributed
                evenly throughout the layer. Different parts of the diffuse reflectance            Fig. 3 Outline of the inverse model algorithm, where the absorption in
                spectrum contain information about different penetration depths.                   dermis is corrected for melanin in epidermis.

                Journal of Biomedical Optics                                               066003-3                                              June 2014   •   Vol. 19(6)

Downloaded From: https://www.spiedigitallibrary.org/journals/Journal-of-Biomedical-Optics on 14 Jan 2021
Terms of Use: https://www.spiedigitallibrary.org/terms-of-use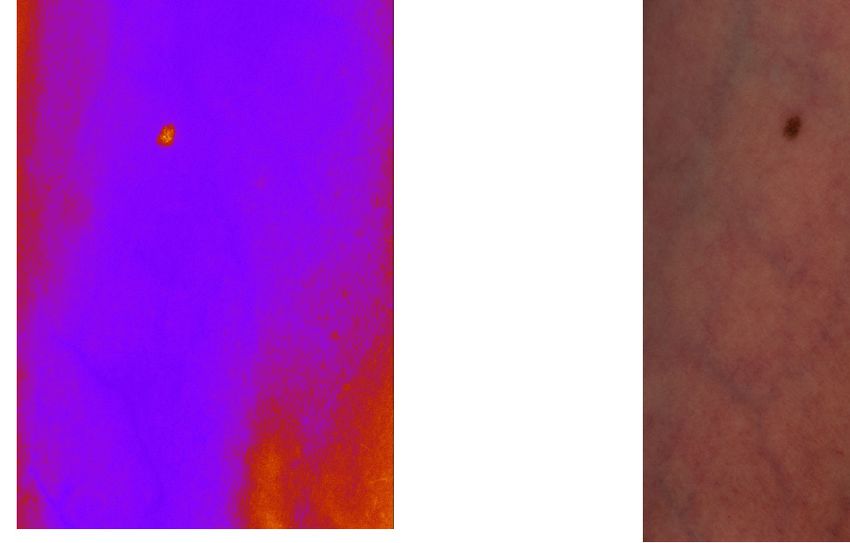
Bjorgan, Milanic, and Randeberg: Estimation of skin optical parameters for real-time hyperspectral imaging applications

                                                                                                   ease the applicability of the inverse diffusion model since the
                                                                                                   same optical properties are modeled. The main purpose of
                                                                                                   the simulations is to:

                                                                                                       • Test the accuracy of the optical parameters given by the
                                                                                                           inverse diffusion model.
                                                                                                       • Test the applicability of the one-dimensional (1-D) diffu-
                                                                                                           sion model to describe a 3-D situation.
                                                                                                       A 1-D Monte Carlo model7 was used to simulate reflectance
                                                                                                   spectra. The melanin in epidermis and the BVF in the superficial
                                                                                                   dermal layer were varied. The inverse model was tested for its
                                                                                                   ability to estimate the changes in these parameters and the sta-
                                                                                                   bility of the other estimated parameters (oxygenation and BVF
                                                                                                   in the deeper dermal layer). The skin model is shown in Fig. 5.
                                                                                                   The melanin absorptions corresponded to lightly and more
                                                                                                   pigmented Caucasian skin. Diffuse reflectance spectra in the
                                                                                                   wavelength range between 400 and 848 nm with a step size of
                                                                                                   2 nm were simulated.
                                                                                                       The inverse diffusion model used to derive optical properties
                                                                                                   from the 1-D Monte Carlo spectra involved the use of an ordinary
                                                                                                   non-negative least-squares algorithm34 for the unmixing of the
                                                                                                   absorption spectra, instead of SCA unmixing as presented earlier.
                                                                                                   This was done in order to evaluate the performance of SCA
                                                                                                   against a more ordinary non-negative least-squares algorithm.
                                                                                                       The iteration strategy has been evaluated against results
                Fig. 4 Outline of the melanin estimation algorithm. The method is run              obtained using MATLAB’s (Version 8.1.0.604, The Math-
                on the wavelength interval from 730 to 830 nm, and is run twice.                   Works Inc., Natick, Massachusetts, USA) lsqcurvefit routine,
                                                                                                   using a Trust-region reflective optimization approach with upper
                requires only the matrix H ¼ AT A and optimizes with respect to                    and lower boundary constraints. This was run on the wavelength
                one variable at a time, suitable for a memory-effective GPU par-                   range 690–820 nm for all 1-D Monte Carlo spectra.
                allelization in a demonstration prototype.                                             We also performed 3-D Monte Carlo simulations to test the
                    The unmixing of the dermal absorption coefficient deter-                       applicability of the 1-D diffusion model on single pixels in
                mines the fitted chromophores (hemoglobin, water, fat, and                         a mock hyperspectral image. An implementation of 3-D
                the constant baseline absorption) in two separate wavelength                       Monte Carlo developed by Milanic and Majaron35 was used to
                intervals. In addition, melanin is included in the fitting to rectify              obtain reflectance images of a 1-mm diameter junctional nevus,
                potential melanin underestimation in epidermis.                                    and an intradermal vessel at a depth of 0.25 mm and with
                                                                                                   a diameter of 0.2 mm. Skin geometries are shown in Figs. 6
                                                                                                   and 7. The simulated wavelength range for the diffuse reflec-
                2.2.2    Numerical simulations                                                     tance was 42 wavelengths from 687 to 835 nm with a step
                                                                                                   size of 3.6 nm. This wavelength discretization was used in
                Reflectance spectra simulated using a four-layered Monte Carlo                     order to simulate a hyperspectral dataset.
                model were used to test the reliability of the inverse diffusion                       The blood vessel was simulated using the blood absorption
                model. In the Monte Carlo model, the dermis was subdivided                         and scattering values from Friebel et al.36 and a blood oxygena-
                into two layers, the first representing papillary dermis, and the                  tion of 95%. The refraction index of the vessel was set to
                second reticular dermis. The fourth layer represented a blood-
                less subcutaneous layer containing 40% fat and 60% back-
                ground absorption. The implemented background absorption
                was taken from Salomatina et al.32

                μa;b ðλÞ ¼ 100 m−1 · ð0.82 þ 16.82e−ðλ−400 nmÞ∕80.5 nm Þ:
                                                                                        (5)

                    The reduced scattering coefficient in subcutis was modeled
                by an expression given by Naglic et al.,33 comparable to the scat-
                tering coefficients reported by Salomatina et al.,32

                μs0 ðλÞ ¼ 1500m−1 · ð16.34 þ 303.8e−λ∕180.3 nm Þ:                       (6)

                    The refraction index n was set to 1.4 for all layers. Dermis
                was modeled using blood and the constant background absorp-                        Fig. 5 Geometry of the one-dimensional (1-D) Monte Carlo forward
                tion presented earlier in Sec. 2.2.1. The reduced scattering coef-                 model used to simulate skin reflectance. Parameter values within
                ficient for dermis was calculated using Eq. (2). This will serve to                brackets are varied, the other parameters are fixed.

                Journal of Biomedical Optics                                               066003-4                                          June 2014   •   Vol. 19(6)

Downloaded From: https://www.spiedigitallibrary.org/journals/Journal-of-Biomedical-Optics on 14 Jan 2021
Terms of Use: https://www.spiedigitallibrary.org/terms-of-use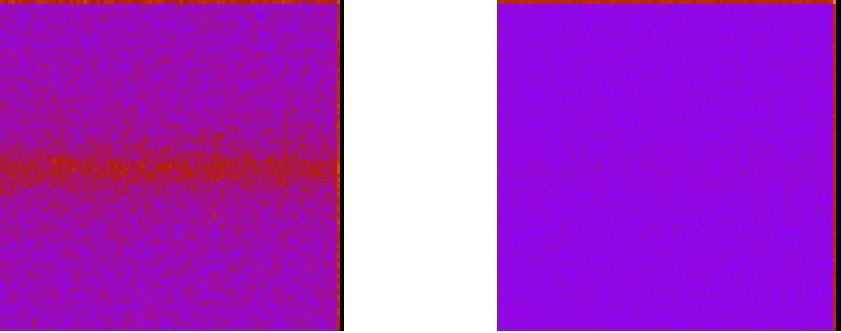
Bjorgan, Milanic, and Randeberg: Estimation of skin optical parameters for real-time hyperspectral imaging applications

                                                                                                   Fig. 7 Geometry of the skin model containing a mole. The mole was
                Fig. 6 Geometry of the skin model containing a superficial vessel.                 modeled as a circular area with increased melanin content. A horizon-
                The vessel was modeled as a circular tube. A horizontal cross section              tal cross section through the center of the mole is shown on top.
                through the center of the vessel is shown on top. A vertical cross sec-            A vertical cross section is shown below. The image scale of the
                tion is shown below. The image scale of the vertical cross section                 vertical cross section differs from the horizontal cross section.
                differs from the horizontal cross section.

                                     6.9 · 103 7.6 · 108                                           scanned at a speed of 30 ms per line of data, which was also
                nðλÞ ¼ 1.357 þ                þ          ;                              (7)        chosen to be the real-time deadline limit for the processing.
                                        λ2        λ4                                                   The lens had a focal length of 30 cm. The pixel field of view
                as reported by Li et al.37                                                         was approximately 0.4 mrad.38 Pixel size on the skin surface
                   The inverse diffusion model used for the 3-D Monte Carlo                        after magnification using a 30 cm lens was approximately
                signals involved SCA unmixing for the unmixing of the absorp-                      60 × 60 μm.
                tion spectra, as presented earlier in Sec. 2.2.1.                                      Two linear light sources were used for illumination (Model
                                                                                                   2900 Tungsten Halogen, Illumination Technologies, New York).
                                                                                                   Polarizers were mounted on the camera lens and the light sources
                                                                                                   (VLR-100 NIR, 450–1100 nm, Meadowlark Optics, Frederick,
                2.3     Experimental
                                                                                                   Colorado) in order to avoid specular reflection.
                The developed inverse diffusion model was also tested on mea-                          The images were converted into reflectance and corrected
                sured hyperspectral data.                                                          for uneven illumination across the field of view using a
                   Hyperspectral images of skin were collected using a push-                       Spectralon reflectance target (SRT-50-050 Reflectance Target,
                broom HySpex VNIR-1600 camera (Norsk Elektro Optikk,                               12.7 × 12.7 cm, ACAL Bfi Nordic AB, Uppsala).6 Spectral
                Lillestrøm, Norway).38 A healthy, female volunteer (Caucasian,                     variations in the specified intensity of the reflectance standard
                39 years old) with fair skin (Fitzpatrick skin type I/II) had the                  were taken into account in the conversion. The images were
                volar side of her forearm imaged. Two images were obtained.                        denoised using the maximum noise fraction transform (MNF).39
                The first image was obtained as a baseline. The second
                image was obtained after 5 min of occlusion induced by apply-                      3       Results
                ing a blood pressure cuff. This was done in order to modulate                      3.1      Timing Results
                the oxygenation and blood content in the skin. The images had
                a size of 1600 pixels ðsamplesÞ × 160 wavelengths ðbandsÞ×                         The specific timing results for each GPU operation as applied on
                a varying number of lines. Hyperspectral data lines were                           a 1600 samples × 160 bands hyperspectral data line are shown

                Journal of Biomedical Optics                                               066003-5                                             June 2014   •   Vol. 19(6)

Downloaded From: https://www.spiedigitallibrary.org/journals/Journal-of-Biomedical-Optics on 14 Jan 2021
Terms of Use: https://www.spiedigitallibrary.org/terms-of-use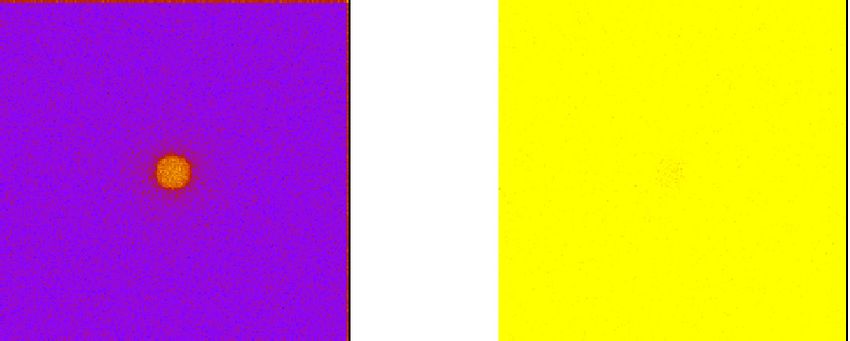
Bjorgan, Milanic, and Randeberg: Estimation of skin optical parameters for real-time hyperspectral imaging applications

                                       Fig. 8 Total computational times for the inverse modelling of one hyperspectral line of data. Three wave-
                                       length intervals were used in the unmixing of the dermal absorption, the line of data had 1600 samples ×
                                       160 bands of data.

                in Fig. 8. The final results, i.e., melanin and the blood param-                   and 1% and 3% for the higher melanin content, respectively. The
                eters from different wavelength intervals, are delivered within                    inverse diffusion model has random variations in the extracted
                3.5 ms. This computation time is well within the real-time dead-                   melanin parameter, while the objective fit is more or less stable.
                line limit imposed by the hyperspectral system, meeting the fast                   The melanin extracted from the blue–green wavelength interval
                computing requirement, and leaving GPU time for other future                       for the objective fit has systematic deviations with increasing
                processing operations.                                                             BVF in the superficial dermal layer.
                                                                                                       The oxygenations extracted from the NIR wavelength range
                3.2     Simulation Results                                                         agree with each other across the two methods, as do the BVFs.
                                                                                                   The extracted oxygenation in the NIR wavelength range
                3.2.1      One-dimensional Monte Carlo modeling                                    decreases by 2–3 percentage points with respect to the increased
                The GPU inverse diffusion model was evaluated on diffuse                           BVF in the superficial dermal layer. The oxygenation in the
                reflectance spectra obtained by a multilayered, 1-D Monte                          blue–green wavelength range does not change with respect to
                Carlo model. This was compared against an ordinary inverse                         the BVF for the inverse diffusion model. For the objective fit,
                diffusion model based on multivariate objective fitting (due                       the oxygenation in the blue–green wavelength range increases
                to potential confusion, henceforth referred to as “the objective                   for increased BVF in the upper dermal layer. The BVFs
                fitting”). The BVFs extracted from the wavelength range 510–                       extracted from the NIR wavelength range using either method
                590 nm are plotted in Fig. 10. The means and standard devia-                       follow a small increase with increasing blood volume in the
                tions of the other parameters are displayed in Table 1. A full list                upper dermal layer.
                of extracted parameters is shown in Table 2. Some Monte Carlo                          The oxygenation in the NIR wavelength range extracted
                spectra and their inverse diffusion model fits are shown in Fig. 9.                using the inverse diffusion model is lower compared to the
                    The melanin estimates from the diffusion inverse model and                     input oxygenation in the lower dermal layer. The oxygenation
                objective fitting at the near infrared (NIR) wavelength range are                  in the blue–green wavelength range is higher compared to the
                overestimated by 16% and 15% for the lower melanin content                         input oxygenation in the upper dermal layer.

                Table 1 Mean and standard deviation for extracted parameters from the multilayered Monte Carlo forward model. Statistics were computed across
                the dataset generated by varying the blood volume fraction (BVF) in the superficial dermal layer from 0.5% to 3.0% in steps of 0.5%. The extracted
                parameters are the melanin absorption at 694 nm (μa;m;694 ), the oxygenation in the 510–590 and 690–820 nm wavelength intervals (oxy510−590 ,
                oxy690−820 ) and the BVF in the 690–820 nm wavelength interval (BVF690−820 ). Inv. DM is the inverse diffusion model, obj. fit is the inverse diffusion
                model using a multivariate objective fitting scheme. Input oxygenation for the superficial and deep dermal layer was 50% and 80%, respectively.
                BVF in the deep dermal layer was 3%.

                Method                Input μa;m;694 (m−1 )             Output μa;m;694 (m−1 )             oxy510−590            oxy690−820                BVF690−820

                Inv. DM                       227                              264  7                     0.65  0.01           0.77  0.01            0.026  0.002

                Inv. DM                       683                              692  11                    0.67  0.01           0.76  0.03            0.026  0.002

                Obj. Fit                      227                              230  39                    0.66  0.02           0.76  0.02            0.025  0.002

                Obj. Fit                      683                              682  31                    0.70  0.03           0.77  0.02            0.028  0.002

                Journal of Biomedical Optics                                               066003-6                                            June 2014    •   Vol. 19(6)

Downloaded From: https://www.spiedigitallibrary.org/journals/Journal-of-Biomedical-Optics on 14 Jan 2021
Terms of Use: https://www.spiedigitallibrary.org/terms-of-use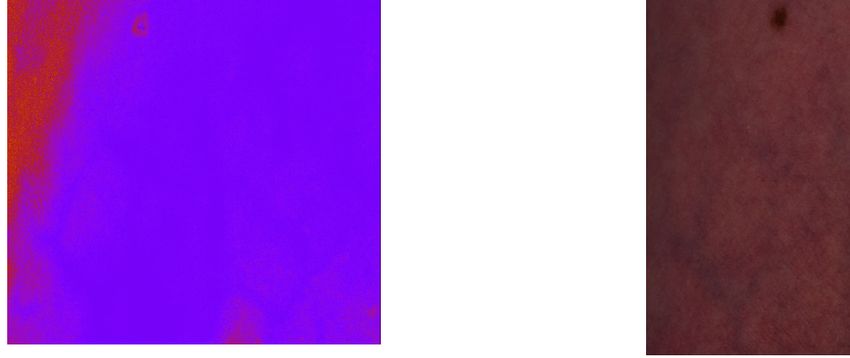
Bjorgan, Milanic, and Randeberg: Estimation of skin optical parameters for real-time hyperspectral imaging applications
Table 2 Extracted parameters from the one-dimensional (1-D) Monte Carlo forward model for the different inverse models. The number below the
parameter name denotes from which wavelength range the parameter was extracted (510–590 or 690–820 nm). μa;m is the epidermal melanin
absorption coefficient at 694 nm. Input oxygenation for the superficial and deep dermal layer was 50% and 80%, respectively. Blood volume fraction
(BVF) in the deep dermal layer was 3%.
Input parameters Inv. DM Objective fit, DM
μa;m BVF1 μa;m oxy1 BVF1 oxy2 BVF2 μa;m;1 oxy1 BVF1 μa;m;2 oxy2 BVF2
227 0.005 254 0.66 0.017 0.77 0.023 248 0.63 0.018 260 0.78 0.023
227 0.0075 263 0.65 0.019 0.79 0.024 235 0.63 0.020 261 0.78 0.024
227 0.01 260 0.64 0.022 0.78 0.025 226 0.63 0.022 259 0.78 0.024
227 0.0125 266 0.63 0.024 0.79 0.024 218 0.64 0.025 265 0.78 0.024
227 0.015 252 0.64 0.027 0.76 0.025 206 0.66 0.027 259 0.76 0.025
227 0.0175 271 0.65 0.028 0.79 0.025 201 0.67 0.030 266 0.78 0.025
227 0.02 262 0.64 0.031 0.76 0.027 187 0.66 0.033 260 0.76 0.026
227 0.0225 264 0.65 0.033 0.75 0.027 179 0.68 0.036 257 0.74 0.027
227 0.025 273 0.65 0.035 0.76 0.028 172 0.68 0.039 261 0.75 0.027
227 0.0275 267 0.66 0.038 0.75 0.029 160 0.69 0.042 260 0.74 0.027
227 0.03 275 0.66 0.040 0.76 0.028 151 0.70 0.045 265 0.75 0.027
683 0.005 697 0.70 0.019 0.80 0.022 702 0.67 0.019 710 0.81 0.025
683 0.0075 710 0.67 0.021 0.80 0.026 690 0.67 0.022 706 0.79 0.026
683 0.01 709 0.67 0.024 0.79 0.026 686 0.68 0.024 706 0.79 0.026
683 0.0125 689 0.67 0.028 0.76 0.025 673 0.69 0.027 703 0.78 0.027
683 0.015 701 0.64 0.030 0.78 0.026 669 0.68 0.030 705 0.78 0.027
683 0.0175 685 0.65 0.034 0.78 0.027 659 0.70 0.033 711 0.78 0.027
683 0.02 679 0.67 0.037 0.73 0.023 648 0.72 0.036 705 0.76 0.028
683 0.0225 680 0.66 0.040 0.74 0.027 639 0.72 0.039 702 0.76 0.029
683 0.025 687 0.67 0.042 0.73 0.026 633 0.73 0.042 705 0.75 0.029
683 0.0275 687 0.67 0.045 0.73 0.027 622 0.73 0.046 704 0.75 0.030
683 0.03 693 0.68 0.048 0.74 0.028 621 0.75 0.049 701 0.74 0.030
The BVFs in Fig. 10 follow the increase in the BVF in using the following definition of the mean optical penetration
the upper dermal layer. The values are overshot compared to depth,40
the BVF extracted from the NIR wavelength range.
sffiffiffiffiffiffiffiffiffiffiffiffiffiffiffiffiffiffiffiffiffiffiffiffiffiffiffiffiffiffiffiffiffiffiffiffiffiffi
1
δ¼ ;
3.2.2 Three-dimensional Monte Carlo modeling 3½ð1 − gÞμs þ μa μa
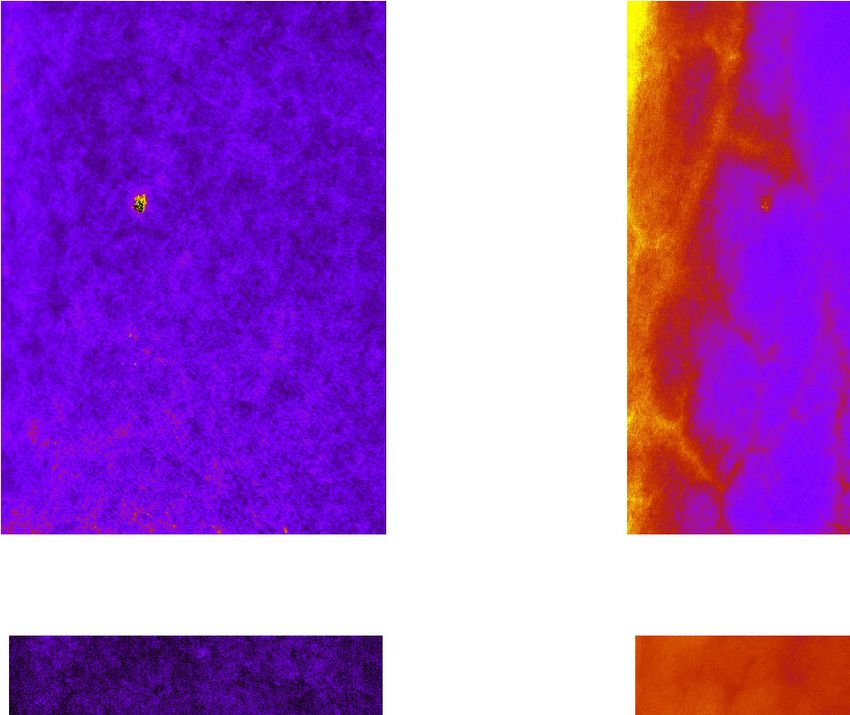
Results of applying the hyperspectral inverse model to a 3-D
Monte Carlo model of a mole are shown in Fig. 11. The 3-D and the modeled absorption and scattering coefficients at
vessel results are shown in Fig. 12. 687 nm. The BVF is about 3.7%. The oxygen saturation
The determined melanin values outside the mole are around stays constant at 100%. Both of these parameters are extracted
250 m−1 . The determined melanin values inside the mole from the 690–820 nm wavelength interval. Some random, dis-
approach 650 m−1 . Melanin input values were 225 and connected pixels inside the mole have a slightly lowered oxy-
1135 m−1 , respectively. Increased melanin values are seen out- genation saturation, to around 97%. This is likely due to
side of the mole boundary. The mean optical penetration depth increased noise levels in the mole due to higher absorption.
can be calculated to be approximately 0.97 mm in dermis and The determined melanin values for the vessel image stay
0.2 mm in the epidermis of the mole area. This was calculated constant to about 250 m−1 . The BVFs outside the vessel are
Journal of Biomedical Optics 066003-7 June 2014 • Vol. 19(6)
Downloaded From: https://www.spiedigitallibrary.org/journals/Journal-of-Biomedical-Optics on 14 Jan 2021
Terms of Use: https://www.spiedigitallibrary.org/terms-of-useBjorgan, Milanic, and Randeberg: Estimation of skin optical parameters for real-time hyperspectral imaging applications
0.7 800 1
Diffusion model fit 700
0.6
Oxygen saturation
Monte Carlo simulation 0.8
600
µ a,m, 694 (m -1)
Ref lectance 0.5 500 0.6
0.4 400
300 0.4
0.3 1
200
0.2 2 0.2
100
0.1 3 0 0
(a) (b)
0
400 450 500 550 600 650 700 750 800 850
Fig. 11 Melanin content (a) and oxygenation for 690–820 nm
(nm)
(b) extracted from the 3-D Monte Carlo model of a mole. Blood volume
fraction was as in Fig. 12 outside the vessel.
Fig. 9 Monte Carlo simulations and their corresponding diffusion
model fits. Spectrum 1 corresponds to a melanin absorption of
227 m−1 while both spectra 2 and 3 have a melanin absorption of
illuminated and in focus. The approximate width and height
683 m−1 . Blood volume fractions (BVFs) in the upper dermal layer of the imaged subsetted area are 60 and 120 mm.
are respectively 1%, 1%, and 3%. Dots in the graph are not indicative The total time used to process the subsetted (1800 lines ×
of fitting points and are only used for discrimination. Fitted wavelength 900 samples) image was 7 s.
ranges were 510–590 and 690–820 nm. Water and fat were fitted for the absorption spectra, but are
not shown here.
around 3.7%, while the area above the vessel approaches 5.0%. Focus and illumination problems in the experimental data are
The modeled BVF in dermis was 1.0%, while the vessel was propagated into an overestimation of the BVF and melanin in
assumed to be a small tube with pure blood absorption, located the upper left corner and lower right corner of the image. These
at a depth of 0.25 mm. The increased BVF ranges over an area artifacts in the data are due to the curvature of the arm. The
corresponding to a diameter of 0.5 mm. The oxygenation stays melanin content was estimated to be about 600 m−1 in the cen-
constant to 100% throughout the vessel. Both parameters were tral parts of the mole. The blood parameters extracted from
extracted from the 690–820 nm wavelength interval. either wavelength range show structures reminiscent of vessels.
After occlusion, the estimated blood content is increased
3.3 Hyperspectral Image Inverse Modeling Results both in normal tissue and in the blood vessels. The oxygenation
is decreased at both wavelength ranges. The melanin is more or
Red, green, and blue (RGB) images and results of the inverse less unaffected, although the melanin in the mole is decreased
model are shown in Figs. 13 and 14, before and after 5 min of compared to unaffected skin.
cuff-induced occlusion of the arm, respectively. Individual spec-
tral fits are shown in Fig. 15. The images have been subsetted in 4 Discussion
order to ignore nonskin regions with a high signal-to-noise ratio
The aim of this paper is to present a proof of concept for a real-
and to analyze only the parts of the image that are well
time inverse modeling method for hyperspectral images of skin.
The steps in the inverse modeling approach have been chosen
0.05 in order to make a real-time implementation using GPU paralle-
µ a,m = 227 m -1 , obj. fit
µ a,m = 683 m -1 , obj. fit lization viable. A two-layered model is applied to multilayered
µ a,m = 227 m -1 , inv. DM tissue in each point of the hyperspectral image. The two-layered
0.045 µ a,m = 683 m -1 , inv. DM
1:1 line approach is verified through 1-D Monte Carlo simulations, while
the point-based approach is verified through the 3-D Monte Carlo
0.04
simulations. In addition, the model is applied to a set of basic
hyperspectral images to show the potential of the technique.
0.035 Large individual variations in optical properties can be
expected from measurements on in vivo tissue. The optical prop-
erties will vary as a function of temperature and hydration.41–44
Output BVF
0.03
Fixed spectra of optical properties are applied in the inverse
models, which have been obtained ex vivo under specific
0.025
conditions and after preparation techniques, which may affect
0.02 0.1 800
Blood volume fraction
700
0.08
600
0.015
µ a,m, 694 (m -1)
0.06 500
400
0.01 0.04 300
200
0.02
100
0.005 0 0
0.005 0.01 0.015 0.02 0.025 0.03 (a) (b)
Input BVF, MCML upper dermal layer
Fig. 12 Blood volume fraction for 690–820 nm (a) and melanin con-
Fig. 10 Output BVF from the wavelength range 510–590 nm. μa;m is tent (b) from the 3-D Monte Carlo model of a vessel. Oxygenation for
short for μa;m;694 . 690–820 nm was constant throughout the image, 100%.
Journal of Biomedical Optics 066003-8 June 2014 • Vol. 19(6)
Downloaded From: https://www.spiedigitallibrary.org/journals/Journal-of-Biomedical-Optics on 14 Jan 2021
Terms of Use: https://www.spiedigitallibrary.org/terms-of-useBjorgan, Milanic, and Randeberg: Estimation of skin optical parameters for real-time hyperspectral imaging applications
0.14 0.14 0.14 0.14
Blood volume fraction
Blood volume fraction
0.12 0.12
Blood volume fraction
Blood volume fraction
0.12 0.12
0.1 0.1 0.1 0.1
0.08 0.08
0.08 0.08
0.06 0.06
0.06 0.06
0.04 0.04
0.04 0.04
0.02 0.02
0.02 0.02
0 0
0 0 (a) (b)
(a) (b) 1 1
1 1
0.8 0.8
Oxygen saturation
Oxygen saturation
0.8 0.8
Oxygen saturation
Oxygen saturation
0.6 0.6
0.6 0.6
0.4 0.4
0.4 0.4
0.2 0.2
0.2 0.2 0 0
(c) (d)
0 0 800
(c) (d) 700
800
600
µ a,m,694 (m -1)
700
500
600 400
µ a,m,694 (m -1)
500 300
400 200
300 100
200 0
100
(e) (f)
0 Fig. 14 Extracted skin properties from the volar side of the forearm of
(e) (f) a Caucasian woman after 5 min of cuff-induced occlusion. These
properties are the blood volume fraction in (a) 510–590 nm and
Fig. 13 Extracted skin properties from the volar side of the forearm of (b) 690–820 nm, the oxygenation in (c) 510–590 nm and (d) 690–
a Caucasian woman. These properties are the blood volume fraction 820 nm, (e) the melanin content and (f) the RGB image.
in (a) 510–590 nm and (b) 690–820 nm, the oxygenation in (c) 510–
590 nm and (d) 690–820 nm, (e) the melanin content and (f) the RGB objective multivariate fit are comparable for the NIR wavelength
image.
range. Mainly the BVFs are comparable for the blue–green
wavelength range, while the objective fit deviates for the mela-
the coefficients.43,45 As a result, there will always be a large nin and oxygenation. This seems to be due to cross talk, possibly
uncertainty in the obtained tissue properties, no matter how between hemoglobin and melanin.
accurate the inverse model may be when applied on numerical
simulations. This has to be taken into account when setting the
0.7
accuracy requirements and evaluating these kind of methods.
In general, our developed inverse diffusion model provides a 0.6 1
mean of the tissue parameters. The resulting mean is a mean of 0.5
Ref lectance
2
all tissue parameters reached by the light. The model character- 0.4
izes the changes of this mean. The output parameters from
0.3
the simulations are stable despite the change in the BVF of
the upper dermal layer. The BVF extracted using the blue–green 0.2
wavelength range characterizes this change well. 0.1 Diffusion model fit
Measurement
The isotropic diffusion model is known to result in higher 0
reflectance values than the corresponding Monte Carlo reflec- 400 450 500 550 600 650 700 750 800 850
tance for the same set of input parameters and high absorp- (nm)
tion.20,46 This will explain the slightly increased melanin
values produced by the inverse diffusion model and the Fig. 15 Diffusion model fits of pixels located close to the mole.
Spectrum 1 is before occlusion, spectrum 2 is after 5 min of occlusion.
increased BVF extracted from the blue–green wavelength Note that the dots are used for differentiation and are not indicative of
range. The difference gets higher with increased input melanin fitting points. Fitted wavelength ranges were 510–590 and 690-
absorption. The results obtained using our methods and the 820 nm.
Journal of Biomedical Optics 066003-9 June 2014 • Vol. 19(6)
Downloaded From: https://www.spiedigitallibrary.org/journals/Journal-of-Biomedical-Optics on 14 Jan 2021
Terms of Use: https://www.spiedigitallibrary.org/terms-of-useBjorgan, Milanic, and Randeberg: Estimation of skin optical parameters for real-time hyperspectral imaging applications
The situation for the 3-D Monte Carlo model is comparable The extracted oxygenations are decreased after occlusion of the
to the results for the 1-D case. The melanin outside of the mole arm, which is expected.
has the same trend as for the 1-D situation. The determined In general, the oxygenation extracted from the blue–green
melanin content inside the mole is lowered compared to the wavelength interval is lower than the oxygenation extracted
input value, although there is no apparent misfitting. Using the from the NIR wavelength interval. This agrees with results
estimated penetration depths as an estimate of the mean trans- found by Tseng et al.,29 and is likely due to differences in
port length, it is clear that some of the light entering the mole vascularization down to the different penetration depths.21
will exit normal skin and vice versa. This results in a washed out The melanin is slightly underestimated for lower oxygen-
appearance of the mole and higher reflectance values inside the ations and at the locations of larger blood vessels. The former
mole region. This gives the surrounding pixels the appearance of is mainly due to cross talk with deoxyhemoglobin. The latter
a higher melanin content. The diffuse reflectance of the mole has may be due to both cross talk and changes in the boundary con-
a slightly higher diameter (1.5 mm) than the actual mole (1 mm). dition assumptions (e.g., changes in refraction indices).
This is to be expected in a highly scattering tissue. SCA was used in the unmixing process. While having no con-
The BVF extracted from 3D Monte Carlo is increased com- vergence guarantees, it still minimizes the differences between
pared to the BVF extracted from the 1-D Monte Carlo simula- the fitted and derived absorption coefficients. This is evident
tion. This is not due to the difference between 1-D and 3-D from the displayed spectra fits in Fig. 15. Still, it should not
Monte Carlo modelings, as the extracted properties outside both be trusted for the unmixing of larger wavelength intervals and
mole and vessel should be the same as for the 1-D case due to many chromophores. The experiences with the Monte Carlo sim-
similar assumptions. The source of this difference might be the ulations showed SCA to be less trustworthy than a more ordinary
SCA method, which was used for unmixing of the absorption. non-negative least-squares algorithm. SCA has, however, the ad-
SCA (sequential coordinate-wise algorithm for non-negative vantage of being more suitable for GPU implementation. Future
least-squares problems) was chosen for the unmixing of the work will involve improving the unmixing algorithms. This can
derived absorption coefficients in the hyperspectral images be done either by improving SCA, adapting other non-negative
due to its suitability for GPU implementation. This method was least-squares GPU implementations,47 or by implementing a non-
not used in unmixing of the absorptions in the 1-D case, where negative least squares algorithm optimized for problems such as
an ordinary non-negative least-squares algorithm was applied. the unmixing of hyperspectral imagery.48
Illumination problems in the image lead to some artifacts in
The use of SCA apparently also results in increased oxygena-
the extracted parameters. This issue in the imaging technique is
tion. The oxygenation should be slightly lower than the input
currently being addressed in another study which aims to use
oxygenation of 95%. This can be traced to a cross talk between
3-D modeling to obtain a digital elevation model and flatten
the constant baseline absorption and the blood absorptions,
the image.
where SCA encounters more challenges than an ordinary non-
The developed model is a proof of concept where we have
negative least-squares algorithm.
shown the possibility of characterizing spatially resolved tissue
The changes are still characterized well. The properties do not
properties in real-time. The model will still be further developed
change significantly across the mole, and an increased BVF is
to obtain more complexity and accuracy. The isotropic source
seen for the vessel area. Many scattering events give a washed- functions used in the model will be exchanged by more accurate
out appearance, which makes complete reconstruction difficult. Delta-Eddington source functions.46 No special assumptions
We are still able to extract useful information from the model. were made for the blood vessel distribution in the skin
The same behavior is seen for the experimental data. The model. It is known that assuming an average blood vessel diam-
properties have a washed-out, diffuse look due to lateral broad- eter will affect the apparent absorption levels in blood.49 The
ening. The characterized properties are, on the other hand, more lack of such a correction of the blood absorption may have
realistic than the properties extracted from the 3-D Monte Carlo affected the extracted blood oxygenation and BVF, and is some-
model. The oxygenation saturation for the NIR wavelength thing which will be implemented in the future.
range does not approach 100% and the BVFs are not unrealis- The initial results obtained from the hyperspectral images
tically high. It seems that the cross talk between the constant show promise in the characterization of tissue properties. The
baseline absorption and the blood parameters is not seen here. method can be used to identify interesting areas during image
With the results from the simulated mole in mind, we can scan, such as areas where the optical properties are changed (i.e.,
expect the melanin content to be underestimated inside the wounds, moles, bruises, or other skin lesions). Classification
real mole. This is seen. The other extracted parameters seem and statistical methods can be run on the estimated tissue prop-
to be affected by this. They were not affected for the 3-D Monte erties to automatize this identification process. The interesting
Carlo. This seems to be mainly due to a change in scattering areas may then be more closely investigated.
parameters. Compared to normal skin, scattering properties
are altered due to the structural difference of a mole. The method 5 Conclusion
does not rectify variations in scattering, though scattering var- An inverse photon transport model with real-time performance
iations may be observed in the more extreme cases by quantify- has been developed for a hyperspectral image scanning system
ing the misfit between the different wavelength ranges. using GPU parallelization. The model fulfills the real-time
The trends of the extracted parameters are as expected from analysis constraints set by the hyperspectral setup, leaving a lot
the experiences with the simulations. The BVFs are increased of computational time for additional image processing.
where blood vessels are localized. The vessels extracted from Simulations have shown that the inverse model has an ability
the NIR wavelength range are likely to carry venous blood to characterize changes in optical properties. Running the inverse
since the depths of these are less than the depths of the large model on hyperspectral images of skin shows promising results.
arteries. The oxygenation here is lowered compared to the oxy- Future work will involve improvement of the unmixing algo-
genation in the rest of the tissue, which is assumed to be correct. rithms and complexity of the models.
Journal of Biomedical Optics 066003-10 June 2014 • Vol. 19(6)
Downloaded From: https://www.spiedigitallibrary.org/journals/Journal-of-Biomedical-Optics on 14 Jan 2021
Terms of Use: https://www.spiedigitallibrary.org/terms-of-useBjorgan, Milanic, and Randeberg: Estimation of skin optical parameters for real-time hyperspectral imaging applications
Acknowledgments reflectance and transmission spectroscopy,” in Proc. Biomedical
Topical Meeting, SF4, Optical Society of America, Washington DC
Thanks to Norsk Elektro Optikk and the Norwegian Defence (2004).
Research Establishment for exchange of code. The Norwegian 25. S. L. Jacques, “Optical properties of biological tissues: a review,” Phys.
Research School in Medical Imaging has provided funding for Med. Biol. 58(11), R37–R59 (2013).
this project through the MedIm Bridging Grant. Thanks to 26. A. N. Bashkatov et al., “Optical properties of human skin, subcutaneous
and mucous tissues in the wavelength range from 400 to 2000 nm,”
Lukasz Paluchowski for help with the experimental work.
J. Phys. D: Appl. Phys. 38, 2543–2555 (2005).
27. M. J. C. van Gemert et al., “Skin optics,” IEEE Trans. Biomed. Eng.
36, 1146–1154 (1989).
References 28. W. H. Press et al., Numerical Recipes, Cambridge University Press,
1. G. Lu and B. Fei, “Medical hyperspectral imaging: a review,” J. Biomed. Cambridge, UK (2007).
Opt. 19(1), 010901 (2014). 29. S. Tseng et al., “Chromophore concentrations, absorption and scattering
2. T. Skauli et al., “A compact combined hyperspectral and polarimetric properties of human skin in-vivo,” Opt. Express 17, 14599–14617
imager,” Proc. SPIE 6395, 639505 (2006). (2009).
3. L. L. Randeberg, E. L. P. Larsen, and L. O. Svaasand, “Characterization of 30. R. B. Saager et al., “Method for depth-resolved quantitation of optical
vascular structures and skin bruises using hyperspectral imaging, image properties in layered media using spatially modulated quantitative
analysis and diffusion theory,” J. Biophotonics 3(1–2), 53–65 (2010). spectroscopy,” J. Biomed. Opt. 16(7), 077002 (2011).
4. E. L. Larsen et al., “Hyperspectral imaging of atherosclerotic plaques in 31. V. Franc, V. Hlavac, and M. Navara, “Sequential coordinate-wise algo-
vitro,” J. Biomed. Opt. 16(2), 026011 (2011). rithm for the non-negative least squares problem,” in Proc. Computer
5. J. Hernandez-Palacios et al., “Hyperspectral characterization of fluoro- Analysis of Images and Patterns, 11th International Conference, CAIP
phore diffusion in human skin using a scmos based hyperspectral cam- 2005, Versailles, France, September 5-8, 2005. Lecture Notes in
era,” Proc. SPIE 8087, 808717 (2011). Computer Science, Vol. 3691, pp. 407–414, Springer, New York (2005).
6. M. Denstedt et al., “Hyperspectral imaging as a diagnostic tool for 32. E. Salomatina et al., “Optical properties of normal and cancerous human
chronic skin ulcers,” Proc. SPIE 8565, 85650N (2013). skin in the visible and near-infrared spectral range,” J. Biomed. Opt.
7. E. Alerstam et al., “Next-generation acceleration and code optimization 11(6), 064026 (2006).
for light transport in turbid media using gpus,” Biomed. Opt. Express 33. P. Naglic et al., “Applicability of diffusion approximation in analysis of
1(2), 658–675 (2010). diffuse reflectance spectra from healthy human skin,” Proc. SPIE 9032,
8. Y. Tarabalka et al., “Real-time anomaly detection in hyperspectral 90320N (2013).
iimage using multivariate normal mixture models and gpu processing,” 34. R. J. Hanson and C. L. Lawson, Solving Least Squares Problems,
J. Real-Time Image Proc. 4(3), 287–300 (2009). Society for Industrial and Applied Mathematics, Philadelphia (1995).
9. N. Keshava and J. Mustard, “Spectral unmixing,” IEEE Signal Proc 35. M. Milanic and B. Majaron, “Three-dimensional monte carlo model of
Mag. 19, 44–57 (2002). pulsed-laser treatment of cutaneous vascular lesions,” J. Biomed. Opt.
10. L. Wang, S. L. Jacques, and L. Zheng, “Mcml monte carlo modeling of 16(12), 128002 (2011).
light transport in multi-layered tissues,” Comput. Meth. Prog. Bio. 36. M. Friebel et al., “Determination of optical properties of human blood in
47(2), 131–146 (1995). the spectral range 250 to 1100 nm using Monte Carlo simulation with
11. L. Svaasand et al., “Tissue parameters determining the visual appear- hematocrit-dependence effective scattering phase functions,” J. Biomed.
ance of normal skin and port-wine stains,” Laser Med. Sci. 10, Opt. 11(3), 034021 (2006).
55–65 (1995). 37. H. Li, L. Lin, and S. Xie, “Refractive index of human whole blood with
12. R. C. Haskell et al., “Boundary conditions for the diffusion equation in different types in the visible and near-infrared ranges,” Proc. SPIE 3914,
radiative transfer,” J. Opt. Soc. Am. A 11, 2727–2741 (1994). 517–521 (2000).
13. T. Spott et al., “Application of optical diffusion theory to transcutaneous 38. Hyspex VNIR-1600, “Main specifications,” http://www.hyspex.no/
bilirubinometry,” Proc. SPIE 3195, 234–245 (1998). products/hyspex/vnir1600.php (8 May 2014).
14. L. L. Randeberg et al., “A novel approach to age determination of trau- 39. A. A. Green et al., “A transformation for ordering multispectral data in
matic injuries by reflectance spectroscopy,” Laser Surg. Med. 38(4), terms of image quality with implications for noise removal,” IEEE T.
277–289 (2006). Geosci. Remote 26, 65–74 (1988).
15. R. Zhang et al., “Determination of human skin optical properties from 40. L. V. Wang and H. Wu, Biomedical Optics, Principles and Imaging,
spectrophotometric measurements based on optimization by genetic John Wiley & Sons, Hoboken, New Jersey (2007).
algorithms,” J. Biomed. Opt. 10(2), 024030 (2005). 41. J. Laufer et al., “Effect of temperature on the optical properties of ex vivo
16. T. Tseng et al., “Quantification of the optical properties of two-layered human dermis and subdermis,” Phys. Med. Biol. 43 2479–2489
turbid media by simultaneously analyzing the spectral and spatial infor- (1998).
mation of steady-state diffuse reflectance spectroscopy,” Biomed. Opt. 42. O. S. Khalil et al., “Temperature modulation of the visible and near
Express 2(4), 901–914 (2011). infrared absorption and scattering coefficients of human skin,” J.
17. H. Cen and R. Lu, “Quantification of the optical properties of two-layer Biomed. Opt. 8(2), 191–205 (2003).
turbid materials using a hyperspectral imaging-based spatially-resolved 43. T. Lister, P. A. Wright, and P. H. Chappell, “Optical properties of human
technique,” Appl. Opt. 48(29), 5612–5623 (2009). skin,” J. Biomed. Opt. 17(9), 090901 (2012).
18. CUDA Toolkit Documentation, CUDA C Programming Guide, 2012, 44. C. G. Rylander et al., “Dehydration mechanism of optical clearing in
http://docs.nvidia.com/cuda (8 May 2014). tissue,” J. Biomed. Opt. 11(4), 041117 (2006).
19. T. Skauli et al., “An airborne real-time hyperspectral target detection 45. E. K. Chan et al., “Effects of compression on soft tissue optical proper-
system,” Proc. SPIE 7695, 76950A (2010). ties,” IEEE J. Sel. Top. Quant. 2(4), 943–950 (1996).
20. L. L. Randeberg et al., “Performance of diffusion theory vs. monte carlo 46. T. Spott and L. O. Svaasand, “Collimated light sources in the diffusion
methods,” Proc. SPIE 5862, 58620O (2005). approximation,” Appl. Opt. 39, 6453–6465 (2000).
21. L. L. Randeberg et al., “In vivo spectroscopy of jaundiced newborn skin 47. Y. Luo and R. Duraiswami, “Efficient parallel nonnegative least squares
reveals more than a bilirubin index,” Acta Paediatr. 94(1), 65–71 on multicore architectures,” SIAM J. Sci. Comput. 33, 2848–2863 (2011).
(2005). 48. M. H. Van Benthem and M. R. Keenan, “Fast algorithm for the solution
22. W. G. Zijlstra, A. Buursma, and O. W. van Assendelft, Visible and Near of large-scale non-negativity-constrained least squares problems,”
Infrared Absorption Spectra of Human and Animal Haemoglobin, VSP, J. Chemometrics 18, 441–450 (2004).
Utrecht (2000). 49. L. O. Svaasand et al., “Therapeutic response during pulsed laser treat-
23. H. Buiteveld, J. M. H. Hakvoort, and M. Donze, “The optical properties ment of port-wine stains: dependence on vessel diameter and depth in
of pure water,” Proc. SPIE 2258, 174–183 (1994). dermis,” Laser Med. Sci. 10, 235–243 (1995).
24. R. L. P. van Veen et al., “Determination of vis-nir absorption
coefficients of mammalian fat, with time- and spatially resolved diffuse Biographies of the authors are not available.
Journal of Biomedical Optics 066003-11 June 2014 • Vol. 19(6)
Downloaded From: https://www.spiedigitallibrary.org/journals/Journal-of-Biomedical-Optics on 14 Jan 2021
Terms of Use: https://www.spiedigitallibrary.org/terms-of-useYou can also read


