DTI mapping of human brain connectivity: statistical fibre tracking and virtual dissection
←
→
Page content transcription
If your browser does not render page correctly, please read the page content below
NeuroImage 19 (2003) 545–554                                www.elsevier.com/locate/ynimg

     DTI mapping of human brain connectivity: statistical fibre tracking
                        and virtual dissection
                        P. Hagmann,a,b,* J.-P. Thiran,a L. Jonasson,a P. Vandergheynst,a
                                   S. Clarke,c P. Maeder,b and R. Meulib
                            a
                                Signal Processing Institute, Swiss Federal Institute of Technology, 1015 Lausanne, Switzerland
                                     b
                                       Department of Radiology, University Hospital, 1011 Lausanne-CHUV, Switzerland
                                   c
                                     Division of Neuropsychology, University Hospital, 1011 Lausanne-CHUV, Switzerland

                                      Received 7 October 2002; revised 31 January 2003; accepted 12 February 2003

Abstract
    Several approaches have been used to trace axonal trajectories from diffusion MRI data. If such techniques were first developed in a
deterministic framework reducing the diffusion information to one single main direction, more recent approaches emerged that were
statistical in nature and that took into account the whole diffusion information. Based on diffusion tensor MRI data coming from normal
brains, this paper presents how brain connectivity could be modelled globally by means of a random walk algorithm. The mass of
connections thus generated was then virtually dissected to uncover different tracts. Corticospinal, corticobulbar, and corticothalamic tracts,
the corpus callosum, the limbic system, several cortical association bundles, the cerebellar peduncles, and the medial lemniscus were all
investigated. The results were then displayed in the form of an in vivo brain connectivity atlas. The connectivity pattern and the individual
fibre tracts were then compared to known anatomical data; a good matching was found.
© 2003 Elsevier Science (USA). All rights reserved.

Keywords: Fibre tracking; Diffusion tensor imaging; Connectivity; Brain atlas

Introduction                                                                     tories like the corticospinal tract, the DT is strongly aniso-
                                                                                 tropic and its principal eigenvector corresponds to the di-
   Recent developments in diffusion MRI have put this                            rection of the fibre tract.
imaging modality to the forefront of interest among the                             These observations were used by several researchers to
neuroscientific community. The success of diffusion imag-                        develop fibre tracking algorithms that all have the same aim:
ing is related to the fact that during their random, diffusion-                  inferring from a DT field the axonal or at least bundles of
driven displacements, water molecules probe tissue struc-                        fibres trajectories—the diameter of an axon being well be-
ture at a microscopic scale well beyond the usual imaging                        yond the resolution of a current MRI scan. Impressive
resolution (LeBihan et al., 2001). It has been shown that, in                    results have been achieved and a wide spectrum of appli-
the brain, ordered axonal structure, cell membrane, and                          cations is foreseen. A better understanding of diffusion
myelin sheath strongly influence water diffusion (Beaulieu                       properties in many brain-related diseases, e.g., multiple
and Allen, 1994; Beaulieu, 2002) and that there is a direct                      sclerosis (Maldjian and Grossman, 2001; Filippi et al.,
link between water diffusion and axonal orientation and                          2001), dyslexia (Klingberg et al., 2000), Alzheimer’s dis-
integrity (Coremans et al., 1994; Wieshmann et al., 1999).                       ease (Rose et al., 2000; Bozzali et al., 2002), schizophrenia
In fact, when diffusion tensor (DT) imaging is performed                         (Lim et al., 1999; Foong et al., 2000), brain tumours (Field
within a compact tract with parallel running axonal trajec-                      et al., 2002; Mori et al., 2002a), periventricular leukomala-
                                                                                 cia (Hoon et al., 2002), as well as spinal cord injury
   * Corresponding author. Fax: ⫹41-21-693-76-00.                                (Mamata et al., 2002) should benefit from those develop-
   E-mail address: patric.hagmann@epfl.ch (P. Hagmann).                          ments. The understanding of normal brain function needs

1053-8119/03/$ – see front matter © 2003 Elsevier Science (USA). All rights reserved.
doi:10.1016/S1053-8119(03)00142-3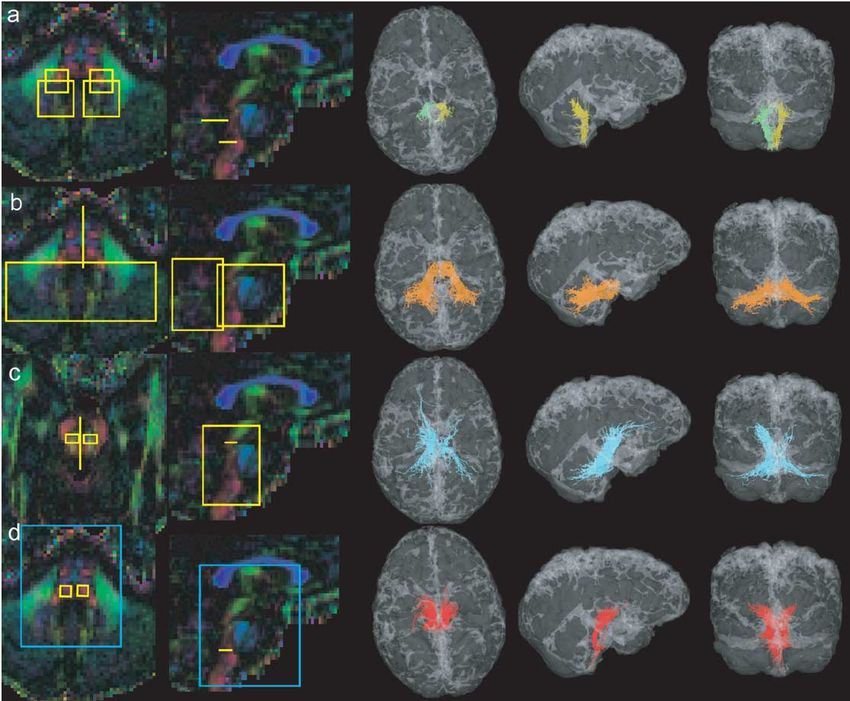
546                                                  P. Hagmann et al. / NeuroImage 19 (2003) 545–554

Fig. 1. Virtual dissection of the occipitofrontal fascicle and various connectivity maps as an example of the methodology. (a and b) Colour maps with ROIs.
(c) Fibres passing a posteriorly placed yellow ROI. (d) Fibres selected in part c and also passing in the second anterior yellow ROI. (e) Fibres selected in
ROI (part d) and that do not pass outside the blue frame. (f) Fibres selected in part e that have a VI above the 20th quantile. (g and h) Statistical density maps
of the fibres selected in f.
Fig. 2. Corticobulbar and -spinal tracts. ROIs on colour maps, 3D views, and statistical density maps. (a) Frontopontine tract (yellow), (b) corticospinal tract
(blue), (c) parieto-temporo-pontine tract (green).

not only the description of activated cortical areas, like that                     gates brain circuitry with a statistical random-walk-based
provided by fMRI, but also a detailed description of the                            algorithm.
underlying neuronal circuitry.
   Most of the algorithms used to infer bundles of fibres                           Material and methods
from DT imaging are based on a discrete resolution of the
integral curves of the vector field corresponding to the                            MRI data acquisition
reduction of the diffusion tensor to its largest eigenvector
(Conturo et al., 1999; Mori et al., 1999; Jones et al., 1999;                          The images used for this study were acquired with a 1.5
Basser et al., 2000; Tench et al., 2002). As opposed to those                       T clinical MRI scanner (Magnetom Symphony; Siemens,
deterministic integral path approaches, this work investi-                          Erlangen, Germany). The data were produced with a diffu-
P. Hagmann et al. / NeuroImage 19 (2003) 545–554                                                     547

Fig. 3. Corticothalamic, corpus callosum, and limbic system projections. ROIs on colour maps and 3D views. (a) Thalamic frontal projections (green), (b)
thalamic superior projections (red), (c) thalamic posterior projections (yellow), (d) corpus callosum projections (orange), (e) cingulum (green) and fornix
(red). The lower right image is a projection of the fornix onto an axial slice.

sion-weighted single-shot EPI sequence using the standard                        volunteers (one male and one female, both between 25- and
Siemens Diffusion Tensor Imaging Package for Symphony.                           30-years old). Informed consent from both subjects was
We acquired 44 axial slices in a 128 by 128 matrix size                          obtained in accordance with institutional guidelines.
covering the whole brain. The voxel size was 1.64 by 1.64
mm with a slice thickness of 3.00 mm without gap. Timing                         Data preprocessing
parameters were a TR of 1000 s and a TE of 89 s. Diffusion
weighting was performed along six independent axes ac-                              The data were processed with Matlab 6.1 (The Math-
cording to Basser’s polyhedral tessellation (Basser and Pier-                    works, Inc., Natick, MA, USA) running on a standard PC
paoli, 1998). We used a b-value of 1000 s/mm2 at a maxi-                         (PIII, 500 MHz). The DT was computed for each voxel by
mum gradient field of 30 mT/m. A normalizing T2 image                            linear combination of the log-ratio images (Basser and Pier-
without diffusion weighting was also acquired. In order to                       paoli, 1998). The data were then linearly interpolated in
increase the signal-to-noise ratio, the measures were aver-                      order to obtain a volume with a 3D regular grid of 1.64 mm
aged four times. An anatomical T1 magnetization prepared                         by side (matrix of 128 by 128 by 79). We computed then
3D rapid acquisition gradient echo (MPRAGE) was also                             some useful scalar images like the fractional anisotropy
performed during the same session. The whole examination                         (FA) map (Basser and Pierpaoli, 1996) and a colour map
lasted about 1 h. Images were obtained from two healthy                          (Pajevic and Pierpaoli, 1999).
548 P. Hagmann et al. / NeuroImage 19 (2003) 545–554
An important condition for any fibre tracking algorithm very sensitive to noise, especially in areas of low anisotropy
to work properly is to use a good mask on the tensor data. (Jones, 2003). The family of tracking algorithms that we
This mask prevents tracking in aberrant areas like the ven- could globally describe as deterministic reduce the tensor-
tricles or outside the brain. It forbids also areas where the to a vector-field (Conturo et al., 1999; Mori et al., 1999;
tensor data is uncertain for proper tracking of white matter Jones et al., 1999; Basser et al., 2000; Tench et al., 2002)
bundles, e.g., the cortex. Most authors used a binary thresh- and consequently do not take into account the uncertainty of
olded FA map as stopping criteria, sometimes combined the fibre direction. To address this issue we developed a
with a coherence measure of the principal eigenvector (Mori statistical fibre tracking algorithm based on two hypotheses.
et al., 1999; Jones et al., 1999; Basser et al., 2000; Tench et
● Considering a voxel, the probability of a fibre to prop-
al., 2002). We adopted a similar strategy but used a com-
agate in a given direction is proportional to the corre-
bination of the normalizing T2-weighted image and the FA
sponding diffusion coefficient. This assumption can be
map to build our mask. We used the T2 water enhancing
justified by the works of von dem Hagen and Henkel-
property to delineate the ventricles. The FA map was me-
man (2002) showing the positive correlation between
dian filtered to eliminate the slight salt and pepper effect and
the diffusion coefficient and the fibre orientation prob-
get homogeneous white matter regions, and then thresh-
ability.
olded at 0.2. Both binary thresholded images were then
● Axonal trajectories or more cautiously trajectories of
multiplied in order to achieve precise white matter segmen-
axonal bundles follow regular curves.
tation. The T2 contribution to the mask was a separation of
the ventricles from the white matter and the FA mask Based on these two ideas we constructed a random walk
segmented the white– grey matter border. Using a relatively model of a particle diffusing in a nonhomogeneous medium,
low FA threshold and median filtering, the FA map avoided here a DT field, D␣, with a curve regularizing constraint
rejection of white matter voxels of low anisotropy due to emphasizing colinearity:
fibre crossing or noise.
q i⫹1 ⫽ q i ⫹ ⍀ i , (1)
再
Statistical axonal trajectories d i ⫹ ⍀ i⫺1
⍀i ⫽ 储 d i ⫹ ⍀ i⫺1储 , (2)
Water particles animated by thermal heat experience
⍀ i · ⍀ i⫺1 ⬎ 0
random motion. This Brownian movement can be described
by a random walk model. It means that the particle trajec- d i ⫽ D ␣i r i , (3)
tory is made of a succession of jumps that are the realization
of a random variable. In an infinite homogeneous medium with ri a random vector uniformly distributed over a unit
the distribution of the random variable is an isotropic three- sphere. The continuous trajectory of a particle in a 3D
dimensional Gaussian function whose variance is propor- Euclidean space is given by its time varying position vector
tional to the diffusion coefficient (Einstein, 1956). Living qi, where i is the discrete time step (0 ⱕ i ⱕ m). The curve
tissue, or more specifically the human brain, is far from a that the particle propagation generates grows along a unit
homogeneous medium. It is highly structured and highly vector ⍀i, that is a random direction vector modelling the
compartmented for water particles. Under those circum- statistical nature of the diffusion process and the curve
stances, the diffusion function deviates from an isotropic regularizing constraint. ⍀i is a weighted sum of the random
Gaussian and becomes a complicated function of position vector di, defined on the unit sphere and distributed accord-
and diffusion time (Wedeen et al., 2000). Considering the ing to the local diffusive properties1 and the previous dis-
limitations inherent to a clinical scanner, limited acquisition placement vector ⍀i⫺1, enhancing colinearity. ⍀i · ⍀i ⫺ 1 ⬎
time and resolution, the DT model is a reasonable compro- 0 is just an additional constraint to avoid backward jumps.
mise to reflect reality. It can be seen as a second order is the step size (here ⫽ 0.75), whereas ␣ is an anisot-
approximation of the average diffusion coefficient over a ropy enhancing exponent. ␣ is a power to the diffusion
voxel in any direction of space (Frank, 2002). matrix D. If ␣ is put to 1 the algorithm gives a lot of weight
In a voxel where all the axons travel in a unique direc- to possible fibre trajectories deviating from the main direc-
tion, the measured DT exhibits strong anisotropy and the tion, whereas if ␣ is large, the distribution is tightened
first eigenvector is aligned with the axonal trajectory. But as around the main eigenvector in which case the propagation
it was stressed by Pierpaoli et al. (1996) and confirmed by rule comes close to a classic main eigenvector-based fibre
von dem Hagen and Henkelman (2002) experiments, a tracking. We propose a value of 2 for ␣ as a good compro-
voxel that contains several populations of axons with dif- mise between alternative path exploration and near main
ferent directions has a tensor whose shape will change diffusion direction propagation. is a constant tuning the
according to the proportion of each fibre population, mov- relative importance of the random diffusion component vs
ing toward a donutlike or spherical shape. In this situation,
the principal eigenvector loses its signification and tracking 1
Here di is a single contraction between the nearest neighbour DT, Di␣,
becomes more hazardous. The principal eigenvector is also and a random vector uniformly distributed over a unit sphere, ri.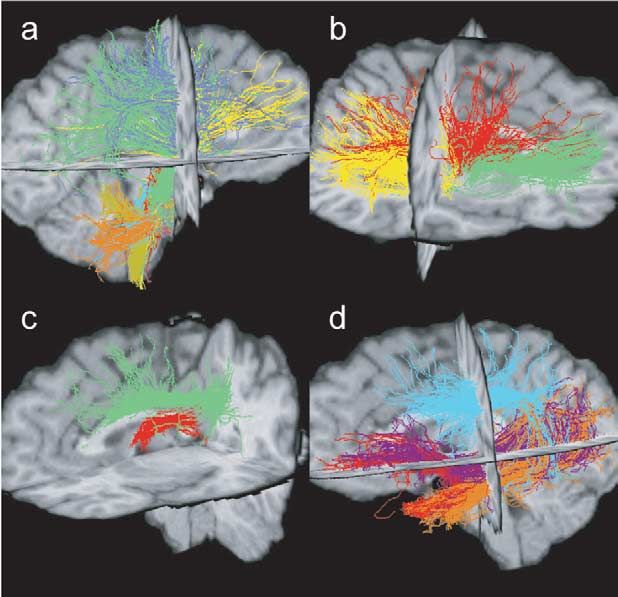
P. Hagmann et al. / NeuroImage 19 (2003) 545–554 549
the curve regularizing term. As approaches zero, the Therefore, trajectories that follow directions of high diffu-
global regular shape of the curve will be favoured, whereas sion should be more likely than those which do not. To
if set to a large number, more weight is given to the local select a posteriori the “good” trajectories, we assigned to
DT (here ⫽ 1). each curve a “validity index” (VI), which is the result of an
In order to map the connectivity of the entire brain, integration of the tangential diffusion coefficient along the
random curves were initiated on a bootstrap of the white trajectory and normalized to the length
matter. This means that a given proportion of the mask
voxels, e.g., 40%, were selected randomly to be an initiation
兺 i⫽1 ⍀ Ti D i⍀ i 1
冘⍀ D ⍀ ,
m m
point for curves. From those voxels n curves (e.g., 10) were VI ⫽ ⫽ T
(4)
grown in both directions. The curve elongation stopped 兺 i⫽1
m
储⍀ i储 m i⫽1
i i i
when a maximum of m steps were performed (e.g., 100,
depending of size of the step) or the border of the mask was where ⍀Ti Di⍀i is the double contraction of the DT, Di,
reached. The result was a statistical estimate of the entire with the unit displacement vector, ⍀i. This contraction is
brain connectivity, modelled by a “huge spaghetti plate” of the diffusion coefficient in the displacement direction.
about 100’000 curves. This operation, which needs to be For tracts that were selected by one or several ROI, the
done only once for one DT-MRI dataset, took several hours histogram of the fibre population VI could be plotted. It
on our machine with unoptimized Matlab code. usually followed a bell-shaped distribution. Fibres below
a certain quantile (here 20%) were then discarded so that
Tract selection or virtual dissection only the most credible fibres with a high VI were re-
tained.
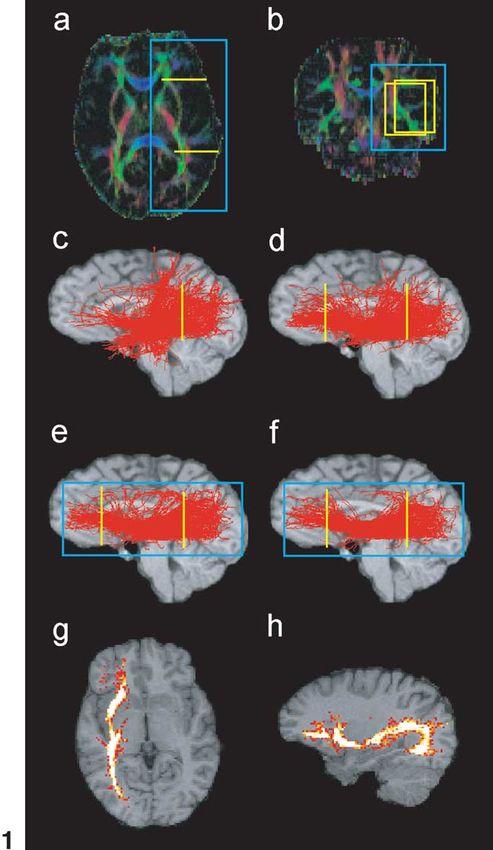
In order to visualize anatomical connections in the form In Fig. 1, we took the example of the occipitofrontal
of separate identifiable tracts or bundles, a virtual dissection fascicle, an important association bundle (Nieuwenhuys et
in this modelled brain had to be performed. This was done al., 1988) for illustrating the technique. A first yellow ROI
in two main steps; first, a selection by knowledge-based was placed in the caudal part of the brain (Fig. 1c). A large
region of interest (ROI) placement and second, selection by population of fibres was selected of which the occipitofron-
fibre validity classification. tal projections as well as fibres of the superior and inferior
As Mori et al. (2002b) in a deterministic framework, we longitudinal fascicles and fibres belonging to the corona
defined here a ROI as a volume that selects fibres. The radiata and posterior corticothalamic projections (not visible
manner those ROI were placed needed some attention. Be- here in those sagittal figures). Willing to visualise only the
cause our approach toward fibre tracking was stochastic, occipitofrontal connections, a second yellow ROI was then
there was a potential risk to map aberrant connections, placed in the frontal brain (Fig. 1d). In some situations,
although those should be very few compared to real tracts. instead of choosing a second ROI, it was more appropriate,
Therefore to avoid a possible bias in the results, we adopted because it was less susceptible to bias, to cut out fibres that
the following general approach: pass out of a region. We illustrated it here in Fig. 1e with a
1. The placement of a first ROI is chosen according to blue box. The final step of our virtual dissection was to
the structure that shall be investigated, guided by the eliminate unlikely fibres that are defined as having a VI
knowledge coming from postmortem anatomical inferior to the 20th quantile (Fig. 1f).
studies. We actually used three types of ROI in this paper that
2. The general structure of the tract appears, though it have been colour-coded in the following way: (1) yellow
might be mixed up with other pathways. Their origin, region selected fibres that pass through the box, (2) fibres
termination, and trajectories can be appreciated. passing in a red box were cut out, and (3) fibres that passed
3. The different tracts selected are identified by confron- out of a blue box were also discarded.
tation with the postmortem studies.
4. If necessary, a second or a third ROI is selected, in Various connectivity maps
order to separate the tract of interest from the others.
Axonal trajectories were modelled as a result of a stochastic The classical way of fibre tract representation is a simple
process, thus imbeding in the algorithm the orientational trajectory plot. We also adapted Koch et al. (2002) statisti-
uncertainty related to the DT (Pierpaoli et al., 1996; von cal density maps to our algorithm. From the computed
dem Hagen and Henkelman, 2002). Among the very large axonal trajectories we summed in each voxel the number of
number of curves generated, some accurately match reality curves that passed through. This measure gave us, for each
whereas others are aberrant. If along an axonal trajectory the voxel, a qualitative measure of the probability that a given
tangential diffusion can locally drop due to fibre crossing or voxel was connected with the ROI or an empirical measure
fanning in a voxel, we expect the tangential diffusion coef- of the relative amount of fibres of the given tract that passed
ficient averaged along the axonal trajectory to be large. through that voxel (Fig. 1g and h). We used these two ways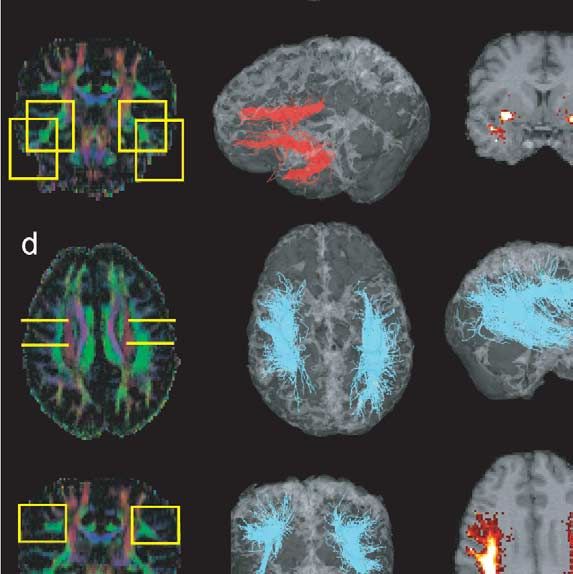
550 P. Hagmann et al. / NeuroImage 19 (2003) 545–554
of representing connectivity because they are both useful
and complementary.
Results
The evaluation phase of this research work was per-
formed on two healthy volunteers. It allowed assessing the
capacity of our tracking algorithm to infer axonal connec-
tivity by comparing the results to postmortem-based neuro-
anatomical knowledge, using the Nieuwenhuys et al. (1988)
atlas. We applied the above-mentioned methodology in or-
der to perform a virtual dissection of several well-known
anatomical systems. This collection of connectivity maps
can also be considered to be the beginning of an in vivo
brain connectivity atlas. The illustrations are always orga-
nized in a similar manner. Two colour maps are used to
present the location of the ROI. Some images present the
tract of interest on three-dimensional views, whereas a few
are projections on an anatomical T1-weighted slice and
some others are statistical density maps. We systematically
did a bilateral investigation using perfectly symmetric ROI
so that side comparison was possible.
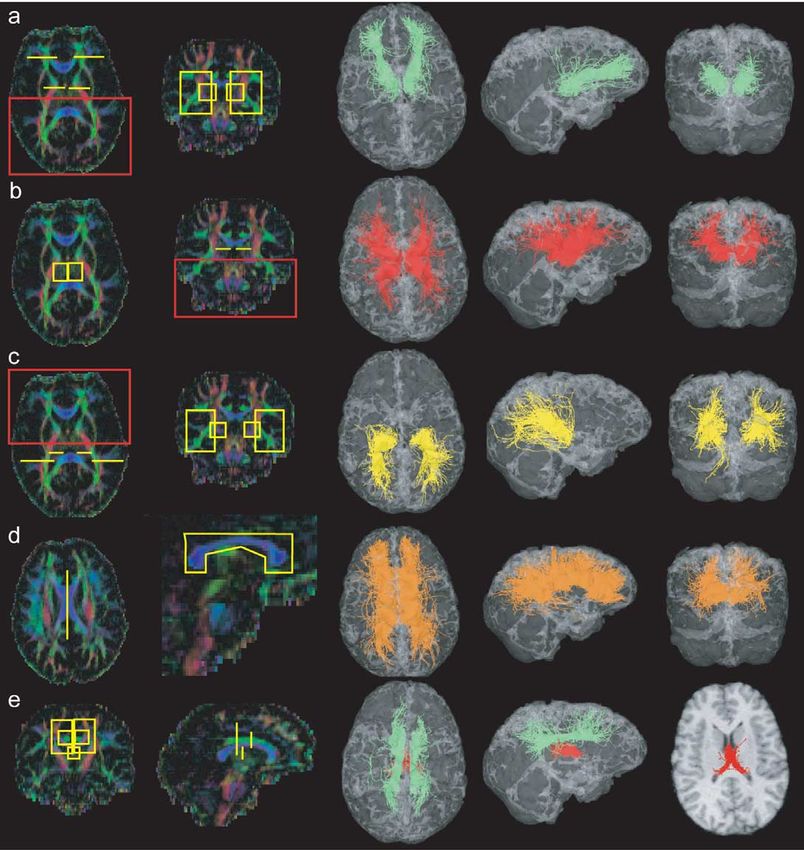
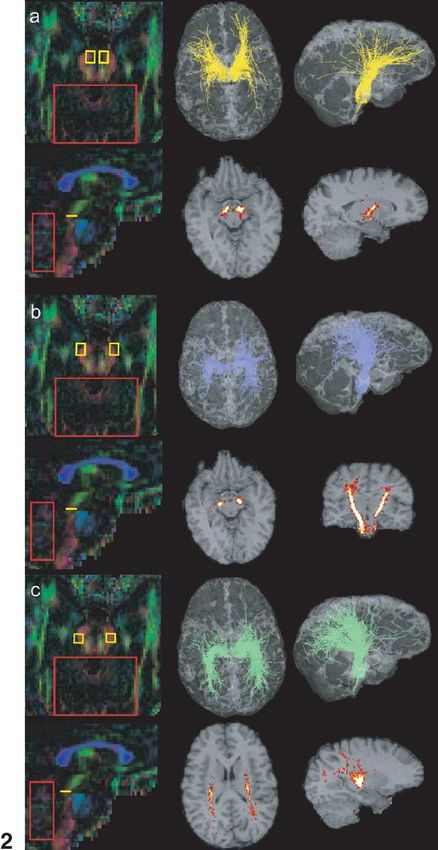
Corticobulbar and corticospinal tracts
The corticospinal tract is a large, well-characterized, and
highly anisotropic tract. It has therefore been used by sev-
eral authors for evaluating their tracking algorithm (Jones et
al., 1999; Basser et al., 2000; Poupon et al., 2001; Stieltjes
et al., 2001; Koch et al., 2001; Tench et al., 2002; Gossl et
al., 2002). The anatomical position of these fibres as well as
the position of the corticobulbar tracts is in the brain stem is
well described in the literature [for comprehensive sum-
mary, see Nieuwenhuys et al. (1988)]. At that level the
different bundles separate well. With different locations of
the ROIs, we have achieved the dissection of different
tracts. For the whole analysis of this subsection, we have
excluded fibres coming from the cerebellum on their way to
the brain stem.
Fig. 2a shows fibre tract selection by an axial ROI in the
ventromedial part of the cerebral peduncles. The fibres thus
selected originate mainly in the frontal cortex and are clas-
sically described as the frontopontine tract. If the ROI was
placed more laterally in the ventrolateral part of the cerebral
peduncle, the selected fibres corresponded to the pyramidal
tract, originating mainly in the region of the central sulcus
and travelling down the brain stem (Fig. 2b). Placing the
ROI at the dorsolateral border of the cerebral peduncle
Fig. 4. Cortical association bundles. ROIs on colour maps, 3D views, and
statistical density maps. (a) Inferior occipitofrontal fascicle (violet), (b)
inferior longitudinal fascicle (orange), (c) uncinate fascicle (red), (d) su-
perior longitudinal fascicle (cyan).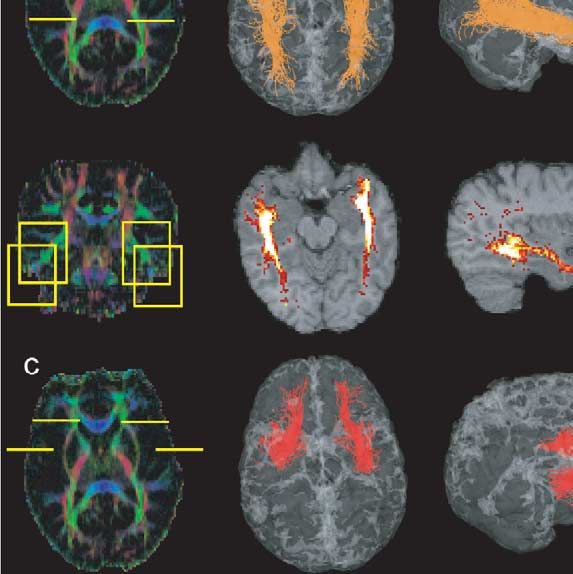
P. Hagmann et al. / NeuroImage 19 (2003) 545–554                                                    551

Fig. 5. Cerebellar peduncles and medial lemniscus. ROIs on colour maps, 3D views. (a) Inferior cerebellar peduncle (green and yellow), (b) midcerebellar
peduncle (orange), (c) superior cerebellar peduncle (cyan), (d) medial lemniscus (red).

revealed what can be regarded as the parieto-temporo-pon-
tine tract (Fig. 2c).

Corticothalamic projections

    The thalamus sends and receives axons from the differ-
ent cortical areas. The thalamocortical connections can be
roughly separated into three groups, the anterior, superior,
and posterior projections.
    For selecting the anterior projections, we placed two
ROIs in the frontal plane, one in the anterior part of the
thalamus, and the other larger ROI in the frontal lobe white
matter, anterior to the genu of the corpus callosum (Fig. 3a).
Fibres that ran caudally beyond the thalamus were elimi-
nated. In Fig. 3b, we visualised the superior projections by
placing an axial ROI in the upper part of the thalamus; fibres
running further down were discarded. A similar approach
was adopted for the posterior projections by placing ROIs in
the frontal plane, one in the posterior part of the thalamus,
and another large window in the white matter at the level of                   Fig. 6. Three-dimensional view of several systems. (a) Corticobulbar and
the temporooccipital junction (Fig. 3c). Fibres running ros-                   -spinal tracts, cerebellar peduncles, (b) corticothalamic projections, (c)
trally beyond the thalamus were eliminated.                                    limbic system, (d) association bundles.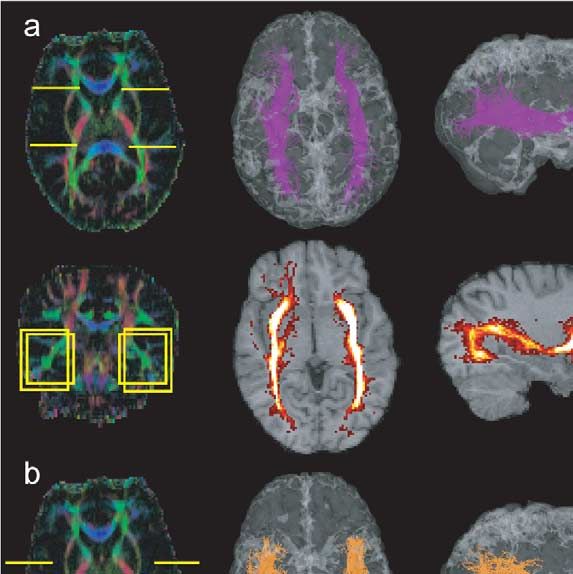
552                                         P. Hagmann et al. / NeuroImage 19 (2003) 545–554

Corpus callosum and limbic system                                      we could easily identify the medial lemniscus that was then
                                                                       selected with another ROI. Those fibres are known to ter-
    In order to identify fibres passing through the corpus             minate in the thalamus (Fig. 5d), and to visualise this fibre
callosum, we placed a large ROI encompassing the whole                 population, we selected the fibres that did not continue
corpus callosum at the midsagittal plane (Fig. 3d).                    beyond it.
    Some of the major pathways constituting the limbic
system are known to be the fornix and the cingulate bundle.
The horizontal portion of the fornix was isolated by placing           Discussion
a ROI in a frontal plane parasagittally beneath the body of
the corpus callosum. But both anterior and posterior col-                  We developed a new approach to map brain connectivity
umns together with the temporal extension could not be                 that was statistical in nature and based on a global approach
identified. This could be due to an insufficient spatial reso-         toward fibre tracking. This lead to the identification of
lution of our DT acquisition technique. The cingulum was               several fibre tracts (Fig. 6) that all showed accurate corre-
identified by using two ROIs placed in a frontal plane, 2 cm           lation with current postmortem-based neuroanatomical
apart within the white matter of the cingulate gyrus (Fig.             knowledge (Nieuwenhuys et al., 1988). Furthermore, pre-
3e).                                                                   vious studies based on other fibre-tracking methods de-
                                                                       scribed analogous trajectories for many of those tracts— the
Cortical association bundles                                           pyramidal tract (Jones et al., 1999; Basser et al., 2000;
                                                                       Stieltjes et al., 2001; Poupon et al., 2001; Tench et al., 2002;
    Corticocortical connections are widespread and form                Gossl et al., 2002), the thalamic projections and the cortical
only loose association bundles that are variable in size and           association bundles (Mori et al., 2002b), the brain stem
shape. Using our method, we visualised four of those major             (Stieltjes et al., 2001), and the corpus callosum (Basser et
association bundles.                                                   al., 2000; Tench et al., 2002; Poupon et al., 2001—thereby
    Fig. 4a shows the inferior occipitofrontal fascicle as it          validating our results. The presented data constitute an in
was isolated with two ROIs. The first was placed in the                vivo brain connectivity atlas.
posterior parietal and the second in the frontal lobe. In order            Both Koch et al. (2002) and our results suggest that
to isolate the inferior longitudinal fascicle, we also used two        statistical fibre tracking is a valuable way for mapping brain
selection ROIs. The posterior was, as for the inferior occip-          connectivity. But it is necessary to notice the clear differ-
itofrontal fascicle, in the posterior parietal lobe, whereas the       ences with the classical deterministic fibre-tracking algo-
second in the temporal lobe (Fig. 4b). For identification of           rithms, and they should be taken into account when inter-
the uncinate fascicle, we placed a first ROI in the anterior           preting the results. Current deterministic tracking
part of the temporal lobe and a second one in the frontal              algorithms follow the main eigenvector of the diffusion
lobe (Fig. 4c). The superior longitudinal fascicle was se-             tensor (Conturo et al., 1999; Mori et al., 1999; Jones et al.,
lected by two ROI placed below the motor and the posterior             1999; Basser et al., 2000; Tench et al., 2002), reducing the
parietal cortices in frontal planes (Fig. 4d). This tract shows,       available information. Thus, only the largest and the most
interestingly, a clear left–right asymmetry.                           homogeneous fibre bundles can be followed, those that do
                                                                       not have a much smaller diameter than the size of a voxel.
Cerebellar peduncles and medial lemniscus                              The identified trajectories are smooth and accurate under the
                                                                       assumption that the signal-to-noise ratio is sufficiently high
   Here we investigated the relationship between the cere-             for limiting the deviation of the tensor field from reality and
bellum and the brain stem. The three cerebellar peduncles              therefore introducing instability of the discretized differen-
were successively identified by appropriate placement of               tial equation. These problems were investigated by Lazar et
ROIs. In Fig. 5a, we selected the right and left inferior              al. (2000) as well as by Gossl et al. (2002). Whereas Lazar
cerebellar peduncles by means of two ROIs, one in the brain            maps streamlines that are deflected by the local diffusion
stem and one in the cerebellum. The midcerebellar peduncle             tensor, Gossl et al. consider fibre tracking in a noisy main
was selected by means of one ROI placed across the pons                eigenvector field as an optimal filtering problem. Gossl’s
for selecting the fibres that travel in this region laterally and      implementation based on a Kalman filter generates curves
a second ROI was placed on the cerebellum itself (Fig. 5b).            that follow a corrected main eigenvector in order to mini-
The upper cerebellar peduncle was more difficult to isolate            mize the mean square error between the estimated and the
and we used the fact that these fibres decussate at the level          underlying ideal tract.
of the cerebral peduncle to place a ROI in the sagittal plane.             The statistical approach, as presented here, goes one step
Two other ROIs were positioned in an axial plane on each               further. It makes use of the whole diffusion information
side of the mid line (Fig. 5c). Despite cautious ROI place-            available in order to explore many potential connections and
ment, this tract shows an asymmetry in the amount of fibres            selects appropriate tract by measuring a posteriori the mean
passing either left or right.                                          diffusion along the trajectory.
   Finally, looking at a colour map at the level of the pons               We see here three advantages:
P. Hagmann et al. / NeuroImage 19 (2003) 545–554 553
1. The nature of the data is better taken into account. Acknowledgments
2. The sensitivity to noise is decreased.
3. The possibility of fibre crossing and diverging is We thank Dr. Jean-Marc Vesin (Signal Processing Insti-
introduced. tute, Swiss Federal Institute of Technology, Lausanne),
Eleonora Fornari, and Roberto Martuzzi (Department of
However, an uncertainty concerning the trajectory of indi- Radiology, University Hospital, Lausanne) for their fruitful
vidual fibres appears. Each curve should not be interpreted inputs. Thanks also to Torsten Butz for registering the MR
as a precise mapping of a real axonal trajectory. images and to Olivier Cuisenaire for providing the visual-
Selected fibres should be considered together and areas ization tool (Signal Processing Institute, Swiss Federal In-
of high fibre density as very likely trajectories whereas stitue of Technology, Lausanne).
projections of few fibres may not correspond to an anatom-
ical entity. In that sense the statistical density mapping
seems a complementary tool to the trajectory maps in the References
context of statistical fibre tracking in order to evaluate the
validity of the fibres passing by a given region. Basser, P., Pierpaoli, C., 1996. Microstructural and physiological features
of tissues elucidated by quantitative-diffusion-tensor mri. J. Magn.
In the presented implementation, several improvements Reson. B 111 (3), 209 –219.
appear also when compared with Koch et al. (2002). Our Basser, P., Pierpaoli, C., 1998. A simplified method to measure the diffu-
random walk is continuous as opposed to voxel to voxel sion tensor from seven mr images. Magn. Reson. Med. 39, 928 –934.
jumps. We map individual trajectories and not only statis- Basser, P., Pajevic, S., Pierpaoli, C., Duda, J., Aldroubi, A., 2000. In vivo
fiber tractography using dt-mri data. Magn. Reson. Med. 44 (4), 625–
tical density maps. The major drawback of Koch’s algo- 632.
rithm which is the dependence of the intensity of the con- Beaulieu, C., 2002. Relating micro-structural properties of neural fibres
nectivity measure on the distance of the initialization point with anisotropic diffusion, in: Proc. Workshop on Diffusion MRI:
has been solved in our method by multiple initialization all Biophysical Issues. ISMRM, pp. 79 – 82.
Beaulieu, C., Allen, P.S., 1994. Determinants of anisotropic water diffu-
over the brain. sion in nerves. Magn. Reson. Med. 31 (4), 394 – 400.
Our approach, “whole brain simulation” and then virtual Bozzali, M., Falini, A., Franceschi, M., Cercignani, M., Zuffi, M., Scotti,
dissection, showed striking similarity with known anatomy G., Comi, G., Filippi, M., 2002. White matter damage in Alzheimer’s
(Nieuwenhuys et al., 1988). Worth noting are also very disease assessed in vivo using diffusion tensor magnetic resonance
imaging. J. Neurol. Neurosurg. Psychiatry 72 (6), 742–746.
obvious left–right asymmetries of the superior longitudinal Clarke, S., Kraftsik, R., Van der Loos, H., Innocenti, G., 1989. Forms and
tract (Fig. 4d) and the upper cerebellar peduncle (Fig. 5c). If measures of adult and developing human corpus callosum: is there
inadvertent asymmetric ROI selection and the statistical sexual dimorphism? J. Comp. Neurol. 280 (2), 213–230.
nature of the algorithm might be a partial explanation, Conturo, T., Lori, N., Cull, T., Akbudak, E., Snyder, A., Shimony, J.,
McKinstry, R., Burton, H., Raichle, M., 1999. Tracking neuronal fiber
clearly, anatomical difference between both sides is a pre- pathways in the living human brain. Proc. Natl. Acad. Sci. USA 96
dominant component, e.g., proportion of grey and white (18), 10422–10427.
matter (Gur et al., 1980). These observations might be the Coremans, J., Luypaert, R., Verhelle, F., Stadnik, T., Osteaux, M., 1994. A
starting point of asymmetry and male/female dysmorphism method for myelin fiber orientation mapping using diffusion-weighted
MR images. Magn. Reson. Imaging 12 (3), 443– 454.
study (Clarke et al., 1989). Einstein, A., 1956. Investigations on the Theory of the Brownian Move-
Using knowledge-based ROI for tract selection is not, at ment. Dover Publications, New York.
least in the context of statistical fibre tracking, an ideal Field, A., Alexander, A., Hasan, K., Arfanakis, K., Witwer, B., Moftakhar,
solution. There remains a risk of biasing the results if the R., Deshmukh, P., Haughton, V., Rowley, H., Noyes, J., B., H., Moritz,
C., Meyerand, M., Badie, B., 2002. Diffusion-tensor MR imaging
windows are not placed fairly. Therefore, in the future, new patterns in white matter tracts altered by neoplasm, in: Workshop on
solution for ROI placement should be found. Another re- Diffusion MRI: Biophysical Issues. ISMRM, pp. 137–140.
maining problem for deterministic as well as statistical fibre Filippi, M., Cercignani, M., Inglese, M., Horsfield, M., Comi, G., 2001.
tracking is the limited resolution of the imaging scanner and Diffusion tensor magnetic resonance imaging in multiple sclerosis.
Neurology 56 (3), 304 –311.
the incapacity of a tensor to model properly multiple fibre Foong, J., Maier, M., Clark, C., Barker, G., Miller, D., Ron, M., 2000.
tracts in one voxel. High angular resolution imaging Neuropathological abnormalities of the corpus callosum in schizophre-
(HARDI) (Wedeen et al., 2000; Frank, 2001) seems to be a nia: a diffusion tensor imaging study. J. Neurol. Neurosurg. Psychiatry
promising tool for overcoming this limitation. 68 (2), 242–244.
Frank, L., 2001. Anisotropy in high angular resolution diffusion-weighted
Finally, fibre tracking is a complex task and different
MRI. Magn. Reson. Med. 45 (6), 935–939.
approaches can be valuable. Here, based on a random walk Frank, L., 2002. Characterization of anisotropy in high angular resolution
model, we modelled in one shot the global white matter diffusion-weighted mri. Magn. Reson. Med. 47 (6), 1083–1099.
connectivity of healthy volunteers. This model was then Gossl, C., Fahrmeir, L., Putz, B., Auer, L., Auer, D., 2002. Fiber tracking
from DTI using linear state space models: detectability of the pyrami-
virtually dissected in order to identify many different fibre
dal tract. Neuroimage 16 (2), 378 –388.
tracts. This collection can be seen as far as we know as a Gur, R., Packer, I., Hungerbuhler, J., Reivich, M., Obrist, W., Amarnek,
first realization of an in vivo brain connectivity atlas. W., Sackeim, H., 1980. Differences in the distribution of gray and554 P. Hagmann et al. / NeuroImage 19 (2003) 545–554
white matter in human cerebral hemispheres. Science 207 (4436), Mori, S., Frederiksen, K., van Zijl, P., Stieltjes, B., Kraut, M., Solaiyappan,
1226 –1228. M., Pomper, M., 2002a. Brain white matter anatomy of tumor patients
Hoon, A.J., Lawrie, W.J., Melhem, E., Reinhardt, E., Van Zijl, P., Solaiy- evaluated with diffusion tensor imaging. Ann. Neurol. 51 (3), 377–380.
appan, M., Jiang, H., Johnston, M., Mori, S., 2002. Diffusion tensor Mori, S., Kaufmann, W., Davatzikos, C., Stieltjes, B., Amodei, L., Fred-
imaging of periventricular leukomalacia shows affected sensory cortex ericksen, K., Pearlson, G., Melhem, E., Solaiyappan, M., Raymond, G.,
white matter pathways. Neurology 59 (5), 752–756. Moser, H., van Zijl, P., 2002b. Imaging cortical association tracts in the
Jones, D., 2003. Determining and visualizing uncertainty in estimates of human brain using diffusion-tensor-based axonal tracking. Magn.
fiber orientation from diffusion tensor mri. Magn. Reson. Med. 49 (1), Reson. Med. 47 (2), 215–223.
7–12. Nieuwenhuys, R., Voogd, J., van Huijzen, C., 1988. The Human Central
Jones, D., Simmons, A., Williams, S., Horsfield, M., 1999. Non-invasive Nervous System, 3rd Ed. Springer-Verlag, New York.
assessment of axonal fiber connectivity in the human brain via diffu- Pajevic, S., Pierpaoli, C., 1999. Color schemes to represent the orientation
sion tensor mri. Magn. Reson. Med. 42 (1), 37– 41. of anisotropic tissues from diffusion tensor data: application to white
Klingberg, T., Hedehus, M., Temple, E., Salz, T., Gabrieli, J., Moseley, M., matter fiber tract mapping in the human brain. Magn. Reson. Med. 42
Poldrack, R., 2000. Microstructure of temporo-parietal white matter as (3), 526 –540.
a basis for reading ability: evidence from diffusion tensor magnetic Pierpaoli, C., Jezzard, P., Basser, P., Barnett, A., Di Chiro, G., 1996.
resonance imaging. Neuron 25 (2), 493–500. Diffusion tensor mr imaging of the human brain. Radiology 201 (3),
Koch, M., Glauche, V., Finsterbusch, J., Nolte, U., Frahm, J., Besuchel, C.,
637– 648.
2001. Estimation of anatomical connectivity from diffusion tensor data,
Poupon, C., Mangin, J., Clark, C., Frouin, V., Regis, J., Le Bihan, D.,
in: Proceedings of 7th Annual Meeting of the Organization for Human
Bloch, I., 2001. Towards inference of human brain connectivity from
Brain Mapping, Brighton, HBM, p. 10974.
MR diffusion tensor data. Med. Image Anal. 5 (1), 1–15.
Koch, M., Norris, D., Hund-Georgiadis, M., 2002. An investigation of
Rose, S., Chen, F., Chalk, J., Zelaya, F., Strugnell, W., Benson, M.,
functional and anatomical connectivity using magnetic resonance im-
Semple, J., Doddrell, D., 2000. Loss of connectivity in alzheimer’s
aging. Neuroimage 16 (1), 241–250.
disease: an evaluation of white matter tract integrity with colour coded
Lazar, M., Weinstein, D., Hasan, K., Alexander, A., 2000. Axon tractog-
MR diffusion tensor imaging. J. Neurol. Neurosurg. Psychiatry 69 (4),
raphy with tensorlines, in: Proceeding of International Society of Mag-
netic Resonance in Medicine, Denver, CO, p. 482. 528 –530.
LeBihan, D., Mangin, J., Poupon, C., Clark, C., Pappata, S., Molko, N., Stieltjes, B., Kaufmann, W., van Zijl, P., Fredericksen, K., Pearlson, G.,
Chabriat, H., 2001. Diffusion tensor imaging: concepts and applica- Solaiyappan, M., Mori, S., 2001. Diffusion tensor imaging and axonal
tions. J. Magn. Reson. Imaging 13 (4), 534 –546. tracking in the human brainstem. Neuroimage 14 (3), 723–735.
Lim, K., Hedehus, M., Moseley, M., de Crespigny, A., Sullivan, E., Tench, C., Morgan, P., Wilson, M., Blumhardt, L., 2002. White matter
Pfefferbaum, A., 1999. Compromised white matter tract integrity in mapping using diffusion tensor MRI. Magn. Reson. Med. 47 (5),
schizophrenia inferred from diffusion tensor imaging. Arch. Gen. Psy- 967–972.
chiatry 56 (4), 367–374. von dem Hagen, E., Henkelman, R., 2002. Orientational diffusion reflects
Maldjian, J., Grossman, R.I., 2001. Future applications of dwi in ms. fiber structure within a voxel. Magn. Reson. Med. 48 (3), 454 – 459.
J. Neurol. Sci. 186(Suppl 1), S55–S57. Wedeen, V., Reese, T., Tuch, D., Weigel, M., Dou, J.-G., Weisskoff, R.,
Mamata, H., Westin, C., Zou, K., De Girolami, U., F.A., J., S.E., M., 2002. Chesler, D., 2000. Mapping fiber orentation spectra in cerebral white
Combined mapping of functional domains and axonal connectivity in matter with fourrier-transform diffusion MRI, in: Proceedings of the
cat visual cortex using fmri and dti, in: Workshop on Diffusion MRI: 8th Annual Meeting of ISMRM, Denver, ISMRM, p. 82.
Biophysical Issues, ISMRM, pp. 121–124. Wieshmann, U., Clark, C., Symms, M., Franconi, F., Barker, G., Shorvon,
Mori, S., Crain, B., Chacko, V., van Zijl, P., 1999. Three-dimensional S., 1999. Reduced anisotropy of water diffusion in structural cerebral
tracking of axonal projections in the brain by magnetic resonance abnormalities demonstrated with diffusion tensor imaging. Magn.
imaging. Ann. Neurol. 45 (2), 265–269. Reson. Imaging 17 (9), 1269 –1274.You can also read