Towards Real-Time Building Damage Mapping with Low-Cost UAV Solutions - MDPI
←
→
Page content transcription
If your browser does not render page correctly, please read the page content below
remote sensing
Letter
Towards Real-Time Building Damage Mapping with
Low-Cost UAV Solutions
Francesco Nex * , Diogo Duarte , Anne Steenbeek and Norman Kerle
 Faculty of Geo-Information Science and Earth Observation (ITC), University of Twente, 7500 AE Enschede,
 The Netherlands; d.duarte@utwente.nl (D.D.); h.a.steenbeek@student.utwente.nl (A.S.); n.kerle@utwente.nl (N.K.)
 * Correspondence: f.nex@utwente.nl; Tel.: +31-534896639

 Received: 31 December 2018; Accepted: 28 January 2019; Published: 1 February 2019

 Abstract: The timely and efficient generation of detailed damage maps is of fundamental importance
 following disaster events to speed up first responders’ (FR) rescue activities and help trapped victims.
 Several works dealing with the automated detection of building damages have been published in the
 last decade. The increasingly widespread availability of inexpensive UAV platforms has also driven
 their recent adoption for rescue operations (i.e., search and rescue). Their deployment, however,
 remains largely limited to visual image inspection by skilled operators, limiting their applicability in
 time-constrained real conditions. This paper proposes a new solution to autonomously map building
 damages with a commercial UAV in near real-time. The solution integrates different components
 that allow the live streaming of the images on a laptop and their processing on the fly. Advanced
 photogrammetric techniques and deep learning algorithms are combined to deliver a true-orthophoto
 showing the position of building damages, which are already processed by the time the UAV returns
 to base. These algorithms have been customized to deliver fast results, fulfilling the near real-time
 requirements. The complete solution has been tested in different conditions, and received positive
 feedback by the FR involved in the EU funded project INACHUS. Two realistic pilot tests are described
 in the paper. The achieved results show the great potential of the presented approach, how close the
 proposed solution is to FR’ expectations, and where more work is still needed.

 Keywords: UAV; building damage; detection; real-time; deep learning; photogrammetric mapping

1. Introduction
     When a catastrophic event occurs, timely and efficient response and rescue are the main elements
to increase the chances to save trapped victims under collapsed structures. In this scenario, first
responders (FR) visually inspect the affected area and decide where and how to start the rescue
activities. The inspection is usually performed with ground vehicles or on foot, though this often does
not yield a complete overview of the area to allow an efficient prioritization of rescue measures, whilst
also exposing rescue forces to unnecessary hazards.
     Remote sensing techniques have been increasingly adopted to map disaster areas in recent
decades [1–3] as witnessed by a rapidly growing amount of research works dealing with optical [4–6],
radar [7,8], and laser [9,10] data with each sensor giving different advantages. Except for subtle
damage patterns that deformation-sensitive radar can identify particularly well, optical data are
usually preferrable to detect building damage [11] in the early hours after the event as images are more
easily interpretable by human operators who still typically carry out the initial damage map production
manually [1]. Existing emergency mapping services such as the Copernicus Emergency Management
Service [12] have adopted synoptic satellite imagery for this task as they can cover large areas and are
available a few hours after a disaster. The main objective of these early impact analyses is to produce
georeferenced data of the affected areas, to support search and rescue efforts and humanitarian actions.

Remote Sens. 2019, 11, 287; doi:10.3390/rs11030287                         www.mdpi.com/journal/remotesensing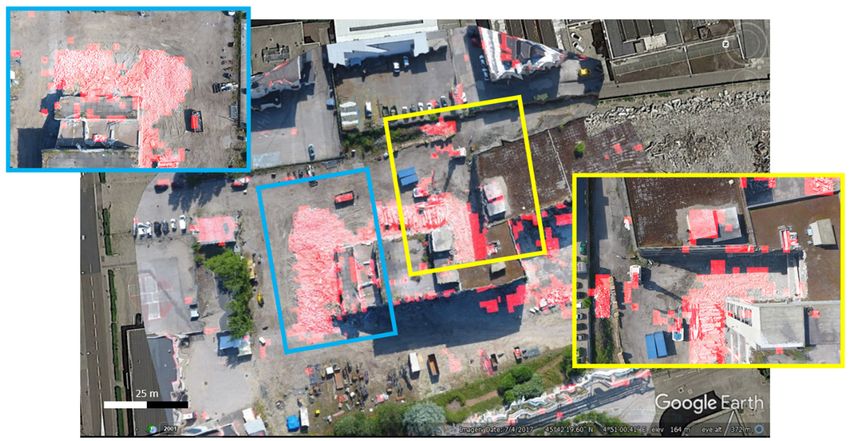
Remote Sens. 2019, 11, 287                                                                           2 of 14

Crucial information is the identification of the disaster areas and the estimation of the number of people
affected. However, these satellite images typically have limited spatial resolution (0.3–1 m ground
sampling distance, GSD) and the uncertainty and subjectivity in the identification of hazard-induced
damages can often be solved by using higher resolution images [13]. On the other hand, airborne
images [14–16] are often not available in remote places where the delivery of mapping airplanes is not
feasible in an emergency timeframe. Therefore, in situ surveys are often preferred.
       In this regard, the massive uptake of unmanned aerial vehicles (UAV) in the market has created the
possibility to collect very high-resolution images of a given scene, whilst also readily coupling vertical
with oblique imaging [14,15]. Their higher portability and their lower instrument cost, compared to
manned platforms, represent a good alternative to traditional data sources. This has been witnessed
by the increasing number of UAV footages that have been acquired in the very last events and are
frequently made available on the internet. Many rescue departments have also added UAVs to the
regular equipment of their field teams [17,18]. However, flight execution and image interpretation are
still performed manually (using UAVs for inspections from the sky), requiring a dedicated operator.
This can be often perceived as a waste of time by first responders given the strong time pressure on
their work. This was a common feedback by the first response end users in the recently concluded EU
funded project INACHUS [19]. Rescuers require a flexible solution that is: (i) able to deliver timely
data (as near real-time as possible) and with frequent update possibility. (ii) Easy to use and that yields
data that are quick to interpret also by non-remote sensing experts. The extent of the area, the practical
operational problems faced in emergency conditions and possible legal restrictions still in place in
the affected area should also be considered. In this regard, (iii) low-cost and (iv) easily deployable
(i.e., portable and light) and replicable solutions (i.e., off-the-shelf or easily adaptable devices) would
be therefore desirable.
       Recent advances in robotics and computer vision [20] have demonstrated that autonomous
flights and real-time localization can be reliably implemented on small UAVs. On-board computing
and real-time processing have also shown their potential for real-time mapping [21]. However, the
replicability of these solutions in real scenarios is still limited because their limited flight autonomy
and the high level of customization required for the used platforms. None of the existing solutions is
devoted to the quick mapping of building damages to address the FRs’ needs.
       The development of deep learning algorithms for image classification [22,23] has shown its
potential in the remote sensing domain [24–26] providing very promising results in the detection of
building damages such as debris or rubble piles [14,27]. These works have demonstrated how the
convolutional neural networks (CNN) outperform traditional classification approaches in terms of
performances and transferability of the learnt features to new datasets. In these works, however, no
specific attention is paid to timely results delivery. The main drawback of these techniques remains
the extensive computational time required that is incompatible with FR’s demands.
       The present work tries to overcome the above-mentioned problems by proposing a solution based
on a commercial UAV platform to autonomously map an area and detect building damages in near
real-time. In particular, a binary map depicting the extension of the damages (i.e., delineation map) is
delivered as output. The developed approach takes advantage of the most recent commercial UAV
platforms that are delivered with software development kits (SDKs): these SDKs can customize
the flight mode of the UAV and enable the real-time data streaming on a laptop. An efficient
photogrammetric process is then implemented to generate a quick orthophoto of the area. A hybrid
detection technique was then implemented combining in cascade morphological filters and vegetation
indexes with a shallow convolutional neural networks (CNN). The first algorithms identify the areas
of potential damages by selecting candidate areas in each image. Subsequently, the implemented CNN
only classifies these regions instead of analyzing the whole image.
       In the following sections a brief state of the art on the main elements of the developed solution
(i.e., deep learning and real-time mapping) is given (Section 2). The developed methodology and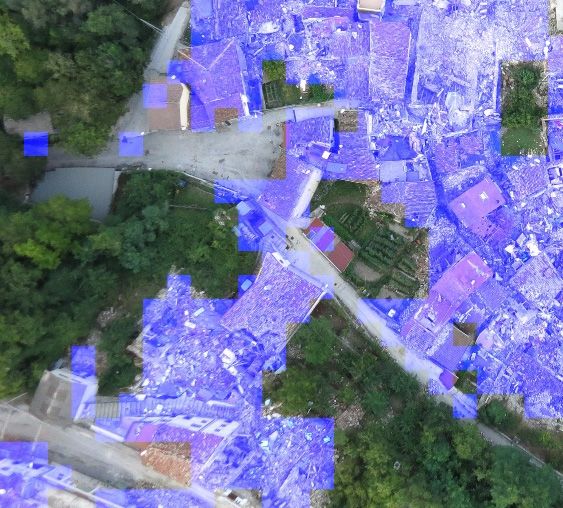
Remote Sens. 2019, 11, 287                                                                           3 of 14

some of the performed tests are presented in Sections 3 and 4, respectively. The results obtained are
discussed in Section 5 leading to the conclusions (Section 6).

2. Background
     The presented approach builds on two main research topics: (i) real-time mapping and (ii) the
automated building damage assessment from images. In the following, a non-exhaustive review of the
state of the art in these two domains is given, focusing on the developments that are relevant for the
approach presented in this paper.

2.1. Real-Time Mapping
      This process refers to the generation of maps (i.e., georeferenced orthophoto) in near real-time.
Different steps are followed in this process: image orientation, 3D point cloud generation, and
orthorectification. The simultaneous image orientation and sparse point cloud generation of the
surrounding environment is often called Visual SLAM (simultaneous localization and mapping) and it
is assimilated to the structure from motion (SfM) for real-time applications [28]. Most of the developed
approaches have been conceived for autonomous navigation or collision avoidance instead of mapping
tasks [28,29]. When the reconstruction of the 3D space needs to be accurate like in UAV applications [30],
then the use of bundle adjustments (BA) is adopted to reduce the deformations of large blocks [31].
Unfortunately, BA is a time-consuming procedure especially for large blocks. Different strategies
have been implemented to make this process more compatible with real-time needs [27]. A relevant
element is the use of local and global BA, acting on a small section or on the whole image block
respectively [32–34]. The local adjustment requires limited time while the global adjustment is usually
run only few times during the image acquisition process. All Visual SLAM approaches deliver sparse
points even when videos and dense tracking algorithms are used [21]. Only very few recent solutions
exploiting deep learning [35] are trying to deliver denser clouds in real-time. The generated point
clouds are, therefore, too rough to be directly used in the orthorectification process. For that reason, the
approaches for real-time orthophoto generation adopt strategies such as homographic assumptions [21]
or planar projections [36,37] to ease and fasten the process. However, these methods are only suitable
when mostly flat surfaces are surveyed (i.e., fields) and do not provide acceptable results for more
complex scenes such as urban environments.

2.2. Automated Building Damage Assessment for First Responders
     The automated detection of damages from images has been investigated for several years. Many
recent approaches rely on both images and 3D points cloud to assess the damage state of a given
area [14,16,38]. However, the generation of 3D information takes a considerable amount of time,
thus limiting its use in FR procedures. Recent developments in machine learning (i.e., CNN) for
image classification and segmentation have shown their potential in both computer vision [22] and
remote sensing domains [24]. These approaches have already been applied to the image classification
of building damages, considering data from different platforms and resolutions (satellite, aerial,
UAV) [26]. The use of satellite and airborne images during training has also increased the reliability
of the image classification of building damages from UAV imagery [27]. In most of these networks,
damage cues—such as debris and rubble piles—are identified in a binary classification approach.
Despite their promising results [14], little attention has been given to their real adoption in FR search
and rescue activities. In particular, the CNN processing is computationally demanding and hardly
compatible with real-time needs. In this regard, most recent solutions have already tried to limit the
use of the most expensive processes to selected regions defined in advance with faster methods [15].

3. The Proposed Methodology—Materials and Methods
    The developed method can be divided into three main components: (i) the app (installed on a
smartphone) for customized flight mode and data streaming, (ii) the UAV flight planning toolbox,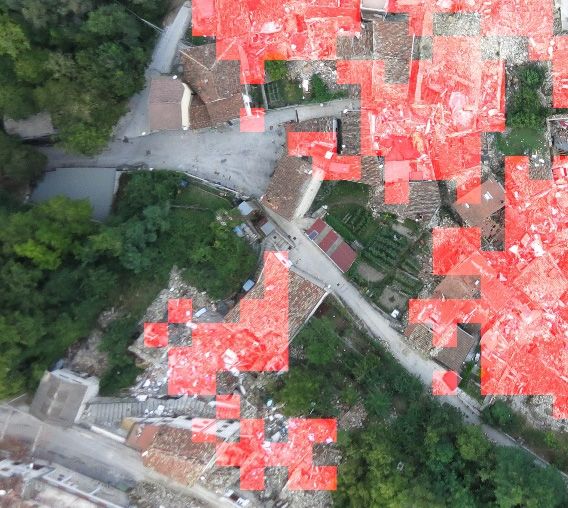
Remote Sens. 2019, 11, 287 4 of 14
Remote Sens. 2018, 10, x FOR PEER REVIEW 4 of 15
The
andthree components
(iii) the incremental aremap
embedded together
generation in order to
and building optimize
damage the process
detection (bothand assureonthe
installed timely
a laptop).
processing of the data. As
The three components areshown
embeddedin Figure 1, the
together in user
orderinitially defines
to optimize thean area ofand
process interest
assureonthe
thetimely
map
and the software
processing of thegenerates
data. As automatically
shown in Figure a flight
1, theplan.
userThe waypoints
initially definesare
anthen
areauploaded
of intereston onthe
theUAV
map
that
andcan
the start the image
software acquisition.
generates Duringa the
automatically flight
flight theThe
plan. newly collected
waypoints areimages are streamed
then uploaded on theonUAV
the
laptop
that canthrough the
start the remote
image control and
acquisition. the customized
During the flight theapp on the
newly smartphone.
collected images The images are
are streamed on
progressively processed
the laptop through in the laptop:
the remote controlthe andnew
theimages are sequentially
customized app on the added with a The
smartphone. SfM images
algorithmare
and the damages
progressively are then in
processed detected in a classification
the laptop: the new images process. When the image
are sequentially added collection
with a SfMis completed,
algorithm
aand
true-orthophoto
the damages are displaying the location
then detected of buildingprocess.
in a classification damagesWhen is generated,
the image and it is available
collection by the
is completed,
time the UAV lands.
a true-orthophoto displaying the location of building damages is generated, and it is available by the
time the UAV lands.
Overviewof
Figure1.1.Overview
Figure of the
the developed
developed system
system composed
composed of ofaalaptop,
laptop,remote
remotecontrol,
control,and
andsmartphone
smartphone as
well as a UAV platform. Data are streamed from the laptop to the UAV platform (blue dashed
as well as a UAV platform. Data are streamed from the laptop to the UAV platform (blue dashed line) line) and
vice-versa
and (red (red
vice-versa dashed line).line).
dashed The tasks performed
The tasks in eachinsegment
performed of the system
each segment (in grey)(in
of the system aregrey)
reported
are
according
reported to their sequential
according order. order.
to their sequential
3.1. UAV Platform and Customized Flight Mode
3.1. UAV Platform and Customized Flight Mode
Many UAV platforms are delivered with a dedicated SDK to customize their flight modes.
Many UAV platforms are delivered with a dedicated SDK to customize their flight modes. In
In this paper, the adopted UAV platform is the Mavic Pro produced by DJI. This platform provides a
this paper, the adopted UAV platform is the Mavic Pro produced by DJI. This platform provides a
reliable and fast connection with the remote control thanks to the Ocusync protocol that has higher
reliable and fast connection with the remote control thanks to the Ocusync protocol that has higher
communication speeds compared to other existing protocols (i.e., Lightbridge by DJI), as also confirmed
communication speeds compared to other existing protocols (i.e., Lightbridge by DJI), as also
by the performed tests. The Mavic Pro can also feature a relatively long flight time in excess of 20 min.
confirmed by the performed tests. The Mavic Pro can also feature a relatively long flight time in
The communication between UAV platform and laptop is provided by an Android app installed on
excess of 20 minutes.
the mobile phone. This device is connected to the remote control via USB and to the laptop thanks to a
The communication between UAV platform and laptop is provided by an Android app installed
wi-fi hotspot connection. Dedicated Javascript is installed on the laptop to allow the communication
on the mobile phone. This device is connected to the remote control via USB and to the laptop thanks
with the smartphone. The app has been developed using the mobile SDK of DJI and has two main
to a wi-fi hotspot connection. Dedicated Javascript is installed on the laptop to allow the
functions: (i) upload the mission generated in the laptop on the drone, and (ii) receive the images from
communication with the smartphone. The app has been developed using the mobile SDK of DJI and
the platform and stream them to the laptop (see Figure 2a). The Javascript has a graphical interface that
has two main functions: (i) upload the mission generated in the laptop on the drone, and (ii) receive
allows to verify the connection status with the app, to select the flight plan file to be uploaded and the
the images from the platform and stream them to the laptop (see Figure 2a). The Javascript has a
folder for image storing on the laptop (see Figure 2b). This software interface communicates with the
graphical interface that allows to verify the connection status with the app, to select the flight plan
app through a websocket communication protocol, sending the flight plan to the app and receiving the
file to be uploaded and the folder for image storing on the laptop (see Figure 2b). This software
streamed images during the flight. Each platform has a unique ID and the communication with more
interface communicates with the app through a websocket communication protocol, sending the
than one drone is therefore allowed. The UAV acquires the images in a stop and go mode. Although
flight plan to the app and receiving the streamed images during the flight. Each platform has a unique
this acquisition mode is slower than in the continuous flight with regular internal shots, it gives higher
ID and the communication with more than one drone is therefore allowed. The UAV acquires the
flexibility that allows the change of camera pitch and yaw for every image.
images in a stop and go mode. Although this acquisition mode is slower than in the continuous flight
with regular internal shots, it gives higher flexibility that allows the change of camera pitch and yaw
for every image.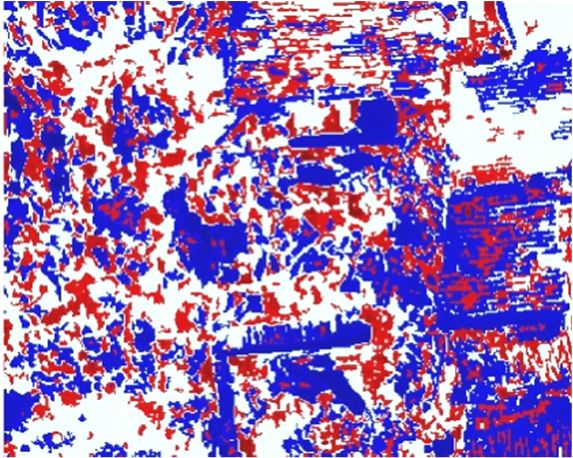
Remote Sens. 2019, 11, 287 5 of 14
Remote Sens. 2018, 10, x FOR PEER REVIEW 5 of 15
(a) (b)
Figure
Figure 2.2. (a)
(a)The
Theapp appinstalled
installedon
onthethe smartphone:
smartphone: thethemission
missioncancanbe
beuploaded,
uploaded, started,
started, and
and stopped
stopped
with
with the
thethree
threebuttons
buttonson onthe screen.
the screen.TheThe
position of the
position waypoints
of the waypointsand and
the UAV is provided
the UAV in real-
is provided in
time during
real-time the mission.
during Other information
the mission. such as such
Other information the number
as the of imagesofthat
number are collected,
images that are streamed
collected,
on the phone
streamed or on
on the phonethe laptop is visualized
or on the on the bottom
laptop is visualized left
on the window.
bottom left (b) The connection
window. between
(b) The connection
app (on
between the
app
Remote controller)
(on
Sens. the
2018, uses the
10, xcontroller)
FOR PEER Javascript
uses
REVIEW to upload
the Javascript to the file from
upload thefrom
the file laptop
the and select
laptop and5the 15folder
select
of the
folder the
where where the images
images will bewill be stored.
stored. The of
The status status of the connection
the connection is also given.
is also given.
3.2. UAV
3.2. UAV Flight
Flight Planning
Planning
The goal
The goal ofof the
theUAVUAV mission
mission is is to
to explore
explore aa new newareaareaandanddeliver
deliveraamap mapfor forFRFRactivity
activityplanning:
planning:
no prior
no prior information
information such such asas the
theposition
positionof ofbuildings
buildingsor orthe
thepresence
presenceof ofobstacles
obstaclesisisgivengivenin inadvance.
advance.
In the proposed implementation, the flight has therefore the aim of
In the proposed implementation, the flight has therefore the aim of acquiring only nadir images whileacquiring only nadir images while
flying above obstacles. The flight planning software has been implemented
flying above obstacles. The flight planning software has been implemented to allow the automated to allow the automated
generation of
generation of waypoints
waypoints on on an
an interest
interest area.
area. The
The user
user must
must define
define aa polygon
polygon (of (of any
any shape)
shape) on on Google
Google
Earth and the flight plan is automatically
(a) generated according to
Earth and the flight plan is automatically generated according to predefined overlaps, flight height,predefined
(b) overlaps, flight height,
and UAV
and UAV cameracameraFigure specifications. The
2. (a) The app installed
specifications. flight
Theonflight plan
the smartphone:parameters can
the mission can
plan parameters can be
be be changed
uploaded,
changed by
started, the
byand
the user,
stopped if needed.
user, if needed.
The image location
with the three is planned
buttons on the in order
screen. The to guarantee
position a minimum
of the waypoints overlap
and the UAV (andinnumber
is provided real- of images)
in each point time of theduring the mission. Other information such as the number of images that are collected, streamed
surveyed area. The position and the acquisition order are optimized in order
on the phone or on the laptop is visualized on the bottom left window. (b) The connection between
to minimize the app number of acquired
(on the controller) images toand,
uses the Javascript uploadtherefore,
the file fromtheir acquisition
the laptop and select time. To do that, the
the folder
minimum bounding box ofwillthe
where the images initialThepolygon
be stored. isconnection
status of the initiallyisdetermined.
also given. The flight strip orientation
is set parallel to the longer side of this bounding box as image collection along the same strip is
3.2. UAV Flight Planning
faster than across adjacent strips while the number of strips is also minimized. This strategy assumes
The goal of the UAV mission is to explore a new area and deliver a map for FR activity planning:
locally flat areas to survey. The algorithm can optimize the flight plan for any shape of the area to be
no prior information such as the position of buildings or the presence of obstacles is given in advance.
surveyed,Inasthe shown
proposed inimplementation,
Figure 3. Thethe algorithm returnsthea aim
flight has therefore .csvoffile withonly
acquiring the nadir
waypoint coordinates of
images while
each image andabove
flying the information
obstacles. The on gimbal
flight planningpitch (i.e.,has
software nadir
beenview, ◦
90 ) and
implemented heading
to allow (i.e., equivalent to
the automated
flight stripgeneration
direction). of waypoints
This fileonisan interest
then area. Thefrom
uploaded user must
the define
laptop a polygon
to the (of
UAV any using
shape) ontheGoogle
Javascript and
Earth and the flight plan is automatically generated according to predefined overlaps, flight height,
the smartphone app (see Figure 2). 50 m
and UAV camera specifications. The flight plan parameters can be changed by the user, if needed.
(a) (b)
Figure 3. Example of flight plan on irregular shaped area (a). In this example the algorithm has been
set to collect images with 80% forward and 60% side overlap for each point of the area flying at 50 m
high (b).
The image location is planned in order to guarantee a minimum overlap (and number of images)
in each point of the surveyed area. The position and the acquisition order are optimized in order to
minimize the number of acquired images and, therefore, 50 m their acquisition time. To do that, the
minimum bounding box of the initial polygon is initially determined. The flight strip orientation is
(a) (b)
set parallel to the longer side of this bounding box as image collection along the same strip is faster
Figure 3. Example of flight plan on irregular shaped area (a). In this example the algorithm has been
3. Example
Figure adjacent
than across of flight
strips plan
while onnumber
the irregularofshaped
strips area (a).minimized.
is also In this exampleThisthe algorithm
strategy has been
assumes locally
set to collect images with 80% forward and 60% side overlap for each point of the area flying at 50 m
set to collect
flat areas to survey. images with 80% forward and 60% side overlap for each point
high (b). The algorithm can optimize the flight plan for any shape of the area to be
of the area flying at 50 m
high (b).
surveyed, as shown in Figure 3. The algorithm returns a .csv file with the waypoint coordinates of
The image location is planned in order to guarantee a minimum overlap (and number of images)
each image and the information on gimbal pitch (i.e., nadir view, 90°) and heading (i.e., equivalent to
in each point of the surveyed area. The position and the acquisition order are optimized in order to
minimize the number of acquired images and, therefore, their acquisition time. To do that, the
minimum bounding box of the initial polygon is initially determined. The flight strip orientation is
set parallel to the longer side of this bounding box as image collection along the same strip is faster
than across adjacent strips while the number of strips is also minimized. This strategy assumes locally
flat areas to survey. The algorithm can optimize the flight plan for any shape of the area to be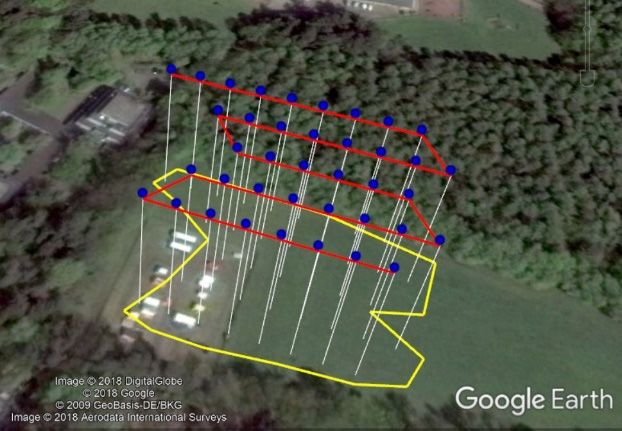
Remote Sens. 2018, 10, x FOR PEER REVIEW 6 of 15
flight strip direction). This file is then uploaded from the laptop to the UAV using the Javascript and
Remote Sens. 2019, 11, 287 6 of 14
the smartphone app (see Figure 2).
3.3. Incremental 3D Map Generation and Building Damage Detection
3.3. Incremental 3D Map Generation and Building Damage Detection
The acquired images are streamed to the laptop during the flight and are iteratively processed
The acquired images are streamed to the laptop during the flight and are iteratively processed to
to generate a building damage map of the area. As shown in Figure 4 two different process are
generate a building damage map of the area. As shown in Figure 4 two different process are integrated:
integrated: (i) the incremental 3D map generation and (ii) the building damage detection.
(i) the incremental 3D map generation and (ii) the building damage detection.
Figure 4. Workflow of the damage map generation.
Figure 4. Workflow of the damage map generation.
The algorithm initializes the orientation of images after the first three images arrive on the laptop.
The
Every new algorithm initializes
image received the orientation
is added to the initialof images
orientation after iteratively
the first three images
enlarging thearrive
imageonblock the
laptop.
with a SfMEvery new image
process. This received
orientation is added
process towas
the initial
implementedorientationusing iteratively
the ColMap enlarging
librarythe image
[32] that
block with a SfM process. This orientation process was implemented
takes advantage of CPU and GPU processing. This library can flexibly modify the parameters using the ColMap library [32]
of
that takes advantage of CPU and GPU processing. This library can
the SfM and get fast and accurate 3D reconstructions of aerial image blocks. The original images flexibly modify the parameters of
the SfM
(4000 ×and3000 get fast and
pixels) areaccurate
downsampled3D reconstructions
to reduce the of aerial image blocks.
computation The original
time needed images
for the (4000
tie-points
×extraction:
3000 pixels) are downsampled to reduce the computation time needed
ColMap implements a GPU enabled version of the SIFT algorithm. The image sequence for the tie-points extraction:
ColMap implements
concatenation is guideda GPU enabled
by the geotagversion of the SIFT
coordinates of the algorithm. The image
images, reducing thesequence
search toconcatenation
the 10 closest
is guidedThe
images. by the geotag
bundle coordinates
block adjustment of the
(BBA) images, reducingrun
is iteratively thetosearch
reduce todeformations
the 10 closest in images. The
the image
bundle block adjustment (BBA) is iteratively run to reduce deformations
block. A local BBA is run for every new image added to the block: only a few neighboring images in the image block. A local
BBA is run for every
are considered in thisnew image
process. added BBA
A global to the is block:
run after only a fewimages
several neighboringare addedimages areblock.
to the considered
In the
in this process. A global BBA is run after several images are added
developed implementation, five images are considered as neighborhood of the local adjustment while to the block. In the developed
implementation,
the global BBA isfive runimages
for everyare10 considered
new images. as neighborhood of the local adjustment while the global
BBA When
is run for
theevery
image10stream
new images.
stops, a final global BBA is run. The geotag of the images is then used
When the image stream
to determine the absolute orientation stops, a final
of theglobal
block.BBA The is sparse
run. The geotag
point cloudof the images by
generated is then used
tie-points
to determine the absolute orientation of the block. The sparse point
is finally used to generate a rough digital surface model (DSM) for the orthorectification process.cloud generated by tie-points is
finally
Damaged usedareasto are
generate
usuallya characterized
rough digitalbysurface model (DSM)
heterogeneously for regions:
textured the orthorectification
many tie-points process.
evenly
Damaged areas are usually characterized by heterogeneously
distributed in the area are therefore extracted and used to generate these (quick) DSMs. textured regions: many tie-points
evenly distributed
Some keyframes in thearearea are therefore
regularly selected extracted
during and used tocollection
the image generate these (quick)
to detect the DSMs.
presence of
building damages (i.e., debris) as described in Section 3.3.1. The classified images are finally used of
Some keyframes are regularly selected during the image collection to detect the presence as
building
input in thedamages (i.e., debris)
orthophoto as described
generation. The closestin Section
nadir 3.3.1.
imageThe classified
to each pointimages
of the DSMare finally
is used used as
in the
input in the orthophoto
orthorectification process generation.
and a Z-bufferThe closest
algorithm nadir[39]image to each
is then usedpoint of the
to avoid DSM mapping
double is used in and the
orthorectification process and a Z-buffer algorithm [39] is then used
occlusion problems. No radiometric correction is applied to blend the radiometric values among the to avoid double mapping and
occlusion problems.
different images No significantly
as this radiometric correction
increases the is applied
computationalto blendtime.the radiometric values among the
different images as this significantly increases the computational time.
3.3.1. Damage Detection Algorithm
3.3.1. Damage Detection Algorithm
The direct use of CNN on the whole image would substantially increase the processing time, thus
The direct
a two-step cascadeuse of CNN onwas
approach theimplemented.
whole image would Debris,substantially
compared toincrease the processing
intact regions, time,
has normally
thus a two-step cascade approach was implemented. Debris,
a very fragmented and irregular structure. It is characterized by sudden radiometric variations compared to intact regions, has
between several small brighter and darker areas generated by the different illumination on the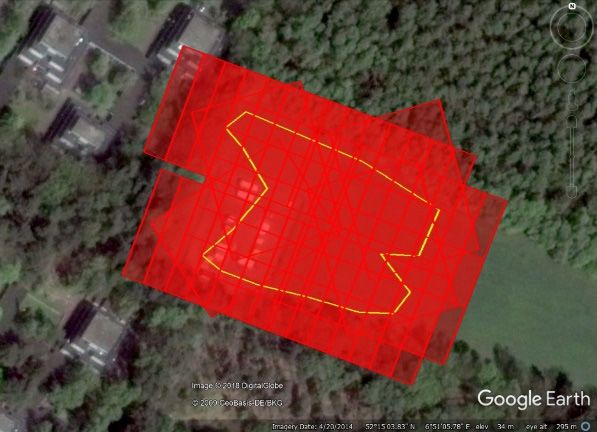
Remote Sens. 2018, 10, x FOR PEER REVIEW 7 of 15
Remote Sens. 2019, 11, 287 7 of 14
normally a very fragmented and irregular structure. It is characterized by sudden radiometric
variations between several small brighter and darker areas generated by the different illumination
fragmented
on surface.surface.
the fragmented The rough Theselection of the areas
rough selection potentially
of the indicatingindicating
areas potentially damages damages
can therefore can
therefore be conducted using a morphological filter and the GRVI index [40]. The first filter the
be conducted using a morphological filter and the GRVI index [40]. The first filter excludes areas
excludes
corresponding
the to homogenously
areas corresponding textured areas
to homogenously (typically
textured areasin correspondence of intact regions)
(typically in correspondence while
of intact
the second eliminates the vegetated regions. The morphological filter is given
regions) while the second eliminates the vegetated regions. The morphological filter is given by a by a sequence of image
closing-by-reconstruction
sequence and opening-by-reconstruction
of image closing-by-reconstruction as proposed in [41].
and opening-by-reconstruction as The first filter
proposed detects
in [41]. The
brighter areas compared to neighboring objects while the darker areas are detected
first filter detects brighter areas compared to neighboring objects while the darker areas are detected with the second
filter.the
with Compared to other
second filter. filtering to
Compared methods, this approach
other filtering methods, defines a minimum
this approach and maximum
defines a minimum size of
and
darker andsize
maximum brighter areasand
of darker thatbrighter
allows to select
areas only
that relatively
allows to selectsmallonlyregions (as insmall
relatively the case
regionsof debris).
(as in
the case of debris). Given the approximate GSD of a UAV flight (typically 1–5 cm), it is possiblethe
Given the approximate GSD of a UAV flight (typically 1–5 cm), it is possible to select regions on to
ground
select with aon
regions size
theinterval
groundpreserving
with a sizetheir shapes
interval in the images.
preserving their shapesBrightinareas larger than
the images. Bright3 pixels
areas
and smaller
larger than 3than 25and
pixels pixels as well
smaller thanas 25
dark regions
pixels smaller
as well than
as dark 15 pixels
regions are used
smaller thanto 15select
pixelscandidate
are used
to select candidate damages (Figure 5b). These sizes have been defined by experimental testsdatasets.
damages (Figure 5b). These sizes have been defined by experimental tests on the available test on the
The image
available is then
test divided
datasets. in patches
The image is then × 80 pixels)
(80divided to assess
in patches (80 xthe 80presence
pixels) toofassess
damages. If a patch
the presence of
has a higher percentage of both brighter and darker pixels, this is considered
damages. If a patch has a higher percentage of both brighter and darker pixels, this is considered a a proxy for potential
building
proxy fordamage
potentialareas. From
building experimental
damage tests,experimental
areas. From 10% of both brighter
tests, 10% andof darker regionsand
both brighter (extracted
darker
by morphological
regions (extracted filters) is a precautionary
by morphological filters)value
is a that allows to extract
precautionary value thethatdamaged
allows toarea without
extract the
generating false negatives. These patches are further selected excluding
damaged area without generating false negatives. These patches are further selected excluding thosethose with large extends of
GRVI values. The following CNN detection algorithm is run only on
with large extends of GRVI values. The following CNN detection algorithm is run only on these these patches to remove false
positives,
patches togreatly
removereducing the timegreatly
false positives, needed to classify
reducing thethe
timecomplete
needed image.to classify the complete image.
10 m 10 m
(a) (b) (c)
Figure 5. Example of (a) debris in an image region. (b) Morphological filter detection: red and blue
areas show darker and brighter regions detected
detected byby the
the morphological
morphological filter,
filter, respectively. An image
patch is considered to correspond to debris if both dark and bright areas are close each other.
other. (c) GRVI
GRVI
on the same region: darker pixels correspond to vegetated areas.
A shallow
A shallow ResNet
ResNet [22]
[22] network
network (see
(see Figure
Figure 6) 6) was
was developed
developed to to allow
allow the
the fast
fast and
and reliable
reliable
detection of the damages. ResNet-like networks have shown very promising
detection of the damages. ResNet-like networks have shown very promising results in the damage results in the damage
detection [27]
detection [27] and
andshallow
shallowversions
versionsofofthis architecture
this architecturehave provided
have reliable
provided results
reliable in complex
results tasks
in complex
such as
tasks autonomous
such as autonomousUAVUAVflights [20]. [20].
flights In ourIn application, we use
our application, a residual
we use block
a residual thatthat
block is formed
is formed as
indicated in Figure 6 (RB—residual block) [22]. Six residual blocks are stacked with
as indicated in Figure 6 (RB—residual block) [22]. Six residual blocks are stacked with a low number a low number
of filters
of filters decreasing
decreasing thethe number
number of of parameters
parameters in in the
the network
network (to
(to reduce
reduce thethe overfitting)
overfitting) and and also
also
decreasing the
decreasing the time
time needed
needed forfor both
both training
training andand testing
testing on
on new
new images.
images. For
For the
the classification
classification partpart of
of
the network, global average pooling followed by a fully connected
the network, global average pooling followed by a fully connected layer are used. layer are used.
Building damage
Building damage detection
detection can
can be
be most
most reliably
reliably detected
detected considering
considering thethe contextual
contextual information
information
of the patch: the developed network uses dilated convolutions and downsampled
of the patch: the developed network uses dilated convolutions and downsampled patches to take patches to take
this
this into account (Figure 6). From experimental tests, the presented network
into account (Figure 6). From experimental tests, the presented network has shown comparable has shown comparable
results to
results to deeper
deeper networks
networks used
used for
for the
the same
same task
task while
while reducing
reducing the
the processing
processing time: deeper and
time: deeper and
more complex networks [14,27] just marginally improved the validation accuracy
more complex networks [14,27] just marginally improved the validation accuracy at the cost of longerat the cost of longer
running processes.
running processes.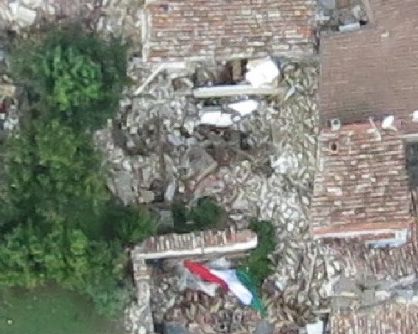
Remote
Remote Sens. 2018, 11,
Sens. 2019, 10, 287
x FOR PEER REVIEW 88 of
of 14
15
Remote Sens. 2018, 10, x FOR PEER REVIEW 8 of 15
Figure 6. Architecture of the convolutional neural network implemented for the building damage
Figure 6. Architecture of the convolutional neural network implemented for the building damage
detection. Each residual block is composed by convolutions (CONV), batch normalizations (BN), and
detection. Each residual block is composed by convolutions (CONV), batch normalizations (BN), and
rectified linear units (relu). The fully connected layer (FC) is used in the classification section.
rectified linear units (relu). The fully connected layer (FC) is used in the classification section.
The developed network was trained using the datasets presented in [27] for UAV images. Two classes
Figure 6. Architecture
The developed of the convolutional
network neural
the network implemented infor thefor
building damage Two
(damaged and intact) have beenwas trained using
considered, using aboutdatasets presented
4000 samples for each [27]
of them UAV
duringimages.
the training.
detection.
classes Each residual block is composed by convolutions (CONV), batch normalizations (BN), and
In order(damaged
to prevent and intact)issues,
overfitting have been considered,
training usingusing
was extended aboutdata
4000 samples for each
augmentation of them
(translation, during
rotation,
rectified linear units (relu). The fully connected layer (FC) is used in the classification section.
the training. In order to prevent overfitting issues, training was extended using data augmentation
and affine transformations). The training consisted of 100 epochs, with a batch size of 128 and 0.1 initial
(translation,
learning rotation, and affine transformations). 40The training consisted ofperformed
100 epochs, with
20%aofbatch
The rate and a learning
developed networkratewasdrop period
trained usingof the epochs.
datasets The validation
presented in [27] for UAVonimages. the
Two
size of
training 128 and
samples 0.1 initial
reported learning
an overallrate and
accuracy a learning
of 92.1%. rate drop period of 40 epochs. The validation
classes (damaged and intact) have been considered, using about 4000 samples for each of them during
performed on 20%
As shown of the training
in Figure samples is
7, the overfitting
network reported an overallthe
able totraining
classify accuracy of 92.1%.
patches, reducing
the training. In order to prevent issues, was extended using datathe number of
augmentation
false positives
(translation, in the and
rotation, scene andtransformations).
affine delivering accurate Thedetections in the images.
training consisted The algorithm
of 100 epochs, was
with a batch
implemented in MATLAB 2018b using the deep learning toolbox and taking advantage
size of 128 and 0.1 initial learning rate and a learning rate drop period of 40 epochs. The validation of the GPU
and parallelon
performed processing.
20% of the training samples reported an overall accuracy of 92.1%.
40 m
(a) (b)
Figure 7. Example of regions detected by the preliminary morphological detection and GRVI (a, blue
40 m
tiles) and the regions confirmed as damages by the CNN (b, red tiles).
(a) (b)
As shown in Figure 7, the network is able to classify the patches, reducing the number of false
Figurein
positives 7. Example
Example
the sceneof
of regions
regions detected
detected by
and delivering the
the preliminary
by accurate
preliminary morphological
in the detection
morphological
detections images. and
detection TheGRVI
and GRVI (a, blue was
algorithm
tiles) and the regions confirmed as damages by the CNN (b, red tiles).
implemented in MATLAB 2018b using the deep learning toolbox and taking advantage of the GPU
and
4. parallel
Tests processing.
and Results
As shown in Figure 7, the network is able to classify the patches, reducing the number of false
positives
All and
4. Tests in the
components
Resultsscene andproposed
of the delivering accurate
approach detections
have in the
been tested images. experiments.
in dedicated The algorithmIn was
this
implemented
paper, only the in two
MATLABmost 2018b using
relevant the deep learning
experiments toolbox
are shown. Theseandrefer
taking advantage
to two ofscenarios
realistic the GPU
and All components
parallel processing. of the proposed approach have been tested in dedicated experiments. In this
executed during the pilot tests of the INACHUS project. In both cases the full pipeline was used to
paper, only the two most relevant experiments are shown. These refer to two realistic scenarios
assess the performance of the methodology. Relatively small areas were surveyed because of legal
executed
4. Tests and during
Resultsthe pilot tests of the INACHUS project. In both cases the full pipeline was used to
constraints. The used CNN was trained before these tests using samples from different locations
assess the performance of the methodology. Relatively small areas were surveyed because of legal
All components of the proposed approach have been tested in dedicated experiments. In this
constraints. The used CNN was trained before these tests using samples from different locations (as
paper, only the two most relevant experiments are shown. These refer to two realistic scenarios
executed during the pilot tests of the INACHUS project. In both cases the full pipeline was used to
assess the performance of the methodology. Relatively small areas were surveyed because of legal
constraints. The used CNN was trained before these tests using samples from different locations (as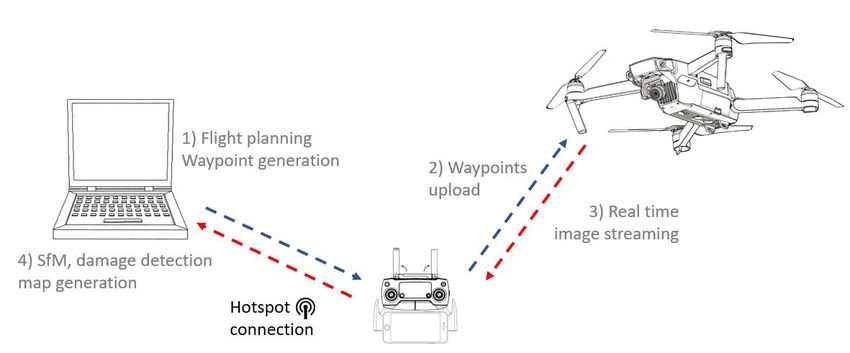
Remote Sens. 2019, 11, 287 9 of 14
(as explained above) to test its transferability to new datasets and therefore its practical usability in
real scenarios.
The same PC was used for both tests: a Dell 5520 - i7 7820HQ (2.9GH) with 32 GB RAM and a
Nvidia
Remote Quadro
Sens. M1200
2018, 10, GPUREVIEW
x FOR PEER graphic card. This allowed GPU to be fully exploited for the SfM (in 9 ofthe
15
ColMap library) as well as for the MATLAB code implementing the morphological filters and the
explained above) to
damage detection testCNN.
with its transferability to new datasets and therefore its practical usability in real
scenarios.
4.1. Lyon
The (France)
same PC was used for both tests: a Dell 5520 - i7 7820HQ (2.9GH) with 32 GB RAM and a
Nvidia Quadro
This datasetM1200 GPU
consists of 91graphic
imagescard. This acquired
that were allowed GPU
over atobuilding
be fullydemolition
exploited for
sitethe SfMFrance)
(Lyon, (in the
ColMap library) as well as for the MATLAB code implementing the morphological filters
specifically prepared for this pilot test. The flight height is 50 m while overlaps are 90% (forward) and the
damage detection with CNN.
and 80% (side). The complete acquisition was performed in approximately 10 min (including take-off
and landing), acquiring an image every 5.5 s on average. The data processing started after receiving
4.1. Lyon (France)
the first images. Downsampled images (one-quarter the original size) were used in the orientation
procedure, while aconsists
This dataset full resolution image was
of 91 images thatused
were foracquired
the damageoveridentification. The damage
a building demolition detection
site (Lyon,
was performed
France) on every
specifically third image
prepared for thisand thistest.
pilot process
The took about
flight 5 s is
height for50
each
m image. In this regard
while overlaps the
are 90%
morphological
(forward) and 80%filtering allowed
(side). the number
The complete of considered
acquisition patches to in
was performed be approximately
reduced by about 10 76% (on
minutes
average only
(including 397 patches
take-off out of 1900acquiring
and landing), per image). an image every 5.5 seconds on average. The data
The image
processing orientation
started and the damage
after receiving the first detection were completedimages
images. Downsampled about 50 s after the acquisition
(one-quarter of
the original
the last
size) image:
were usedthis is still
in the compatible
orientation with the near
procedure, while real-time goals as the
a full resolution UAVwas
image onlyused
tookfor
approximately
the damage
30 s to return from
identification. the final detection
The damage waypoint wasand performed
land in its initial position.
on every An additional
third image and this 55 s weretook
process necessary
about
5toseconds
deliver for
theeach
finalimage.
orthophoto
In thisinregard
GeoTIFF format to visualize
the morphological themallowed
filtering on external tools such
the number as Google
of considered
Earth asto
patches shown in Figure
be reduced 8.
by about 76% (on average only 397 patches out of 1900 per image).
25 m
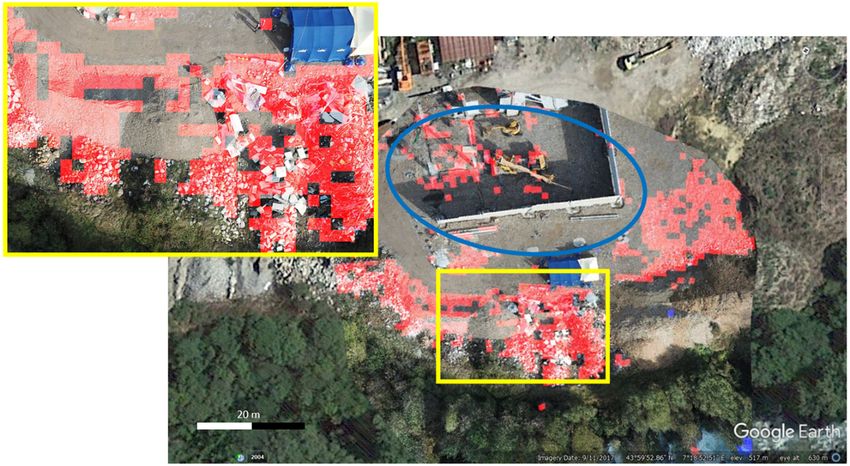
Figure 8. Final damage map over the test area in Lyon (France). Yellow and blue pictures show two
examples of damages detected on the original images.
orthophoto
The image was rectified
orientation and the using
damage thedetection
tie-pointswere
extracted in theabout
completed image 50orientation
seconds afteras the
3D.
The generated DSM is therefore suboptimal and includes considerable distortions in correspondence
acquisition of the last image: this is still compatible with the near real-time goals as the UAV only
of theapproximately
took edges of the image block where
30 seconds fewer
to return fromtie-points
the finalare availableand
waypoint to correctly reconstruct
land in its the scene
initial position. An
in 3D. However,
additional the used
55 seconds UAV
were does nottohave
necessary an accurate
deliver the finalGNSS on board
orthophoto and systematic
in GeoTIFF formatshifts (2–3 m
to visualize
in an easterly
them direction)
on external are visible
tools such whenEarth
as Google comparing
as shownthe in
orthophoto
Figure 8. with Google Earth. However, map
deformations and systematic
The orthophoto errorsusing
was rectified in georeferencing
the tie-pointsare acceptable
extracted considering
in the the specific
image orientation as purpose
3D. The
of the mapping. The detection algorithm was able to correctly localize the damages.
generated DSM is therefore suboptimal and includes considerable distortions in correspondence of The quantitative
the edges of the image block where fewer tie-points are available to correctly reconstruct the scene in
3D. However, the used UAV does not have an accurate GNSS on board and systematic shifts (2–3 m
in an easterly direction) are visible when comparing the orthophoto with Google Earth. However,
map deformations and systematic errors in georeferencing are acceptable considering the specific
purpose of the mapping. The detection algorithm was able to correctly localize the damages. The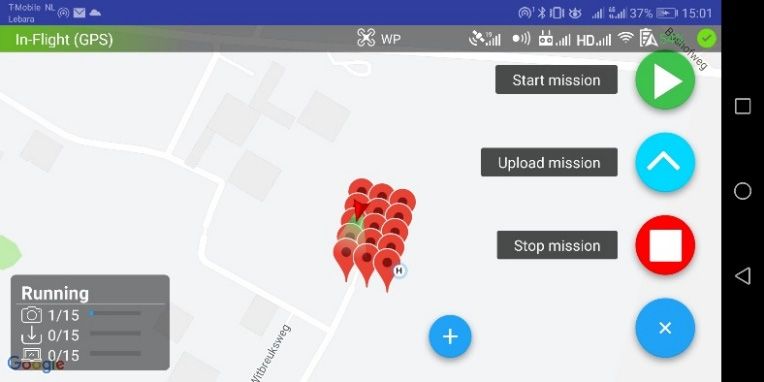
Remote Sens. 2019, 11, 287 10 of 14
Remote Sens. 2018, 10, x FOR PEER REVIEW 11 of 15
assessment (Table 1) shows recall, precision and F1-score computed on the orthophoto (Figure 8):
4.2. Roquebilliere (France)
a manually delineated damage mask was used as ground truth. The achieved values confirm that the
only This dataset is composed
morphological by 24 images
filter overestimates acquired in of
the percentage a construction
true positives area formerly
while used as quarry.
CNN provides better
The flight
results was
in all theperformed
consideredatmetrics.
50 m height with 80%
In general, forward
building overlap
damages are and 60% side overlap.
overestimated Part of the
in correspondence
scene
of roofsis and
occupied
manmadeby a rubble
objectspile
thaton one side
appear very ofsimilar
the construction
to building area (Figure
debris 9). images. Small false
in the
A large
negative percentage
regions of the scene
can be detected closeistoalso
the occupied
building in bythe
vegetation
shadowed and barethis
area: soil. The flight was
misclassification
slower
can than the previous
be explained case (probably
by considering because
that these smallof the wind)
regions andvisible
are not imagesinwere
many acquired
imagesat(due
7 seconds
to the
intervals. The complete flight took 4:30 minutes.
building occlusions) as well as by shadows and poor image quality in this part of the scene.
The image orientation and damage detection were performed in real-time, while the generation
of theTable 1. Comparison
orthophoto was of the results using
completed the only morphological
few seconds before the UAV filter landing.
(MF) and adding
In thisincase,
cascade
thethe
longer
CNN (MF + CNN).
intervals and the lower number of images supported the completion of the work at reduced times.
The damage detection was performed regularly on every third image. As in the previous test,
MF MF + CNN
the morphological filters and the detection of vegetation reduced the number of patches processed
Recall 0.821 0.831
by the neural network to 24%. The 81% of these patches were then classified as damages. The
Precision 0.573 0.839
generated orthophoto has some small shifts compared
F1-score 0.659 to0.835
the Google Earth map, as discussed in the
previous case. Given the difficulty in defining a univocal ground truth (because of the presence of
many
4.2. objects mimicking
Roquebilliere (France) the debris), no quantitative assessment has been performed in this test.
Qualitatively, the number of false positives is relatively high: the algorithm was trained (with real
case This dataset
images) is composed
to detect concrete byand
24 images acquired
brick debris thatinmimic
a construction area made
rubble piles formerly used asand
of stones quarry.
soil
The flight was performed at 50 m height with 80% forward overlap and 60% side overlap.
largely present in this scene. Some additional false positives are then visible inside the building under Part of the
scene is occupied
construction. by a rubble
No false negativespileare
onvisible
one sidein of
thethe construction
delivered area (Figure 9).
results.
20 m
Figure 9.
Figure 9. Final
Final damage
damage map
map over
over the
the test
test area
area in
in Roquebilliere
Roquebilliere (France).
(France). The
The yellow
yellow picture
picture shows
shows
some examples
some examples of of damages
damages detected
detected on
on the
the original
original images.
images. The
The blue
blue circle
circle defines
defines the
the construction
construction
site area.
site area.
A large percentage of the scene is also occupied by vegetation and bare soil. The flight was slower
5. Discussion
than the previous case (probably because of the wind) and images were acquired at 7 s intervals.
The performed tests have shown the suitability of the presented approach for near real-time
The complete flight took 4:30 min.
damage mapping. The stop & go flight mode implemented in the app reduces the productivity of the
The image orientation and damage detection were performed in real-time, while the generation of
flight: between 8 and 12 images per minute were normally acquired in the performed tests,
the orthophoto was completed few seconds before the UAV landing. In this case, the longer intervals
depending on the distance among them and the weather conditions. The stop & go however allows
and the lower number of images supported the completion of the work at reduced times.
a better quality of the images (i.e., no motion blur) and gives a higher flexibility compared to
acquisitions with fixed time intervals as the gimbal can be rotated for each image independently. The
delay between image acquisition and storing on the laptop is normally less than 2 seconds. TheRemote Sens. 2019, 11, 287 11 of 14
The damage detection was performed regularly on every third image. As in the previous test,
the morphological filters and the detection of vegetation reduced the number of patches processed by
the neural network to 24%. The 81% of these patches were then classified as damages. The generated
orthophoto has some small shifts compared to the Google Earth map, as discussed in the previous
case. Given the difficulty in defining a univocal ground truth (because of the presence of many objects
mimicking the debris), no quantitative assessment has been performed in this test. Qualitatively,
the number of false positives is relatively high: the algorithm was trained (with real case images) to
detect concrete and brick debris that mimic rubble piles made of stones and soil largely present in this
scene. Some additional false positives are then visible inside the building under construction. No false
negatives are visible in the delivered results.
5. Discussion
The performed tests have shown the suitability of the presented approach for near real-time
damage mapping. The stop & go flight mode implemented in the app reduces the productivity of the
flight: between 8 and 12 images per minute were normally acquired in the performed tests, depending
on the distance among them and the weather conditions. The stop & go however allows a better
quality of the images (i.e., no motion blur) and gives a higher flexibility compared to acquisitions with
fixed time intervals as the gimbal can be rotated for each image independently. The delay between
image acquisition and storing on the laptop is normally less than 2 s. The performed tests showed that
the streaming is faster and more reliable if no obstacles are present between the remote control and
the UAV.
The approach can execute the orientation of the images and the simultaneous damage detection
in real-time for small blocks, as was the case in the second test. Large image blocks (as in the Lyon test)
usually determine delays in the processing of the images: this is mainly due to the global BBA in the
image orientation as a larger number of observations progressively needs to be processed, requiring
more time. How often to perform the global adjustment in the image block is one of the main aspects
to be considered to reduce the processing time. Many implementations in the robotics domain only
perform local BBA (or similar approaches) to make the orientation progress more efficient, often at
the cost of larger block deformations. In the presented application, the geometric consistency of the
generated map still represents a priority that cannot be neglected for a slightly faster implementation.
Other elements such as the resolution of the images used in the orientation or the performance of the
used laptop can also strongly influence the real-time feasibility of the approach.
The use of deep learning algorithms outperforms traditional detection algorithms but requires
higher processing times. The adoption of a morphological filter coupled with a vegetation index
has greatly reduced the search for building damages in the image, reducing the tiles processed by
the neural network. The parameters of the morphological filter are intentionally relaxed to prevent
the generation of false negatives. As shown in Section 4.1, few damages can be classified as intact
regions (i.e., false negatives), but this problem can be explained considering the presence of shadows,
the building occlusions in many images and the poor image quality. It must be noted that the damage
detection on these regions fails using both the morphological filter and the CNN. False positives are
more advisable than false negatives from a FR’s perspective. However, the performed tests (also using
other datasets) have demonstrated that this kind of error is limited to very small areas and peculiar
conditions (i.e., shadowed areas, blurred images, etc.). In general, the implemented CNN has allowed
to generate reliable and complete detections despite its (relatively) limited number of layers. Damages
are generally overestimated as many objects look very similar to damaged structures.
6. Conclusions and Future Developments
This paper has demonstrated that building damage maps can be generated in near real-time using
low-cost and commercial UAVs. The solution was conceived to give an answer to the practical needs
of FR involved in urban search and rescue operations: FR involved in the INACHUS project haveYou can also read