Ozone Monitor (OZONE) Instrument Handbook - DOE/SC-ARM-TR-179 - Atmospheric ...
←
→
Page content transcription
If your browser does not render page correctly, please read the page content below
DOE/SC-ARM-TR-179

Ozone Monitor (OZONE) Instrument Handbook

SR Springston     D Chand
BD Ermold         JE Shilling
CJ Flynn

Revised October 2020
DISCLAIMER

This report was prepared as an account of work sponsored by the U.S.
Government. Neither the United States nor any agency thereof, nor any of
their employees, makes any warranty, express or implied, or assumes any
legal liability or responsibility for the accuracy, completeness, or
usefulness of any information, apparatus, product, or process disclosed, or
represents that its use would not infringe privately owned rights. Reference
herein to any specific commercial product, process, or service by trade
name, trademark, manufacturer, or otherwise, does not necessarily
constitute or imply its endorsement, recommendation, or favoring by the
U.S. Government or any agency thereof. The views and opinions of
authors expressed herein do not necessarily state or reflect those of the
U.S. Government or any agency thereof.
DOE/SC-ARM-TR-179

Ozone Monitor (OZONE) Instrument
Handbook

SR Springston, Brookhaven National Laboratory
D Chand, Pacific Northwest National Laboratory (PNNL)
B Ermold, PNNL
JS Shilling, PNNL
CJ Flynn, University of Oklahoma

Revised October 2020

Work supported by the U.S. Department of Energy,
Office of Science, Office of Biological and Environmental Research
SR Springston et al., October 2020, DOE/SC-ARM-TR-179

             Acronyms and Abbreviations
AAF       ARM Aerial Facility
AGL       above ground level
AMF       ARM Mobile Facility
AMF1      ARM Mobile Facility 1 (includes AOS01 nee MAOS A and MAOS C now
          sunset)
AMF2      ARM Mobile Facility 2
AMF3      ARM Mobile Facility located at Oliktok Point, Alaska as of September 2020
AOS       aerosol observing system
ARM       Atmospheric Radiation Measurement
ASCII     American Standard Code for Information Interchange
ASI       Ascension Island
atm       atmosphere (unit of pressure)
BNL       Brookhaven National Laboratory
DOE       U.S. Department of Energy
DQPR      Data Quality Problem Report
DQR       Data Quality Report
ENA       Eastern North Atlantic
EPA       Environmental Protection Agency
GUI       Graphical User Interface
IOP       intensive operational period
MAOS      mobile aerosol observing system (an intensively instrumented AOS), renamed
          AMF1 AOS01
NetCDF    Network Common Data Form
NIST      National Institute of Standards and Technology
NTP       Network Time Protocol
NYS DEC   New York State Department of Environmental Conservation
OLI       Oliktok Point, North Slope of Alaska
OSS       Operations Status System
PFA       perfluoroalkoxy alkane (a fluoropolymer)
QA        quality assurance
QC        quality control
RMS       root mean square
SGP       Southern Great Plains
STP       standard temperature and pressure (273.15 oC, 1 atm)
UTC       Coordinated Universal Time
UV        ultraviolet
VAC       volts alternating current

                                        iii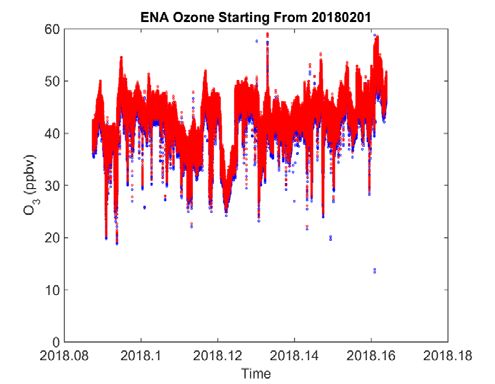
SR Springston et al., October 2020, DOE/SC-ARM-TR-179

                                                                   Contents
Acronyms and Abbreviations ...................................................................................................................... iii
1.0 Instrument Title .................................................................................................................................... 1
2.0 Contact Information.............................................................................................................................. 1
       2.1 Mentor .......................................................................................................................................... 1
       2.2 Translators .................................................................................................................................... 1
       2.3 Developer ..................................................................................................................................... 1
3.0 Vendor/Developer Contact Information ............................................................................................... 2
4.0 Instrument Description ......................................................................................................................... 2
5.0 Measurements Taken ............................................................................................................................ 3
6.0 ARM AOS Ozone Data ........................................................................................................................ 4
       6.1 ARM Data Levels......................................................................................................................... 4
               6.1.1 AOS Ozone Native Data (Level 00 or Raw Ozone Data) ................................................. 4
               6.1.2 Level a1 Ozone Data ......................................................................................................... 7
               6.1.3 Level b0 and b1 Ozone Data ............................................................................................. 9
               6.1.4 Filename Conventions and File Structure ....................................................................... 11
       6.2 Data Ordering ............................................................................................................................. 13
       6.3 Data Plots ................................................................................................................................... 14
           6.3.1 Level ‘a0’ Data Plots ....................................................................................................... 14
               6.3.2 Level ‘a1’ Data Plots ....................................................................................................... 18
               6.3.3 Level “b1” Data Plots ...................................................................................................... 19
       6.4 Data Quality Checks................................................................................................................... 20
       6.5 Calibration Database .................................................................................................................. 22
7.0 Technical Specification ...................................................................................................................... 22
       7.1 Units ........................................................................................................................................... 22
       7.2 Range.......................................................................................................................................... 22
       7.3 Accuracy .................................................................................................................................... 23
       7.4 Repeatability .............................................................................................................................. 23
       7.5 Sensitivity ................................................................................................................................... 23
       7.6 Uncertainty ................................................................................................................................. 24
       7.7 Output Values............................................................................................................................. 24
8.0 Instrument System Functional Diagram ............................................................................................. 24
9.0 Instrument/Measurement Theory........................................................................................................ 27
10.0 Setup and Operation of Instrument ..................................................................................................... 27
11.0 Software .............................................................................................................................................. 27
12.0 Calibration .......................................................................................................................................... 28
13.0 Maintenance........................................................................................................................................ 28

                                                                              iv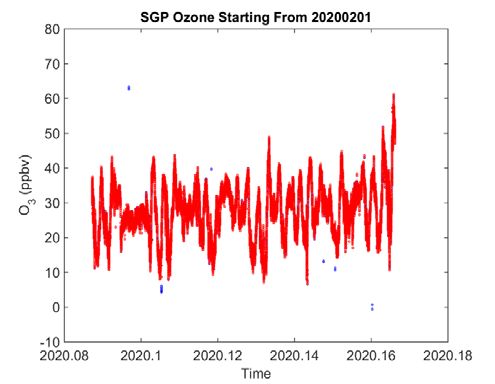
SR Springston et al., October 2020, DOE/SC-ARM-TR-179

14.0 Safety .................................................................................................................................................. 29
15.0 Citable References .............................................................................................................................. 29
16.0 Data Tools for ARM NetCDF ............................................................................................................ 29
17.0 Infrastructure/Developer Links........................................................................................................... 30
18.0 Summary and History of Changes ...................................................................................................... 30

                                                                      Figures
1     Model 49i (AAF, AMF1, AMF2, AMF3, ENA, and SGP) (from Ozone Analyzer Manual). ............... 2
2     Bit-by-bit meaning of status flag. ........................................................................................................... 5
3     Raw ozone data for one month. ............................................................................................................ 14
4     Typical zero, span check. ..................................................................................................................... 15
5     Housekeeping data for one month. ....................................................................................................... 16
6     Zero and span check stability over one month. .................................................................................... 17
7     Processed data for one month. .............................................................................................................. 18
8     Ozone concentration (top left), cell pressure (top right) and sample flow in cell-A and B (lower
      panels) for October 12 2013 at ENA site. ............................................................................................ 19
9     Ozone concentration at SGP (top left), ENA (bottom left), and OLI (right panels) for multiple
      months or years. ................................................................................................................................... 20

                                                                       Tables
1     Field names of ingested/translated data with units and other information. ............................................ 8

                                                                               v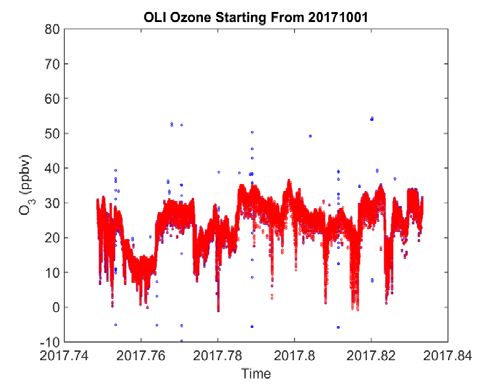
SR Springston et al., October 2020, DOE/SC-ARM-TR-179

1.0   Instrument Title
 Ozone (O3) Analyzer (Monitor)

2.0   Contact Information

 2.1 Mentor
 Stephen R. Springston
 Brookhaven National Laboratory, Building 815E
 Upton, New York 11973-5000
 srs@bnl.gov

 2.2 Translators
 Duli Chand
 Pacific Northwest National Laboratory
 902 Battelle Boulevard
 P.O. Box 999, MSIN K9-30
 Richland, Washington 99352
 Duli.Chand@pnnl.gov

 John E. Shilling
 Pacific Northwest National Laboratory
 902 Battelle Boulevard
 P.O. Box 999, MSIN K4-28,
 Richland, Washington 99352
 John.Shilling@pnnl.gov

 Connor J. Flynn
 University of Oklahoma, School of Meteorology
 120 David L Boren Blvd
 Norman, Oklahoma 73072
 Connor.J.Flynn@ou.edu

 2.3 Developer
 Brian Ermold
 Pacific Northwest National Laboratory
 902 Battelle Boulevard
 Richland, Washington 99352
 Brian.Ermold@pnnl.gov

                                                     1
SR Springston et al., October 2020, DOE/SC-ARM-TR-179
3.0 Vendor/Developer Contact Information
Thermo Fisher Scientific Inc.
Air Quality Instruments
27 Forge Parkway
Franklin, Massachusetts 02038
www.thermo.com/aqi
508-520-0430
4.0 Instrument Description
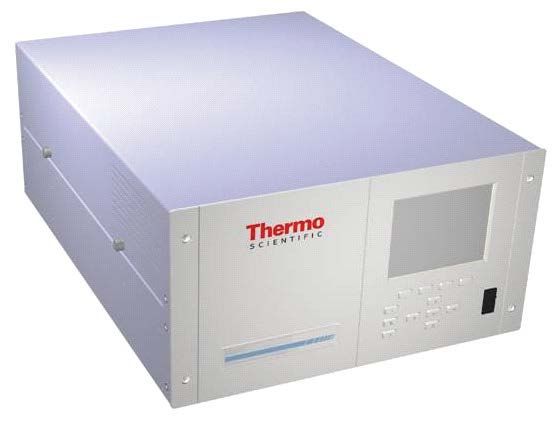
The Thermo Fisher Scientific Ozone Analyzer instruments are deployed at multiple ARM surface sites
and on the Aerial Facility (AAF) manned aircraft. This covers the ARM Mobile Facility (AMF1) aerosol
observing system (AOS01) previously known as MAOS A, ARM Mobile Facility (AMF2) aerosol
observing system (AOS02), ARM Mobile Facility (AMF3) aerosol observing system (AOS03), Eastern
North Atlantic (ENA) aerosol observing system (AOS06), and the Southern Great Plains (SGP) aerosol
observing system (AOS07). The ozone (O3) instrument is shown in the photograph below.
Figure 1. Model 49i (AAF, AMF1, AMF2, AMF3, ENA, and SGP) (from Ozone Analyzer Manual).
The ozone monitor measures ozone based on absorbance of ultraviolet (UV) light by ozone molecules at a
wavelength of 254 nm. The absorbance is directly related to ozone concentration through the
Beer-Lambert Law:
I/I0 = e-KLC (1)
2SR Springston et al., October 2020, DOE/SC-ARM-TR-179
where
K = molecular absorption coefficient, 308 cm-1 (at 0°C and 1 atmosphere)
L = length of cell, 38 cm
C = ozone concentration, in parts per million (ppm)
I = UV light intensity of sample ,with ozone (sample gas)
Io = UV light intensity of sample, without ozone (reference gas).
This is a classical technique for measuring in situ ozone concentrations. The basic instrument
configuration has been the same for at least 20 years with minor enhancements of electronics and the user
interface. The dual-cell configuration with selective removal of ozone in the reference cell reduces any
response from interfering species. Following each 4-s measurement cycle, the reference and sample cells
are reversed, so optical effects (change in lamp output, detector gain, cell cleanliness, etc.) are rejected. In
addition, the instrument contains an ozone source to check response and stability over time.
External communication with the monitor is available through an ethernet port configured through the
instrument network of the AOS systems. The Model 49i is part of the i-series of Thermo Scientific
Instruments. The i-series instruments are designed to interface with external computers through the
proprietary Thermo Scientific iPort software. However, this software is somewhat cumbersome and
inflexible. Brookhaven National Laboratory has written an interface program in National Instruments
LabView that both controls the Model 49i monitor and queries the unit for all measurement and
housekeeping data. The LabView virtual interface or “vi” (essentially a program in LabView) ingests all
raw data from the instrument and produced output files in a uniform data format, similar to other
instruments in the AOS, and described in detail in section 6.0.
Modifications for the instrument include:
1. Addition of a 47-mm x 5-µm Teflon filter on the inlet line.
2. Internal plumbing changes to allow filtered (to remove ozone) ambient air to be used in the photolysis
cell (ozone source) for periodic and automatic span checks.
5.0 Measurements Taken
The primary measurement output from the Thermo Scientific Ozone Analyzer is the concentration of the
analyte (O3) reported at 1-s resolution in units of ppbv in ambient air. Note that because of internal
pneumatic switching limitations the instrument only makes one independent measurement every
4 seconds. Thus, the same measured concentration is reported repeated roughly four times at the uniform,
monotonic 1-s time base used in the AOS systems. Accompanying instrument outputs include sample
temperatures, flows, chamber pressure, lamp intensities, and housekeeping information. In addition to the
measured fields, there is also a field recording operator comments made at any time while data is being
collected.
3SR Springston et al., October 2020, DOE/SC-ARM-TR-179
6.0 ARM AOS Ozone Data
6.1 ARM Data Levels
Data files obtained through the ARM Data Center are distinguished by data level denoting specific
processing applied by ARM. Data level “00” files are stored exactly as received by ARM data collections
except that original file names are modified to include a tag identifying the site, facility, source
datastream, and the date and time the files were received by the ARM Site Data System. Because the
internal content is unchanged, the format of “00”-level files vary widely from data source to data source.
In the interest of uniformity and to ensure that critical metadata is provided (even when not available in
the native files) ,ARM routinely “ingests” native data into higher data levels stored in NetCDF format.
Broadly speaking, ARM data files without ARM standardized QC are termed “a-level”, files with
standardized QC with calibration are termed “b-level”, and data files incorporating multiple sources and
value-added products are termed “c-level”.
6.1.1 AOS Ozone Native Data (Level 00 or Raw Ozone Data)
The ‘raw’ instrument datastream output includes all parameters reported by the instrument at native
frequency of 0.25 to 1 Hz. Metadata are automatically included and saved in hourly ASCII files. The raw
data termed level “00” is not relevant for most ARM data users but is archived so that it can be
reprocessed if needed.
Metadata are now included in every hourly data file. The metadata are:
Row 1: Filename
Row 4 (col 1 only): ARM Climate Research Facility
Row 5: Site Platform
Row 7: Last revised date
Row 9: Instrument
Row 10: Instrument Serial Number/ARM Inventory Number (WD#)
Row 13: Instrument Mentor/Affiliation
Rows 14-19: Comments (operational conditions, calibrations, etc.)
Rows 21-24: Constants (usually defined in Comments)
Row 35: Column title
Row 36: Column units line 1
Row 37: Column units line 2
Row 40: First row of data
Data fields in the raw output begin on Row 40 and are:
Date Time Primary Date/Time stamp yyyy-mm-dd hh:mm:ss as set by the instrument
computer and referenced to the site NTP server (or if unavailable, linked to the
‘master’ computer in the AOS)
4SR Springston et al., October 2020, DOE/SC-ARM-TR-179
Inst. Time Time set on the internal instrument computer hh:mm:ss. This should be equal to
the primary Date/Time, but can vary if operator has not set the instrument time.
This value is used as a relative number between data lines.
Inst. Date Date set on the internal instrument computer mm-dd-yyyy. Note this is not a
standard format. This value should be equal to the primary Date/Time, but can
vary if the operator has not set the instrument time. This value is used only for
diagnostic checks.
Flags %hhhhhhhh (eight hexadecimal digits) showing the state of the instrument. The
meaning of individual flags is described in Figure 2 taken from vendor manual,
shown below:
Figure 2. Bit-by-bit meaning of status flag.
O3 Mixing ratio (in ppbv) of ozone at ambient temperature, pressure, and relative
humidity.
Pres Pressure inside the measurement cell (mm Hg).
Bench Temp Temperature (oC) of the measurement cell. The bench is temperature controlled
by a heater in a feedback loop.
O3 Lamp Temp Temperature (oC) of the ozone lamp (the lamp used to measure ozone, NOT the
other lamp used to generate calibration gas. The lamp block is temperature
controlled by a heater in a feedback loop.
5SR Springston et al., October 2020, DOE/SC-ARM-TR-179
Flow A Flow through cell A (SLPM). This flow is not calibrated. It is useful to indicate a
dirty or blocked inlet filter. The reported measurement is not directly affected by
flow.
Flow B Flow through cell B (SLPM). This flow is not calibrated. It is useful to indicate a
dirty or blocked inlet filter. The reported measurement is not directly affected by
flow.
Noise A Electronic noise in channel A. This value is normally < 10. Excess values can
indicate need to clean the cell or replace the lamp.
Noise B Electronic noise in channel B. This value is normally < 10. Excess values can
indicate need to clean the cell or replace the lamp.
Avg Time Time in seconds that gas flows through the reference and sample cells before
switching the cells. If the instrument is set for fast response (default for AOS
systems), the value reported is 2.5X the actual averaging time. Thus all
measurements in AOS systems are reported as 10 s when the averaging time is
actually 4 s.
Cell A Int The raw detector value in Hz. This is a measurement of lamp throughput for the
system. When the Intensity goes below ~60,000, the lamp voltage must be
increased or the lamp replaced.
Cell B Int Same as Cell A Int except for Cell B.
Lamp temp Temperature (oC) for the ozonizer lamp. This temperature is controlled in a
feedback loop.
Lamp Volt Bench Control voltage driving the main (analytical lamp).
Lamp Volt OZ Control voltage driving the ozonizer (calibration lamp).
Range This controls the analog output and is not germane to the digital recording.
Lamp Percentage setting of the ozonizer lamp. Should not be changed.
O3 Coef A nominal slope coefficient to the nominal ozone value to a calibrated ozone
value. This coefficient should not be changed. Calibrations are done relative to
the ‘nominal’ ozone signal output.
O3 Bkg A nominal offset to the nominal ozone value to a calibrated ozone value. This
offset should not be changed. Calibrations are done relative to the ‘nominal’
ozone signal output.
Diag Volt mb 24 Diagnostic point for the 24V PS on the motherboard.
Diag Volt mb 15 Diagnostic point for the 15V PS on the motherboard.
6SR Springston et al., October 2020, DOE/SC-ARM-TR-179
Diag Volt mb 5 Diagnostic point for the 5V PS on the motherboard.
Diag Volt mb 3.3 Diagnostic point for the 3.3V PS on the motherboard.
Diag Volt mb -3.3 Diagnostic point for the -3.3V PS on the motherboard.
Diag Volt mib 24 Diagnostic point for the 24V PS on the measurement interface board.
Diag Volt mib 15 Diagnostic point for the 15V PS on the measurement interface board.
Diag Volt mib -15 Diagnostic point for the -15V PS on the measurement interface board.
Diag Volt mib 5 Diagnostic point for the 5V PS on the measurement interface board.
Diag Volt mib 3.3 Diagnostic point for the 3.3V PS on the measurement interface board.
L1 – L5 These are levels (in %) to drive the calibration lamp during span checks. These
values were set after calibration against the New York State Department of
Environmental Conservation (NYS DEC) calibration of the individual
instruments.
Pres Comp On/Off Flag to determine whether pressure compensation is applied. This flag
should be on.
Temp Comp On/Off Flag to determine whether temperature compensation is applied. This flag
should be on.
OZ Status On/Off Flag to determine the ozonizer status.
Gas Units Units of measurement. Should always be ppb.
Gas Status Instrument output. Sample, Zero, Levels 1-5.
Comment This field is the last field in the datastream. It allows operators to enter free-form
text from the graphical user interface at any time. Operational notes or
disruptions may be entered here.
These data are saved unaltered from what is produced by the instrument. Processing of the raw data must
be able to deal with more than 1 record per second and time periods with either no data or only a
date/time stamp in the record. If the instrument does not output data, the instrument computer can include
a record of empty fields. Since neither the instrument clock nor the instrument computer clock are perfect,
minor irregularities (dithering) in the output datastream invariably occur.
6.1.2 Level a1 Ozone Data
The raw (00 level) data are ingested for uniformity to NetCDF format, which is designated the “a1” data
level. NetCDF is a platform-independent scientific data format that supports incorporation of scientific
data and metadata. The NetCDF is a commonly used scientific format, very compact, and can hold the
7SR Springston et al., October 2020, DOE/SC-ARM-TR-179
data in multiple dimensions. All the fields from raw (00) data are processed ingested into an a1.
Generally, a1 data are also of less interest to most ARM users as higher levels (e.g., b1, c1) of the data
will have additional calibrations and QA/QC applied. As an example, the name of a1 Ozone data file
beginning at midnight, October 8 2013 at ENA site (C1) is ‘enaaoso3C1.a1.20131008.000000.nc’. Field
names of the ingested/translated data along with units and other information are listed in the table below:
Table 1. Field names of ingested/translated data with units and other information.
Variable full name Variable name used in DOD Unit
seconds since 197
Time of record time_of_last_state_change
0-1-1 00:00:00
Ozone concentration o3 ppbv
Ozone pressure o3_pressure kPa
Bench temperature o3_bench_temperature degC
Ozone lamp temperature o3_lamp_temperature degC
Flow in cell A flow_a L/min
Flow in cell B flow_b L/min
Electric noise in cell A noise_a Hz
Electric noise in cell B noise_b Hz
Instrument averaging time averaging_time s
Intensity in cell A intensity_a Hz
Intensity in cell B intensity_b Hz
Lamp temperature lamp_temperature degC
Lamp bench voltage lamp_voltage_bench V
Lamp voltage ozonizer lamp_voltage_ozonizer V
Lamp level lamp_level %
Instrument range setting range ppbv
Instrument ozone coefficient o3_coefficient unitless
Ozone background o3_background ppbv
Calibration ratio level 1 calibration_level_1 %
Calibration ratio level 2 calibration_level_2 %
Calibration ratio level 3 calibration_level_3 %
Calibration ratio level 4 calibration_level_4 %
Calibration ratio level 5 calibration_level_5 %
Pressure compensation state pressure_compensation_state unitless
Temperature compensation state temperature_compensation_state unitless
Ozone lamp state o3_lamp_state unitless
Gas state gas_state unitless
8SR Springston et al., October 2020, DOE/SC-ARM-TR-179
Variable full name Variable name used in DOD Unit
Diagnostic +24 volts at motherboard diagnostic_voltage_mb_24 V
Diagnostic +15 volts at motherboard diagnostic_voltage_mb_15 V
Diagnostic +5 volts at motherboard diagnostic_voltage_mb_5 V
Diagnostic +3.3 volt at motherboard diagnostic_voltage_mb_3p3 V
Diagnostic -3.3 volts at motherboard diagnostic_voltage_mb_minus_3p3 V
Diagnostic +24 volts at measurement
diagnostic_voltage_mib_24 V
interface board
Diagnostic +15 volts at measurement
diagnostic_voltage_mib_15 V
interface board
Diagnostic -15 volts at measurement
diagnostic_voltage_mib_minus_15 V
interface board
Diagnostic +5 volts at measurement
diagnostic_voltage_mib_5 V
interface board
Diagnostic +3.3 volts at measurement
diagnostic_voltage_mib_3p3 V
interface board
Ozone flag string o3_flags Unitless
North latitude Lat degree_N
East longitude Lon degree_E
Altitude above mean sea level Alt m
6.1.3 Level b0 and b1 Ozone Data
The ingested “a1” level of the data described in section 6.1.2 are further processed to: 1) add more QC
checks on data quality, 2) subtract a baseline representing the instrument’s ozone reading when presented
with zero air, and 3) apply a linear calibration coefficient to account for slight deviations from Equation 1.
During normal operations, the instrument is challenged twice a day with zero air that has been scrubbed
of ozone. The measurement value during these zero periods represent an instrument baseline that must be
removed from sample measurements. Examination of the data showed that this instrument baseline in a1
version drifts slowly in time and that individual measurements were too noisy for direct use. Therefore,
we calculate the instrument baseline from data a1 by moving average for 3-6 weeks. The estimation of the
zero baseline is saved in data level b0. The b0 data, stored as intermediate records, is needed to calculate
the b1 data and is not intended for ARM users.
In addition, we apply a linear calibration coefficient determined by the instrument mentor from a
five-point span check measured at the NYS DEC standards laboratory. Several data fields are subjected to
automated QC checks and the results of these checks are bit-packed into a single QC variable (qc_ o3),
which provides a metric for data reliability. Like the a1 level, the higher-processed b0 and b1 level of the
data are also stored in ‘nc’ format. As an example, the name of b1 level of ozone data file for October 8
2013 at ENA site (C1) is ‘enaaoso3C1.b1.20131008.000000.nc’. All the field names in b1 level are the
same as a1, except quality check results on field ‘ozone concentration’ (qc_o3). The qc_o3 is unitless, has
bits, as described in the list below. Also, the O3 concentrations in b1 are calibrated values with revised
9SR Springston et al., October 2020, DOE/SC-ARM-TR-179
QCs in each b1 file. Some of the fields (e.g., instrument pressure warnings), are specified by the mentor
uniquely for each site and or intensive operational period (IOP). The quality flags qc_o3(time):int] and its
inputs are listed below:
qc_o3(time):int
long_name = Quality check results on field: ozone concentration
units = unitless
description = This field contains bit-packed integer values, where each bit represents a QC test on the
data. Non-zero bits indicate the QC condition given in the description for those bits; a value of 0 (no bits
set) indicates the data has not failed any QC tests.
pressure_min_warning:float
pressure_max_warning:float
bench_temp_min_alarm:float
bench_temp_max_alarm:float
lamp_temp_min_alarm:float
lamp_temp_max_alarm:float
flow_a_min_alarm:float
flow_a_max_alarm:float
flow_b_min_alarm:float
flow_b_max_alarm:float
noise_a_min_alarm:float
noise_a_max_alarm:float
noise_b_min_alarm:float
noise_b_max_alarm:float
intensity_a_min_alarm:float
intensity_a_max_alarm:float
intensity_b_min_alarm:float
intensity_b_max_alarm:float
lamp_voltage_bench_min_alarm:float
lamp_voltage_bench_max_alarm:float
lamp_voltage_ozonizer_min_alarm:float
lamp_voltage_ozonizer_max_alarm:float
o3_coefficient_min_warning:float
o3_coefficient_max_warning:float
o3_background_min_warning:float
o3_background_max_warning:float
o3_lamp_temperature_min_alarm:float
o3_lamp_temperature_max_alarm:float
lead_alarm:float
lag_alarm:float
flag_method = bit
bit_1_description = Value is equal to missing_value (least significant bit)
bit_1_assessment = Bad
bit_2_description = Value is less than the valid_min.
bit_2_assessment = Bad
bit_3_description = Value is greater than the valid_max.
bit_3_assessment = Bad
bit_4_description = pressure < pressure_min_warning OR pressure > pressure_max_warning
bit_4_assessment = Indeterminate
10SR Springston et al., October 2020, DOE/SC-ARM-TR-179
bit_5_description = bench_temperature < bench_temp_min_alarm OR bench_temperature >
bench_temp_max_alarm
bit_5_assessment = Bad
bit_6_description = lamp_temperature < lamp_temp_min_alarm OR lamp_temperature >
lamp_temp_max_alarm
bit_6_assessment = Bad
bit_7_description = flow_a < flow_a_min_alarm OR flow_a > flow_a_max_alarm
bit_7_assessment = Bad
bit_8_description = flow_b < flow_b_min_alarm OR flow_b > flow_b_max_alarm
bit_8_assessment = Bad
bit_9_description = noise_a < noise_a_min_alarm OR noise_a > noise_a_max_alarm
bit_9_assessment = Bad
bit_10_description = noise_b < noise_b_min_alarm OR noise_b > noise_b_max_alarm
bit_10_assessment = Bad
bit_11_description = intensity_a < intensity_a_min_alarm OR intensity_a > intensity_a_max_alarm
bit_11_assessment = Bad
bit_12_description = intensity_b < intensity_b_min_alarm OR intensity_b > intensity_b_max_alarm
bit_12_assessment = Bad
bit_13_description = lamp_voltage_bench < lamp_voltage_bench_min_alarm OR
lamp_voltage_bench > lamp_voltage_bench_max_alarm
bit_13_assessment = Bad
bit_14_description = lamp_voltage_ozonizer < lamp_voltage_ozonizer_min_alarm OR
lamp_voltage_ozonizer > lamp_voltage_ozonizer_max_alarm
bit_14_assessment = Bad
bit_15_description = o3_coefficient < o3_coefficient_min_warning OR o3_coefficient >
o3_coefficient_max_warning
bit_15_assessment = Indeterminate
bit_16_description = o3_background < o3_background_min_warning OR o3_background >
o3_background_max_warning
bit_16_assessment = Indeterminate
bit_17_description = o3_lamp_temperature < o3_lamp_temperature_min_alarm OR
o3_lamp_temperature > o3_lamp_temperature_max_alarm
bit_17_assessment = Bad
bit_18_description = pressure_compensation_state = 0 OR temperature_compensation_state = 0 OR
o3_lamp_state = 0 OR gas_state not = 1
bit_18_assessment = Bad
bit_19_description = non-equilibrium conditions, (time - time_of_last_state_change) > lead_alarm
AND (time - time_of_last_state_change) < lag_alarm
bit_19_assessment = Bad
bit_20_description = Scheduled calibration
bit_20_assessment = Bad
operational_qc_bits:int = 19, 20
operational_qc_explanation = These tests will frequently be flagged during normal operation and
should be ignored by DQO metrics
6.1.4 Filename Conventions and File Structure
The first data retrieved from the instrument have been processed from the ‘raw’ datastream (level 00). In
general, the raw data from site are processed in 1-month chunks (for the AAF, the files are by each flight).
For each month (or other period), three files are produced from the raw data.
11SR Springston et al., October 2020, DOE/SC-ARM-TR-179
The raw data are processed to get a1 files and a1 files are further processed to get the b0 and b1 level of
the data files. The a1 and b0 levels of the data are updated and processed daily, but since b1 data use the
estimated baseline from moving averages, the b1 file availability will be delayed in time. The naming
conventions of raw (00) and processed (a1 and b1) are listed below:
[site][platform][subsite].[species].[resolution].[level].[date].[time].[processing level].[delimiter]{.log.txt |
.plots.pdf}
[site][platform][species][ subsite].[level xx].[date].[processing info].[nc}
Where:
[site] The site of the measurement (usually the 3-letter specifier of the nearest airport)
[platform] The structure used for the instrument (aos)
[subsite] The subsite of the sampling site (M1 : main site | S1 : supplemental site | E13 :
extended site)
[species] Species measured – for this instrument this is ‘o3’
[resolution] [xxs] (xx: two significant figures, s: time units string – s = seconds, m = minutes,
h = hours, d = day, w = week, M = month) Typically this is always s or m
[level] Level of this data. Always use the highest-level number with this name
[date] Date of first point in file (yyyymmdd)
[time] Time of first point in file (hhmmss)
[processing level] This is either ‘raw’ for ‘raw’ data or ‘m02’ for mentor-QA/QCd data with only
ambient measurements (zeros and calibrations removed), vetted and all
appropriate calibration factors used in processing.
[processing info] 000000, 000001, 000002 etc.
[delimiter] Typically this is ‘tsv’ for tab-separated values, but could be ‘csv’ for comma
separated values.
{.log.txt | .plots.pdf} Optional extension. In addition to the data file, the mentor prepares a .log.txt file
containing explanations of processing unique for this time period and a plots.pdf
file with time series plots of processed data.
[level xx] “a1” or “b0, or “b1”. Quality assurance increase from a1 to b1. The b1 data are
calibrated and quality assured at highest-quality level.
The 00 ozone data from all AMF/AMF instruments follow the file structure used for most U.S.
Department of Energy/Brookhaven National Laboratory/AOS instruments:
12SR Springston et al., October 2020, DOE/SC-ARM-TR-179
File Structure:
Row 1: Filename
Row 4 (col 1 only): ARM Climate Research Facility
Row 5: Site Platform
Row 7: Last revised date
Row 9: Instrument
Row 13: Instrument Mentor/Affiliation
Rows 14-19: Comments (operational conditions, calibrations, etc.)
Rows 21-24: Constants (usually defined in Comments)
Row 35: Column title
Row 36: Column units line 1
Row 37: Column units line 2
Row 40: First row of data
Beginning in 2014, raw data have all the metadata described above. Data are given in an arbitrary number
of columns. The first column is date/time.
Time - Time is reported in UTC as set by an NTP server. Following convention, the time is the beginning
of the period. The parameter reported at this time is the average of all points >= the time and < the next
time. Data are reported at 1- s resolution. All non-operational periods have been removed (empty field or
NAN). As per convention, data are reported as tab-delimited ASCII files. Files are formatted such that
they are self-documenting.
Data Columns (for mentor-QA/QC data):
Column 1: Date Time – All times are in UTC as yyyy-mm-dd hh:mm:ss{.ss} and are the beginning
of the time period. All data reported here correspond to data from samples taken >= this
time and < than this time + the data increment.
Column 2: [Ozone] – Mixing volume of O3 in ambient air (no water vapor correction). This is this
instrument’s primary measurement.
The a0 data are ingested to get the a1 data; a1 data are processed to add the QCs and calibration in the
b1-level data. The QCs for data b1 are defined in section previous section (6.1.3).
6.2 Data Ordering
Ozone data collected are distributed through the ARM Data Center and are presently updated daily or
weekly intervals (a1 and b1) and monthly (a0). All the ARM data can be downloaded at the ARM website
https://www.arm.gov/data. At this website, the ARM Discovery box ‘Get ARM Data’ can be used to
select and filter the desired data sets in ASCII-CSV and NetCDF formats.
13SR Springston et al., October 2020, DOE/SC-ARM-TR-179
6.3 Data Plots
6.3.1 Level ‘a0’ Data Plots
The mentor-edited monthly data plots of O3 raw data (Figure 3, 4), housekeeping (Figure 5, 6), and final
data sets (Figure 7), typical plots, and explanations are shown in the section below. More plots and
quicklooks routinely O3 produced by ARM can be downloaded from the Data Quality Office (DQO) at
the web link https://dq.arm.gov/dq-plotbrowser/).
Figure 3. Raw ozone data for one month.
The raw data plot shows all signal data recorded from the instrument. Processing software is used to parse
the data into sampling and zero/calibration periods. Every midnight and noon, the instrument goes into an
automatic zero and span check. A blow-up of one of these periods is shown in Figure 4.
14SR Springston et al., October 2020, DOE/SC-ARM-TR-179
Figure 4. Typical zero, span check.
Sample periods are automatically delineated with time allowed for measurements to re-stabilize. The
centroids (numerical averages) of zeros and span checks are shown by the red circles in Figure 4.
15SR Springston et al., October 2020, DOE/SC-ARM-TR-179
Figure 5. Housekeeping data for one month.
The sample cell pressure and temperature are shown in the top panel. These values are used internally by
the instrument to report ozone concentrations at STP (1 atm, 0oC). The twice-daily negative spikes in
pressure are momentary and due to flow interruptions proximate to the zero/span checks. The flows in the
two cells are shown in the middle panel. While this technique is fundamentally a concentration-sensitive
detector (independent of flow rate), the flows do affect the concentration of ozone generated for the span
checks. The raw lamp intensities for the two channels are shown in the bottom panel. When these reduce
to below 60,000 Hz, the lamp intensity is raised by the mentor to 110-120,000 Hz. Generally, the
intensity does not affect the instrument response.
16SR Springston et al., October 2020, DOE/SC-ARM-TR-179
Figure 6. Zero and span check stability over one month.
A one-month record of zero and span checks is shown in Figure 6. The dotted lines are the responses for
the five span checks measured at the NYS DEC standards laboratory after receipt of the instrument. The
difference between the measured span and the calibrated span value is usually less than 5%. This
difference is judged to be instability and drift in the photolysis lamp and NOT in the measurement cell.
Drift in the span response is monitored over long periods (> 1 year) and drifts of more than 5% indicate
need for recalibration at the NYS DEC laboratory.
A monthlong data set is shown in Figure 7: here the ambient ozone concentrations are adjusted for any
baseline drift. Here the peaks in O3 are as a result of diurnal variations (local photochemistry) and/or
transport from adjacent areas.
17SR Springston et al., October 2020, DOE/SC-ARM-TR-179
Figure 7. Processed data for one month.
Figure 7 shows a typical month’s ambient data record. A diurnal pattern is (usually) present since ambient
ozone is predominantly produced by photochemistry. Night-time removal of ozone occurs by dry
deposition, dilution, and reaction with other trace gases.
6.3.2 Level ‘a1’ Data Plots
Ozone and some other selected fields from a1-level data are plotted from ARM ENA site for 2013-10-12.
The wide range of the O3 calibration has compressed the fine O3 variability on y-axis in the top left panel
of Figure 8.
18SR Springston et al., October 2020, DOE/SC-ARM-TR-179
Figure 8. Ozone concentration (top left), cell pressure (top right) and sample flow in cell-A and B
(lower panels) for October 12 2013 at ENA site. The O3 dips in top left panel are the zero
calibrations made at 00 and 12 UTC. The O3 spans often > 60 ppb, are out of scale and not
shown on the top left panel.
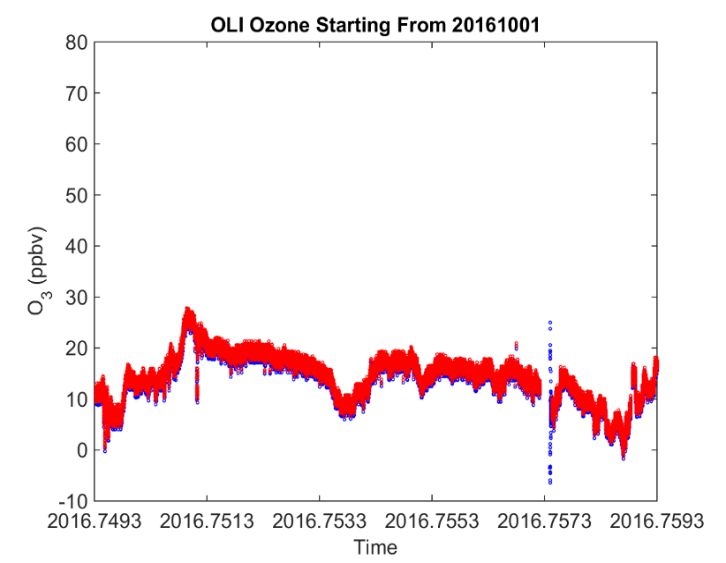
6.3.3 Level “b1” Data Plots
Calibrated ozone concentrations from ‘b1’-level data are plotted from the ARM SGP, Oliktok Point
(OLI), and ENA sites for multiple months, as shown in Figure 9. The blue symbols are calibrated O3 from
ARM automatic production and the red symbols are mentor-edited (labor-intensive) data. The ARM
algorithm-generated data are within 1% of the mentor-edited data. Overall, the comparison looks
reasonable except a small difference at OLI (the ARM production systematically overestimates around
1 ppbv of O3). This is likely due to the difference in offsets (zeros). Taking mentor-edited data as the gold
standard, the small difference in automated processed data from ARM O3 may be due to the O3_zero fit
calculation from the moving average in ARM production. There are some challenges running the
instruments 24/7 at the OLI site, so routine switching on/off may cause some shift in O3 zero.
19SR Springston et al., October 2020, DOE/SC-ARM-TR-179
Figure 9. Ozone concentration at SGP (top left), ENA (bottom left), and OLI (right panels) for multiple
months or years. The blue symbols are calibrated O3 from ARM routine production and the
red symbols are mentor-edited (manual) data.
6.4 Data Quality Checks
The level of b0 and b1 O3 data quality is automatic flagging of data when the instrument changes states
during zero and span checks. Normally this eliminates the first 105 seconds after the zero is actuated and
then the first 30 seconds after each span level. The zero sampling time period can vary with flow; we use
the zero and spans when the O3 signal is stable with time, for example, an average of ~30 seconds once a
stable level has been achieved for each span/state.
The second level of data quality is inspection of the 2X daily zeros and span checks. Data are assessed for
possible short-term (few weeks) and long-term (years) drifts with a defined relative standard deviation
and minimal drift (SR Springston et al., October 2020, DOE/SC-ARM-TR-179
Instrument flow rates do not directly affect the instrument response but do affect the span check values.
Under normal operation two factors can change the instrument flow rate: dirt accumulation on the inlet
filter or degradation of the internal diaphragm pump. Given the two-week filter change schedule, dirt
accumulation is not observed to reduce flow. Drastic changes in flow, pressure, temperature, and other
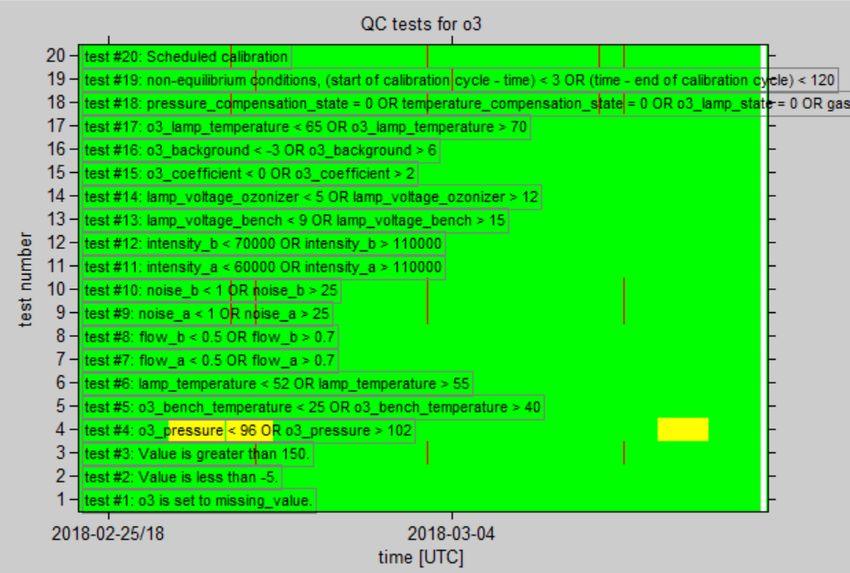
instrumental conditions are stored with different quality fields, as shown in Figure 10. Pump life under
continuous operation is 2-3 years.
Figure 10. An example of ozone concentration at ENA (top), and the QCs bit test (bottom panel). Green
color means everything is good, yellow is a warning sign, and red means abnormal
operations.
21SR Springston et al., October 2020, DOE/SC-ARM-TR-179
The third level of data quality and assessment deals with visual inspection of the output datastream.
Periods when the instrument is not operating properly are identified and flagged. Either an instrument
failure or an inlet failure causes such periods. In some cases, operators note problems with the instrument,
but more often it is up to the mentor to recognize nonsensical values and determine the cause(s). The
complete recording of all instrument and inlet housekeeping aids in this diagnosis. Except for pump/inlet
failures and several instances where the inlet filter was replaced with an impermeable spacer (documented
below), mentors have not experienced any pattern of failures that could be algorithmically identified.
Failures, their identification and remedy, and the mentor write-up in the DQPR/DQR system tend to be
unique individual events.
One phenomenon requiring visual inspection involves short aberrations in the output signal. These are
primarily of 4-s duration (one measurement cycle) and can be positive or negative. Because of the mixing
ratio in the inlet, sample lines, and instrument dead volume, a step function in actual atmospheric
concentrations on this time scale is nonsensical. However, a 20-40 ppbv spike dramatically affects daily
max/min readings. So, these excursions are flagged. Note that these instrumental spikes are visually quite
distinguishable from negative peaks of 30-s to 10-min duration from local internal combustion sources
that produce nitric oxide (NO) which then titrates (reduces) the local ambient ozone. Note that negative
peaks from titration represent real changes in the ambient ozone concentration and are not flagged.
Distinguishing ambient (negative) ozone spikes from spurious instrumental spikes requires a certain
amount of experience and judgment. Local sources can in some instances be identified by referring to the
wind direction measured at the point of sampling. but identification of local interference is quite
subjective.
6.5 Calibration Database
The Thermo Scientific ozone monitors are calibrated for response upon receipt from the manufacturer.
This is done by the mentor at the NYS DEC testing laboratory at Albany. These results are tabulated by
the mentor and put into ARM’s Operations Status System (OSS). The DEC reference standard is used
only for calibration of ozone instruments and is certified by the U.S. Environmental Protection Agency
(EPA) with a National Institute of Standards and Technology (NIST)-traceable reference. All the
calibration data (zero, spans, and NYS DEC testing data sets) are used to make the b1 level of the O3
datastream.
7.0 Technical Specification
7.1 Units
The measured quantity of interest is the mixing volume of analyte. This is reported in units of parts per
billion (ppbv) or million (ppmv) by the instrument. There is no correction for ambient water vapor. The
‘v’ stands for volume in the O3 units.
7.2 Range
The upper range of this model is somewhat arbitrary. It extends well past conceivable ambient levels.
Linearity up to 2000 ppbv is demonstrated with the automatic span checks done twice daily. The zero
22SR Springston et al., October 2020, DOE/SC-ARM-TR-179
baseline is assessed in two ways. First, the instrument cycles alternately between reference and sample
cells with switching solenoid valves. The only difference is removal of ambient ozone by a proprietary
catalyst (presumably a Hopcalite-type substance that is a mixture of copper and manganese oxides).
Second, the zero level is further checked twice daily with a charcoal removal catalyst. All zero and span
checks are done through the ambient inlet filter, so should buildup on the filter cause ozone destruction, it
would be obvious in the span checks.
7.3 Accuracy
Calibrations are done twice a day with an internal zero and 5-level span checks. These reveal short-term
(daily) and long-term (annual) drifts. However, the stability of the span check source itself is known to be
inferior to the stability of the absorbance photometer. After instruments are received from the
manufacturer, the internal calibration is checked against the NYS DEC standard. At the same time, the
internal span source is also checked. All the calibration (O3 zero and spans) data are assessed for short
and long trends and necessary corrections are applied to data of the best quality. The initial (on receipt)
calibration is within 1-2% accuracy. However, field conditions vary substantially. Variation from the
original measurement standard would appear to be ~5%.
7.4 Repeatability
Precision (repeatability) is given here as the noise of the 1-s signal (which is actually a 4-s measurement).
Under quiet ambient conditions, this has been measured as:
[O3] σ = 2 ppbv
Therefore, for normally distributed noise, ±2σ encompasses 95% of the points. The precision of the
instrument under average ambient conditions is then given as:
[O3] 95% Confidence Interval = ± 4 ppbv
Note that these Confidence Intervals represent repeatability over a relatively short period. Day-to-day and
month-to-month repeatability has a larger confidence interval and approaches the accuracy uncertainties
given in the previous section. The manufacturer reports zero noise as 0.25 ppb RMS (for a 60-s average),
which is slightly better (smaller) than the values observed under field conditions and reported above.
7.5 Sensitivity
Sensitivity as a lower detectable limit is reported as 95% confidence interval above baseline, which in this
case would be 4 ppbv for data as reported to ARM (1 value per second, but each value represents 4
repetitive reports of a 4-s integration time). Assuming the noise decreases inversely with the square of the
integration time, the measurement sensitivity under field conditions is similar to the 1.0 ppb ‘Lower
detectable limit’ reported by the manufacturer.
23SR Springston et al., October 2020, DOE/SC-ARM-TR-179
7.6 Uncertainty
Uncertainty is an integral of all errors. It is a combined measurement of accuracy and precision
(repeatability) discussed above.
7.7 Output Values
Described in section 6.0.
8.0 Instrument System Functional Diagram
Based on experience, the ozone monitor is modified upon receipt. These changes are shown here in
Figures 11-12.
Figure 11. Diagram of flow schematic (from Thermo Scientific Manual).
24SR Springston et al., October 2020, DOE/SC-ARM-TR-179
Original Configuration Remove Mods done to all ACRF
instruments.
Z.A. In Preg NC NO
O3 Gen Manifold Valve
(Pressurized)
C
Vent
Ozone
Out
In Move Analyzer
Sample
Inlet
Filter (1) Block Off
Preg
Modified Configuration
(2) Add
(4) Open Changes
Z.A. In Charcoal 10 µm O3 Gen Manifold NC
Valve
NO 1. Block off regulator
Zero filter 2. Add charcoal cannister
& 10 µm filter
(5) Capped C 3. Move Teflon inlet filter
Vent
4. No Zero Air required
Ozone 5. Cap manifold ports
Out (3) Moved
Inlet
Filter
In Analyzer
Sample
Atmospheric Sciences Division
Environmental Sciences Department
Back TEI Model 49i
Panel Flow Modifications
SR Springston Drawn: 10-02-10 No. 1 of 1 Rev: 2
Note: It is crucial that all PFA tubing be tightlysecured. Over time, any
rubbing will cause abrasive failure of the tubing. Material: File: Flow Modification 130422.wpg
Figure 12. Modifications to the TEI Model 49i by the mentor.
In Figure 12, the red boxes indicate components that are removed and green boxes indicate components
added. The original (as received) configuration is shown in the top and the current configuration is shown
in the bottom panel. The changes in Figure 12 are summarized as:
1. The 5-µm Teflon filter (47-mm diam) is moved so that ambient sample AND zeros/spans go through
the same flow stream (as recommended by the manufacturer).
2. Instead of supplying zero air to the ozone span generator, the instrument pump draws ambient air
through a zeroing charcoal canister and metal filter. This means that the pressure in the ozone
generator varies with atmospheric pressure and the output concentration can vary (since it is a
function of both pressure and residence time, the variation is with the inverse square of the ambient
pressure). However, the supplied pressure regulator only supplies consistent gauge pressure, not
absolute pressure and the affect is similar.
Figure 13 shows the trace-gas sampling/inlet used in the AOS systems. It consist of a high-flow ½” OD
PFA tubing sampling from under the aerosol inlet rain hat at ~10-m AGL. Air is pulled into the container
at 30 LPM as controlled by a rotometer. The residence time to the back of the instrument is ~1-2 s.
25SR Springston et al., October 2020, DOE/SC-ARM-TR-179
~7 m x 8" o.d. Al outer tube
(length not to scale)
~1.8 m x 2" i.d. ss inner sampling tube
with optional heating for RH control
(length not to scale)
Roof Line
P Bypass
PID, ~850 L/min Bypass
Blower
Rotameter #6 (?)
29 LPM
1-µm
filter
MFC #1
GHG Std. Add. O3
? SLPM 0-20 sccm 1.4 SLPM Bug and
condensate
trap with drain
MFC #1
Std. Add.
0-20 sccm
Trace Gas Cal
Mixed std.
CO ~450 ppbv
N 2O ~350 ppbv
From LBL (Biraud)
Calibration system used
in ENA, AMF3, AAF
5-µm PFA
filter
LGR CO Manifold
0.2 SLPM Blower
Exhaust
Filter
Atmospheric Sciences Division
Environmental Sciences Department
Inlet Schematic for ENA Inlet Port 6 (Detail)
SR Springston Drawn: 15-08-03 No. 1 of 1 Rev: 1
Revised: 15-10-16
Material: File: ENA Inlet_6 151016.wpg
Figure 13. Ground inlet schematic.
26SR Springston et al., October 2020, DOE/SC-ARM-TR-179
9.0 Instrument/Measurement Theory
The following description is taken from the Thermo Scientific Manual:
“The sample is drawn into the Model 49i through the sample bulkhead and is split into two gas streams,
as shown in Figure 13. One gas stream flows through an ozone scrubber to become the reference gas (Io).
The reference gas then flows to the reference solenoid valve. The sample gas (I) flows directly to the
sample solenoid valve. The solenoid valves alternate the reference and sample gas streams between cells
A and B every 10 seconds. When cell A contains reference gas, cell B contains sample gas and vice versa.
The UV light intensities of each cell are measured by detectors A and B. When the solenoid valves switch
the reference and sample gas streams to opposite cells, the light intensities are ignored for several seconds
to allow the cells to be flushed. The Model 49i calculates the ozone concentration for each cell and
outputs the average concentration to the front panel display, the analog outputs, and also makes the data
available over the serial or ethernet connection.”
10.0 Setup and Operation of Instrument
The instrument is permanently installed in the AOS systems. This includes:
1. Physical mounting of the instrument in a shock-isolated 19” instrument rack.
2. Plumbing of the sample line into the fast flow ½” PFA trace gas manifold line with the associated
47-mm PFA filter and filter holder.
3. Connection of the RJ-45 ethernet output to the AOS Instrument Network switch.
4. Connection of the 110 VAC power line to the appropriate Power Distribution Unit outlet.
Initialization involves only making sure the ½” PFA trace gas manifold line runs up the aerosol stack to
under the 14” rain hat and turning on the power.
After power is turned on, the instrument goes through self-checks and commences putting out data. Note
that after extended shut down, this warm-up period can be 10 minutes or more.
11.0 Software
A graphical user interface (GUI) has been written for the instrument computer (‘brick’) acquiring data
from the ozone monitor. This GUI is similar to other AOS instrument GUIs. The zero and span checks are
controlled on a predetermined schedule by the instrument computer.
27SR Springston et al., October 2020, DOE/SC-ARM-TR-179
12.0 Calibration
Calibration procedures are described in earlier sections. These include two daily zero and span checks.
The instruments are checked and cross-calibrated at the Brookhaven National Laboratory standards
facility after they are returned from ARM sites.
13.0 Maintenance
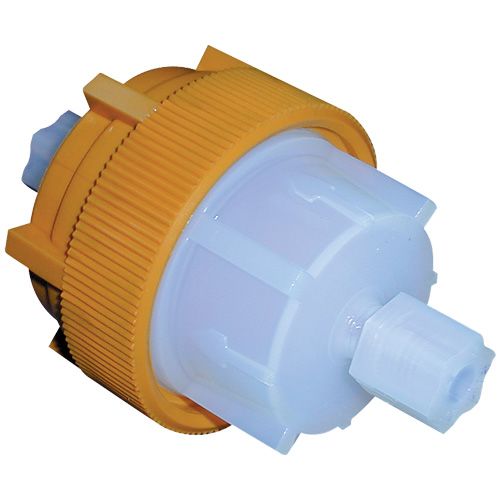
Maintenance is minimal for this instrument. The mentor advises changing the inlet particle filter every
two weeks. The filter is a 47-mm-diam. 5-µm PFA membrane filter Type LS (Millipore Catalog #
LSWPO4700). Note that the filter is not directional (either side up). The filter is white and is packed in a
stack separated by blue plastic spacers. DO NOT USE THE SPACER! USE THE WHITE FILTER. (This
error has been made multiple times.)
Figure 14. 47-mm PFA filter holder.
Figure 15. 47-mm filter holder wrenches.
28You can also read