Mapping Rural Road Networks from Global Positioning System (GPS) Trajectories of Motorcycle Taxis in Sigomre Area, Siaya County, Kenya - MDPI
←
→
Page content transcription
If your browser does not render page correctly, please read the page content below
International Journal of
           Geo-Information

Article
Mapping Rural Road Networks from Global
Positioning System (GPS) Trajectories of Motorcycle
Taxis in Sigomre Area, Siaya County, Kenya
Francis Oloo      ID

 Department of Geoinformatics, University of Salzburg, Schillerstrasse, 30-5020 Salzburg, Austria;
 francisomondi.oloo@sbg.ac.at; Tel.: +43-662-8044-7569

 Received: 25 June 2018; Accepted: 30 July 2018; Published: 1 August 2018

 Abstract: Effective transport infrastructure is an essential component of economic integration,
 accessibility to vital social services and a means of mitigation in times of emergency. Rural areas
 in Africa are largely characterized by poor transport infrastructure. This poor state of rural road
 networks contributes to the vulnerability of communities in developing countries by hampering
 access to vital social services and opportunities. In addition, maps of road networks are incomplete,
 and not up-to-date. Lack of accurate maps of village-level road networks hinders determination of
 access to social services and timely response to emergencies in remote locations. In some countries in
 sub-Saharan Africa, communities in rural areas and some in urban areas have devised an alternative
 mode of public transport system that is reliant on motorcycle taxis. This new mode of transport
 has improved local mobility and has created a vibrant economy that depends on the motorcycle
 taxi business. The taxi system also offers an opportunity for understanding local-level mobility
 and the characterization of the underlying transport infrastructure. By capturing the spatial and
 temporal characteristics of the taxis, we could design detailed maps of rural infrastructure and
 reveal the human mobility patterns that are associated with the motorcycle taxi system. In this
 study, we tracked motorcycle taxis in a rural area in Kenya by tagging volunteer riders with
 Global Positioning System (GPS) data loggers. A semi-automatic method was applied on the
 resulting trajectories to map rural-level road networks. The results showed that GPS trajectories from
 motorcycle taxis could potentially improve the maps of rural roads and augment other mapping
 initiatives like OpenStreetMap.

 Keywords: accessibility; crowdsourcing; GPS data loggers; rural mobility; VGI

1. Introduction
     Transport accessibility in rural areas is a critical determinant of human mobility, accessibility
to vital services [1,2], regional connectivity, economic growth [3], and timely mitigation during
emergencies [4]. Lack of adequate transport accessibility can worsen the vulnerability of disadvantaged
members of community including children, the elderly, the sick and people living with disabilities.
In most rural areas in sub-Saharan Africa, transport services are still largely inadequate and
unregulated, which has contributed to negative health outcomes, including injuries and diseases
that are attributable to transport-related air and noise pollution [5]. Moreover, even in cases
where roads exist, the focus of their design and construction is usually on improving physical
connectivity between major centers without much thought on accessibility to these roads [6] from rural
homesteads and villages. Furthermore, rural travel is sometimes considered “invisible” [7] because
of inadequate up-to-date maps of rural transport infrastructure. This invisibility can hamper local

ISPRS Int. J. Geo-Inf. 2018, 7, 309; doi:10.3390/ijgi7080309                         www.mdpi.com/journal/ijgi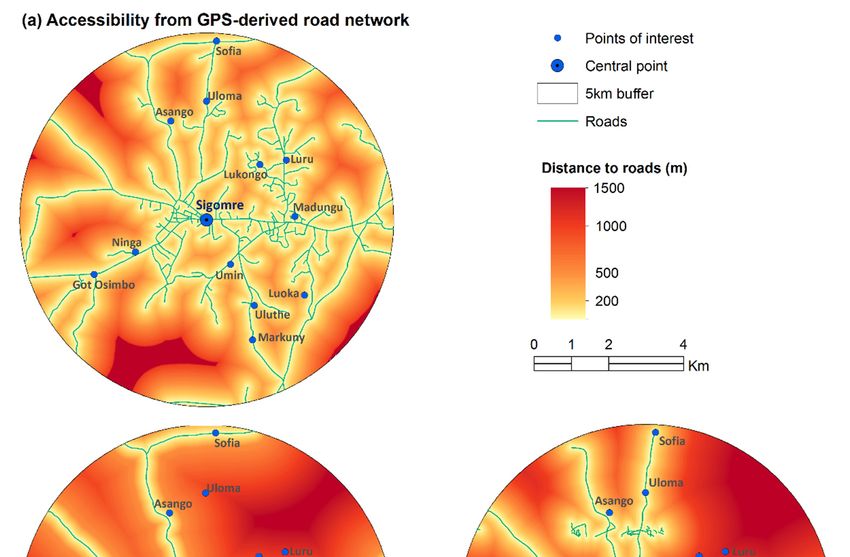
ISPRS Int. J. Geo-Inf. 2018, 7, 309                                                                  2 of 15

navigation by visitors and lead to erroneous estimation and representation accessibility to services and
mobility patterns.
      A major impediment to the design of accurate and up-to-date maps of rural transport
infrastructure and mobility has been the potential high cost of implementing large-scale field data
collection [8] for the mapping exercise. Additionally, most official mapping agencies in Africa face
legal and technical barriers [9] on how to integrate data from Volunteer Geographic Information (VGI)
into official geodatabases of transport infrastructure. Consequently, data to map rural road networks
have traditionally been digitized and updated from aerial photogrammetry (which lately include data
from Unmanned Aerial Vehicles (UAV)) [10] and from satellite image analysis [11]. Because of the
relatively high cost of using the traditional methods, their implementation has mainly been restricted
to urban areas or to major road networks that link major centers in a country. In order to circumvent
the high costs that are associated with traditional methods of mapping, Van der Molen [12] suggested
that practitioners should master and take advantage of the emerging geospatial tools and techniques
as an alternative to mapping in a rapidly changing environment.
      In recent decades, the emergence of methods for participatory geographic information systems
(PGIS) [13] and volunteered geographic information (VGI) [14], together with the advances in
telecommunication, sensor and Global Navigation Satellite Systems (GNSS) technology have boosted
global mapping efforts. This is more so because it is now possible to involve a large cross-section
of citizens in capturing spatial data, validating geographic information, and in labelling features on
maps. Some of the common web-mapping initiatives that rely on volunteered geographic information
include Google maps, OpenStreetMap (OSM), Geocommons, and Wikimapia.
      While citizen-focused web mapping initiatives have been largely successful in the developed
world and in big urban centers, poor mobile communication signals compounded with costly and
unreliable internet in the developing countries continues to hamper the adoption of the approaches
in deprived rural areas. Geographic coverage of web-based, crowdsourced data remains a challenge
for global and continental observations, particularly in sparsely populated [15] or underserved areas.
In these underserved areas, only a relatively small number of volunteers and moderators may have
access internet through which to contribute to mapping and verification spatial information in their
remote neighborhoods. Consequently, coverage of crowdsourced spatial information of infrastructure
in rural areas is still too small [16], with large proportions of rural infrastructure, including transport
networks remaining unmapped.
      To improve the geographic coverage of spatial data and maps of rural infrastructure, it is
advisable to develop mechanisms that can motivate [17] residents of the rural areas to continually be
involved and to participate in the mapping exercise. Additionally, it is advisable for practitioners to
adopt appropriate enabling tools and technologies [18] that may not be significantly constrained by
socio-economic circumstances of the rural locations of interest. For instance, tools that are not entirely
reliant on access to internet, electricity and mobile communication may be the most appropriate for
resource-deprived rural areas in Africa. Furthermore, tools and methods that can capture not only the
location but also the mobility patterns of rural residents in space and time can provide invaluable data
for mapping rural infrastructure and for understanding and representing human mobility patterns
and the accessibility to social amenities at the local level.
      With the advances in sensor and Global Positioning System (GPS) tracking technology, it is now
possible to record accurate locational information about entities in their environment. The entities
may include humans, animals, vehicles, motorcycles, ships, etc. Sensors and GPS trackers have
been applied to address questions in a number of fields including environmental pollution [19],
human health [20], vehicle navigation [21], and sustainable energy management [22], among others.
Furthermore, a combination of methods from VGI and sensor/GPS tracking technology have been
applied to study human mobility patterns in geographic space [23], to implement a geocitizen approach
to urban planning [24], animal monitoring [25,26], and disaster management [27]. GPS-derived VGI
does not only provide positional information about the entity of interest, but also leaves spatial and
ISPRS Int. J. Geo-Inf. 2018, 7, 309                                                                   3 of 15

temporal traces that could be used to map infrastructure and activities in the environment. For instance,
big data, comprising of traces of mobile users have been used to map footprints of urban activities [28].
Similarly, GPS trajectories have been used for routing [29] and for lane detection in highways [30].
Gaps remain on how community generated data emerging from GPS trajectories of movements in rural
areas can be harnessed and used to improve maps of rural infrastructure. In particular, there is limited
evidence in literature on how to map routes and tracks in rural areas where residents largely depend
on unconventional means of public transport, like motorcycles, bicycles, or even animal drawn carts.
      Poor transport infrastructure in rural areas render most roads impassable during rainy seasons.
Consequently, it is costly to maintain and manage public service vehicles in the rural areas. As a result,
there are only a few vehicles, (mainly vans and mini buses) that link passengers from rural areas to
commercial and administrative centers. As an alternative, local populations in most rural areas in
sub-Saharan Africa have adopted motorcycle taxis as a means of public transport. This is particularly
because the motorcycles are affordable, cheap to maintain and capable of accessing areas that would
otherwise not be accessible using conventional vehicles or on feet. In some cases, motorcycle taxis,
commonly referred to as “bodaboda” in Kenya and Uganda, have become the dominant mode of
transport in rural areas. Within cities, similar motorcycle taxis provide public transport in informal
settlements and for delivery services within urban areas. Unfortunately, there has been limited research
on the influence of motorcycle taxi transport service on road/track design to support safe motorcycle
use [31].
      Inadequacies in the understanding of the infrastructure that the motorcycle taxis use in rural areas
has made it difficult to regulate the sector. Unfortunately, this has led to an increase in motorcycle
accidents [32] and a surge in insecurity [33] when criminals use the same mode of transport to access
remote areas and to escape from crime scenes. In this study, we posit that recording the spatial and
temporal characteristics of these motorcycle taxis can provide rich data with which to analyze and
represent rural transport networks, mobility, and accessibility to vital services. Moreover, it can be
assumed that in view of this new reality, previous research on accessibility that have largely relied
on official or publicly available data on transport infrastructure may be missing crucial information
on motorcycle taxi-based mobility patterns. Consequently, analysis that is based on incomplete and
out-of-date official or publicly available data of road networks may not provide a true reflection of
rural accessibility patterns.
      To demonstrate the potential use of GPS data from the motorcycle taxi transport system in
mapping rural transport infrastructure, we set out an experiment to track motorcycle taxis in a rural
area in Kenya by tagging volunteer motorcycle taxi riders with GPS data loggers and to use the
resulting data to design maps of rural transport infrastructure. The specific aims in this study included:
(a) to identify suitable volunteer motorcycle taxi riders, and to tag and track the riders in the course of
their daily routines. (b) To translate the trajectories into road networks. (c) To evaluate the influence of
new road network in estimating accessibility in the study area.
      In the last decade, raw GPS data have routinely been applied to map routable road
networks [34,35]. In particular, clustering or aggregation methods have been used to build clusters of
same roads from GPS trajectories. For instance, Zhang et al. [36] applied a clustering method that used
variation in velocity to differentiate and classify GPS traces. Similarly, Schroedl et al. [37] used clusters
in dedicated distance in the GPS data to separate different lanes of a road section. Further, Liu et al. [38]
introduced an algorithm to map urban roads from course-grained vehicular GPS traces.
      For areas in which satellite imagery are unavailable, Chen & Cheng [39] used multi-track GPS
data to generate accurate road data and observed that multi-tracks could potentially reduce the errors
in the GPS data. Moreover, pedestrian route networks have also been designed from self-reported GPS
traces of walkers [40]. GPS data of this type have not only been used for mapping purposes, but also to
detect the behavior of different road users [41] and to infer travel modes [42]. Furthermore, GPS traces
from smartphones have been used to map informal public transport systems in Kampala, Uganda [43].
Similarly, GPS traces from smartphones of users of semi-formal buses “matatus” have been used to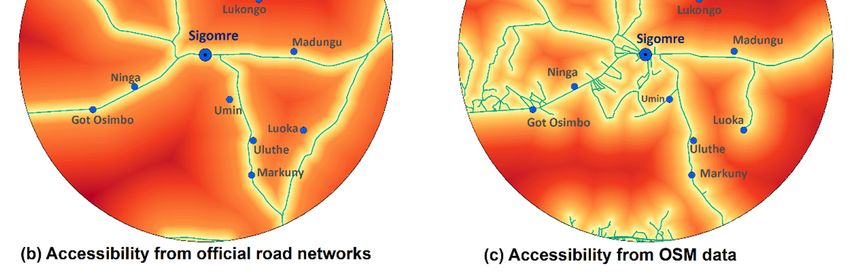
ISPRS Int. J. Geo-Inf. 2018, 7, 309                                                                         4 of 15
ISPRS Int. J. Geo-Inf. 2018, 7, x FOR PEER REVIEW                                                                      4 of 16

     In rural
     design      areas,
             route  mapsdata    from
                           for the  cityGPS   data loggers
                                         of Nairobi  [44] and have     been used
                                                                to recognize        to assess
                                                                              stoppages         mobilityregions
                                                                                         in developing     patterns  and to
                                                                                                                 where
calibrate
     there the
            are data  frombus
                no official  self-reports
                                 schedules [46].
                                              [45]. In a related study, GPS data loggers were used to assess the
mobility In
          pattern    of residents
              rural areas,  data from of aGPS
                                           rural  area
                                                data     in Zambia
                                                      loggers           and used
                                                                have been   to evaluate   the
                                                                                  to assess    impactpatterns
                                                                                             mobility   of the mobility
                                                                                                                and to on
     calibrate  the data  from   self-reports  [46]. In a  related  study, GPS  data loggers  were
the spread of malaria [47]. Additionally, GPS travel diaries have been used to investigate mobility used  to assess the
     mobility   pattern  of residents   of a rural  area  in Zambia    and to evaluate the  impact
characteristics of elderly people in rural areas [48]. From our analysis of literature, we did not  of the mobility  on find
     the spread
specific examples of malaria   [47]. Additionally,
                      of the application       of GPSGPS     travel
                                                        traces       diaries have been
                                                                 of motorcycles         used
                                                                                   to map      to investigate
                                                                                             rural            mobility
                                                                                                   road networks.
     characteristics of elderly people in rural areas [48]. From our analysis of literature, we did not find
     specific examples of the application of GPS traces of motorcycles to map rural road networks.
2. Materials and Methods
     2. Materials
     This study and
                  wasMethods
                      carried out in a rural setting covering an area of approximately 5 km radius
around Sigomre
            This studymarket    in Siaya
                          was carried   outCounty     Kenya.
                                             in a rural       The
                                                        setting     geographic
                                                                covering   an areacoordinates     of the 5central
                                                                                    of approximately                location
                                                                                                            km radius
of thearound
        studySigomre
                area were    34.3613°
                          market        E inCounty
                                  in Siaya    longitude  andThe
                                                     Kenya.   0.2016°    N in latitude.
                                                                  geographic             This
                                                                               coordinates   of area was chosen
                                                                                                the central locationbecause
                                                                                                                      of
      the  study  area were  34.3613  ◦ E in longitude and 0.2016◦ N in latitude. This area was chosen because it
it is at least 8 km from tarmacked roads relies mainly on motorcycle taxis as the main mode of
      is at least
transport.     All8of
                    kmthe
                        from  tarmacked
                           roads           roads to
                                   and tracks    relies
                                                     andmainly
                                                         from onthemotorcycle
                                                                     market are taxis as the
                                                                                   dirt      mainAdditionally,
                                                                                         roads.     mode of transport.
                                                                                                                   Sigomre
      All of  the roads  and tracks  to and  from  the market are  dirt roads. Additionally,  Sigomre
market serves as the main market and administrative center for Sigomre ward. The location therefore     market  serves
      as the main market and administrative center for Sigomre ward. The location therefore provided a
provided a good setting for simulating local mobility to various social services in the ward. Figure 1
      good setting for simulating local mobility to various social services in the ward. Figure 1 is a map of
is a map of the area of study depicting the central location and the main road networks as capture by
      the area of study depicting the central location and the main road networks as capture by the official
the official
      road dataroadanddata  and superimposed
                       superimposed                 on an OpenStreetMap
                                        on an OpenStreetMap      (OSM) in the(OSM)      in the background.
                                                                                background.

           Figure 1. Map of the study area representing official roads as captured in the data by national mapping
     Figure 1. Map of the study area representing official roads as captured in the data by national
         agency superimposed on OpenStreetMap (OSM).
     mapping agency superimposed on OpenStreetMap (OSM).

     2.1. Data Collection
2.1. Data Collection
        Three main data sources were used in this work including, official road networks from national
   Three main
   mapping        data
             agency  in sources wereand
                        Kenya, roads  used  in this
                                         tracks fromwork
                                                     OSM,including, official
                                                          and GPS tracks  androad  networks
                                                                              points that werefrom  national
                                                                                               collected
mapping  agency
   as part        in Kenya, roads
           of the motorcycle       and
                             tracking   tracks from OSM, and GPS tracks and points that were collected
                                      experiment.
as part of the motorcycle tracking experiment.
     At the time of the experiment, there were approximately 400 motorcycle taxi riders in and
around Sigomre market. Commonly, riders organize themselves into groups of about 100 riders who
make up a self-help group. In Sigomre market, there are four groups. Ten (10) volunteer riders were
selected from market center to participate in the experiment. The volunteer riders were tagged on
ISPRS Int. J. Geo-Inf. 2018, 7, 309 5 of 15
At the time of the experiment, there were approximately 400 motorcycle taxi riders in and around
Sigomre market. Commonly, riders organize themselves into groups of about 100 riders who make up
a self-help group. In Sigomre market, there are four groups. Ten (10) volunteer riders were selected
ISPRS Int. from
J. Geo-Inf.
market2018, 7, x FOR
center PEER REVIEW
to participate in the experiment. The volunteer riders were tagged on their wrists 5 of 16
and tracked on a daily basis from 6 a.m.–9 p.m. for a duration of two weeks. At the end of each
the weekweek, downloaded
data loggersand werearchived. Additionally,
retrieved from in each
the riders and day
the data of theby
recorded week, we interacted
each logger within thewith the
week downloaded and archived. Additionally, in each day of
group of volunteer riders to confirm that the data loggers were adequately charged the week, we interacted with the group
and in good
of volunteer riders to confirm that the data loggers were adequately charged and in good working
working condition. Figure 2 represents, (a) typical village tracks that were traversed by the motor
condition. Figure 2 represents, (a) typical village tracks that were traversed by the motor cycle taxis,
cycle taxis, (b) the particular logger that we used in this experiment together with the wrist strap and
(b) the particular logger that we used in this experiment together with the wrist strap and the charging
the charging
and dataand data download
download cable,
cable, and (c) and (c)
an example of an example
a volunteer of aa motorcycle
riding volunteertaxi
riding
whilearecording
motorcycle taxi
while recording
GPS locationsGPSthrough
locations a GPSthrough a GPS
data logger dataon
strapped logger strapped on his wrist.
his wrist.
Figure 2.Figure
Illustration of (a)
2. Illustration Typical
of (a) ruralmotorcycle
Typical rural motorcycle
trackstracks (b)GT-600
(b) i-gotU i-gotU GT-600
Global Global
Positioning Positioning
System
(GPS) travel and sports data logger (c) A motor cycle rider strapping a GPS data logger
System (GPS) travel and sports data logger (c) A motor cycle rider strapping a GPS data logger on the on the wrist
while riding a motorcycle taxi.
wrist while riding a motorcycle taxi.
In this experiment, i-gotU GT-600 GPS travel and sports data loggers from MobileAction, Taiwan
In this experiment, i-gotU GT-600 GPS travel and sports data loggers from MobileAction,
were deployed for the tracking exercise. The devices which could be strapped on the wrist could auto
Taiwan were
record deployed
GPS data infor themode
logger tracking
and hadexercise. The
a capacity of devices which
approximately couldwaypoints.
262,000 be strapped Each on
datathe wrist
could auto record
logger GPS data in logger
was preprogrammed mode
to record dataand had
at an a capacity
interval of approximately
of 30 s from 6:00 a.m. to 21:00262,000 waypoints.
p.m. local
Each data logger
time. The was preprogrammed
devices to recordtodata
were also preprogrammed at an
detect interval
motion, of 30
so that, if asrider
fromwas6:00immobile
a.m. to or
21:00 p.m.
stayed
local time. Theindevices
the samewere
position
alsoforpreprogrammed
more than 30 s, then to the devices
detect wouldso
motion, gothat,
to a hibernation
if a rider wasmodeimmobile
and be reactivated only by the next instance of motion. We downloaded the data through the @trip
or stayed in the same position for more than 30 s, then the devices would go to a hibernation mode
PC GPS receiver software that came with the GPS data loggers. At the end of the two weeks period,
and be reactivated only by
233,066 data points hadthe
beennext instance of motion. We downloaded the data through the @trip
captured.
PC GPS receiver software
The data that
from GPS came
data with
loggers thecompared
was GPS data loggers.
against At thegovernment
the official end of thedata twoonweeks
roads period,
233,066 data pointsthehad
to evaluate been captured.
proximity of the GPS data points to the official road data. In particular, 5381 points
Theofdata
collected
fromwere
GPSselected along awas
data loggers straight section of
compared the road
against of official
the approximately 1.5 km in
government length.
data on roads to
To estimate the shortest distance from the GPS points to the nearest road section, the Generate Near
evaluate the proximity of the GPS data points to the official road data. In particular, 5381 points of
Tool in ArcGIS 10.4.1 was used. We then evaluated the statistics for the variation in distance between
collectedthe
were selectedand
GPS locations along a straight
the sections of thesection
road thatofwere
thenearest
road of approximately
to each point. Figure 31.5 km in the
represents length. To
estimatepoints
the shortest
and line distance from
segment that we the
usedGPSin thepoints to the nearest road section, the Generate Near Tool
validation.
in ArcGIS 10.4.1 was used. We then evaluated the statistics for the variation in distance between the
GPS locations and the sections of the road that were nearest to each point. Figure 3 represents the
points and line segment that we used in the validation.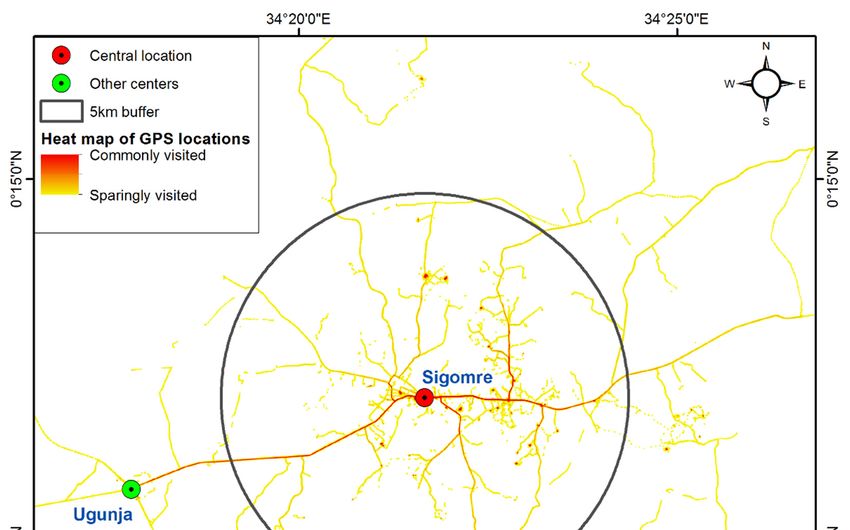
ISPRS Int. J. Geo-Inf. 2018, 7, 309 6 of 15
ISPRS Int. J. Geo-Inf. 2018, 7, x FOR PEER REVIEW 6 of 16
Figure 3.Figure 3. Validation
Validation data data (a) Locationsofofthe
(a) Locations the full
full extent
extentofof
5381 datadata
5381 points that were
points thatused
werein used
the in the
verification process. (b) A subsection of the datasets.
verification process. (b) A subsection of the datasets.
2.2. Mapping Motorcycle Tracks
2.2. Mapping Motorcycle Tracks
Prior to using the data to map transport infrastructure, GPS locations which were recorded when
Prior
theto using
riders themoving
were data toatmap transport
less than 5 km/h infrastructure,
were removed. GPS locations
In total, these werewhich were
77,511 datarecorded
points. when
An assumption was made that these locations signified instances when the riders
the riders were moving at less than 5 km/h were removed. In total, these were 77,511 data points. An were either walking
or not riding. Thereafter, a heat map of the GPS data points was created at a spatial resolution of 5 m
assumption was made that these locations signified instances when the riders were either walking or
and for a radius of 20 m to represent spatial variability in the relocated tweets. Initially, heat maps
not riding.
had Thereafter,
been generated a heat map
at 50 m, of 20
30 m, them,GPS data
and 10 points
m cell size. was created
However, atevident
it was a spatialthatresolution
beyond a of 5 m
and for radius
a radiusof 20ofm,20themresulting
to represent spatial
heat maps werevariability in the
too wide to aid relocated
in digitizing tweets.
accurate Initially,
road heat maps
centerlines
had been generated
while at 50
at 10 m, the m, 30heat
resulting m, 20mapm, and 10
surface wasmnotcell size. However,
adequately contiguous.it was evident
A radius that
of 20 m wasbeyond a
chosen because it resulted in surfaces on which it was easier to digitize road centerlines.
radius of 20 m, the resulting heat maps were too wide to aid in digitizing accurate road centerlines In addition,
it was sensible because dirt roads in Kenya are at most 6 m wide on each side of the centerline and
while at 10 m, the resulting heat map surface was not adequately contiguous. A radius of 20 m was
in some instances have road shoulders, which are 4 m wide on each side. In rainy seasons when the
chosen because it resulted
roads become muddy or inwhen
surfaces on surfaces
the road which it was easier
become to digitize
impassable, road
motorcycle centerlines.
riders In addition,
and other road
it was sensible because dirt
users occasionally roads
use road in Kenya
shoulders when are
theat most
road 6 m wide
surfaces on each The
are impassable. sideresulting
of the centerline
heat map and in
some instances have traces
revealed linear road ofshoulders,
motorcycle which are which
tracks from 4 m wide
traces on eachroad
of rural side. In rainy
networks were seasons when the
digitized.
The linear
roads become features,
muddy orwhich
whenwere the digitized from heat
road surfaces maps ofimpassable,
become GPS traces, provided
motorcyclethe input with
riders and other
which new road networks were mapped. In addition, the resulting road networks were used in the
road users occasionally use road shoulders when the road surfaces are impassable. The resulting heat
subsequent analysis to estimate accessibility in the study area.
map revealed linear traces of motorcycle tracks from which traces of rural road networks were
2.3.The
digitized. Simulating
linear Accessibility Surfaceswere digitized from heat maps of GPS traces, provided the input
features, which
with which new road networks
By assuming that peoplewere mapped.
in rural areas walkIn addition,
directly to thethe resulting
nearest road before
road network networks were used in
embarking
the subsequent analysis to estimate accessibility in the study area.
on a journey on motorcycle taxis or on vehicles, the Euclidean distance analysis method was used
to determine the straight-line accessibility from the road networks to different locations in the study
area. In Accessibility
2.3. Simulating particular, accessibility
Surfacesto three sets of road data was estimated and compared. Specifically,
accessibility was estimated to the official road networks, to OSM road networks and to new road
By networks
assuming that
from the people in rural
GPS tracking areas To
experiment. walk directly
identify to theornearest
the influence road network
before
the improvement in the
embarking on a journey on motorcycle taxis or on vehicles, the Euclidean distance analysis method
was used to determine the straight-line accessibility from the road networks to different locations in
the study area. In particular, accessibility to three sets of road data was estimated and compared.
Specifically, accessibility was estimated to the official road networks, to OSM road networks and to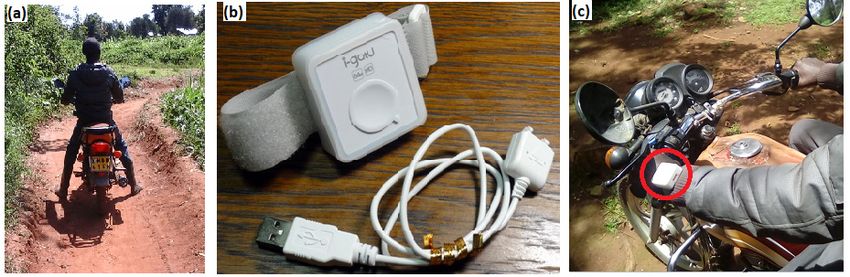
ISPRS Int. J. Geo-Inf. 2018, 7, 309                                                                    7 of 15

ISPRS Int. J. Geo-Inf. 2018, 7, x FOR PEER REVIEW                                                                           7 of 16
           accuracy of estimating accessibility by considering the motorcycle taxi tracks, the accessibility surface,
           which was estimated from the new road networks was subtracted from the accessibility surfaces from
3. Results official data and from OSM data.

3.1. Spatial Characteristics of GPS Trajectories of Motorcycle Taxis
          3. Results

     The3.1. Spatial
          area        Characteristics
                of study    was at ofleast
                                        GPS 5Trajectories
                                               km away    of Motorcycle
                                                             from the Taxis
                                                                          main trunk road that from Kisumu to Busia.
The trunk road The is the
                   area of only
                           studypaved      vehicular
                                   was at least 5 km away road    near
                                                               from thethe
                                                                         mainstudy
                                                                               trunk area   andfrom
                                                                                       road that   it passes
                                                                                                        Kisumu through
                                                                                                                 to Busia.Sidindi,
Simenya,The
          and   Ugunja
              trunk  road market
                          is the only centers
                                        paved (Figure
                                               vehicular4).roadFrom
                                                                  nearthe
                                                                       the map,
                                                                           study it   is apparent
                                                                                   area  and it passesthat, although
                                                                                                         through        the riders
                                                                                                                  Sidindi,
         Simenya,   and Ugunja   market   centers (Figure   4). From  the map,  it is apparent  that,
had their central location at the Sigomre market, their trips were commonly connected to the other    although  the riders
         had their central location at the Sigomre market, their trips were commonly connected to the other
major centers at Ugunja and Sidindi on the tarmacked road. In addition, there were multiple traces
         major centers at Ugunja and Sidindi on the tarmacked road. In addition, there were multiple traces to
to the surrounding     villages,
         the surrounding   villages,which
                                       whichwas
                                             was ofofmost
                                                      mostinterest
                                                               interest  to this
                                                                     to this workwork      were
                                                                                    were well     well captured.
                                                                                               captured.

      Figure 4.Figure  4. GPS of
                 GPS traces   traces of motorcycle
                                 motorcycle        taxis
                                               taxis  in in Sigomre area
                                                          Sigomre   area showing
                                                                          showinga higher concentration
                                                                                    a higher            of the points
                                                                                              concentration     of the points
               closer to the market center and in the surrounding villages.
      closer to the market center and in the surrounding villages.

                 From the comparison of the proximity of a subset the GPS traces to the closest sub-section
      From the comparison of the proximity of a subset the GPS traces to the closest sub-section of
          of official road data, on average, the GPS points we approximately 1.9 m from the respective road
official road    data,The
          centerline.    onoverall
                             average,     the GPS
                                   distribution of thepoints
                                                        distancewe    approximately
                                                                 of the                   1.9 centerline
                                                                        points from the road   m from were,
                                                                                                         the respective
                                                                                                              as shown     road
centerline.   The overall
          in Figure           distribution
                     5, signifying that along of
                                               the the   distance
                                                    straight segment ofconsidered
                                                                         the points    from
                                                                                    in the     the road
                                                                                           validation,    centerline
                                                                                                       a majority of thewere, as
shown inGPS Figure
               points5,were
                         signifying
                             likely to that along
                                        be within 5m the
                                                       of straight
                                                          the officialsegment    considered in the validation, a majority
                                                                       road centerline.
of the GPS points were likely to be within 5 m of the official road centerline.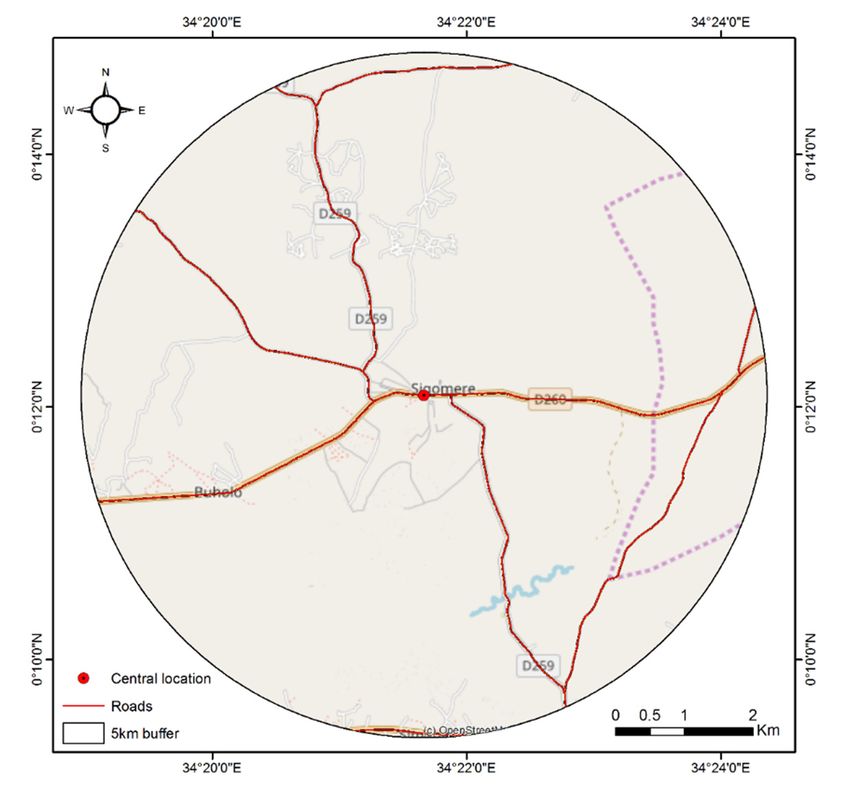
ISPRS Int. J. Geo-Inf. 2018, 7, 309                                                                                 8 of 15
  ISPRS Int. J. Geo-Inf. 2018, 7, x FOR PEER REVIEW                                                                   8 of 16

     Figure 5. Distribution of distances between GPS data points and the centerline of official road sections
       Figure 5. Distribution of distances between GPS data points and the centerline of official road sections
     in the validation section.
       in the validation section.

3.2.
 3.2.Road
      RoadNetworks
           Networksfrom
                     fromGPS
                          GPSTraces
                              Traces
       The
        Thefirst
             firstmethodological
                    methodological  step  in the
                                        step      process
                                              in the       of conversion
                                                      process               of theofGPS
                                                                of conversion        the traces  to representative
                                                                                          GPS traces                  road
                                                                                                        to representative
networks    was thewas
  road networks        creation of a heatofmap
                           the creation          representing
                                             a heat             the variation
                                                    map representing            in visitation
                                                                          the variation        to varioustoroad
                                                                                           in visitation          sections
                                                                                                             various   road
and   tracks  by  the  motor  cycle taxi  riders  (Figure  6). From   the field data,  it was  evident
  sections and tracks by the motor cycle taxi riders (Figure 6). From the field data, it was evident     that the  section
                                                                                                                         that
ofthe
    road  that   was   commonly     traversed    by  the motorcycle     taxis  was   the  Sigomre
       section of road that was commonly traversed by the motorcycle taxis was the Sigomre to Ugunja to Ugunja     section.
Insection.
    addition,    the heat map
            In addition,         revealed
                            the heat         a popular
                                      map revealed        road junction,
                                                       a popular            which was
                                                                    road junction,    whichapproximately      2 km from
                                                                                              was approximately        2 km
Sigomre    market    in  the eastern  part  of the area  of study   and  branching    from   the
  from Sigomre market in the eastern part of the area of study and branching from the main Ugunja-main  Ugunja-Mumia
road
  Mumiatowards
            road Luru.
                   towards The  GPSThe
                             Luru.    locations   were not
                                          GPS locations       onlynot
                                                           were     limited  to the main
                                                                       only limited   to theroad
                                                                                              mainlinks,
                                                                                                     road but   they
                                                                                                           links,  butalso
                                                                                                                        they
showed     minor    tributaries  that  could   potentially   be the  links  between    homesteads
  also showed minor tributaries that could potentially be the links between homesteads and the roads   and  the  roads    or
tracks.  The   linear   footprint emerging     from   heat  map   provided    the  basis  for manually
  or tracks. The linear footprint emerging from heat map provided the basis for manually digitizing       digitizing   the
road   networks.
  the road   networks.
3.3. Estimation of Road-Based Accessibility
      Based on the digitized road networks, accessibility from each road data was estimated by
calculating the Euclidean distance from the road networks. In Figure 7, represents the straight-line
accessibility as calculated against the three road datasets in this study. The particular road network
data were the new road network, as digitized from the heat maps of GPS traces, road networks from
official government data, and road network from OSM data.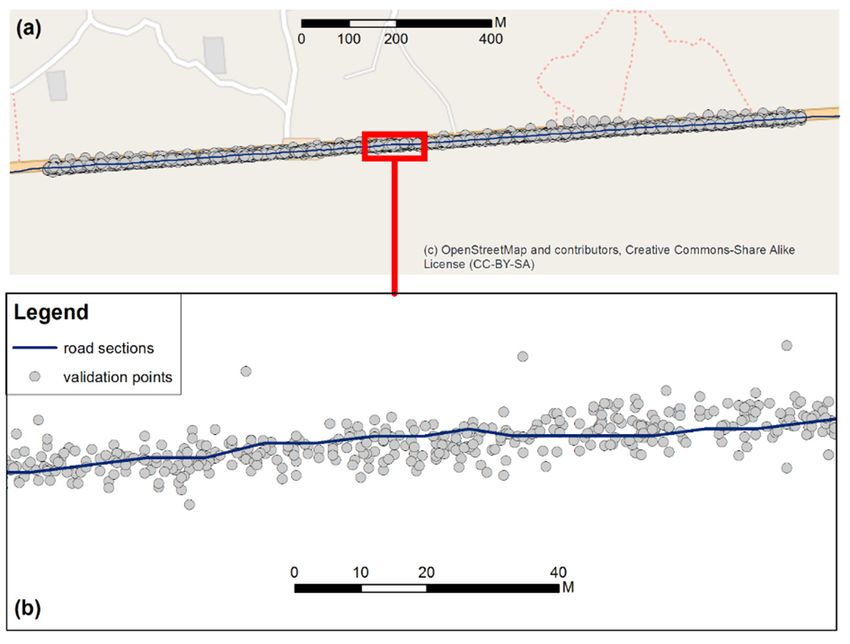
ISPRS Int. J. Geo-Inf. 2018, 7, 309                                                                                         9 of 15
ISPRS Int. J. Geo-Inf. 2018, 7, x FOR PEER REVIEW                                                                           9 of 16

      Figure 6. Traces of road network as visualized from the heat map resulting from the GPS traces of
      motorcycle taxis.

3.3. Estimation of Road-Based
      The accessibility       Accessibility
                        surface from GPS-derived road network (Figure 7a) showed that motorcycle
tracks  were on
      Based    highly
                    the accessible
                          digitized from
                                       road most       locations
                                               networks,           within thefrom
                                                              accessibility       studyeacharea.road
                                                                                                  Mostdata
                                                                                                         locations   in the areaby
                                                                                                               was estimated      of
study  were   within    500  m   from    the  motorcycle     tracks.   On   the  other    hand,   the
calculating the Euclidean distance from the road networks. In Figure 7, represents the straight-line  official  government     road
networks captured
accessibility            only theagainst
                as calculated        main roads      typesroad
                                              the three      anddatasets
                                                                   access roads,
                                                                              in thiswhich
                                                                                        study.linked   the main market
                                                                                                 The particular             centers.
                                                                                                                    road network
data were the new road network, as digitized from the heat maps of GPS traces, road networksof
Consequently,      the  accessibility     surface   from    the   official data    (Figure   7b)  depicts    large sections      the
                                                                                                                               from
area  of study,   which    could    inadvertently
official government data, and road network from OSM data.be assumed      as  inaccessible.     These    areas   were  particularly
aroundTheLuru,   Lukongo,surface
            accessibility      and Luru from regions    on the northeastern
                                                GPS-derived        road network    sections
                                                                                      (Figure and   inshowed
                                                                                                  7a)  the souththat
                                                                                                                   eastern   part of
                                                                                                                       motorcycle
the area   of study    to the  left  of Umin,     Uluthe,    and   Markuny       regions.    Finally,
tracks were highly accessible from most locations within the study area. Most locations in the area of the   accessibility  surface
from OSM
study  were(Figure
              within 500 7c) data
                             m from showed      that the main
                                        the motorcycle       tracks.areas
                                                                       Onthat    were hand,
                                                                            the other    accessible   are those
                                                                                                 the official      that were road
                                                                                                                government      near
major  roads,   and   areas  that  were    close  to  the  central   market   in  Sigomre.
networks captured only the main roads types and access roads, which linked the main market    It was  evident    that village-level
roads and
centers.     tracks were yet
          Consequently,       theto   be mappedsurface
                                   accessibility       extensively
                                                               from theon OSM.
                                                                           official data (Figure 7b) depicts large sections
      From    the    accessibility     surfaces,     areas
of the area of study, which could inadvertently be assumed    that    could    potentially      exhibit improved
                                                                                         as inaccessible.                estimated
                                                                                                               These areas     were
accessibility   were    motorcycle       taxi  tracks    to be   considered      as  the  basis
particularly around Luru, Lukongo, and Luru regions on the northeastern sections and in the south for accessibility    assessment
were  highlighted
eastern   part of the (Figure
                          area 8).
                                 of By    comparing
                                      study    to the leftthe of
                                                              accessibility
                                                                  Umin, Uluthe,surfaceand from   the motorcycle
                                                                                              Markuny       regions.tracks  against
                                                                                                                       Finally,  the
the surface    of accessibility     that  was    generated      from   the  official   road   network,
accessibility surface from OSM (Figure 7c) data showed that the main areas that were accessible are       it  was  estimated    that
combining
those         official
       that were        roads
                     near  majorwith   the GPS
                                     roads,   andtracks
                                                    areas of   motorcycle
                                                            that   were close  taxis  could
                                                                                  to the      probably
                                                                                           central   marketimprove    the accuracy
                                                                                                               in Sigomre.   It was
of accessibility
evident             estimationroads
          that village-level       in upandto 76%    of the
                                                tracks    werearea
                                                                 yetoftostudy.   Similarly,
                                                                         be mapped             integrating
                                                                                          extensively          GPS-derived road
                                                                                                         on OSM.
networks with OSM derived road networks could potentially improve the estimation of accessibility
in approximately 57% of the area of study. This implies that relying on official data and on publicly
available data for estimation of accessibility in rural areas may potentially lead to inaccurate estimates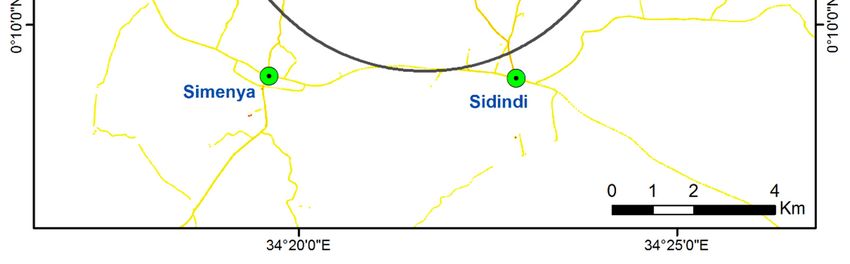
ISPRS Int. J. Geo-Inf. 2018, 7, 309                                                                               10 of 15

of accessibility. The influence of inaccurate estimation of accessibility may be particularly relevant
ISPRS Int.
when       J. Geo-Inf. fine-scaled
       modeling        2018, 7, x FORmobility
                                     PEER REVIEW
                                              and interaction patterns at local or village-level. 10 of 16

      Figure 7.
      Figure     Accessibility surfaces
             7. Accessibility   surfaces as
                                         as computed
                                            computed from
                                                       from Euclidean
                                                             Euclidean distance
                                                                        distance from
                                                                                 from (a)
                                                                                      (a) GPS-derived
                                                                                          GPS-derived road
                                                                                                      road
      networks (b)
      networks  (b) official
                    official road
                             road networks
                                  networks and
                                            and (c)
                                                (c) Open
                                                    Open Street
                                                          Street Map
                                                                 Map road
                                                                     road networks.
                                                                          networks.

     From
     In orderthe  accessibility
               to quantify         surfaces,
                             whether            areas that routes
                                         the GPS-derived      could coincided
                                                                      potentiallywithexhibit
                                                                                        the OSM improved       estimated
                                                                                                    and official   routes,
accessibility
a 20 m × 20 were      motorcycle
               m polygon     fishnet taxi
                                        wastracks
                                              usedtotobeidentify
                                                          considered    as the
                                                                  the cells     basis for
                                                                             through        accessibility
                                                                                        which    GPS-derived assessment
                                                                                                                   routes,
were
OSM highlighted     (Figureroads
      tracks, and official   8). Bytraversed.
                                      comparingThe the intersection
                                                        accessibilitymethod
                                                                      surface from    the motorcycle
                                                                               was then                  tracksthe
                                                                                            used to identify      against
                                                                                                                     cells
the surface
in which     of accessibility
          GPS-derived     routesthat   was generated
                                   intersected   with OSMfromtracks
                                                               the official  road network,
                                                                      and official              it was estimated
                                                                                   roads, respectively.       Out ofthat
                                                                                                                       the
combining
7236 (20 m official
             × 20 m) roads
                       cellswith   the GPS
                             through          tracks
                                          which      of motorcycle
                                                  GPS-derived         taxis
                                                                  roads     could probably
                                                                         traversed,             improve
                                                                                       OSM routes      werethelocated
                                                                                                                accuracyin
of accessibility estimation    in up   to 76%   of the area  of study.  Similarly,  integrating     GPS-derived
2830 (approximately 39%) of the cells. On the other hand, official road networks intersected with 2316               road
networks with OSM
(approximately    32%)derived
                         of the 20roadm×  networks   could
                                             20 m cells      potentially
                                                          containing      improve the
                                                                       GPS-derived        estimation
                                                                                        routes.         of 9accessibility
                                                                                                   Figure     represents
in approximately     57%  of the  area   of  study. This   implies  that relying  on   official  data
the intersection between GPS-derived routes and the baseline data, as captured in the (a) official    and    on  publicly
                                                                                                                      and
available
OSM data. data  for estimation    of accessibility  in rural  areas  may  potentially   lead  to  inaccurate   estimates
of accessibility. The influence of inaccurate estimation of accessibility may be particularly relevant
when modeling fine-scaled mobility and interaction patterns at local or village-level.
ISPRS Int. J. Geo-Inf. 2018, 7, 309 11 of 15
ISPRS Int. J. Geo-Inf. 2018, 7, x FOR PEER REVIEW 11 of 16
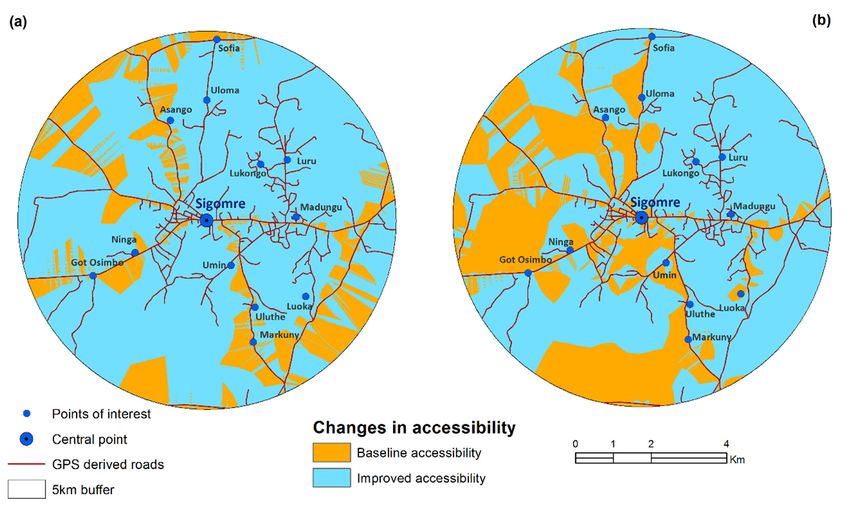
Figure 8. Potential improvement in estimation of accessibility were the GPS data from motorcycle
taxis to be combined with (a) official roads and (b) OSM data. The orange parts depict the areas whose
accessibility was estimated accurately based on baseline data, while the areas in blue color shows
areas whose accessibility improved when estimated from the GPS-derived road networks.
In order to quantify whether the GPS-derived routes coincided with the OSM and official routes,
a 20 m × 20 m polygon fishnet was used to identify the cells through which GPS-derived routes, OSM
tracks, and official roads traversed. The intersection method was then used to identify the cells in
which GPS-derived routes intersected with OSM tracks and official roads, respectively. Out of the
7236 (20 m × 20 m) cells through which GPS-derived roads traversed, OSM routes were located in
2830 Figure
(approximately
Figure8.8.Potential39%)
Potential of the cells.
improvement
improvement in inOn the other
estimation
estimation of hand, official
accessibility
of accessibility were road
were networks
the
the GPS GPS
data data
fromintersected
from with
taxis 2316
motorcycle
motorcycle
(approximately
taxis
to be to 32%)
be combined
combined of with
with the 20(a)m
(a) official×roads
20 m
official cells
roads
and containing
and
(b) (b) OSM
OSM GPS-derived
data.
data. The
The orange
orange routes. Figure
partsdepict
parts depict 9areas
represents
theareas
the whose the
whose
intersection between
accessibility
accessibilitywas GPS-derived
wasestimated
estimated routes
accurately
accurately and
based
based thebaseline
on on baseline
baseline data, data,
while
data, as areas
the
while captured
in blue
the areas incolor
in the shows
blue (a) official
color areas and
shows
OSMwhose accessibility
data.whose
areas improved
accessibility when estimated
improved from the
when estimated GPS-derived
from road networks.
the GPS-derived road networks.
In order to quantify whether the GPS-derived routes coincided with the OSM and official routes,
a 20 m × 20 m polygon fishnet was used to identify the cells through which GPS-derived routes, OSM
tracks, and official roads traversed. The intersection method was then used to identify the cells in
which GPS-derived routes intersected with OSM tracks and official roads, respectively. Out of the
7236 (20 m × 20 m) cells through which GPS-derived roads traversed, OSM routes were located in
2830 (approximately 39%) of the cells. On the other hand, official road networks intersected with 2316
(approximately 32%) of the 20 m × 20 m cells containing GPS-derived routes. Figure 9 represents the
intersection between GPS-derived routes and the baseline data, as captured in the (a) official and
OSM data.
Figure 9.
Figure 9. Potential
Potentialimprovement
improvementininmap
mapcoverage ofof
coverage GPS-derived roads
GPS-derived when
roads compared
when against
compared (a)
against
data from official sources and (b) OSM tracks.
(a) data from official sources and (b) OSM tracks.
4. Discussion
The aim of the work that is presented here was to tag volunteer motorcycle taxi drivers and to
track the movement patterns of the motorcycle taxis as a proxy for collecting the data for mapping
rural transport routes. By tracking 10 volunteer riders for a period of two week; approximately
0.23 million data points were collected used in the mapping exercise. Specifically, a semi-automatic
method was applied to digitize road networks and to estimate distance-based accessibility in the study
are. The output
Figure of mainimprovement
9. Potential objectives ininthis
maptask can be
coverage ofsummarized in thewhen
GPS-derived roads following ways.
compared against (a)
data from official sources and (b) OSM tracks.ISPRS Int. J. Geo-Inf. 2018, 7, 309 12 of 15
Firstly, this study demonstrated that GPS tracking of motorcycle taxis could provide vital
and accurate information for mapping transport infrastructure in remote rural areas (Figure 4).
Moreover, motorcycles do not only use the main and official roads but move within the villages.
The GPS traces within the villages provide spatial information on important tracks and pathways that
could come in handy in times of emergencies. For instance, maps resulting from such GPS tracks could
be used when planning for vaccination and medical campaigns that target vulnerable members of the
rural communities, who may not be able to walk for long distances.
Secondly, accessibility surfaces, which were generated from GPS tracks of motorcycle taxis
were visually and mathematically more detailed and accurate when compared against estimated
accessibility based on official road network data or on publicly available data like OSM. In particular,
when considering the motorcycle taxi-derived road networks in the estimation of accessibility improved
the results by approximately 76% when compared against accessibility surface from official government
data and by 57% when compared against OSM data. Additionally, GPS-derived data could potentially
improve the coverage of official road maps in rural areas by up to 70% and OSM data by up to 60%
(Figure 9). It is therefore plausible to conclude that data on GPS trajectories of motor cycle taxis,
as captured by GPS data loggers, could potentially augment other mapping initiatives and hasten the
process of mapping rural transport routes.
Moreover, the motorcycle taxi riders were not constrained to the area of study; hence, we collect
data for large areas by only tagging a small group of volunteers. For instance, GPS data from this
study showed that, in some cases, riders traversed more than one administrative county in a single
day. In fact, the entire data that we collected in this short experiment covered four different counties
in western Kenya region. The counties included Siaya (where the area of study is located) and the
neighboring counties of Busia, Kakamega, and Kisumu. It is therefore plausible to assume that, data
from tracking of motorcycle taxis, could potentially be applied to model and to represent inter-regional
mobility of people and goods.
Apart from locational data, GPS data loggers, which were deployed in this study could record
the time of travel, speed of motion, altitude, and course of the journey. These additional data
variables could provide the necessary parameters [49] for simulating the behavior of motorcycle riders.
There are potential applications of GPS data of the kind collected in this experiment in data-driven
models of taxi behavior [50], human mobility, in simulation of motorcycle-related accidents, and in
representation of socio-economic interaction between different interconnected rural areas. Additionally,
an understanding the mobility characteristics of motorcycle taxis, which are increasingly becoming
major providers of transport services in rural areas within sub-Saharan Africa could provide the
necessary data for simulating the contribution of the taxis to pollution and to health-related problems.
This may be particularly relevant since, the passengers who use the taxis may be exposed to dust,
noise, and adverse weather conditions [51], which may be linked to the increase of pneumonia cases
and chest problems among riders and passengers.
The main limitations of this work included the fact that the candidate GPS data loggers that
were deployed in the experiment could not transfer the recorded data to a centralized server in
real-time. It was therefore necessary for the riders to hand in their loggers at the end of each week,
and sometimes during the week for charging. This disrupted the data collection exercise as the riders
could not be tracked continuously throughout the duration of the experiment. Sensors or trackers
with the capability to routinely transfer the collected data to a centralized database management
system would potentially improve the workflow and facilitate problem detection during the data
collection process. Such an automated workflow could also facilitate the specification of real-time
data-driven models by enabling a bi-directional communication between the data management system
or models and the GPS sensors in the field. Secondly, we implemented a semi-automatic method of
road network extraction. By manually digitizing the final roads, this could potentially slow down the
process particularly if the area of interest is large. Moreover, the semi-automatic procedure could limit
the replicability of the road extraction process. Finally, but not least, the number of loggers deployed inISPRS Int. J. Geo-Inf. 2018, 7, 309 13 of 15
this experiment and the area of study were small. While these did not adversely influence the outcome
of the experiment, a larger number volunteers and large area of study in different rural communities
would probably reveal more interesting results, particularly as the data is to be applied to modeling
mobility patterns and behaviors of a diverse group of riders. Further, to improve the validation of the
data and output from this kind of experiment, a comparison of the GPS-derived data more accurate
post-processing kinematic trajectories could be performed in limited test areas with geodetic GNSS
receivers [52].
Future work could implement an automated sensor-to-maps strategy with an entirely automated
workflow. We see potential application of such workflows in most rural areas in developing countries.
Additionally, a direct link between the GPS-derived motorcycle taxi data collection efforts and
web-based mapping platforms, like the OpenStreetMap could also improve the visibility of the
mapping exercise and expose the data to a wider audience for timely validation and labeling. Such a
framework could also find application during emergencies and in rural road infrastructure planning
by revealing commonly traverse road networks that could be prioritized. Specifically, trajectories of
riders could provide information on the accessible areas and the shortest routes to use for navigation.
Finally, the maps emerging from GPS tracks of motorcycle taxis could be used to develop software
apps for route planning by the riders and to regularize transportation charges that are levied on the
users of the motor cycle taxis.
Funding: This research is supported by the Austrian Science Fund (FWF) through the Doctoral College GIScience
at the University of Salzburg (DK W1237-N23).
Acknowledgments: The authors wish to appreciate most sincerely, the very important role of the volunteers who
agreed to participate this experiment. In addition, the author wished to thank the anonymous reviewers of this
manuscript for accepting to enrich the manuscript by providing very valuable comments. In addition, the authors
is very grateful for the generous research funding from the Austrian Science Fund (FWF) and to the PhD advisory
committee for providing very useful input for this work.
Conflicts of Interest: The author declares no conflict of interest.
References
1. Velaga, N.R.; Beecroft, M.; Nelson, J.D.; Corsar, D.; Edwards, P. Transport poverty meets the digital divide:
Accessibility and connectivity in rural communities. J. Transp. Geogr. 2012, 21, 102–112. [CrossRef]
2. Iezzoni, L.I.; Killeen, M.B.; O’Day, B.L. Rural Residents with Disabilities Confront Substantial Barriers to
Obtaining Primary Care. Health Serv. Res. 2006, 41, 1258–1275. [CrossRef] [PubMed]
3. Banjo, G.; Gordon, H.; Riverson, J. Rural Transport: Improving Its Contribution to Growth and Poverty Reduction
in Sub-Saharan Africa; Work Bank Group: Washington, DC, USA, 2012.
4. Atuoye, K.N.; Dixon, J.; Rishworth, A.; Galaa, S.Z.; Boamah, S.A.; Luginaah, I. Can she make it?
Transportation barriers to accessing maternal and child health care services in rural Ghana. BMC Health
Serv. Res. 2015, 15, 333. [CrossRef]
5. Downing, A.; Sethi, D. Health Issues in Transport and the Implications for Policy; Department for International
Development: London, UK, 2001.
6. Jones, S.; Tefe, M.; Zephaniah, S.; Tedla, E.; Appiah-Opoku, S.; Walsh, J. Public transport and health
outcomes in rural sub-Saharan Africa—A synthesis of professional opinion. J. Transp. Health 2016, 3, 211–219.
[CrossRef]
7. Starkey, P. A Methodology for Rapid Assessment of Rural Transport Services; Work Bank Group: Washington, DC,
USA, 2007.
8. Popp, L.; McCole, D. Understanding tourists’ itineraries in emerging rural tourism regions: The application
of paper-based itinerary mapping methodology to a wine tourism region in Michigan. Curr. Issues Tour.
2016, 19, 988–1004. [CrossRef]
9. Haklay, M. How good is volunteered geographical information? A comparative study of OpenStreetMap
and Ordnance Survey datasets. Environ. Plan. B 2010, 37, 682–703. [CrossRef]
10. Koeva, M.; Muneza, M.; Gevaert, C.; Gerke, M.; Nex, F. Using UAVs for map creation and updating. A case
study in Rwanda. Surv. Rev. 2018, 50, 312–325. [CrossRef]ISPRS Int. J. Geo-Inf. 2018, 7, 309 14 of 15
11. Ottichilo, W.; Khamala, E. Map Updating Using High Resolution Satelite Imagery—A Case of the Kingdom
of Swaziland. Int. Arch. Photogramm. Remote Sens. 2002, 34, 89–92.
12. Van der Molen, P. Rapid urbanisation and slum upgrading: What can land surveyors do? Surv. Rev. 2015,
47, 231–240. [CrossRef]
13. Dunn, C.E. Participatory GIS—A people’s GIS? Prog. Hum. Geogr. 2007, 31, 616–637. [CrossRef]
14. Elwood, S.; Goodchild, M.F.; Sui, D.Z. Researching Volunteered Geographic Information: Spatial Data,
Geographic Research, and New Social Practice. Ann. Assoc. Am. Geogr. 2012, 102, 571–590. [CrossRef]
15. Newman, G.; Wiggins, A.; Crall, A.; Graham, E.; Newman, S.; Crowston, K. The future of citizen science:
Emerging technologies and shifting paradigms. Front. Ecol. Environ. 2012, 10, 298–304. [CrossRef]
16. Mooney, P.; Corcoran, P.; Winstanley, A.C. Towards quality metrics for OpenStreetMap. In Proceedings of
the 18th SIGSPATIAL International Conference on Advances in Geographic Information Systems, San Jose,
CA, USA, 3–5 November 2010.
17. Baruch, A.; May, A.; Yu, D. The motivations, enablers and barriers for voluntary participation in an online
crowdsourcing platform. Comput. Hum. Behav. 2016, 64, 923–931. [CrossRef]
18. Massung, E.; Coyle, D.; Cater, K.F.; Jay, M.; Preist, C. Using crowdsourcing to support pro-environmental
community activism. In Proceedings of the SIGCHI Conference on Human Factors in Computing Systems,
Paris, France, 27 April–2 May 2013; ACM: Paris, France, 2013; pp. 371–380.
19. Ma, Y.; Richards, M.; Ghanem, M.; Guo, Y.; Hassard, J. Air pollution monitoring and mining based on sensor
grid in London. Sensors 2008, 8, 3601–3623. [CrossRef] [PubMed]
20. Reis, S.; Seto, E.; Northcross, A.; Quinn, N.W.; Convertino, M.; Jones, R.L.; Maier, H.R.; Schlink, U.;
Steinle, S.; Vieno, M. Integrating modelling and smart sensors for environmental and human health.
Environ. Model. Softw. 2015, 74, 238–246. [CrossRef] [PubMed]
21. Bevly, D.M.; Ryu, J.; Gerdes, J.C. Integrating INS Sensors with GPS Measurements for Continuous Estimation
of Vehicle Sideslip, Roll, and Tire Cornering Stiffness. IEEE Trans. Intell. Transp. Syst. 2006, 7, 483–493.
[CrossRef]
22. Agarwal, Y.; Balaji, B.; Gupta, R.; Lyles, J.; Wei, M.; Weng, T. Occupancy-driven energy management for
smart building automation. In Proceedings of the 2nd ACM Workshop on Embedded Sensing Systems for
Energy-Efficiency in Building, Zurich, Switzerland, 3–5 November 2010; ACM: Zurich, Switzerland, 2010;
pp. 1–6.
23. Jiang, B. Volunteered geographic information and computational geography: New perspectives.
In Crowdsourcing Geographic Knowledge; Springer: Berlin, Germany, 2013; pp. 125–138.
24. Atzmanstorfer, K.; Resl, R.; Eitzinger, A.; Izurieta, X. The GeoCitizen-approach: Community-based spatial
planning—An Ecuadorian case study. Cartogr. Geogr. Inf. Sci. 2014, 41, 248–259. [CrossRef] [PubMed]
25. Kays, R.; Crofoot, M.C.; Jetz, W.; Wikelski, M. Terrestrial animal tracking as an eye on life and planet. Science
2015, 348, aaa2478. [CrossRef] [PubMed]
26. Schieltz, J.M.; Okanga, S.; Allan, B.F.; Rubenstein, D.I. GPS tracking cattle as a monitoring tool for
conservation and management. Afr. J. Range Forage Sci. 2017, 34, 173–177.
27. Roche, S.; Propeck-Zimmermann, E.; Mericskay, B. GeoWeb and crisis management: Issues and perspectives
of volunteered geographic information. GeoJournal 2013, 78, 21–40. [CrossRef]
28. Nadai, M.D.; Staiano, J.; Larcher, R.; Sebe, N.; Quercia, D.; Lepri, B. The Death and Life of Great Italian Cities:
A Mobile Phone Data Perspective. In Proceedings of the 25th International Conference on World Wide Web,
Montreal, QC, Canada, 11–15 April 2016; pp. 413–423.
29. He, W.; Hwang, K.; Li, D. Intelligent carpool routing for urban ridesharing by mining GPS trajectories.
IEEE Trans. Intell. Transp. Syst. 2014, 15, 2286–2296. [CrossRef]
30. Bar Hillel, A.; Lerner, R.; Levi, D.; Raz, G. Recent progress in road and lane detection: A survey.
Mach. Vis. Appl. 2014, 25, 727–745. [CrossRef]
31. Porter, G. Transport Services and Their Impact on Poverty and Growth in Rural Sub-Saharan Africa: A Review
of Recent Research and Future Research Needs. Transp. Rev. 2014, 34, 25–45. [CrossRef]
32. Barbosa, K.G.; Lucas-Neto, A.; Gama, B.D.; Lima-Neto, J.C.; Lucas, R.S.C.; d’Ávila, S. Injuries and absenteeism
among motorcycle taxi drivers who are victims of traffic accidents. J. Forensic Legal Med. 2014, 26, 15–18.
[CrossRef] [PubMed]
33. Qian, J. No right to the street: Motorcycle taxis, discourse production and the regulation of unruly mobility.
Urban Stud. 2015, 52, 2922–2947. [CrossRef]You can also read