Brazil 2015 hiGhliGhts - OECD
←
→
Page content transcription
If your browser does not render page correctly, please read the page content below
Brazil
  Highlights

     2015
the oecd

The Organisation for Economic Co-operation and
Development (OECD) provides its 34 member countries with
a unique forum to work together to address the economic,
social and environmental challenges of globalisation.
The OECD is also at the forefront of efforts to understand
and to help governments respond to new developments
and concerns. The Organisation provides a setting where
governments can compare policy experiences, seek answers
to common problems, identify good practice and work to
co-ordinate domestic and international policies.

What are eprs?

OECD Environmental Performance Reviews (EPRs) provide
evidence-based analyses and assessments of countries’
progress towards their environmental policy objectives.
They promote peer learning, enhance government
accountability and provide targeted recommendations to
help countries improve their environmental performance.
They are supported by a broad range of economic and
environmental data. Each EPR cycle covers all OECD
member countries and selected partner countries.

Why an epr of brazil?

Brazil is one of five major emerging economies with which
the OECD has established a key partnership, together
with the People’s Republic of China, India, Indonesia and
South Africa. In the context of this mutually beneficial
co‑operation, the OECD conducted the first review of Brazil’s
                                                                “Brazil needs to
environmental performance. This involved a constructive
dialogue between Brazil and the countries participating in
                                                                remain vigilant
the OECD Working Party on Environmental Performance.
The EPR provides an assessment of Brazil’s environmental
                                                                and thoroughly
progress and policies and identifies 53 recommendations to
help enhance policy coherence, effectiveness and efficiency.
                                                                implement all
These Highlights summarise the main findings, with a
special emphasis on:
                                                                the environmental
zz   Key environmental developments                             programmes
     Environmental governance and management
                                                                it has put in place.”
zz

zz   Progress towards a green economy
     Biodiversity conservation and sustainable use
zz
                                                                Ángel Gurría, OECD Secretary-General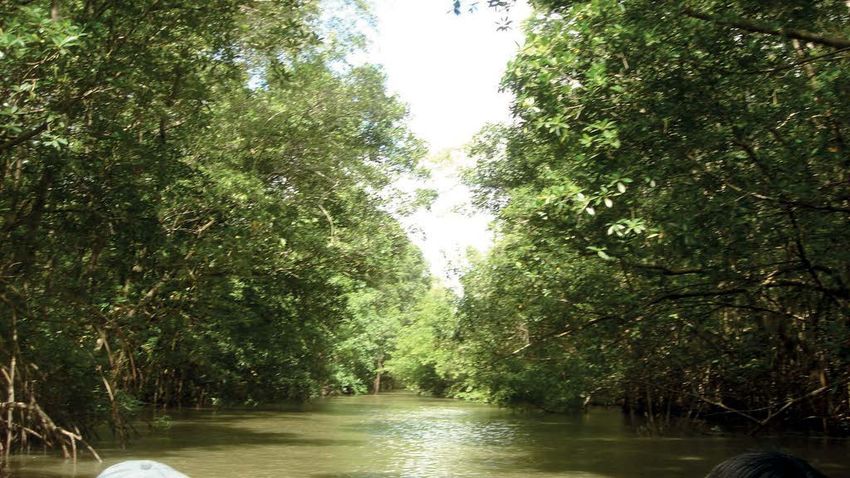
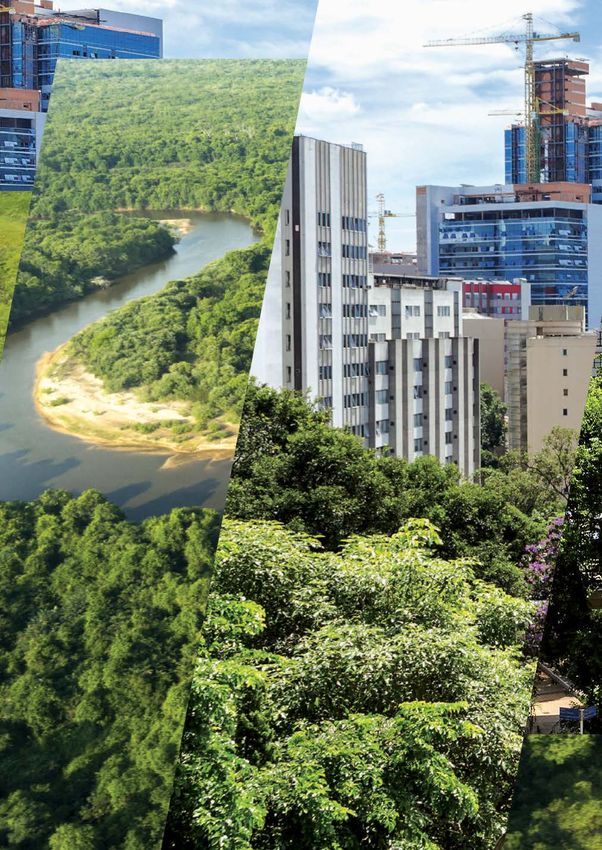
Overview

            Brazil

                                                                                                            Highlights
                            Brazil is the world’s fifth largest country. Vibrant growth and effective
                            social policies lifted millions of people out of poverty in the 2000s,
                            although socio-economic development varies widely across the country.
                            Natural resources are essential to Brazil’s development: it is among the
                            major global agricultural, minerals and oil producers, and hydropower
                            generates most of its electricity. Protected areas extend over a large
                            part of the country and deforestation in the Amazon has dropped
                            remarkably, which in turn has helped curb greenhouse gas emissions.

                            However, economic growth and urban, agricultural and infrastructure
                            expansion have also meant increased energy and resource use
                            and consequent environmental pressures. Quality and coverage of
                            environmental services need to be further improved. While Brazil’s
                            environmental laws are stringent, implementation and enforcement
brazil 2014                 gaps persist.
Population                  In the current context of a contracting economy, better integrating
199.5 million               environmental objectives into economic and sectoral policies would help
GDP/capita                  Brazil move towards a greener, more sustainable development path.
(purchasing power parity)
USD 15 800                  opportunities
(OECD average is 38 900)
                            zz   The world’s most biodiverse country, with vast forest, water,
Total area                       mineral and fossil fuel resources.
8 515 770 km2
                            zz   A low-carbon energy mix based on hydropower and biofuels.
Population density          zz   A comprehensive and advanced legislative framework for
23.4 inhabitants/km²             environmental management and sustainable use of biodiversity.
(OECD average is 34.9)
                            zz   A new Forest Code that promises to reconcile the objectives of
Currency                         biodiversity conservation and agricultural development.
Brazilian real
                            zz   First-rate deforestation monitoring systems.
USD 1.00 = BRL 2.35
                            zz   One of the world’s largest systems of protected areas.

                            Challenges

                            zz   A weakening economy and wide disparities in income and access
                                 to environmental services.
                            zz   A decentralised governance structure, demanding close
                                 co‑ordination between federal, state and municipal governments.
                            zz   Highly heterogeneous institutional capacity, creating gaps
                                 between announced policies and implementation.
                            zz   Growing cities, requiring upgraded water, waste and urban
                                 transport infrastructure.
                            zz   Continued clearing and degradation of large areas of tropical
                                 forests and savannah.
                            zz   Insufficient human resources to effectively manage
                                 protected areas.

                                                                                                        3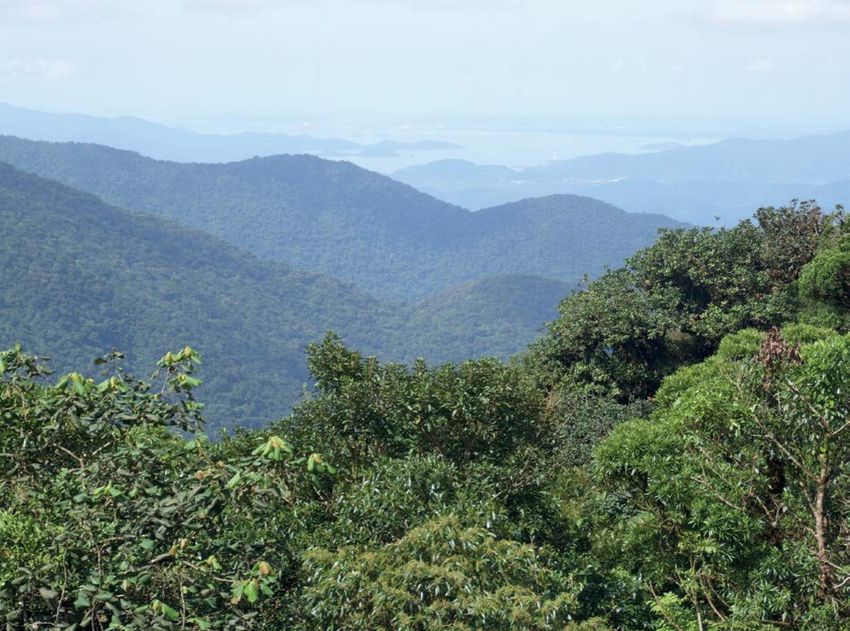
OECD Environmental performance Review of brazil

    Key environmental developments

    Brazil is very diverse with respect to climate, vegetation, land use, population, institutional capacity and
    economic activities. Brazilians are proud of their country’s natural wealth and environmental awareness is
    increasing. Yet economic growth has been demanding on land, water, materials and energy, and has resulted
    in increased pollution and waste generation.

    energy and climate change

    zz    Brazil has a low-carbon energy mix, based on                                                                 deforestation has more than offset growing emissions
          hydropower and biofuels: nearly 40% of its energy                                                            from energy use and agriculture, which are now the
          needs and about 80% of its electricity are generated                                                         largest emitting sectors.
          from renewable sources. These are the highest shares
                                                                                                              zz       Brazil developed a comprehensive strategy for
          among BRIICS countries (Figure 1). They help keep the
                                                                                                                       reducing GHG emissions. It launched climate change
          carbon intensity of Brazil’s economy (CO2 emissions
                                                                                                                       programmes in areas such as energy, iron and steel
          per unit of GDP) below the OECD average.
                                                                                                                       production, agriculture and deforestation control.
    zz    Greenhouse gas (GHG) emissions have declined by                                                              Brazil is also developing a system to monitor the
          more than 40%, thanks to a dramatic reduction in                                                             implementation and effectiveness of these programmes,
          deforestation; in 2012 they were below the 2020 target                                                       as well as a climate change adaptation plan.
          (Figure 2). The fall in GHG emissions associated with

    Figure 1: Brazil has the highest share of renewables among BRIICS countries

    Share of renewables
                                                77%                    20%                       17%                  17%                     12%                    1%            21%                    22%
    zz    in electricity
          production                                     People’s Republic of

                                         Brazil              China                      India             Russia            Indonesia                  South Africa         OECD                  World

                                                          34%
    zz    in total primary
          energy supply                          39%                    34%                     26%                   11%                      11%                   3%             9%                    13%
                                                                                                                                People’s Republic of
                                         Brazil         Indonesia                   India            South Africa                                        Russia             OECD                  World
                                                                                                                                    China
                                      2013 data. Renewables include hydropower, geothermal, solar, wind, biofuels and renewable waste.
                                      Source: IEA (2015), IEA World Energy Statistics and Balances (database).

    Figure 2: GHG emissions have dropped to a level below the 2020 target
                                                                                Mt CO2 eq                               2 510
    Greenhouse gas emissions by sector,                                         2 500
    in million tonnes CO2 equivalent
                                                                                        2 100                                                                                                2020 target:
                                                                                                                                                                                             1 980 Mt CO2 eq
                                                                                2 000
                                                                                                                                                                1 826
                                                                                                Land use and forest
                                                                                1 500
                                                                                                                                                                                          1 203

                                                                                1 000
                                                                                                Waste
                                                                                                Industrial processes

                                                                                 500            Agriculture
    Source: MCTI (2014; 2013), Estimativas anuais de
    emissões de gases de efeito estufa no Brasil; MCTI (2010),                                  Energy
    Second National Communication of Brazil to the UNFCCC.
                                                                                   0
                                                                                        2000     2001    2002   2003     2004      2005      2006      2007   2008   2009   2010   2011    2012

4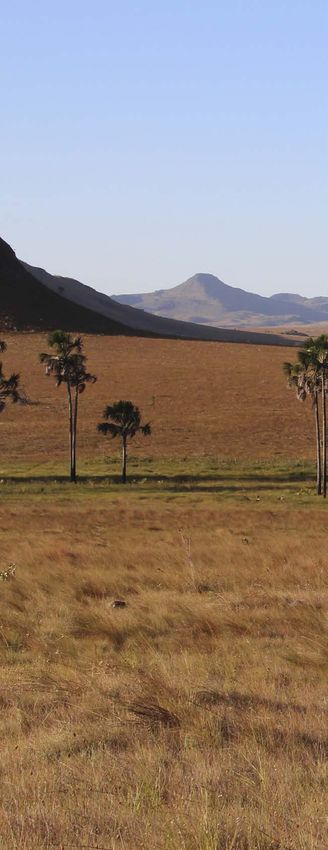
Highlights
Figure 3: Water use, especially for agriculture, has increased considerably

 62% Agriculture, forestry and fishing
                                                                                                                                                                51 billion m3 in 2012
                                                                                                                       14 billion m3 in 2000
 22% Public water supply and households                                                                                       18 billion m3 in 2012

                                                                                                               9 billion m3 in 2000
 16 % Manufacturing industries                                                                                          14 billion m3 in 2012

 36% ofreaching
          abstracted water is lost before
                consumers.
                                                                                                                                                 30 billion m3 in 2012

 Gross freshwater abstraction by sector, 2012.
 Source: OECD (2015), “Freshwater abstractions”, OECD Environment Statistics (database)   1   = 1 billion m3

air quality                                                                                                    water management

zz    Air pollution has been reduced, but peak                                                                 zz   Brazil is endowed with 12% of the world’s freshwater
      concentrations of small particles regularly exceed                                                            resources, but their distribution is uneven across the
      national air quality standards in major metropolitan                                                          country: about 70% are located in the Amazon basin.
      areas. This has severe health impacts.                                                                        Water abstractions have dramatically increased since
                                                                                                                    2000, especially for agriculture, the main water user
zz    Less than half of the states have installed
                                                                                                                    (Figure 3). Access to potable water is now almost
      monitoring systems, and data on air pollution are
                                                                                                                    universal in urban areas, but still lacking for 15% of the
      often inconsistent. Brazil is revising its national air
                                                                                                                    rural population.
      quality standards in accordance with World Health
      Organization guidelines.                                                                                 zz   Low rainfall and inefficient water use have led to some
                                                                                                                    critical situations. The 2014-15 water shortages in the
                                                                                                                    southeast affected millions of people and damaged
waste management                                                                                                    agriculture, industry and hydropower production. More
                                                                                                                    than a third of abstracted freshwater is lost before
zz    More people - but still only half of the rural population                                                     reaching consumers, primarily due to inadequate
      - benefit from waste collection services. Most waste is                                                       infrastructure.
      still landfilled, sometimes in uncontrolled sites.
                                                                                                               zz   National, state and river basin plans for integrated
zz    The 2010 National Solid Waste Policy is helping                                                               water resource management cover only half the
      implement sound management principles, including                                                              territory, are generally poorly implemented and fail to
      extended producer responsibility for the recovery                                                             guide water resource allocation.
      of selected products (e.g. electronic devices and
      pesticides) at the end of their useful life. However,                                                    zz   Only 56% of the urban population had access to
      recycling infrastructure, waste data and institutional                                                        sewage collection systems in 2011, with large regional
      capacity at local level are insufficient to ensure                                                            variations. Water quality is good or very good in
      effective waste management.                                                                                   about 80% of water bodies, but low in many densely
                                                                                                                    populated urban areas, mainly due to increased
                                                                                                                    effluent volumes and poor wastewater treatment.

Next steps | climate, air, waste and water

zz    Speed up the implementation of the sectoral climate                                                      zz   Establish consistent water allocation criteria and
      change programmes and the development of the                                                                  wastewater discharge limits.
      monitoring system.
                                                                                                               zz   Better enforce waste management and disposal
zz    Develop a comprehensive nationwide air quality                                                                regulations and strengthen the waste management
      monitoring system.                                                                                            information system.

                                                                                                                                                                                        5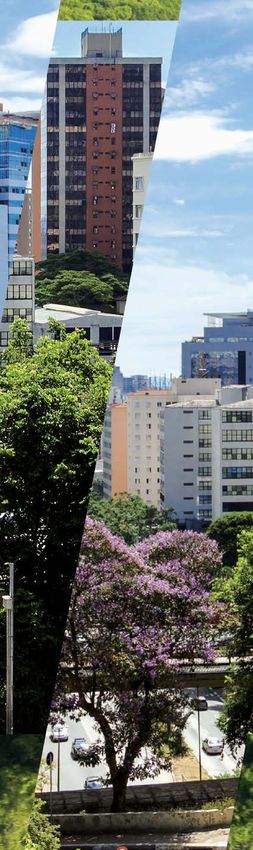
OECD Environmental performance Review of brazil

    Environmental governance and management

    The Brazilian Constitution recognises the people’s right to an ecologically balanced environment. Brazil is
    an economically and socially heterogeneous country, with a complex federal governance framework. This
    makes implementing environmental policies and programmes on the ground challenging. The stringency of
    environmental requirements and the level of compliance vary substantially across jurisdictions, reflecting
    local priorities and capacity constraints.

                                                                                                                                                  Photo by Jorge Sanz, Creative Commons Licence on Flickrr
    multilevel governance                                                           All states and many large municipalities have their
                                                                                    own environmental institutions (Figure 4), but their
                                                                                    level of development varies considerably and their
    Brazil has developed a comprehensive yet complex                                capacity is often limited. Despite progress, states
    environmental institutional framework. The federal                              and municipalities do not consistently monitor the
    environmental institutions, including the environment                           state of the environment and the outcomes of their
    ministry (MMA), the Brazilian Institute of Environment                          environmental policies.
    and Renewable Natural Resources and the Chico Mendes
    Institute for Biodiversity Conservation have grown                              financing environmental programmes
    remarkably in capacity and staff over the last 10 years.
    The National Environmental Council, a high-level                                Public allocations for environmental management
    advisory and deliberative committee, brings together                            grew by 48% in 2010-14, reaching about 0.4% of the
    all levels of government and relevant stakeholders.                             federal budget. The MMA budget is relatively small, and
    Yet effective co-ordination within and across levels of                         other ministries and agencies contribute a large part of
    government is challenging.                                                      public environmental expenditure. Recent government
                                                                                    efforts to track this spending are a step forward to better
                                                                                    understand whether public resources are efficiently
    Figure 4: Many municipalities have established
                                                                                    allocated.
              an environmental institution
                                                                                    Environmental funds are a crucial source of finance
                                                                                    for many environmental programmes. Major examples
            Any environmental institution                                           include the National Climate Change Fund and the
     2004                                                            71%            Amazon Fund. Part of oil and gas revenue is used
     2007                                                                  85%      to finance environmental and climate mitigation
     2013                                                                     90%
                                                                                    programmes. Earmarking resources for environmental
            Municipal environmental council
     2004                      37%                                                  purposes may be necessary to secure reliable, sufficient
     2007                                               56%                         financing, but can reduce the flexibility and efficiency
     2013                                                         68%
                                                                                    of revenue allocation. Some funds have overlapping
          Active municipal environmental council
                                                                                    objectives, and they could be more closely monitored.
     2004              27%
     2007                        40%
     2013                               52%
                                                                                    legislation and enforcement
          Institution with exclusive environmental competencies
     2004 7%
     2007            20%
                                                                                    Brazil has developed a stringent and advanced
     2013                 27%                                                       environmental legislation framework at the national
    Source: IBGE (2013; 2009; 2004), Perfil dos municípios brasileiros.             level and in most states. Recent legislation has better

6
Highlights
The Amazon Fund was established in 2008
to invest in deforestation prevention and
forest conservation and sustainable use. It is
managed by the Brazilian Development Bank
in co-ordination with the MMA. Most of the
funds come from international donors, mainly
Norway and Germany. Between 2009 and
Photo by Moisés Silva Lima, Creative Commons Licence on Flickr
early 2015, the fund accumulated more than
USD 970 million and supported 72 projects.
At least 80% of the fund’s investment is
earmarked for the Brazilian Amazon region.
The fund also supports an international
project to expand the systematic
monitoring of forest coverage to the other
seven member countries of the Amazon
Cooperation Treaty Organization.
defined the environmental responsibilities of the
three levels of government. However, the stringency of
environmental requirements varies across jurisdictions,
creating risks of environmental dumping. The law is Next steps | governance
weakly enforced in many states and municipalities,
partly because of an insufficient number of inspectors.
Fines are rarely collected and environmental liability is
zz Rationalise the multitude of co-ordination bodies
sporadically applied.
to improve policy coherence.
Environmental licensing and impact assessment have
been subject to broad criticism. Weak technical capacity, zz Streamline environmental funds and monitor
especially at subnational level, inadequate project them for transparency and efficiency.
planning and occasional interference of local interests
zz Strengthen implementation and enforcement
hinder the timeliness, effectiveness and transparency
capacity at subnational level.
of these instruments. Furthermore, they do not give
sufficient consideration to potential environmental impact zz Develop a uniform system for collecting and
and to mitigation and compensation measures. There is managing environmental data, including on
no requirement for strategic environmental assessment of environmental law implementation and economic
territorial plans and other development programmes. aspects of environmental policies.
Public participation is an eminent feature of Brazil’s
zz Require strategic environmental assessment of
environmental governance. Non-government
territorial plans and development programmes.
organisations participate in several multistakeholder
decision-making bodies such as protected areas zz Clarify the environmental licensing procedures
management committees. Public consultation is a and build administrative capacity.
mandatory part of environmental licensing. Citizens
have a guaranteed access to environmental information zz Strengthen the capacity of environmental
and justice. However, despite some progress, information inspectors at all levels of government and engage
on both the state of the environment and policy local communities in compliance monitoring.
implementation remains fragmented.
7
OECD Environmental performance Review of brazil

    Case studies

    bolsa floresta
    The state of Amazonas launched
    Bolsa Floresta in 2007. This pioneering
    conditional cash-transfer programme
    compensates traditional and rural families
    for their efforts in conserving the forest
    areas they live in. It provides income
    to more than 35 000 people scattered
    across hundreds of communities and has
    helped improve their health and education
    outcomes. Deforestation has decreased                          AMAZONAS
    faster in areas participating in the
    programme than in the others. Following
    this example, in 2011 the federal
    government launched Bolsa Verde as part
    of its large anti-poverty programme Brasil
    sem Miséria.

    PROMOTING NON-TIMBER
    PRODUCTS
    Forest extraction is not limited to                                                                    São
    timber: rubber, seeds, fibres, fruits,
    essential oils and others generated                                                           Paraná
                                                      the soya moratorium
    BRL 936 million in 2011. However,
    the extraction of non‑timber products             In 2006, following pressures from
    is limited by insufficient demand and             NGOs and consumers, a group of large
    a mismatch between production and                 companies decided to stop buying
    commercialisation. The 2009 National              soya grown on cleared forestland in the
    Plan to Promote the Production Chain              Brazilian Amazon. This put pressure
    of Socio-Biodiversity Products aims               on commodity traders to follow their
    to strengthen the extraction and sale             lead. In all, 47 companies joined the
    of 30 traditional non-timber products             moratorium, with support from eight civil
    from sustainably managed forests,                 society organisations. The rate of soya
    providing income to traditional and rural         field expansion through deforestation
    communities. It facilitates access to             in the Amazon biome fell from 30%
    credit and markets, provides technical            in 2004 to about 1% in 2014. Land
    assistance and includes a minimum price           conversion into soya fields continues
    policy for selected socio-biodiversity            in the Cerrado biome, where the
    products.                                         moratorium does not apply.

8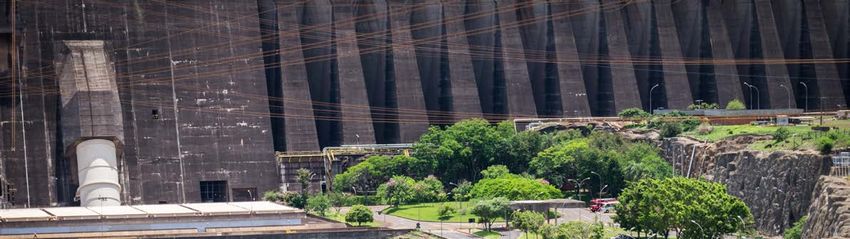
Case Studies

                                                                                                           Highlights
            deforestation monitoring by
            satellite
            Watching over 5 million km2 of Brazilian
            forests, with only one enforcement official
            for every 11 000 km2 in the Amazon,
            required some innovative thinking. The
            National Institute for Space Research
            (INPE) runs sophisticated systems to
            monitor the Amazon forest cover, based
            on satellite imaging. Among them,
            the Real Time Detection Programme,
            DETER, updates information on where
            violations have occurred every few
 Belém      days. Building on this, INPE is currently     GreenBlue municipality
            developing a system for detecting             programme
            deforestation and forest degradation          In 2007, São Paulo state’s Secretariat
            throughout the country. It also runs a        for the Environment launched the
            training centre on satellite rainforest       GreenBlue Municipality Programme
            monitoring in Belém.                          to improve the effectiveness of
                                                          environmental management at municipal
                                                          level. Municipalities can join by signing
                                                          a memorandum of common actions
                                                          and goals in 10 areas, including sewage
                                                          treatment, biodiversity, air quality and
                                                          environmental education. They receive
                                                          technical support and training. Every year,
                                                          the Secretariat evaluates municipalities’
                                                          performance and awards prizes. Best
                                                          performers get priority access to funding.

Paulo

                                                          ECOLOGICAL VALUE ADDED TAX
                                                          Part of the revenue from the state-level value
Curitiba                                                  added tax (called ICMS) is redistributed
                                                          to municipalities in each state. In the early
           bus rapid transit system                       1990s, the state of Paraná started to
           The city of Curitiba is home to the            redistribute a share of this revenue on the
           world’s first bus rapid transit system,        basis of environmental parameters such as
           with separate bus corridors, at-level          extension of protected areas and presence
           boarding, electronic ticketing and             of municipal waste collection services.
           high-capacity bi-articulated buses. The        The mechanism, known as Ecological
           Green Line, launched in 2009, runs             ICMS, aims to encourage municipalities to
           100% biodiesel buses. This integrated,         improve their environmental management.
           efficient system is operated by private        Today, most Brazilian states have the
           companies without subsidies. Combined          Ecological ICMS in place. This has helped
           with parking policies, the system has          increase the number and size of protected
           reduced automobile trips per year and          areas, although its impact on biodiversity
           ambient air pollution.                         conservation is not very clear.

                                                                                                   9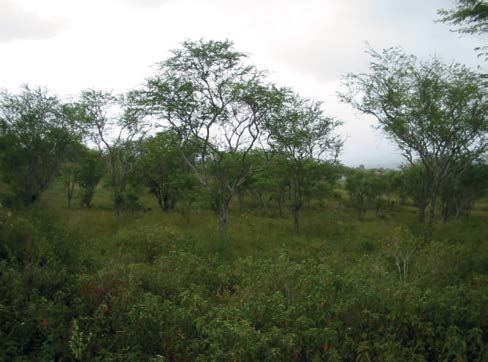
OECD Environmental performance Review of brazil

     Progress towards a green economy

     In recent years, some of Brazil’s economic and infrastructure development plans have started to include an
     environmental dimension. Nonetheless, the integration of environmental, social and economic objectives has
     been piecemeal. Brazil would gain from developing a coherent strategy for a green economy and sustainable
     development. This is all the more important now that the fast economic growth of the 2000s is over and Brazil
     needs to recover growth, while continuing to reduce poverty, inequality and environmental pressures.

     green taxes                                                                                       investment in low-carbon infrastructure

                                                                                                       Public infrastructure investment in environment‑related
     There is scope to extend the use of green taxes and remove
                                                                                                       sectors increased with the 2007 and 2011 Growth
     harmful tax exemptions as part of a comprehensive tax
                                                                                                       Acceleration Programmes. Yet coverage and quality of
     reform. Revenue from environmentally related taxes is
                                                                                                       infrastructure need to be further expanded and improved,
     low (0.7% of GDP in 2013). Most revenue stems from taxes
                                                                                                       particularly for wastewater treatment, sanitary landfills
     on vehicle ownership, but tax rates are not linked to the
                                                                                                       and public transport. Inadequate pricing of water and
     environmental performance of vehicles.
                                                                                                       waste services, red tape and weaknesses in project planning
     Fossil fuel use is taxed at lower levels than in many other
                                                                                                       delay infrastructure delivery and discourage private-sector
     countries. In 2015, the government raised the federal fuel tax
                                                                                                       engagement.
     (CIDE) on petrol and diesel, which had been zero since 2012.
                                                                                                       The Brazilian Development Bank (BNDES) stepped up its
     However, the CIDE rates remain unlinked to CO2 emissions
                                                                                                       environment-related activities to 15% of total lending in 2014
     caused by fuel use. Consumption of fuels in agriculture and
                                                                                                       (Figure 6). BNDES financing for wind energy projects has been
     manufacturing remains largely untaxed, which discourages
                                                                                                       conditional on the use of locally produced materials. This has
     energy savings. Diesel is taxed at a lower rate than petrol
                                                                                                       supported the emergence of a wind power industry in Brazil,
     despite its higher carbon content and emissions of local air
                                                                                                       although this form of industrial protection could harm the
     pollutants (Figure 5).
                                                                                                       sector’s competitiveness in the long run.
     Water abstraction and pollution charges are enforced only
     in a few states. Prices are too low to influence decisions                                        Brazil was the world’s seventh largest investor in renewable
     on water allocation and use. There are no other charges on                                        energy in 2014, mainly in large hydropower plants and
     natural resource use and pollution.                                                               wind. It has long encouraged ethanol production to power
                                                                                                       road vehicles. The majority of passenger cars are flex-fuel
                                                                                                       (which can run on both petrol and ethanol) and 17% of road
                                                                                                       transport fuels are biofuels, by far the world’s highest share.
     Figure 5: Taxes on CO2 emissions from diesel and
                                                                                                       The ethanol industry has recently suffered from declining
               petrol use are low
                                                                                                       competitiveness, however, which is partly due to the low
     	Tax rates on road fuels on a CO2 emission basis,
                                                                                                       taxation and price of petrol.
               2012 (2015 for Brazil), G20 countries.

     Tax rate EUR t/CO2              Petrol           Diesel
      400     Turkey
                                  United
      350                Italy   Kingdom
                                       Germany
      300                                     France
      250                                                      Japan Korea
                                                                                 Argentina
      200
                                                                                             South
                                                                                             Africa Australia
      150
                                                                                                                            People's
                                                                                                                           Republic of
      100                                                                                                         India     China
                                                                                                                                         Canada Brazil United
       50                                                                                                                                              States Mexico
                                                                                                                                                                                      Indonesia
                                                                                                                                                                           Russia
         0
     Notes: Saudi Arabia not available. Figures for Canada, India and United States include only federal taxes. Tax rates converted using standard carbon emission factors from the
     Intergovernmental Panel on Climate Change and energy conversion factors from the IEA.
     Source: adapted from OECD (2015), Taxing Energy Use 2015: OECD and Selected Partner Economies.

10
Photo by Deni Williams, Creative Commons licence on Flickr
Highlights
Brazil’s large energy efficiency potential remains untapped. The International Energy Agency estimates that Brazil could
have 11% off its projected energy consumption in 2035 if it puts in place measures such as building codes, energy
management in industry and vehicle fuel economy standards. This equals the 2012 electricity production of the massive
Itaipu hydropower plant.
eco-innovation and green markets reorienting agricultural support
Brazil is more specialised in green technologies than other Brazil has a highly productive and competitive
BRIICS economies and its eco-innovation performance agricultural sector, which accounts for 5.7% of GDP
is improving. About 9% of all patents filed in Brazil and about 15% of employment. Subsidies to farmers
were environment-related in 2009-11, compared to the are low compared to OECD and other BRIICS
BRIICS average of 7.8%. Brazil spends about 3% of its total
countries, but tend to stimulate production and input
research and development expenditure on environment-
use, with potential risks of increasing pressures on
related innovation. It shows pockets of excellence in
water, soil and forest areas.
agro‑technology, biofuels and hydro energy.
The environmental technology, goods and service sector In addition, fertilisers and pesticides benefit from
could become a significant source of growth for Brazil some tax exemptions, which have contributed to their
(1% to 7% of GDP). However, Brazil’s leading companies growing use. Organic farming accounts for less than
invest only 1% of turnover in clean technology, and small 1% of the agricultural land area. Support schemes
and medium-sized enterprises invest even less. Various
such as the Low-Carbon Agriculture Programme aim
barriers to the invention and adoption of clean technology
to encourage environmental improvement and efficient
persist, including weak science-industry linkages, skill gaps,
use of inputs. However, these efforts remain small.
regulatory obstacles, a complex incentive system, and high
patenting costs and import duties.
Figure 6: BNDES environment-related investment targets mostly renewables
2014 investments in BRL billion
Large hydro Other renewables Public transport Cargo transport Water Forests Waste Adaptation Other
7.24 7.84 5.34 3.64 1.50 1.16 0.61 0.43 0.24
Source: BNDES.
Next steps | towards a green economy
zz Reform environmental taxation, in the framework of a zz Continue to scale up investment in rail infrastructure
broad fiscal reform. This means: adjusting energy taxes and urban public transport.
to reflect fuels’ carbon content and pollutant emissions; zz Extend the use of charges for water, sanitation and
introducing taxes on pollution, waste and resource waste services to improve their financial viability and
use; and aligning vehicle taxation to environmental encourage efficient resource use; utilise social transfers
performance. to compensate low-income households.
zz Facilitate infrastructure delivery through simpler zz Stimulate environmental technology with awareness
administrative procedures, local capacity development campaigns, better access to finance and green
and inter-municipal collaboration. procurement.
11In-depth | biodiversity
A megadiverse country, Brazil hosts the largest rainforest in the world and one-tenth of all known species of
flora and fauna. Its territory spans over six terrestrial biomes and its extensive coastline is home to various
marine ecosystems. Infrastructure development, agriculture, population growth and urbanisation remain the
main pressures on biodiversity. Brazil should build on its impressive progress in reducing deforestation to
further improve the status of biodiversity and enhance its sustainable use. This will require sustained financial
and human resources and effective inter-institutional co-ordination.
ecosystems and species an effective strategy against deforestation
With the second largest forest area in the world, Brazil
experiences the world’s highest average annual loss in total The Action Plan to Combat Deforestation in Amazônia Legal
forest cover. Annual deforestation of the Amazon massively (PPCDAm), launched in 2004, involves 13 ministries under
declined, from 27 000 km2 in 2004 to about 4 800 km2 the co-ordination of the Executive Office of the Presidency
in 2014, thanks to a coherent set of actions (Figure 7). (Casa Civil). The programme is based on three main streams
However, an area of forest equal to the size of Slovenia of work:
(or the Brazilian state of Sergipe) is still lost every four
zz Strengthening monitoring and enforcement
years. The tropical savannah (Cerrado) is also under strong
with satellite monitoring systems (page 9), targeted
pressure. Overall, total forest area has decreased by about
inspections, heavy fines and restricted access to credit
5% since 2000 and by 10% since 1990.
for landholders in municipalities with critical deforestation
Brazil hosts rich coral reef ecosystems and the world’s levels.
largest contiguous area of mangroves. Its marine waters
zz Clarifying land tenure to fight land grabbing:
are home to a vast range of fish, mammals and turtle
thousands of rural land holdings have been granted
species. Deforestation of riparian forests and mangroves,
property titles, and hundreds of protected areas have
urban development along the coasts, oil and gas
been established under the ARPA programme (page 15).
development and water pollution are among the major
pressures on marine and coastal ecosystems. Several zz Promoting sustainable logging and production
marine and freshwater fish stocks are fully exploited or chains: actions taken include capacity building for
overexploited as a result of overfishing. sustainable forestry, agriculture and livestock practices,
sustainable timber logging concessions and minimum
Over 45% of plant species and nearly 10% of fauna
guaranteed prices for Amazonian food products. Brazil
species are threatened. In 2012, about half of threatened
needs to strengthen this pillar to make sustainable
fauna species were protected under a conservation action
livelihood options in forest areas more attractive than
plan, and federal protected areas now cover nearly 60%
illegal land clearing.
of threatened flora and fauna species. This has helped
improve the conservation status of more than 100 species. The PPCDAm is widely recognised as an effective strategy,
which can serve as a model for other countries. Building on
this success, the government launched a similar programme
to control deforestation and forest fires in the Cerrado biome.
12conservation and sustainable use of biodiversity
Highlights
Figure 7: Policy measures have effectively helped curb deforestation
Annual deforestation in Amazônia legal, 2000-14. The Amazônia Legal encompasses the
Amazonian forest (about 4.1 million km2) and transitional vegetation (1 million km2).
30000
Source: INPE (2015), “Projeto PRODES: Monitoramento da floresta Amazônia Brasileira
2000000
protected areas deforestation
deforestation in Amazônia Legal
in km2 (right axis) in km2 per year
por satélite”; MMA (2015), Cadastro Nacional de Unidades de Conservaçao.
25 000
1 500 000
20 000
1 000 000 15 000
protected areas in other biomes
10 000
500 000
5 000
protected areas in the Amazon
0 0
2000 2001 2002 2003 2004 2005 2006 2007 2008 2009 2010 2011 2012 2013 2014
ARPA PPCDAm ∙ Rural credit New Forest Code
Programme restrictions
and embargo
∙ Amazon Fund
policy framework While a regulatory approach still prevails, Brazil is
progressively using payments for ecosystem services
The legal framework for biodiversity is comprehensive (PES) and other conditional monetary transfers (such as
and stringent. Key laws include the 2000 law establishing Bolsa Floresta, page 8). These programmes compensate
the system of protected areas (page 15), the 2012 Forest households and communities for their efforts in reducing
Code (page 14) and the 2015 legislation on access to genetic the environmental impact of their activities. However,
resources and benefit sharing. state PES regulations are highly heterogeneous; many
such programmes are not systematically monitored and
Brazil adopted 20 biodiversity targets to 2020 that are
their environmental effectiveness is not clear. A federal
aligned with its international commitments. Some states,
framework law on PES would improve consistency and
including São Paulo, Paraná and Rio Grande do Sul, have
effectiveness.
developed biodiversity strategies and plans, but ensuring
consistency and harnessing synergies with federal Scientific knowledge on biodiversity has improved
biodiversity policies is challenging. Overall, there has been a remarkably, but information is fragmented and not always
proliferation of biodiversity-related plans and programmes consistent. Economic evaluation of biodiversity is rarely
since 2000, often with overlapping objectives, and their used to inform policy decisions. The Brazilian Natural
implementation is not systematically monitored. Sectoral Capital Initiative, launched in 2013, aims to fill this gap.
policies, such as energy and agriculture, could take better It identifies the economic benefits of biodiversity and the
account of biodiversity goals. costs of its loss, and promotes their consideration in policy
making at all levels of governments.
Next steps | biodiversity
zz Streamline the multitude of biodiversity-related plans and zz Scale up support for sustainable forestry and farming
programmes; evaluate and revise them systematically. practices and speed up the use of concessions for
sustainable forest management.
zz Keep the focus on fighting deforestation, including
outside the Amazon; continue to develop forest zz Develop a framework law for PES and monitor the
monitoring technology. effectiveness of existing PES programmes.
13OECD Environmental performance Review of brazil
Quick focus | the Forest Code
In 2012, Brazil approved its new Forest Code to replace the 1965 code. The key legal instrument for forest
protection on private lands, the new code aims to overcome the implementation shortcomings of the
previous one, which had resulted in widespread violations and large illegally deforested areas. Ultimately,
the new code aspires to reconcile the objectives of biodiversity conservation and economic development,
notably in agriculture.
The Forest Code requires rural landholders to set MARINE A
aside a share of their land for forest conservation 1.5%
and restoration (so-called Legal Reserve), as well as
along water bodies and sensitive areas to protect water
resources and prevent soil erosions (so-called Permanent
Preservation Area). This share varies according to the AMAZON
biome: up to 80% in the Amazon, 20% to 35% in the 27%
Cerrado and 20% in the other biomes. The new
code introduced two innovative instruments: AMAZON
the Rural Environmental Cadastre and the 27%
Environmental Reserve Quotas.
The Rural Environmental Cadastre aims to improve
monitoring and compliance. It uses high-resolution
satellite images to localise each rural parcel. Landholders CERRADO
must register their lands and set-aside areas in the 8%
cadastre by May 2016. Registration will be a condition PANTANAL
for accessing rural credits as of October 2017. As of April 5%
2015, 53% of the target area had been registered. States
are responsible for implementation of the cadastre and
ensuring compliance with the set-aside requirements,
but their capacity is often limited.
Environmental Reserve Quotas are tradable forest Figure 8: Protected areas vary by biome ATLANTIC
rights. Landholders who did not meet their set-aside Share of protected areas by biome, 2015 FOREST
Source: MMA (2015), Cadastro Nacional de Unidades de
obligations (prior to 2008) can either restore the tree 9%
Conservação.
cover or purchase an equivalent quota amount. Quotas
are issued for areas maintained as native forests and PAMPA
woodlands in excess of the Legal Reserve requirements. 3%
Offsetting is possible only within the same biome and,
possibly, the same state. This system creates demand Next steps | Forest Code
for forested lands and encourages forest conservation.
As forest restoration is costly, especially for small rural zz Enhance the capacity of states and municipalities to
holders, the quota system could be a cost-effective way implement the Rural Environmental Cadastre.
to make sure that landholders comply.
zz Provide economic incentives for land registration
The National Plan for Native Vegetation Recovery aims in the cadastre, compliance with the code, and
to promote large-scale reforestation of 125 000 km2 sustainable management and restoration of
within 20 years. The programme, currently under public set‑aside areas.
consultation, will require significant financial resources zz Accelerate the development of the proposed
and innovative financing instruments (for example, National Plan for Native Vegetation Recovery,
bonds to raise funds for restoration investments). estimate its costs and identify funding sources.
14quick focus
Quick focus | Protected areas
Protected areas are a cornerstone of Brazil’s biodiversity policy. The number and extent of protected
areas have more than doubled since 2000, when the National System of Protected Areas was established.
The Chico Mendes Institute for Biodiversity Conservation (ICMBio), the national agency responsible for
overseeing federal protected areas, faces obstacles to effectively manage protected areas and unleash their
economic potential.
AREAS Protected areas cover more than 17% of Brazil’s
% terrestrial areas and inland waters but only 1.5% of the arpa programme
coastal and marine areas. Most protected areas are
located in the Amazon, reflecting government efforts to
The Amazon Region Protected Areas (ARPA) programme
fight deforestation in this region. Additional areas
is among the world’s largest tropical forest conservation
are protected within indigenous lands and on
programmes. Since 2003, it has created more than
private lands that comply with the Forest
500 000 km2 of protected areas in the Amazon, including
Code. Altogether, this makes Brazil’s nature
along the so-called “deforestation arc” (comprising the
protection system one of the world’s largest.
eastern and southern edges of the forests in the states of
CAATINGA Rondônia, Mato Grosso and Pará) and in areas expecting
Weak management risks hampering
8% road infrastructure development.
the effective conservation and sustainable
development of protected areas. Many areas This has greatly helped curb deforestation: only about
still operates without the required management 5% of the deforestation that took place in the Amazon
plans and most of them are understaffed. Park in 2008‑12 was within protected areas. The programme
managers are highly committed but often lack the has also improved the management effectiveness of
necessary training and financial resources. participating protected areas, with investment in basic
infrastructure and staff training. Funding has largely come
Funding depends heavily on public budgets and from international partners, but the Brazilian government is
donations, which make it vulnerable to external factors committed to gradually increasing funding from the federal
and political negotiations. The budget of ICMBio grew and state budgets.
by 57% between 2008 and 2014. While significant,
this increase is not proportional to the expansion of
protected areas. Resources are largely used to cover staff
and other operational costs, while investment in much
needed equipment and infrastructure is modest.
Next steps | protected areas
Extending tourism, recreation and environmental
education in protected areas would help generate zz Further expand protected areas to meet the national
environmental, social and economic benefits. The targets of protecting 30% of the Amazon, 17% of the
number of visits has steadily increased since the mid- other terrestrial biomes and 10% of marine areas by
2000s, but they only concentrate on a few large national 2020.
parks. Less than 20% of protected areas generate
zz Ensure that all protected areas develop management
revenue from access fees and tourism activities. Few
plans and step up capacity building efforts.
protected areas have engaged in partnerships with
private businesses and non-profit organisations to zz Develop a financial strategy for the protected area
manage tourism and recreational services. This is system and explore funding sources that would
mainly due to regulatory constraints and red tape, reduce the dependence on the public budget and on
the lack of adequate management plans, and limited international finance.
resources and capacity. zz Scale up tourism, recreation and environmental
education activities in protected areas with more
involvement of the private sector.
15more information OECD Environmental Performance Reviews: Brazil 2015 The report and all data are available online www.oecd.org/environment/country-reviews or http://doi.org/10/8bn Environmental Performance Review programme www.oecd.org/environment/country-reviews contacts Head of the Environmental Performance and Information division Nathalie Girouard Nathalie.Girouard@oecd.org EPR of Brazil co-ordinator Ivana Capozza Ivana.Capozza@oecd.org Communications Clara Tomasini Clara.Tomasini@oecd.org image credits Cover iStockphoto/filipefrazao and /Alatom. pp.2-3: iStockphoto/LauraCapanema pp.4-5: Icons from TheNounProject.com: Jens Tarning, Krisada, Waleed Al Alami, Lloyd Humphreys, Shrihari Sankaran, Evan Udelsman, James Keuning. pp.6-7: photos by Jorge Sanz and Moisés Silva Lima, Flickr under a Creative Commons licence. Icon by Katrine Kölstrom. pp.8-9: iStockPhoto/Ziviani, filipefrazao, bennyartist, SergioZacchi, ah_fotobox, rodri_martins and courtesy of MMA. pp.10-11: photo by Deni Williams, Flickr under a Creative Commons licence. Icons by Krisada, Jon Testa, Co-Effect Creative, Waleed Al-Alami, Aiga Collection, Shrihari Sankaran. pp. 12-13: Moisés Silva Lima (Flickr CC), iStockPhoto/DirkFreder and /ginosphotos, Ivana Capozza. Icons by James Keuning. pp. 14-15: Allan Patrick and Deyvid Setti (Wikimedia Commons -CC). Eduardo Avorim (CC), iStock/LauraCapanema, map by IBGE. This document and any map included herein are without prejudice to the status of or sovereignty over any territory, to the delimitation of international frontiers and boundaries and to the name of any territory, city or area. www.oecd.org/environment/country-reviews
You can also read