2.0 COMMUNITY PROFILE
 & ASSET INVENTORY
←
→
Page content transcription
If your browser does not render page correctly, please read the page content below
2.0 COMMUNITY PROFILE & ASSET INVENTORY
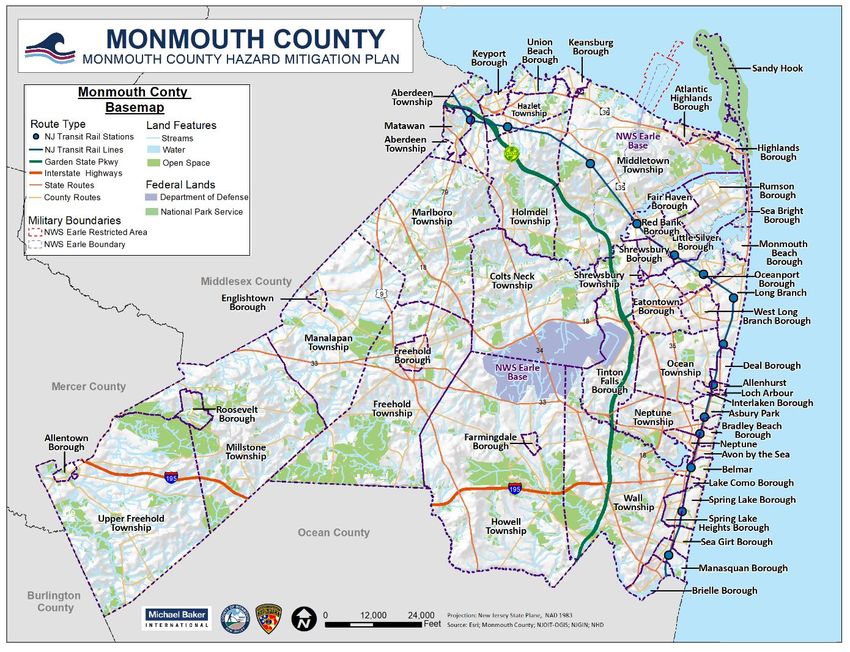
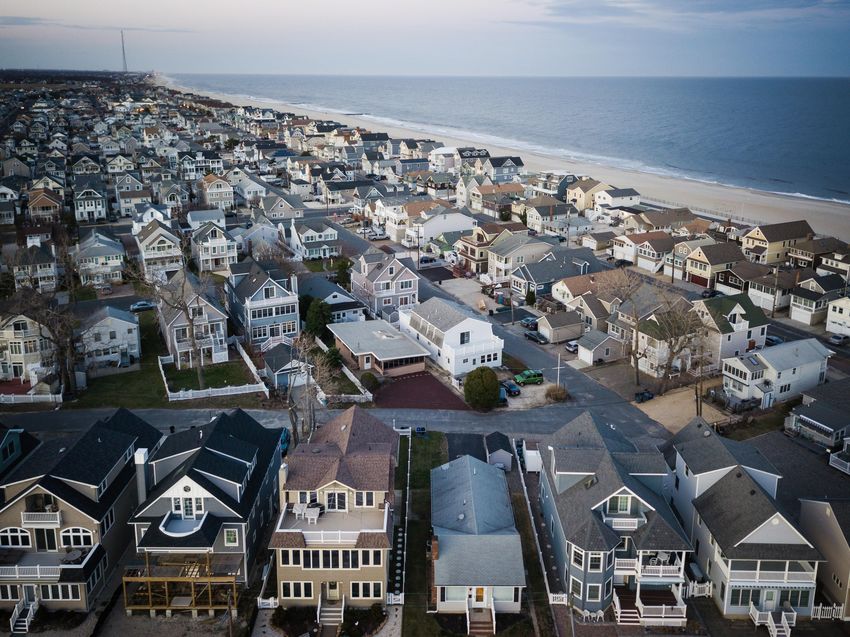
2.0 COMMUNITY PROFILE & ASSET INVENTORY
2.1 GEOGRAPHY
Monmouth County is located in eastern-central New Jersey and is part of the New York Metropolitan
region. It is the northernmost of New Jersey's shore counties and is bounded by Middlesex, Mercer,
Burlington, and Ocean Counties. Eastern sections of the county's northern limits are bounded by Raritan
Bay and Sandy Hook Bay, while the east coast of the County lies on the Atlantic Ocean. The County is
approximately 15 miles from New York City and 30 miles from Philadelphia. Monmouth County is home
to 53 municipalities, each with its own distinct character (two cities, 35 boroughs, 15 townships, and one
village) and size (0.1 square miles to 62.1 square miles). The 53 municipalities include the following:

Aberdeen, Township of                 Highlands, Borough of                 Neptune City, Borough of
Allenhurst, Borough of                Holmdel, Township of                  Ocean, Township of
Allentown, Borough of                 Howell, Township of                   Oceanport, Borough of
Asbury Park, City of                  Interlaken, Borough of                Red Bank, Borough of
Atlantic Highlands, Borough of        Keansburg, Borough of                 Roosevelt, Borough of
Avon-by-the-Sea, Borough of           Keyport, Borough of                   Rumson, Borough of
Belmar, Borough of                    Lake Como, Borough of                 Sea Bright, Borough of
Bradley Beach, Borough of             Little Silver, Borough of             Sea Girt, Borough of
Brielle, Borough of                   Loch Arbour, Village of               Shrewsbury, Borough of
Colts Neck, Township of               Long Branch, City of                  Shrewsbury, Township of
Deal, Borough of                      Manalapan, Township of                Spring Lake, Borough of
Eatontown, Borough of                 Manasquan, Borough of                 Spring Lake Heights, Borough of
Englishtown, Borough of               Marlboro, Township of                 Tinton Falls, Borough of
Fair Haven, Borough of                Matawan, Borough of                   Union Beach, Borough of
Farmingdale, Borough of               Middletown, Township of               Upper Freehold, Township of
Freehold, Borough of                  Millstone, Township of                Wall, Township of
Freehold, Township of                 Monmouth Beach, Borough of            West Long Branch, Borough of
Hazlet, Township of                   Neptune, Township of

All 53 municipalities participated in the Monmouth County HMP and are mapped in Figure 2.1-1
Monmouth County Base Map.

Monmouth County has a total area of 665 square miles, of which 472 square miles is land and 193 square
miles is water. It is New Jersey's sixth largest county in terms of land area. In 2010, the County population
was 630,380 with approximately 1,330 people per square mile, making it the fifth most populous county
in the State. A majority of the County population lives within five miles of either the Raritan Bay shoreline
or Atlantic Ocean coastline. Monmouth County has a wide variety of natural resources and landscapes
including slopes, bayfront and oceanfront beaches, rivers, lakes, streams, forests, and farmlands. Much
of the County is flat and low-lying however high lands and cliffs dominate the Bayshore while shorelines
and rivers characterize Central and South Monmouth, and rolling hills and farmland characterizes
Western Monmouth. Crawford Hill, in Holmdel Township, is the tallest point in the County at
approximately 380 feet above sea level.

Although the land use patterns are diverse, residential development is the predominant use. County
residents have access to major employment, culture and entertainment, and transportation centers by
public transportation and a superior highway network. In addition, the County features an abundance of
top-rate parks, golf courses, open space, and educational facilities. Over the past four decades,
Monmouth County has become increasingly more suburbanized as growth increased dramatically,
making this county one of the fastest growing regions in the State. Much of this growth is attributable to
net in-migration. People are drawn to the exceptional quality of life in Monmouth County. As noted in the
Monmouth County Open Space Plan (2006), pressure to develop and redevelop land in Monmouth
County remains strong thus presenting challenges to maintaining quality of life for present and future
generations. A growing population, competition for diminishing land resources, escalating property
values, and increasing public demand for control of growth and provision of recreation services point
toward the importance of preserving open space. Monmouth County contains over 49,000 acres of
protected public open space consisting of 16,570 acres of municipal open space, 17,300 acres of
Monmouth County Park System open space, 17,033 acres of State open space, and 2,044 acres of
Federal open space. The County contains an additional 15,387 acres of preserved farmland (Monmouth
County Profile, 2019). Undeveloped land is predominantly in the western portions of the County where
agriculture is still the primary land use.

                Monmouth County Base Map

      NATURAL FEATURES
Geology
Monmouth County is entirely part of the Coastal Plain region of New Jersey and is split between two
types of underlying rock. According to the New Jersey Geologic Survey, the first type of underlying rock
is from the end of the Cenozoic age which encompasses most of the southern half of the County and
most of the Atlantic shoreline; this rock is comprised of sand, silt, and clay soils. The second type of
underlying rock is from the middle of the Mesozoic age which encompasses northern and western
portions of the County and the bay shoreline; this type of rock is comprised of siltstone, shale,
sandstones, and conglomerate. The sediments found in Monmouth County, particularly those found in
the southern coastal half of the County, are susceptible to erosion and erode easily under waves or tides
(Stockton University Coastal Research Center).

Watersheds
Monmouth County falls into six watershed management areas (WMA), with most of the County falling
into the Monmouth WMA. The other five include Lower Raritan, South River, and Lawrence WMA,
Millstone WMA, Central Delaware WMA, Barnegat Bay WMA, and Assiscunk, Crosswicks, and Doctors
WMA, as mapped in Figure 2.1-2 New Jersey Watersheds. Along with being a coastal county, there are
several major rivers including the Shrewsbury River, which flows into Sandy Hook Bay, Manasquan River,
Swimming River, Shark River, and Navesink River.

                New Jersey Watersheds (NJDEP)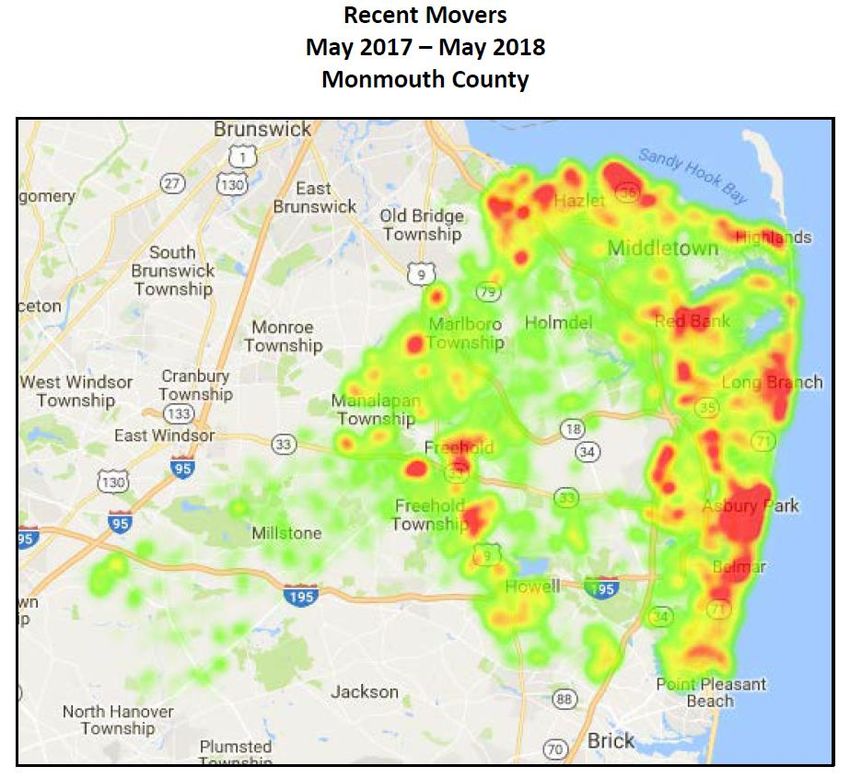
DEMOGRAPHICS
Changes in Population
The last version of the Monmouth County HMP reported Census 2010 data of a 630,380 countywide
population. As the 2020 Census data is not yet available, the 2017 American Community Survey (ACS)
5-year estimates are available. The ACS does not give an exact representation, but it does provide a
picture of changes in the population between census years. The 2017 ACS 5-year estimates that the
population of Monmouth County was 627,551 persons, consisting of 232,482 households. Table 2.1 - 1
Population and Households by Jurisdiction shows population and household counts by jurisdiction.
While the 5-year estimate indicates a decline in population, the margin of error for the County is about
3,000 persons, which may mean that population growth was flat. The table also shows the largest
jurisdiction as percent of the County total. Middletown Township is the largest municipality with an
estimated population of 65,952 persons which is 10.5 percent of the population. Middletown continues
to be the largest municipality in the County. The average household size is 2.7 persons.

Table 2.1 - 1 Population and Households by Jurisdiction (2017 American Community Survey 5-Year)
                                    Population (2017 ACS 5-Year)      Households (2017 ACS 5-Year)
             Jurisdiction
                                                    % of County
                                       Count                           Count            % of County Total
                                                       Total
 Aberdeen, Township of                     18,372          2.93%                6,860               2.95%
 Allenhurst, Borough of                       506          0.08%                  203               0.09%
 Allentown, Borough of                      1,890          0.30%                  702               0.30%
 Asbury Park, City of                      15,830          2.52%                6,656               2.86%
 Atlantic Highlands, Borough of             4,322          0.69%                1,735               0.75%
 Avon-by-the-Sea, Borough of                1,814          0.29%                  911               0.39%
 Belmar, Borough of                         5,719          0.91%                2,637               1.13%
 Bradley Beach, Borough of                  4,262          0.68%                2,169               0.93%
 Brielle, Borough of                        4,738          0.75%                1,786               0.77%
 Colts Neck, Township of                   10,018          1.60%                3,267               1.41%
 Deal, Borough of                             579          0.09%                  263               0.11%
 Eatontown, Borough of                     12,258          1.95%                5,285               2.27%
 Englishtown, Borough of                    2,131          0.34%                  755               0.32%
 Fair Haven, Borough of                     6,015          0.96%                1,889               0.81%
 Farmingdale, Borough of                    1,470          0.23%                  577               0.25%
 Freehold, Borough of                      11,938          1.90%                3,897               1.68%
 Freehold, Township of                     35,429          5.65%               12,525               5.39%
 Hazlet, Township of                       20,082          3.20%                6,961               2.99%
 Highlands, Borough of                      4,880          0.78%                2,712               1.17%
 Holmdel, Township of                      16,648          2.65%                5,671               2.44%
 Howell, Township of                       52,076          8.30%               17,660               7.60%
 Interlaken, Borough of                       825          0.13%                  359               0.15%
 Keansburg, Borough of                      9,868          1.57%                4,052               1.74%
 Keyport, Borough of                        7,138          1.14%                2,984               1.28%
 Lake Como, Borough of                      1,518          0.24%                  690               0.30%
 Little Silver, Borough of                  5,917          0.94%                2,103               0.90%
 Loch Arbour, Village of                      195          0.03%                   84               0.04%
 Long Branch, City of                      30,751          4.90%               11,921               5.13%
 Manalapan, Township of                    40,096          6.39%               13,793               5.93%
 Manasquan, Borough of                      5,824          0.93%                2,267               0.98%
 Marlboro, Township of                     40,466          6.45%               12,812               5.51%
 Matawan, Borough of                        8,898          1.42%                3,361               1.45%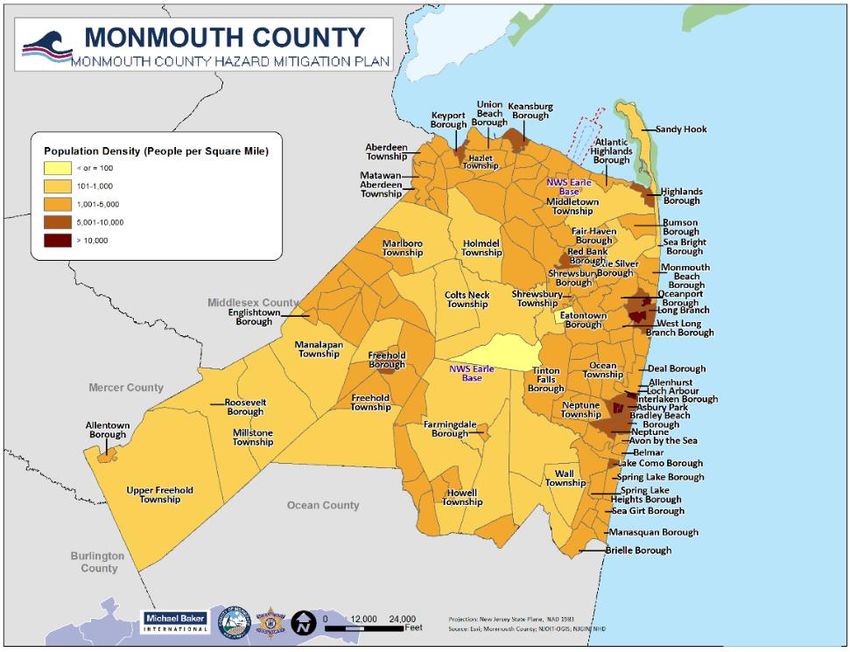
Population (2017 ACS 5-Year)       Households (2017 ACS 5-Year)
             Jurisdiction
                                                      % of County
                                         Count                            Count          % of County Total
                                                         Total
 Middletown, Township of                    65,952          10.51%             23,456              10.09%
 Millstone, Township of                     10,522           1.68%              3,288               1.41%
 Monmouth Beach, Borough of                  3,247           0.52%              1,421               0.61%
 Neptune City, Borough of                   27,728           4.42%             10,946               4.71%
 Neptune, Township of                        4,749           0.76%              2,072               0.89%
 Ocean, Township of                         27,006           4.30%             10,675               4.59%
 Oceanport, Borough of                       5,762           0.92%              2,132               0.92%
 Red Bank, Borough of                       12,220           1.95%              5,108               2.20%
 Roosevelt, Borough of                         808           0.13%                279               0.12%
 Rumson, Borough of                          6,874           1.10%              2,224               0.96%
 Sea Bright, Borough of                      1,304           0.21%                715               0.31%
 Sea Girt, Borough of                        1,714           0.27%                780               0.34%
 Shrewsbury, Borough of                      4,051           0.65%              1,450               0.62%
 Shrewsbury, Township of                     1,117           0.18%                499               0.21%
 Spring Lake, Borough of                     2,980           0.47%              1,241               0.53%
 Spring Lake Heights, Borough of             4,645           0.74%              2,259               0.97%
 Tinton Falls, Borough of                   17,902           2.85%              8,103               3.49%
 Union Beach, Borough of                     5,634           0.90%              1,881               0.81%
 Upper Freehold, Township of                 6,899           1.10%              2,438               1.05%
 Wall, Township of                          26,020           4.15%              9,514               4.09%
 West Long Branch, Borough of                7,944           1.27%              2,454               1.06%
 Total                                     627,551        100.00%             232,482             100.00%

As population increases, more residential and commercial buildings, infrastructure, public facilities, and
other assets will be constructed to support such growth, likely increasing a jurisdiction's overall exposure
to natural hazards. Therefore, population growth is considered a general indicator of potential future
hazard vulnerability. The County's greatest rate of population growth was observed between 1950 and
1970, following the post-war boom and the opening of the Garden State Parkway in 1954. In this window,
Monmouth County's population more than doubled from 225,337 in 1950 to 461,489 in 1970. Figure 2.1-
3 Monmouth County Population by age 1970-2010 illustrates population growth from 1970 to 2010 and
the change in age cohorts of the population over time.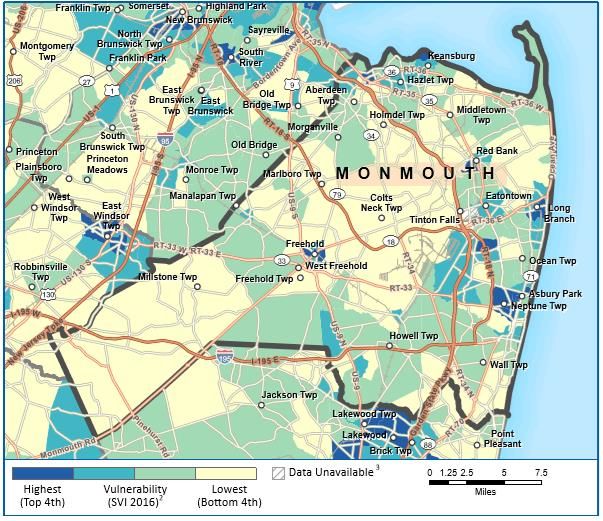
Monmouth County Population by Age 1970-2010

Figure 2.1 - 4 Monmouth County Population Density displays population density by jurisdiction. The
coastal areas around the Cities of Long Branch and Asbury Park have the highest population density.

               Monmouth County Population Density (ACS, 2017)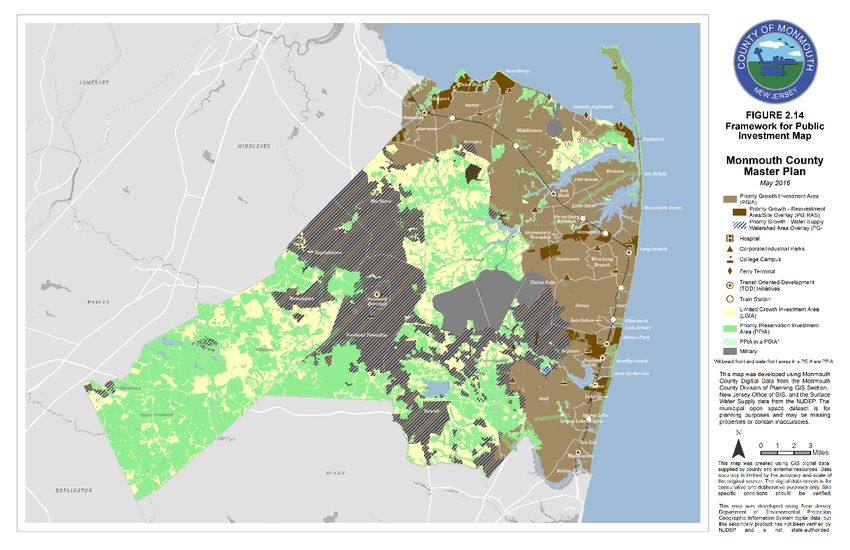
The 2015 Monmouth County HMP indicated an increase in population, however, using the 2014 ACS and
2017 ACS estimates, the population has remained flat with some jurisdiction’s populations increasing
but the majority declining. Overall between 2014 and 2017 the total population declined by about 0.34
percent and from 2010 and 2017 the population declined by about 0.45 percent. Table 2.1 - 2 Changes
in Population 2014-2017 & 2010-2017 depict these changes population.

Table 2.1 - 2      Changes in Population 2014-2017 & 2010-2017
                                       Population      Population      Population    Population     Population
                Jurisdiction          (2017 ACS 5-    (2014 ACS 5-      Change         (2010         Change
                                          Year)           Year)       (2014-2017)     Census)      (2010-2017)
                                         Count           Count         % Change        Count        % Change
 Aberdeen, Township of                      18,372          18,216           0.86%        18,210          0.89%
 Allenhurst, Borough of                         506             486          4.12%           496          2.02%
 Allentown, Borough of                       1,890           1,828           3.39%         1,828          3.39%
 Asbury Park, City of                       15,830          15,933          -0.65%        16,116         -1.77%
 Atlantic Highlands, Borough of              4,322           4,357          -0.80%         4,385         -1.44%
 Avon-by-the-Sea, Borough of                 1,814           1,810           0.22%         1,901         -4.58%
 Belmar, Borough of                          5,719           5,760          -0.71%         5,794         -1.29%
 Bradley Beach, Borough of                   4,262           4,290          -0.65%         4,298         -0.84%
 Brielle, Borough of                         4,738           4,772          -0.71%         4,774         -0.75%
 Colts Neck, Township of                    10,018          10,103          -0.84%        10,142         -1.22%
 Deal, Borough of                               579             769       -24.71%            750       -22.80%
 Eatontown, Borough of                      12,258          12,323          -0.53%        12,709         -3.55%
 Englishtown, Borough of                     2,131           2,101           1.43%         1,847        15.38%
 Fair Haven, Borough of                      6,015           6,093          -1.28%         6,121         -1.73%
 Farmingdale, Borough of                     1,470           1,396           5.30%         1,329        10.61%
 Freehold, Borough of                       11,938          12,018          -0.67%        12,052         -0.95%
 Freehold, Township of                      35,429          35,995          -1.57%        36,184         -2.09%
 Hazlet, Township of                        20,082          20,253          -0.84%        20,334         -1.24%
 Highlands, Borough of                       4,880           4,985          -2.11%         5,005         -2.50%
 Holmdel, Township of                       16,648          16,722          -0.44%        16,773         -0.75%
 Howell, Township of                        52,076          51,389           1.34%        51,075          1.96%
 Interlaken, Borough of                         825             826         -0.12%           820          0.61%
 Keansburg, Borough of                       9,868          10,011          -1.43%        10,105         -2.35%
 Keyport, Borough of                         7,138           7,213          -1.04%         7,240         -1.41%
 Lake Como, Borough of                       1,518           1,647          -7.83%         1,759       -13.70%
 Little Silver, Borough of                   5,917           5,920          -0.05%         5,950         -0.55%
 Loch Arbour, Village of                        195             198         -1.52%           194          0.52%
 Long Branch, City of                       30,751          30,590           0.53%        30,719          0.10%
 Manalapan, Township of                     40,096          39,543           1.40%        38,872          3.15%
 Manasquan, Borough of                       5,824           5,841          -0.29%         5,897         -1.24%
 Marlboro, Township of                      40,466          40,370           0.24%        40,191          0.68%
 Matawan, Borough of                         8,898           8,759           1.59%         8,810          1.00%
 Middletown, Township of                    65,952          66,290          -0.51%        66,522         -0.86%
 Millstone, Township of                     10,522          10,509           0.12%        10,566         -0.42%
 Monmouth Beach, Borough of                  3,247           3,278          -0.95%         3,279         -0.98%
 Neptune City, Borough of                   27,728          27,880          -0.55%        27,935         -0.74%
 Neptune, Township of                        4,749           4,849          -2.06%         4,869         -2.46%
 Ocean, Township of                         27,006          27,241          -0.86%        27,291         -1.04%
 Oceanport, Borough of                       5,762           5,834          -1.23%         5,832         -1.20%
 Red Bank, Borough of                       12,220          12,250          -0.24%        12,206          0.11%
 Roosevelt, Borough of                          808             744          8.60%           882         -8.39%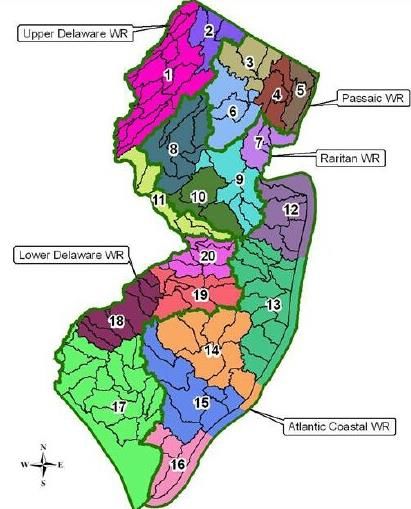
Population     Population     Population    Population     Population
            Jurisdiction            (2017 ACS 5-   (2014 ACS 5-     Change         (2010         Change
                                        Year)          Year)      (2014-2017)     Census)      (2010-2017)
                                       Count          Count        % Change        Count        % Change
 Rumson, Borough of                        6,874          7,045         -2.43%         7,122         -3.48%
 Sea Bright, Borough of                    1,304          1,349         -3.34%         1,412         -7.65%
 Sea Girt, Borough of                      1,714          1,844         -7.05%         1,828         -6.24%
 Shrewsbury, Borough of                    4,051          3,899          3.90%         3,809          6.35%
 Shrewsbury, Township of                   1,117          1,130         -1.15%         1,141         -2.10%
 Spring Lake, Borough of                   2,980          2,999         -0.63%         2,993         -0.43%
 Spring Lake Heights, Borough of           4,645          4,691         -0.98%         4,713         -1.44%
 Tinton Falls, Borough of                 17,902         17,933         -0.17%        17,892          0.06%
 Union Beach, Borough of                   5,634          6,040         -6.72%         6,245         -9.78%
 Upper Freehold, Township of               6,899          6,898          0.01%         6,902         -0.04%
 Wall, Township of                        26,020         26,091         -0.27%        26,164         -0.55%
 West Long Branch, Borough of              7,944          8,391         -5.33%         8,097         -1.89%
 Total                                   627,551        629,702        -0.34%        630,380        -0.45%

Future Growth Trends
According to U.S. Census population projections, the following 15 jurisdictions are projected to
experience the highest growth rates during 2010 to 2040. All of the remaining jurisdictions are anticipated
to experience growth rates of less than 10 percent during this period.

    •   Borough of Oceanport            35.9% (highest)
    •   Borough of Tinton Falls         35.4%
    •   City of Asbury Park             29.0%
    •   Township of Colts Neck          21.2%
    •   Borough of Eatontown            21.0%
    •   Township of Holmdel             20.5%
    •   Township of Wall                17.5%
    •   Township of Freehold            16.3%
    •   Township of Howell              12.1%
    •   Borough of Shrewsbury           11.8%
    •   Township of Neptune             11.6%
    •   Township of Aberdeen            10.8%
    •   Township of Marlboro            10.8%
    •   Borough of Red Bank             10.1%
    •   Township of Manalapan           10.0%

According to New Jersey Department of Labor and Workforce Development’s Projections of Total
Population by County: New Jersey, 2014 to 2034, Monmouth County’s population is expected to increase
to 649,500 people by year 2024, 655,300 people by year 2029, and 665,200 people by year 2034. These
projections, however, were originally calculated from a 2010 baseline. Since there has been a slight
decrease in population since 2010 (approximately 3,000 people), it is highly likely that these projections
presented for the next 14 years may higher than the actual future population.

The Monmouth County Division of Planning tracks locations within the County where people are moving
to using data from the Reference USA database. Figure 2.1 - 5 Recent Movers in Monmouth County
includes anyone who has moved to a house or apartment in Monmouth County (including inter-county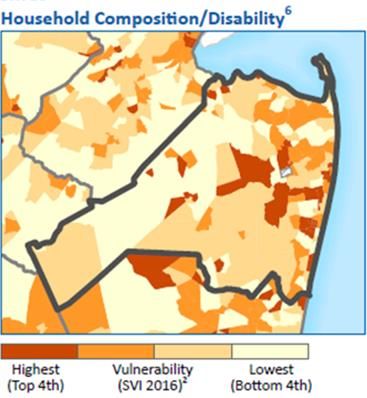
movers, single person households, and unrelated persons living in the same household). As the map
shows, a large majority of movers are moving to locations along the coast, where the risk of
Hurricane/Tropical Storm/ Nor’easter is highest in the County. In total, the database shows that 29,730
households moved into a Monmouth County municipality between May of 2017 and May of 2018
(Monmouth County Profile 2019).

                Recent Movers in Monmouth County (Monmouth County Profile 2019)

Monmouth County’s tourist attractions significantly increase coastal populations during the summer
months. According to the Monmouth County Summer Coastal Population Study (2008), an Average
Summer Day population is 761,528 and a Peak Summer Day population is 907,857. Based on historic
population trends and projections, Monmouth County's overall population growth represents an increase
in exposure and potential vulnerability of people to natural and human based hazards, particularly during
the summer months when the County's population swells with visitors. This is true for all of the
municipalities in the County as well, though to vastly different degrees. Due to the County’s increase in
exposure and potential vulnerability, several coastal municipalities are implementing better warning
systems to educate and communicate the risk of coastal storms to visitors since they might not be
familiar with the County’s potential for storms.

Age Distribution
According to the 2017 ACS 5-year, the median age in Monmouth County is 42.5 years old, which is an
increase from 37.7 years old in the 2000 Census and slightly higher than the 2010 Census of 39 years
old. About 22 percent of the population is under the age of 18 and about 16.1 percent are 65 and over.
About 62 percent of the total population is over 18 years of age, but under 65, and about 50 percent of
the population is over 40 years of age. The distribution and the median age indicate that the County is
aging, which is in line with the trend for New Jersey. The age distribution of Monmouth County is very
close to the age distribution of the State, as displayed in Figure 2.1 - 6 Monmouth County Age Cohort. In
terms of population segments that may potentially be at higher risk in general, about 5.1 percent of the
total population is under the age of five (a total of 31,705 persons) and 16.1 percent is age 65 years and
over (a total of 101,128 persons). Although presently the population 65 and over is only 16.1 percent, as
those who are in the cohorts 40-45, 45-50, and 50-55 (as of the 2010 census) continue to age and begin
to retire, that vulnerable population segment will grow and will need to be considered in the types of
mitigation actions explained in later sections. Census data indicates that the population is growing and
skewing older, with a rise in median age and number of older persons while numbers of young children
and disabled individuals are decreasing. Notably, the population in the 45-64-year age group increased
from 24.1% to 30.6% between 2000 and 2010.
Monmouth County Age Cohort (2017 ACS 5-Year Estimate)
Monmouth County vs.
New Jersey Age Distribution
70%
62.5% 62.0%
60%
State County
Percent of Population
50%
40%
30%
22.3% 22.0%
20% 16.1%
15.1%
10%
0%
Under 18 Years 18 to 64 Years 65 and Over
Age Cohort
Race & Ethnicity
According to the American Community Survey 2017 5-year estimates, Monmouth County is about 82.1
percent White, which is about 14 percent higher than the State estimate of 67.9 percent. The County also
has smaller minority populations than at the State level. Figure 2..1 - 7 2017 Race/Ethnicity Distribution
of Monmouth County illustrates the 2017 Race Distribution of Monmouth County. The County is 7.2
percent Black/African-American and 5.5 percent Asian, which are both lower than the State estimates.
The Hispanics/Latinos, of any race, make up about 10.6 percent of the population. Since 2000, the White
population has declined by about 1 percent while the Asian and Hispanic/Latino populations increased
by about 40 percent and 74 percent respectively. However, the Black/African-American population has
declined by about 9 percent.2017 Race/Ethnicity Distribution of Monmouth County (ACS, 2017 5-yr estimates)
100.0%
82.1%
Percentage of Pop.
80.0% 67.9% Monmouth County
60.0% New Jersey
40.0%
19.7%
20.0% 13.5% 9.4% 6.4% 2.6% 10.6%
0.2% 5.5% 0.0%
7.2% 0.2% 0.0% 3.1% 2.0%
0.0%
White Alone Black or American Asian Alone Native Some Other Two or More Hispanic or
African Indian and Hawaiian and Race Alone Races Latino
American Alaska Native Other Pacific
Alone Alone Islander
Alone
Race
Income
The median household income stated in the 2017 ACS 5-year estimate is $91,807, which is
approximately a 12-percent increase since the 2015 Monmouth County HMP. The County’s income is
also about 20 percent higher than the State’s median household income of $76,475. This makes
Monmouth County, along with Hunterdon, Morris, Somerset, and Bergen counties, one of the wealthiest
counties in the State. However, about 13.4 percent of the population lives in households with incomes
below $25,000 (approx. 31,148 households) and about seven and six-tenths percent of all people live
below the poverty line. Additionally, about six percent of households receive assistance via the SNAP
benefits program. This rate is about three percent lower than the State estimate. Monmouth County has
a high cost of living; according to the Cost of Living Index from the US Census, Monmouth County
(Middlesex-Monmouth) has a cost of living index of 124.8 whereas the national average is 100.
Monmouth County’s income disparity is heightened by sea level rise and climate change. According to
the Monmouth County Master Plan (2016), “with the recent reforms to flood insurance acts and updated
FIRMs, insurance rates across the country are significantly increasing and so is the number of people
now located in a SFHA. Combined with the associated costs of rebuilding after Superstorm Sandy,
complying with FEMA’s new floodplain regulations, and making structures more resilient, an Emerging
Issue and Long-Range Challenge for Monmouth County is housing affordability along the shore.”
Education
According to the 2017 ACS 5-year estimates, about 93 percent of the population 25 and older graduated
from high school and about 44 percent obtained a bachelor’s degree or higher. Given the relatively high
incomes of the municipalities in Monmouth County, this level of education is expected. These rates are
only slightly higher than the 2012 estimates. In 2012, 91.9 percent of the County’s population attained a
high school diploma and 40.3 percent attained a bachelor’s degree. The State’s rate for attaining a high
school diploma is only slightly lower at 89 percent. The County rate of attaining a bachelor’s degree is
also higher than the states rate of 38.3 percent.Vulnerable Populations
The Center for Disease Control (CDC) complied a Social Vulnerability Index (SVI) that indicates the
relative social vulnerability of a county. The CDC defines social vulnerability as “the degree to a which a
community exhibits certain social conditions that may affect that community’s ability to prevent human
suffering and financial loss” when a disaster or hazardous event occurs. In order to analyze the SVI of
each county, the CDC uses US Census Tract data and groups 15 factors into the following categories:
socioeconomic status, household composition & disability, minority & language, and housing &
transportation. The SVI is an important aspect of the HMP as it can be used to estimate the amount of
supplies needed for the various populations, identify where shelters are needed, and plans for evacuation
considering the elderly or those for whom is English is not their first language or spoken well.
Each vulnerability category is color coded for easy interpretation, as displayed in Figure 2.1- 8 SVI
Categories. Each category then relates to a corresponding map that depicts those vulnerabilities. See
Figure 2.1 - 9 SVI Socioeconomic Status, Figure 2.1 - 10 SVI Household Composition/Disability, Figure
2.1 – 11 SVI Race/Ethnicity/Language, and Figure 2.1 – 11 SVI Housing/Transportation. All the results
are then combined to create an overall SVI map, see Figure 2.1- 13 Overall Social Vulnerability. Although
Monmouth County does have some areas with high or moderate vulnerability, the County has relatively
low rates of vulnerability compared to some of its neighboring counties.
SVI Categories (CDC)SVI Socioeconomic Status (CDC)
The areas with the greatest vulnerability in the socioeconomic
status category are primarily in areas close to the shore towns
where cost of living may be higher than other parts of the
County that are less likely to attract much tourist attention and
whose incomes are not subsequently high enough to support
basic needs. There are several municipalities that show the
highest levels of vulnerability in this category. They include
Keansburg Borough, Red Bank Borough, Long Branch City,
Neptune Township, Neptune City, Union Beach Borough,
Freehold Borough, and Asbury Park City. Asbury Park has the
lowest household income at $39,324, followed by Long Branch
at $54,389. Areas with the greatest housing vulnerability are
also primarily along the Shore where home values and rents
are highest.
SVI Household Composition/Disability (CDC)
The category that indicates the most vulnerability is the
household composition and disability category. This category
includes not only those who are disabled, but also those who
are over 65 and under 17 years of age. As has already been
noted the County is aging which is creating more vulnerability in
areas where larger numbers of older households live, including
Tinton Falls Borough and Colts Neck Township. Additionally,
about 9 percent of persons age five and up hold disability status
within the County. Vulnerability in the minority status and
language category is clustered around the Neptune Township
and Asbury Park City, along with some moderate vulnerability in
the western portion of the County that borders Middlesex
County.Race/Ethnicity/Language (CDC)
The areas within Monmouth County with the highest levels of
vulnerability in the Race/Ethnicity/Language category,
correspond with the same coastal areas in the above
socioeconomic category. These include Freehold Borough,
Red Bank Borough, Long Branch City, Neptune City, and
Asbury Park City. However, there are also areas of increased
vulnerability it the western portion of the County that borders
Middlesex County, which as the map indicates has higher
levels of vulnerability throughout the County.
Housing/Transportation (CDC)
Housing and transportation vulnerabilities are highest in the
eastern portion of the County, along the Atlantic Ocean, in
Freehold Borough, Red Bank Borough, Eatontown Borough,
Asbury Park City, and parts of Wall Township. This also
corresponds to the areas with the highest levels of vulnerability
in the Socioeconomic and Household Composition & Disability
categories, as these areas have high housing costs. The
vulnerable areas in the southern portion of the State may due
to a lack of bus and train stops in this part of the County.
Overall, vulnerable communities can be found in Freehold Borough, Keansburg Borough, Long
Branch City, Neptune City, Asbury Park City, and parts of Red Bank Borough and Ocean Township
as shown in Figure 2.1-14 Overall Social Vulnerability.Overall Social Vulnerability (CDC)
2.2 LAND USE
DISTRIBUTION OF LAND USE
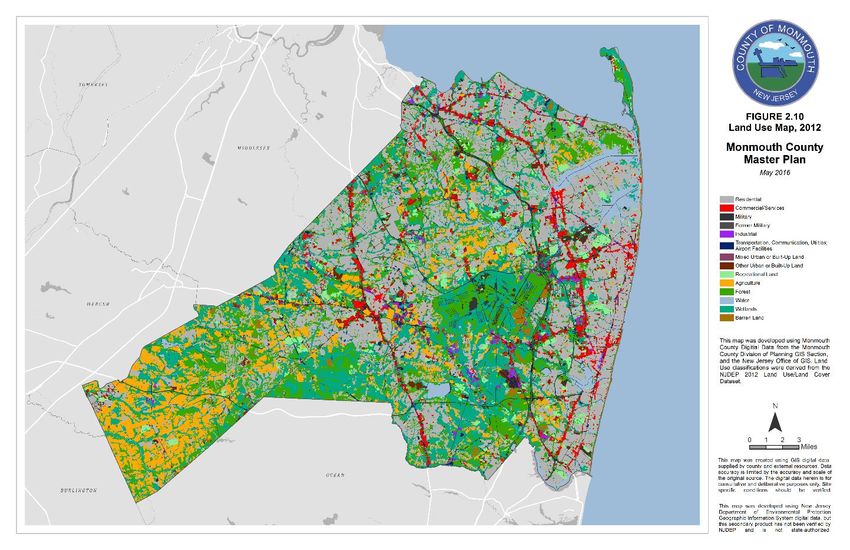
Land Use, as compiled from NJDEP GIS records, is presented graphically in Figure 2.2-1 Monmouth
County 2012 Land Cover Map. The figure reveals that more than half the County is essentially
undeveloped with agricultural land, woodland, and open space accounting for about 52 percent of the
County's land area. However, the majority of the municipalities in Monmouth County are considerably
developed, with 35 out of 53 municipalities having 60 percent or more of their land areas covered by
residential and commercial development. Of these municipalities, 16 have 75 percent or more covered
by these land use categories, of which three (the Boroughs of Bradley Beach, Neptune City, and Lake
Como) are more than 90 percent developed. At the opposite end of the spectrum, only four municipalities
(the Townships of Howell, Millstone, Upper Freehold, and the Borough of Roosevelt) are less than 25
percent developed. In all 53 municipalities, residential is the dominant developed land use category.
Monmouth County 2012 Land Use /Land Cover Map
The 2012 Land Use/ Land Cover GIS data is still the most current land use dataset that the County has
available and, therefore, no changes in land use in the last five years are directly calculable.
While the majority of land in Monmouth County is already developed or zoned for residential and
commercial uses, 24.8 percent is Public Land and 18.4 percent is Farmland (2019 Monmouth County At-
a-Glance Report). There is also only about 7 percent of Vacant Land throughout the County. This
represents an increase of 2.8 percent since the last version of the Monmouth County HMP.
Many of these lands are located in identified natural hazard zones and will remain vacant and free from
any future development. At the time of the last update, more than 15,700 acres of open space have beenpreserved as part of the Monmouth County Park System. The Park System's ultimate goal is to preserve
over 20,000 acres. Through the efforts of the Farmland Preservation Program, the County has preserved
182 farms from future development, totaling approximately 15,400 acres. This represents an increase of
about 31 percent since the time this initial plan was prepared. The majority of preserved farmland is
located in the western Monmouth County.
The identification and acquisition of land to be maintained as protected open space presents a
significant opportunity for jurisdictions to minimize future hazard exposures and vulnerability. In addition
to County, State, and Federal open spaces, local municipalities have collectively protected nearly 30,000
acres of open space through their own local preservation measures (municipal land reserved for open
space plus preserved farmland). Though often done for conservation, recreation or other community
purposes, protecting lands located in identified natural hazard zones can help jurisdictions meet
complementary hazard mitigation objectives and can qualify the communities for additional points under
the community rating system (CRS). It is often found that those natural areas deemed targets for open
space protection are often also identified as potential hazard zones (i.e., environmentally-sensitive lands
such as wetlands, floodplains, etc.).
CHANGES IN LAND USE/LAND COVER
Between 2007 and 2012 Monmouth County lost almost five percent of total farmland. Although the total
acreage of farmland is declining, the rate has slowed since the previous HMP. This may be due to the
efforts the County has taken to preserve farmland from development. The most significant change is the
decline in barren land, which could be due to infill and redevelopment as mentioned in the previous
section. Urban land has increased by about 1.2 percent. That increase is from changes in barren land
and agricultural land. Table 2.2-1 Monmouth County Land Cover, 2007 vs 2012 and Table 2.2-2
Monmouth County Land Cover Acreage Change by Land Cover, 2007 vs 2012 display the changes in
land use seen in the County between 2007 and 2012.
Table 2.2 - 1 Monmouth County Land Cover, 2007 vs 2012 (NJDEP)
Land Use Type 2007 Acres 2012 Acres Percent Change (%)
Agriculture 35,534.66 33,833.15 -4.79%
Barren Land 3,851.64 3,464.35 -10.06%
Forest 50,763.66 51,658.39 1.76%
Urban 143,683.09 145,390.24 1.19%
Water 11,864.65 11,901.07 0.31%
Wetlands 65,136.56 64,587.07 -0.84%
Table 2.2 - 2 Monmouth County Land Cover Acreage Change by Land Cover, 2007 vs 2012 (NJDEP)
Barren Land Forest Urban
Agriculture 2007 Water 2007 Wetlands 2007
2007 2007 2007
Agriculture 2012 33,160.75 44.15 174.28 416.84 0.27 36.86
Barren Land 2012 198.92 2,361.68 380.64 171.27 154.04 197.79
Forest 2012 1,269.03 110.65 49,322.15 924.20 2.97 29.38
Urban 2012 879.01 1,167.66 858.27 142,122.98 5.30 357.02
Water 2012 5.96 74.51 12.94 30.35 11,668.12 109.18
Wetlands 2012 20.98 93.00 15.39 17.44 33.94 64,406.33In addition to the NJDEP’s Land Use/Land Cover data, a good resource in estimating future land use
patterns is the Monmouth County Future Wastewater Service Area Map, located on the Monmouth
County Division of Planning’s webpage. This map displays the existing wastewater service areas within
the County, in addition to discharge and non-discharge areas, the Wastewater Management Plan
boundary, CAFRA Areas, the water quality management boundary, and Watershed Management Areas,
all useful information in anticipating where future service area and development will occur within the
County.
2.3 CHANGES IN DEVELOPMENT
HOUSING UNITS
There are about 260,254 housing units in Monmouth County, with 232,482 occupied. About 28,000 units
are vacant and almost 81 percent of those units are seasonal. Of the occupied units, 171,560 or 73.8
percent are owner occupied units and 60,922 or 26.2 percent are renter-occupied. These rates are in-line
with the housing tenure rates at the State level, which show that 64.2 percent of occupied housing is
owner-occupied, and 35.9 percent is renter-occupied. The majority of owner-occupied housing units in
the County are single-family detached units, about 67.5 percent, with an additional 8 percent of single-
family attached units. Renter-occupied housing units are about 23 percent single-family detached
followed by 18.6 percent of 50 units or more.
The median value of owner-occupied housing is estimated to be about $396,200, which is 23 percent
higher than the median value at the State level. The municipalities with the highest median values, over
one million dollars, are Rumson, Sea Girt, and Deal. All three municipalities are located along the coast.
The median gross rent is about $1,315, which is only slightly higher than the State estimate. However,
the median rent is almost 34 percent of household income. For homeowners, about 33 percent are
paying at least 30 percent of income on ownership costs and 14.4 percent are paying at least 50 percent
of income on ownership costs.
NEW RESIDENTIAL CONSTRUCTION
The New Jersey Department of Community Affairs (NJDCA) tracks the number of housing units
authorized by building permits by year. For the purposes of the Monmouth County HMP update, the last
five years of building permit data is included below to help estimate new residential construction trends.Table 2.3 - 1 Number of Housing Units Authorized by Building Permits (NJDCA)
Number of Housing Units Authorized by Building Permits
Municipality Year
Total
2014 2015 2016 2017 2018
Aberdeen Township 63 41 594 156 114 968
Allenhurst Borough 3 0 2 1 0 6
Allentown Borough 0 0 1 0 0 1
Asbury Park City 2 64 2 342 7 417
Atlantic Highlands Borough 5 9 23 28 34 99
Avon-by-the-Sea Borough 24 17 15 19 6 81
Belmar Borough 16 16 9 15 66 122
Bradley Beach Borough 9 7 13 11 9 49
Brielle Borough 15 8 15 10 15 63
Colts Neck Township 10 6 6 7 7 36
Deal Borough 8 5 1 8 6 28
Eatontown Borough 47 39 34 8 7 135
Englishtown Borough 0 3 0 0 3 6
Fair Haven Borough 18 27 20 27 35 127
Farmingdale Borough 0 0 21 3 1 25
Freehold Borough 4 6 2 1 1 14
Freehold Township 0 1 32 119 96 248
Hazlet Township 0 0 14 6 72 92
Highlands Borough 18 33 62 19 11 143
Holmdel Township 16 12 68 75 26 197
Howell Township 147 191 93 91 81 603
Interlaken Borough 0 1 1 0 0 2
Keansburg Borough 21 1 197 0 0 219
Keyport Borough 2 0 24 1 28 55
Lake Como Borough 4 5 2 8 4 23
Little Silver Borough 18 40 5 10 7 80
Loch Arbour Village 1 0 0 2 0 3
Long Branch City 130 27 75 160 346 738
Manalapan Township 46 3 12 14 6 81
Manasquan Borough 49 52 15 0 1 117
Marlboro Township 6 8 21 28 242 305
Matawan Borough 8 100 33 43 2 186
Middletown Township 56 74 190 167 127 614
Millstone Township 15 12 18 8 8 61
Monmouth Beach Borough 48 11 1 25 28 113
Neptune City Borough 6 16 7 5 3 37
Neptune Township 234 15 16 3 45 313
Ocean Township 22 113 25 71 94 325
Oceanport Borough 12 8 27 18 7 72
Red Bank Borough 4 1 13 2 1 21Number of Housing Units Authorized by Building Permits
Municipality Year
Total
2014 2015 2016 2017 2018
Roosevelt Borough 0 0 0 0 0 0
Rumson Borough 38 37 41 25 32 173
Sea Bright Borough 0 0 1 10 23 34
Sea Girt Borough 13 16 18 24 23 94
Shrewsbury Borough 21 3 4 4 0 32
Shrewsbury Township 0 0 0 0 0 0
Spring Lake Borough 22 33 28 21 20 124
Spring Lake Heights Borough 6 8 6 7 17 44
Tinton Falls Borough 21 18 2 0 60 101
Union Beach Borough 69 41 35 34 33 212
Upper Freehold Township 14 13 33 49 23 132
Wall Township 38 33 20 35 31 157
West Long Branch Borough 6 2 4 9 20 41
Monmouth County 1,335 1,176 1,901 1,729 1,828 7,969
The top ten municipalities with the greatest number of housing units authorized by building permits
between 2014 and 2018 include the following:
1. Aberdeen Township: 968 units
2. Long Branch City: 738 units
3. Middletown Township: 614 units
4. Howell Township: 603 units
5. Asbury Park City: 417 units
6. Ocean Township: 325 units
7. Neptune Township: 313 units
8. Marlboro Township: 305 units
9. Freehold Township: 248 units
10. Keansburg Borough 219 units
Overall, most new residential units were approved in municipalities along the Atlantic Ocean and Raritan
Bay. While overall exposure has increased with more units present, it is not likely that overall vulnerability
has increased because development in Special Flood Hazard Areas, as new residential construction is
required to be built to current codes and standards that would offer protection from future hazard events.
Several municipalities along the Atlantic Ocean and Raritan Bay are undergoing redevelopment. Over the
last five years, upgrades to commercial facades, improvements to streetscapes, conversion of vacant
buildings and lots into mixed-use developments, and the elevation of structures have become a popular
trend to in coastal municipalities. This trend has been exacerbated in the recent aftermath of Superstorm
Sandy (2012) as damaged structures are, for the most part, repaired/rebuilt. The focus toward
redevelopment projects in waterfront communities signals a continued shift in Monmouth County
development patterns.REDEVELOPMENT
Monmouth County's Coastal Region, spanning from Brielle to Sea Bright, includes 30 municipalities and
roughly 40 percent of the County's total population. Communities in this region are all, in some way,
affected by seasonal shore tourism. The Coastal Monmouth Plan (2010) outlines a future vision for the
Coastal Region which includes preparing for sustainable growth while protecting environmental
resources and preserving each community's unique coastal character. These coastal redevelopment
projects mark a turning point for Monmouth County. Since 1970 development had been concentrated in
the western half of the County while parts of the coastal area languished. Revitalization of the coastal
areas boosts the County's economy in places where there currently exists public transportation, existing
infrastructure, and until recently high unemployment. This comes at a time that Monmouth County's
overall population growth is slowing, and western Monmouth County is past its peak growth (i.e., the
County's population doubled in the post-war boom of the 1950's to the 1970's). The Monmouth County
Division of Planning estimates that in the future, the financial health of the County will come more from
the eastern and northern areas.
In September 2011, Fort Monmouth closed and in 2012 the US Army signed an agreement that granted
redevelopment control to the Fort Monmouth Economic Revitalization Authority (FMERA). Since then
FMERA has issued Requests for Offer to Purchase (RFOTPs) to attract residential units, retail, office
space, and places of worship. The Authority aims to foster an environment that will attract a diverse
network of small, medium, and large employers. Another redevelopment effort taking place in Monmouth
County is the Bell Works Complex in Holmdel Township, a formerly vacant, nearly two million square foot
structure that is being turned into innovative office space, attracting tech and communications
companies, along with luxury homes, retail, and dining.
Public Investment Strategy
The New Jersey State Development and Redevelopment Plan (2001) attempted to map “Planning Areas”
within the State with Policy Objectives to guide “proper development and redevelopment of Centers and
Cores and adequate protection of their Environs” (The New Jersey State Development and
Redevelopment Plan, 2001). The Monmouth County Division of Planning integrated the State’s approach,
in addition to other planning efforts, to create their own Public Investment Strategy in the Monmouth
County Master Plan (2016). The County’s Public Investment Strategy is the overall strategy for future
development in Monmouth County and resulted in the development of a Framework for Public
Investment Map with the following designations:
• Priority Growth Investments Areas (PGIA): areas with either existing or planned infrastructure
that lend to development and redevelopment opportunities
• Priority Growth-Reinvestment Areas/Site Overlays (PG-RAS): areas or sites located within the
PGIA where more intense or significant development, redevelopment, revitalization, and hazard
mitigation investments are highly encouraged
• Priority Growth – Water Supply Watershed Area Overlays (PG-WSWA): locations within a PGIA
that contain a natural resource value pertaining to water quality and supply.• Limited Growth Investment Areas (LGIA): Areas located outside of existing or programmed sewer
service areas intended for low-density residential uses, compatible rural patterns, and supportive
commercial uses
• Priority Preservation Investment Area/Site (PPIAS): An area or site where an investment in land
preservation, agricultural development and retention, historic preservation, environmental
protection and stewardship is preferred and encouraged
Figure 2.3-1 Framework for Public Investment Map displays these investment areas within Monmouth
County. It should be noted that all beachfront and waterfront areas in a PGIA are PPIA.
Framework for Public Investment Map (Monmouth County Master Plan, 2016)
FUTURE DEVELOPMENT
In New Jersey, housing and land use have been significantly impacted by affordable housing litigation
and subsequent legislation. The Mount Laurel IV Declaratory Judgment Process commenced in 2015 as
a result of the responsibility for determining municipal affordable housing obligations and
implementation of municipal housing elements and fair share plans pursuant to the Fair Housing Act
being placed under the jurisdiction of the State Supreme Court, in response to a failure by the State
Council on Affordable Housing to adopt updated Substantive and Procedural Rules and lack of a
legislative solution. As the Declaratory Judgment Process continues, increasing numbers of
municipalities in Monmouth County and other areas of the State are reaching settlements with the Fair
Share Housing Center and are adopting amended third round housing elements and fair share plans
which describe municipal affordable housing obligations through 2025.Plan Participants were asked if they were aware of any potential major developments in their community
in the next five years, especially developments in Special Flood Hazard Areas. Potential new development
trends in Monmouth County are illustrated below in Table 2.3-2 Future Land Use and Development
Trends in Special Flood Hazard Areas.
Table 2.3 - 2 Future Land Use and Development Trends in Special Flood Hazard Areas
Jurisdiction Land Use and Development Trends in Special Flood Hazard Areas
Aberdeen Township has very little remaining vacant land available and suitable for development.
Therefore, the predominant development occurring in the Township in the recent years is on
small single-family lots with in-fill development or the redevelopment of existing sites, both for
residential and non-residential uses. The Township has identified a number of larger areas for
redevelopment, some of which have been designated as Redevelopment Areas under the Local
Redevelopment and Housing Law. The areas include:
• "Planned Adult Community Redevelopment Area" (approx. 183 acres) in the Freneau
Aberdeen, portion of the Township where public sewer and water service are proposed to be
Township of extended to serve both the existing and proposed developments
• Expansion of Freneau Park, part of the Monmouth County Park Service (MCPS)
• Glassworks: two mixed-use residential communities of The Willows and The Forge. The
residential component consists of 500 residential units, including for-sale and rental
townhouse units, and apartments with 110 affordable rental units. Residences began
leasing in 2017 and are hoping to attract employees of nearby Bell Works and Fort
Monmouth. The remainder of the site will include 75,000 square feet of retail space, a
movie theater, and a 2-acre park (2019 Monmouth County Profile)
Allenhurst, Not aware of any potential major development in the next five years. Borough is almost entirely
Borough of built out.
Allentown, Not aware of any potential major development in the next five years. Borough is almost entirely
Borough of built out.
Current development projects in Asbury Park include:
• West Side: on the west side of Asbury Park, the redevelopment of Boston Way
Apartments, a 104-unit mixed income rental community was completed. Just blocks
away is the construction site of Renaissance, a 64-unit mixed-use affordable housing
Asbury Park, City community, anticipated for a 2019 opening (2019 Monmouth County Profile)
of • Boardwalk: waterfront redeveloper plans to invest more than $1 billion over the next 10
years. This will include 20 new residential and commercial developments (2019
Monmouth County Profile)
• Cookman Ave: several mixed-use structures planned for this area
• Main Street: several mixed-use structures planned for this area
Atlantic Not aware of any potential major development in the next five years. Borough is almost entirely
Highlands, built out.
Borough of
Avon-by-the-Sea, Not aware of any potential major development in the next five years. Borough is almost entirely
Borough of built out.
Belmar is mostly single-family homes. Belmar is in the process of updating their Business Zone
Belmar, Borough
by rebuilding and redesigning a six-block area. Belmar has also experienced infill, mixed-use
of
redevelopment along Main Street in downtown and in areas in and around the marina.
Bradley Beach is primarily a residential community with mixed-use retail/residential and
office/residential along the Main Street Corridor at the west edge of the Borough. The majority of
the Borough is zoned single-family residential except for the aforementioned mixed-use zone and
Bradley Beach,
townhouse and apartment used permitted along the beachfront block. The Borough is fully
Borough of
developed with no vacant property available for development. Development is limited to
demolition and construction of single-family homes or small condominium projects on larger lots
in the beachfront area.Jurisdiction Land Use and Development Trends in Special Flood Hazard Areas
Brielle has little room for development. The trend is toward minor subdivisions, particularly in the
area east of Union Lane, between Old Bridge Road and Green Avenue, where the required
Brielle, Borough frontage is 75 feet. The trend is for the division of 100 foot lots into 50-foot lots. The few
of remaining commercial areas (i.e. marinas) are in danger of turning into condominiums. While the
increase in density is manageable, it cannot but help to adversely impact the overall quality of
life.
Colts Neck is historically developed as agriculture and detached single-family dwellings. The A-1
Agriculture / Residential Zone is a two-acre zone with a density of 0.1 dwellings per acre. Over
the past five years the Township has issued 110 certificates of occupancy and 37 demolition
Colts Neck, permits for a net gain of 73 dwellings. This averages 15 dwellings per year. This trend is
Township of anticipated to decline in the near future, due to a lack of vacant land and current market
conditions. The only multifamily development plan is The Manor Homes at Colt Neck, a 48-unit
inclusionary development proposed on Route 537. Commercial development is limited to the
Route 34 corridor between Artisan Place and Route 18.
Not aware of any potential major development in the next five years. Borough is almost entirely
Deal, Borough of
built out.
Current development projects in Eatontown include:
• The development multi-family townhouses with upward of 300 units with 1,000 new
residents
Eatontown, • Industrial Park Redevelopment
Borough of • Mall Redevelopment plan to include hotel and housing (Kushner development)
• New construction on Rt 35 - Rt 36 to improve movement of traffic
• Fort Monmouth: is in the process of redeveloping into new residential units, a
destination retail, office and research space, and places of worship
Englishtown completely built out except for two properties. One property has plans for four to six
Englishtown,
single family homes and the other is going to be eight apartment buildings with a total of 134
Borough of
apartments.
Fair Haven, Fair Haven’s land availability is restricted to one-or-two family structures. No major building
Borough of projects are expected.
Farmingdale, Farmingdale has limited development. Spot residential and limited commercial construction
Borough of takes place sporadically.
Freehold, Freehold Borough is approximately 95% built out and is not aware of any major development in
Borough of SFHAs within the next five years.
Freehold, Although Freehold Township has experienced significant growth over the last three years, there
Township of is no major development in SFHAs planned within the next five years.
Hazlet, Township Various projects approved or pending and under construction currently; Details provided by
of Zoning Official.
Near the Highlands waterfront are single-family residential units which are being renovated and
elevated due to Superstorm Sandy and FEMA’s FIRMs. Older, single and multi-family housing
units are being demolished and replaced with new single and multi-family housing units above
Highlands, the Base Flood Elevation. Some pre-existing high-density areas have been rezoned into "MXD"
Borough of areas and are currently awaiting redevelopment. Preexisting open areas are being developed and
are becoming, single and multi-family housing units. Much of the waterfront business area zones
has already been developed with restaurants or marinas. Older restaurants are being renovated
and reopened as restaurants.
Holmdel’s largest development is occurring at Bell Works, the two million square foot structure
undergoing adaptive reuse into an urban hub, a core, and a little metropolis in a suburban
Holmdel, location. Surrounding the Bell Works building on the 134-acre site, The Regency at Holmdel (185
Township of active-adult luxury townhouses) and The Reserve at Holmdel (40 luxury estate homes) opened in
2017 (2019 Monmouth County Profile)
Howell Township is mostly large, single-family residential development within areas of previously
Howell, Township farmed land. A lot of the Township maintains a rural character. Most of the Township's
of development is scattered throughout rural locations and located at previously farmed areas and
wetland areas. Agricultural Rural Estate (ARE) zone districts are present within the Township andJurisdiction Land Use and Development Trends in Special Flood Hazard Areas
prevent the impacts of development in areas located outside of centers that are identified in the
Township's Master Plan. Agricultural uses and low-density development are encouraged within
the ARE zone districts. High density residential development within the Township is located
within the residential zone districts and located in the vicinity of well-traveled roadways.
Commercial development within the Township can be found along the Rt. 9 and Rt. 35 corridors.
Further, the Wastewater Management Plan Map adoption process removed large areas of the
township from future sewer service area to support lower density zoning.
Interlaken Borough is unique in that the municipality is completely single-family residential. The
only non-residential land use is borough-owned property such as Borough Hall, a park, and an
Interlaken,
arboretum. The Borough's goal is to retain the current character of the community and this is
Borough of
reinforced in its Master Plan and Zoning Ordinance. The Borough is concerned about preserving
its Deal Lake frontage as well as environmental stabilization of the Deal Lake itself.
Keansburg, Keansburg has a townhouse/condo and retail development near the waterfront area. There is a
Borough of feasibility study being conducted for a marina.
Keyport, Borough Keyport has a new residential development 50 yards from waterfront including 10 new homes
of within last five years. There is a potential for a future condominium project along a creek bed.
Lake Como’s focus is to work with homeowners to ensure compliance with the new guidelines
Lake Como, for elevation in the A zone. The remainder of the town is completely developed with most work
Borough of being confined to additions and alterations and or replacement of existing single-family
residences.
Little Silver is largely residential, developing slowly in accordance with its current zoning.
Little Silver,
Development is mostly renovation of existing homes except for one age restricting housing
Borough of
development recently approved by the Planning Board.
Loch Arbour, The Village of Loch Arbour is fully developed. Primarily single-family residential development is
Village of usually in the form of demolition and reconstruction.
Over the last ten years the City of Long Branch has been developing and implementing
an extremely progressive redevelopment program. The city has the following
development plans underway:
• Pier Village: a mixed-use community started in 2005; phases I and II consist of 536 rental
units on top of 100,000 square feet of boutique retail space and restaurants. Phase III
repaired a missing piece of the boardwalk and will feature a carousel, stage, public
restrooms, and children’s play area with a mist park. The remainder of Phase III,
anticipated for completion in 2019, includes a 72-room boutique hotel, oceanfront
condominiums, dining and retail space, parking garage, and public recreational amenities
(2019 Monmouth County Profile)
Long Branch, City • Beachfront South: several properties are in various stages of redevelopment (2019
of Monmouth County Profile)
• Beachfront North: developer is seeking final site plan approval for the development of 12
single-family building lots, City right of way improvements, grading and stabilization, and
landscaping (2019 Monmouth County Profile)
• Long Branch’s West End: mix of small businesses with urban design standards (2019
Monmouth County Profile)
• Broadway Redevelopment: a developer is planning on investing $200 million to build 590
rental apartments, 99,500 square feet of retail, and a parking garage. The City agreed to
fund the road improvements necessary with a $5 million taxpayer-backed bond (2019
Monmouth County Profile)
• Train Station Village: redevelopment around the Long Branch New Jersey Train Station
Over the last decade, Manalapan Township has experienced a strong demand for residential
Manalapan,
development and increasing land values. The Township has also experienced a demand for non-
Township of
residential development for retail office and office-warehouse uses.
Manasquan is a built-out year-round shore community. Most development consists of
Manasquan,
demolishing small, single-family homes with elevated two to three-story single-family homes that
Borough of
comply with FEMA’s FIRMs.Jurisdiction Land Use and Development Trends in Special Flood Hazard Areas
Marlboro, Marlboro Township is seeing a combination of high-density high-occupancy residential,
Township of commercial, and low-density residential on lots of one-acre or larger.
Matawan, Not aware of any potential major development in the next five years. Borough is almost entirely
Borough of built out.
New development in Middletown Township consists largely of single-family homes and
subdivisions. Typical subdivision applications currently range in size from two-12 lots, whereas in
years past they tended to be much larger, with 30 - 50 lot developments being common. More
multi-family developments, both rental and for sale, have been occurring in the past 10 years and
Middletown,
will likely continue. This is primarily due to the Township's efforts in complying with State
Township of
mandated affordable housing obligations. There is also an area of 10 -15 acres near the
waterfront that is adjacent to the commercial fishing cooperative that is slated for
redevelopment in the next few years. Other than that, the Bayshore area is mostly built out, with
some infill development possibilities.
Millstone, Millstone Township is considered low-density rural residential. Development is permitted along
Township of stream corridors and limited areas of commercial development.
Monmouth Much development in Monmouth Beach is bringing current development into compliance with
Beach, Borough FEMA’s FIRMs.
of
Neptune City is 99% developed with majority of that as single-family homes. It has some
Neptune City,
apartment complexes and commercial areas. There is a process of a possible 16 acres of
Borough of
redevelopment of high-density housing.
Development trends vary depending on the area of Neptune Township. Below is a listing based
on location within the Township:
• Western Neptune: medical office, big-box retail including pad sites for restaurants,
banks, pharmacies, and other retail; major subdivisions - not exceeding 20 lots
• Eastern Neptune: in-fill residential, smaller lots
Neptune, • West Lake Ave. Redevelopment Area: dense mixed use including residential retail and
Township of office Fonner Ridge Ave
• School Site Redevelopment Area: dense residential including single-family townhouses
and apartments
• Potential Redevelopment Areas: transit Village near railroad station
• Shark River Waterfront: moderate dense residential with a portion of retail and hotel
• Existing highway corridors: possible in-fill and new development
Ocean Township has two types of residential development:
• Infill: undeveloped parcels in the middle of an otherwise developed
Ocean, Township
neighborhood. Usually large new homes on small lots
of
• Age Restricted Adult Communities: continuing construction on two large projects, while
a third was recently completed
Future development in Oceanport will be focused at Fort Monmouth, which is in the process of
Oceanport,
redeveloping into new residential units, a destination retail, office and research space, and places
Borough of
of worship.
Red Bank, The Borough of Red Bank is encouraging a denser mixed-use development near the train station.
Borough of
Roosevelt, Not aware of any potential major development in the next five years. Borough is almost entirely
Borough of built out.
Rumson, Not aware of any potential major development in the next five years. Borough is almost entirely
Borough of built out.
Sea Bright, Not aware of any potential major development in the next five years. Borough is almost entirely
Borough of built out.
Sea Girt, Borough Not aware of any potential major development in the next five years. Borough is almost entirely
of built out.You can also read