Reusability and the potential environmental impact of small electronics - Literature review and discussion
←
→
Page content transcription
If your browser does not render page correctly, please read the page content below
Nr C 588-P
                                   January 2021

Reusability and the potential
environmental impact of
small electronics
Literature review and discussion

Jurate Miliute-Plepiene, IVL
Author: Jurate Miliute-Plepiene, IVL
Funded by: Government Offices of Sweden
Report number C 588-P , January 2021
ISBN 978-91-7883-272-9
Edition Only available as PDF for individual printing

© IVL Swedish Environmental Research Institute 2021
IVL Swedish Environmental Research Institute Ltd.
P.O Box 210 60, S-100 31 Stockholm, Sweden
Phone +46-(0)10-7886500 // www.ivl.se

This report has been reviewed and approved in accordance with IVL's audited and approved
management system.
Report C 588-P Reusability and the potential environmental impact of small electronics – Literature review and
discussion
Table of contents
Summary ................................................................................................................................ 5
Sammanfattning..................................................................................................................... 6
1 Background ..................................................................................................................... 7
2 Potential for reuse .......................................................................................................... 8
2.1 EEE in stocks as an increasing problem in developed countries ............................. 8
2.2 Storage of the aggregated group” small electronics and small IT” ......................... 9
2.3 The potential for reuse of stored electronics........................................................ 11
2.3.1 Durability ...................................................................................................... 11
2.3.2 Obsolescence ................................................................................................ 11
2.3.3 Functional vs dysfunctional electronics........................................................ 16
3 Potential impacts/benefits of circular solutions .......................................................... 17
3.1 Increased recycling vs incineration ....................................................................... 17
3.1.1 Current situation ........................................................................................... 17
3.1.2 Potential impact/benefits ............................................................................. 17
3.1.3 Recycling ................................................................................................ 18
3.1.4 Incineration............................................................................................ 28
3.2 Increased recycling vs stock storage by households ............................................. 28
3.3 Increased reuse vs in stocks .................................................................................. 28
3.3.1 Current situation ........................................................................................... 28
3.3.2 Re-use vs recycling ....................................................................................... 29
4 Conclusions ................................................................................................................... 34
5 References .................................................................................................................... 37
3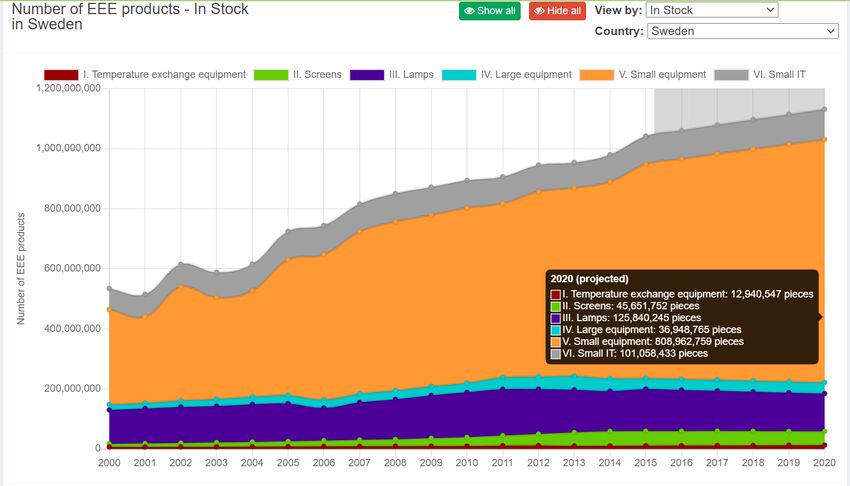
Report C 588-P Reusability and the potential environmental impact of small electronics – Literature review and
discussion
4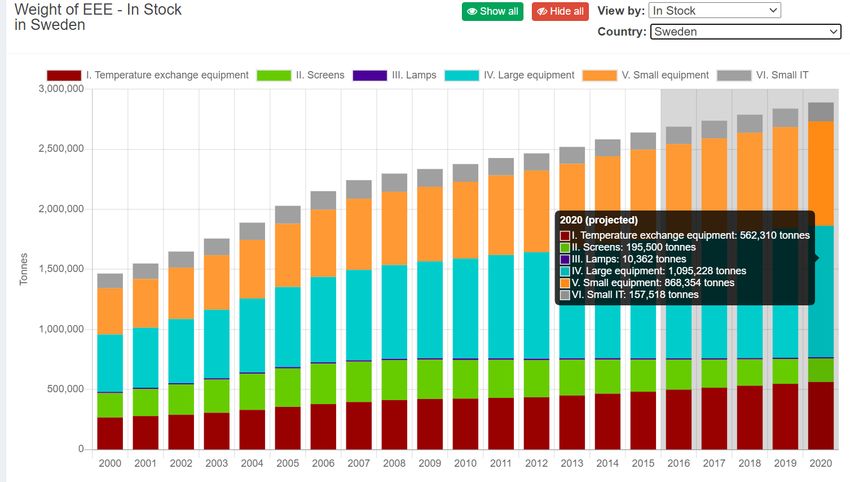
Report C 588-P Reusability and the potential environmental impact of small electronics – Literature review and
discussion
Summary
This study is part of a short assignment on behalf of Swedish Government within an investigation of possible
deposit-return system for small electronics in Sweden. The report aims to explore (1) the potential of reuse of
small electronics kept in stocks by households; (2) the environmental impacts/benefits of increased recycling;
and (3) the environmental effects of increased reuse.
The research is mainly based on the literature review which was complemented with estimates of e-waste
shares in mixed household waste and the potential economic value of metals present in electric and electronic
(EEE) devices. The focus of the study was on information and telecommunication technology (ICT) products
(e.g. mobiles phones, tablets and laptops).
Unused electronics kept in stocks at home represent a delayed or lost opportunity for reuse or
remanufacturing. The reuse potential of such electronic devices depends on the remaining physical durability
and perceived or factual technological obsolescence. The greatest potential for reuse is when the products are
still within their designed lifetimes, thus products should be sent to second life as soon as they are no longer in
use.
Knowledge about the quantities of reusable dormant electronics is very limited and fragmented, although a
recent Swedish survey showed that there could be up to 2 million of unused functional mobile phones less
than 4-year-old kept by households. 1 Nevertheless, the potential for reusing dysfunctional electronics in
Sweden is low, since it requires costly repairs or remanufacturing and the demand for the newest devices far
outstrips the demand for used ones.
At the same time, an extension of lifetimes of small electronics through domestic reuse could bring clear
environmental (especially climate) benefits in comparison to incineration, recycling, or stockpiling electronics
at home. This is particularly relevant for the ICT products with high environmental burdens in production and
end-of-life phases. However, absolute savings from reuse can vary greatly between EEE groups and even
within the same product group.
It has been estimated that about 8,000 tonnes of small electronics annually enter incineration together with
mixed household waste. Much larger environmental and economic benefits could be attained if a more
effective waste management system would be in place to divert WEEE flows towards material recovery
(recycling) and especially - reuse. The magnitude and nature of the benefits depend on the quantity of
collected electronics, composition, and the effectiveness and the efficiency of sorting and recycling. For
instance, the theoretical value of metals present in 1 million pieces of small EEE varies from 20 to 70 million kr
for mobiles, up to 24 million kr for tables and 120 million kr for notebooks.
Drawing definite conclusions about the impacts of increased collection and current recycling vs keeping WEEE
in stocks is difficult as it depends mainly on future households’ behaviour, the efficiency of e-waste
management and strategies governing re-valorisation of e-waste.
1 This report has been completed in 2020 and published April, 2021, when the results of a survey (within the same investigation
of deposit-return system) was published. The survey focuses on households keeping stocks of unused electronic devices. Here,
the amount of e.g. total amount of mobile phone was estimated in the range of 20-25 million units. The result of this survey has
not been included in this report.
5Report C 588-P Reusability and the potential environmental impact of small electronics – Literature review and
discussion
Sammanfattning
Denna studie är en del av ett kortare uppdrag för regeringens utredning om pantsystem på
småelektronik i Sverige. Studien syftar till att undersöka (1) potentialen för återanvändning av
småelektronik som lagras i samhället/hushållen; (2) miljöpåverkan / fördelar med ökad återvinning;
och (3) miljöpåverkan / fördelar med ökad återanvändning.
Studien baseras främst på en litteraturöversikt, kompletterad med några grova uppskattningar (om e-
avfall i blandat hushållsavfall och potentiellt ekonomiskt värde av metaller som finns i elektronik).
Informations- och telekommunikationsteknologier (IKT) som mobiltelefoner, surfplattor och bärbara
datorer var fokus i studien.
Mängden småelektronik som inte används, utan istället lagras i lådor i hushållen, är en fördröjd eller
förlorad möjlighet att renovera eller återanvända elektroniken. Potentialen för återanvändning av
oanvänd elektronik som lagras i hushåll beror på produktens hållbarhet och graden av både faktiska
och upplevda tekniska föråldringar. Störst potential för återanvändning av elektronik finns inom
produktens uppskattade livslängd. Därför bör produkterna skickas till återanvändning så snart de
inte längre används.
Kunskap om mängden återanvändbar elektronik lagrade i hushåll i Sverige är begränsade och
fragmenterade, även om en ny svensk undersökning visar att det potentiellt finns cirka 2 miljoner
funktionella mobiltelefoner, yngre än 4 år, lagrade i svenska hushåll. Dock är potentialen för att
återanvända dysfunktionell elektronik låg i Sverige, eftersom det kräver reparation som är kostsam. I
synnerhet gäller det produkter med lägre ekonomiskt värde (exempelvis gamla leksaker) och
efterfrågan på de senaste enheterna överstiger långt efterfrågan på begagnade enheter.
Sammantidigt visar vår kvalitativa litteraturöversikt att en ökad livslängd på småelektronik, genom
inhemsk återanvändning, potentiellt kan klart bidra med miljöfördelar (särskilt klimatfördelar) i
jämförelse med andra nuvarande alternativ. Vidare är detta särskilt relevant för IKT-produkter, vilka
ofta har stor belastning på miljön. Miljöfördelarna som återanvändning kan bidra med varierar
mellan olika elektroniska grupper och produkter.
Cirka 8 000 ton av småelektronik inkommer årligen till förbränning som en del av blandat
hushållsavfall. Om avfallshanteringssystemet skulle vara mer effektivt i form av högre återvinnings-
och materialåtervinningsgrad (särskilt för de sällsynta och ”exotiska” metallerna), skulle påtagliga
miljö- och ekonomiska fördelar kunna erhållas jämfört med förbränning. Till exempel varierar det
teoretiska värdet av metaller som finns i 1 miljon enheter av elektronik från 20 till 70 miljoner kr för
mobiler, upp till 24 miljoner kr för surfplattor och 120 miljoner kr för bärbara datorer. Fördelarnas
omfattning och karaktär beror på mängden samlad elektronik, sammansättning och effektivitet vid
sortering och återvinning.
Dock är det svårt att dra definitiva slutsatser om miljöeffekterna av ökad insamling och återvinning,
jämfört med miljöeffekterna av att lagra elektronik i hushållen, då det till stor del beror på framtida
beteende och effektivitet av hanteringen av uttjänad elektronik.
6Report C 588-P Reusability and the potential environmental impact of small electronics – Literature review and
discussion
1 Background
This study is an assignment on behalf of the Swedish Government within an investigation of the
potential impacts of a deposit refund system for small electric and electronics equipment (EEE). It
focuses on the reusability of small electronics that is kept in stocks and the potential environmental
impact of the deposit system.
Aim
This study raises three main questions:
- What is the potential for the reuse of small Information and Communication Technology
(ICT) electronics and household appliances? (the focus is on small electronics kept in stocks)
- What are the potential benefits and impacts of increased recycling vs other waste
management alternative or keeping it in stocks?
- What can be the environmental benefits/impacts of increased reuse?
Method
The study is mainly based on literature review and some rough estimates. It presents an approximate
estimation of the monetary value of materials present in small information technology and
telecommunication (ICT) equipment and estimations about the volumes of small EEE in household
waste that go to incineration. Relevant researchers abroad were also contacted in order to
complement some identified data gaps.
Scope and limitations
The investigation of the deposit system focuses on small household electrical equipment and small
information and communication technology (ICT) equipment defined according to the Swedish
producer responsibility regulation 2 and the EU directive on WEEE (2012/19/EU):
- small IT and telecommunication equipment (of external dimension less than 50 cm):
phones, GPS equipment, pocket calculators, routers, personal computers and printers;
- small equipment; this includes products with external dimensions less than 50cm in
length, width or depth (e.g. Vacuum Cleaners, Carpet Sweepers, Appliances for sewing,
Luminaires, Microwaves, Ventilation equipment, Irons, Toasters, Electric Knives, Electric
Kettles, Clocks and Watches, Electric Shavers, Scales, appliances for hair and body care,
Radio Sets, Digital Cameras, Video Cameras, Video Recorders, musical instruments and
Hi-Fi equipment reproducing sound or images, Electrical and Electronic Toys, Sports
Goods, small scale computers for e.g. biking, diving, running, rowing, etc., Smoke
Detectors, Heating Regulators, Thermostats, Small Electrical and Electronic tools, small
Medical Devices, small Monitoring and Control instruments, small equipment with
integrated photovoltaic panels).
In this study we focus mostly on three ICT product groups: mobile phones, tablets and laptops; other
small electronics are included to a lesser extent.
2https://www.riksdagen.se/sv/dokument-lagar/dokument/svensk-forfattningssamling/forordning-20141075-om-producentansvar-
for_sfs-2014-1075
7Report C 588-P Reusability and the potential environmental impact of small electronics – Literature review and
discussion
This study doesn’t include any calculations and deeper evaluation of potential total effects of a
deposit-refund outcomes, as it would require better/deeper knowledge of the current situation (i.e.
quantities and product/material compositions, recycling efficiency, data on illegal exports and
destination countries, etc.), which was not possible to investigate in the frame of this short
assignment.
2 Potential for reuse
This chapter describes the potential of the re-use of EEE kept in stocks. The first section briefly
presents current knowledge about the quantities of small electronics in stock, including Swedish and
foreign examples. The second section discusses theoretical re-use potentials of the stocks. This is
affected by gaps in empirical evidence and should be interpreted with caution.
2.1 EEE in stocks as an increasing problem in developed countries
Rapid technology innovations and short lifetimes of electronics result in that consumers in affluent
countries possess an increasing stock of equipment kept at home. This is especially relevant for small
electronics, such as e.g., mobile phones. According to a study by JRC (Cordella, Alfieri et al. 2020),
unused devices in the U.S. and the UK correspond to about 58 billion USD in residual value. In the
U.S., 27-36% of consumers keep an old phone because they "don't know what to do with it" and 17%
stated being "too lazy" to get rid of them. Up to 60% of the Norwegian population has more than two
mobile phones at home that are not in use, which corresponds around 10 million mobile phones
(Baxter, Margareta et al. 2015). Consumers could be incentivised to sell their old devices if made
aware of their value as well as the existence of re-sale markets/platforms. Some of these are facilitated
by deposit-refund systems introduced by some original equipment manufacturers to promote the
return of used phones and secure product supply for refurbishing or recycling (Cordella, Alfieri et al.
2020).
During May-June 2020 a study was conducted focusing on the mobiles under 4 years kept in
household stocks in Sweden (Halebop 2020, VIA 2020). Kantar Sifo conducted a web-based survey on
behalf of a mobile operator and a second-hand actor Halebop. The survey received 1,170 responses
from population aged 18–79 (Halebop 2020).
Main conclusions:
- 22% of the respondents owned more than one unused functional mobile phone (Report C 588-P Reusability and the potential environmental impact of small electronics – Literature review and
discussion
If scaled on the national level, around 2 million functional mobile phones under 4 years old are kept
at homes unused (Table 1). Assuming that a mobile phone weighs around 200 g (e.g. iPhone 6), it
makes about 456 tons of phones in household stocks storage.
Table 1. Functional and unused mobile phones in Swedish households.
Quantity of stored mobile phones under Share of At national level *
4 year old population in the
survey (%)
1 pc. functional unused mobile phone 17 1 385 000
2 pc. functional unused mobile phones 4 651 800
3 pc. functional unused mobiles phones 1 244 000
None unused mobiles phones at home 77 0
(Report C 588-P Reusability and the potential environmental impact of small electronics – Literature review and
discussion
Figure 2. WEEE in stocks in Sweden (in pieces) Source: www.urbanmineplatform.eu
According to the database of EEE in stock vs. use in Sweden 3 the statistics (projection for 2020) are:
- 158,000 tons or ca 101 million pieces of small IT;
- 868,000 tons or 808 million pieces of small equipment.
The database also presents information about the available materials in stocks related to small
electronics per country based on composition rates (Table 2).
Table 2. Estimated amounts of metals in small electronics in stocks (based on data from
www.urbanmineplatform.eu)
Materials Quantity of materials in small IT EEE in Quantity of materials in small EEE in
use and stocks (tonnes) stocks (tonnes)
2015 2020 (projected) 2015 2020 (projected)
Gold (Au) 1.8 1.9 0.4 0.4
Silver (Ag) 8.0 8.5 4.9 5.3
Platinum (Pt) 0.016 0.017 0.002 0.002
Paladium (Pd) 0.398 0.426 0.13 0.1
Copper (Cu) 2 687 2 897 40 983 49 117
Aliuminium (Al) 3 902 4327 56 446 63 898
Iron (Fe) 59 909 65 720 323 687 380 472
Several shortcomings should be noted for the presented estimations:
- Data for 2016-2020 are projections at the time of the study;
- Exports, as well as formal and informal reuses in Sweden were not included in the
calculations. The data about the stocks include also electronics in use.
- Assumptions on the compositions of electronics (these are rather dynamic and can be
outdated for today).
3 www.urbanmineplatform.eu
10Report C 588-P Reusability and the potential environmental impact of small electronics – Literature review and
discussion
2.3 The potential for reuse of stored electronics
Since, electronics kept in stocks are not always possible to reuse, this chapter discusses what could be
important when evaluating the potentials for reusing vs recycling defunct EEE stocks:
- Durability vs functionality – whether still functioning electric and electronic products could
be cost-effectively repaired for reuse; and
- Obsolescence – whether products can still be reusable due their technical upgradability or
(probably most important) consumers preferences.
2.3.1 Durability
Many electronic products can physically function beyond their technological or designed lifetime,
i.e. the maximum time that a manufacturer intends its product to remain functional. This refers to a
potential mismatch between regular functionalities and performance demands induced by software
and other functional regularly made upgrades available in the sector. Much is or can be decided at the
product design stage, including materials, design quality, repairability, upgradability and software
upgradability. These main factors determine products’ durability or “the ability of a product to remain
functional when faced with the challenges of normal operation over its lifetime”(Bachér, Dams et al. 2020).
There is no consensus on the average designed lifetime and even less on durability of electronics and
information available from the literature in not consistent. For instance, designed lifespan for
smartphones may vary from 2 till 8 year, with a median around 5 years (Cordella, Alfieri et al. 2020).
Laptops can last 3-5 or even more years, notebooks such as iPads on average around 4 years (Walter
2020). Estimates may depend on different definitions of designed or actual lifetime (see the section
below). They also depend on how the consumers use their products, e.g. how often batteries are
charged, or their technical capacity to be upgraded.
The designed lifetime could be prolonged by in-built repairability of products. Recently, there are
more and more debates about the so-called intentional technical obsolescence, i.e. producers
intentionally shortening the life span of electronics in order to increase the profits related to new sales
(e.g. slowing down after software upgrades or making not possible to easily replace the batteries).
The EU-parliament is currently discussing suggestions to introduce mandatory labelling for lifespans
and reparability for some electronic products, such as mobile phones and washing machines in order
to inform consumers on its potentials for re-use (Valtersson 2020).
2.3.2 Obsolescence
Another important aspect is the “moral obsolesce” of EEE products. Consumers often are not willing
to use older EEE products even if they are functional when new products are available. This creates a
gap between the actual life span and the lifespan in consumption. Important factors here are related
to products’ properties, opportunity costs and consumer’s attitudes which in turn depend of the
societal norms, values, and general social and cultural trends (Valtersson 2020).
Often the emotional and socio-economic factors shorten the functional (actual) lifespan of EEE
products (Bachér, Dams et al. 2020). Wieser et al. (2015) found that the actual lifetime is positively
related to a consumer’s age, household income and educational level. Watson, Gylling et al. (2017) shows
11Report C 588-P Reusability and the potential environmental impact of small electronics – Literature review and
discussion
that old phones are more often replaced due to the desire to have the newest model rather than
performance related issues (Figure 3).
want latest
software
13%
existing
phone not
functioning
40%
want latest
phone model
47%
Figure 3. Reasons of purchasing a new phone (Watson, Gylling et al. 2017)
There is little consensus on the average actual lifetime of electronics. A systematic analysis of actual
lifetimes in the EU is presented by Balde in the Table 3. The average lifespan of small electronics
(Weibull distribution based on surveys in the Netherlands) is shown in Table 3 below. Other
examples from the UK and El-Kretsen in Sweden are presented in Figure 4 and Table 4.
Table 3. The average lifespan of small electronics (Weibull distribution based on surveys in the Netherlands).
(Source: K. Balde, 2020)
UNU_Ke Name According to WEEE directive Year Shap Scale α
y classification (EU-6) eβ
0114 Microwaves (incl. combined, excl. 5 Small equipment 2018 2.07 17.99
grills)
0201 Other Small Household (f.i. small 5 Small equipment 2018 1.22 7.97
ventilators, irons, clocks, adapters)
0202 Food (f.i. toaster, grills, food 5 Small equipment 2018 2.02 11.02
processing, frying pans)
0203 Hot Water (f.i. coffee, tea, water 5 Small equipment 2018 1.18 7.61
cookers)
0204 Vacuum Cleaners (excl. professional) 5 Small equipment 2018 1.22 10.59
0205 Personal Care (f.i. tooth brushes, hair 5 Small equipment 2018 1.2 8.09
dryers, razors)
0301 Small IT (f.i. routers, mice, keyboards, 6 Small IT and 2018 1.3 6.15
external drives & accessories) telecommunication
equipment
0302 Desktop PCs (excl. monitors, 6 Small IT and 2018 1.8 10.33
accessories) telecommunication
equipment
0303 Laptops (incl. tablets) 2 Screens, monitors, and 2018 1.94 8.76
equipment containing screens
(..)
0304 Printers (f.i. scanners, 6 Small IT and 2018 1.88 9.31
multifunctionals, faxes) telecommunication
equipment
12Report C 588-P Reusability and the potential environmental impact of small electronics – Literature review and
discussion
0305 Telecom (f.i. (cordless) phones, 6 Small IT and 2018 1.32 7.7
answering machines) telecommunication
equipment
0306 Mobile Phones (incl. smartphones, 6 Small IT and 2018 1.52 5.62
pagers) telecommunication
equipment
0401 Small Consumer Electronics (e.g. 5 Small equipment 2018 1.3 9.87
headphones, remote controls)
0402 Portable Audio & Video (f.i. MP3, e- 5 Small equipment 2018 1.5 10.01
readers, car navigation)
0403 Music Instruments, Radio, HiFi (incl. 5 Small equipment 2018 2.3 10
audio sets)
0404 Video (f.i. Video recorders, DVD, Blue 5 Small equipment 2018 1.14 8.33
Ray, set-top boxes)
0405 Speakers 5 Small equipment 2018 1.13 12.54
0406 Cameras (f.i. camcorders, photo & 5 Small equipment 2018 1.19 6.75
digital still cameras)
0501 Small lighting equipment (excl. LED 5 Small equipment 2018 1.42 8.72
& incandescent)
0506 Household Luminaires (incl. 5 Small equipment 2018 2.34 16.59
household incandescent fittings)
0507 Professional Luminaires (offices, 5 Small equipment 2018 2 12.5
public space, industry
0601 Household Tools (f.i. drills, saws, 5 Small equipment 2018 1.77 14.98
high pressure cleaners, lawn mowers)
0701 Toys (f.i. car racing sets, electric 5 Small equipment 2018 1.43 4.56
trains, music toys, biking computers)
0702 Game Consoles 6 Small IT and 2018 1.14 4.78
telecommunication
equipment
0801 Household Medical equipment (e.g. 5 Small equipment 2018 1.99 13.46
thermometers, blood pressure meters)
0901 Household Monitoring & Control 5 Small equipment 2018 1.55 5.89
(alarm, heat, smoke, excl. screens)
0 2 4 6 8 10 12 14
Flat screen monitor
Laptop
CRT TV
Printer
Flat screen TV
desctop
CRT monitor
small appliencies
Tablet
Keybord
Mouse
Smartphone
Wearables
Figure 4. An example of average lifespan of EEE in UK (Statista 2020)
13Report C 588-P Reusability and the potential environmental impact of small electronics – Literature review and
discussion
Table 4. Lifespan of electronic products according to Swedish producer organisation El-Kretsen 2012-2017
(Source: SMED, 2020)
Group Products Median age
Electric toothbrushes 8
Electric mixer 16
Household appliances
Power strip 18
Iron 14
Sewing machine 30
Waffle maker 20
Kombiapparater 7
Printer 10
IT and telecommunication
products Scanner 13
Copy machine 13
Mobile phone 5a / 8 b
Smartphone 4a / 5 b
Portable screen products Laptop 12 4
CD, tape recorder, Record Player 27
Audio-video Dvd, Vhs, Blu-ray player 13
Radio och receiver 24
a phones collected in 2017, b phones collected in 2012.
The above examples of product lifetime refer to an average time from purchase to discarding. As
some (especially small) electronic items are kept at home without being used for some time, the
greatest potential for their reuse is the time in stocks when the items are still within their designed
lifetime slots (period “1” in the Figure 5). In time, the reuse potential decreases (period 2) due to
changing consumer preferences and technological obsolescence. Idling products (e.g. mobile phones)
usually have low intrinsic value for their owners given there are more technologically superior
alternatives in the market. However, if there would be a deposit-value attached to a device, it may
motivate its owner to consider its re-use or recycling sooner than later. Higher awareness about the
environmental or social “good” by reusing disused electronic devices could also push some owners to
pass it on without a financial reward (e.g. to second-hand markets in less developed countries).
4According to other data source the average lifespan for a laptop is 18 year El-Kretsen (2019). Från återvinnare till råvarulevarantör –
plast och elektronik.
14Report C 588-P Reusability and the potential environmental impact of small electronics – Literature review and
discussion
Figure 5. Very simplified scheme for functional products lifetime in stocks and its potentials for reuse. (1) –
refers to greatest potential for 2nd life, (2) – refers to decreasing potential off 2nd life
Clearly, the reuse potential of stored electronics decreases with time. So far, we have very little to no
data about the value-thresholds for reuse for different products. Data by Balde (Table 3) and SMED
(Table 4) refers to the age of products reaching their end-of-life but does not detail for how much
longer disused products may have been kept in stock before entering different waste streams. The
variation could be significant between different product groups (e.g. higher quality/more valuable
electronics). The reuse potential might increase in other (lower purchasing power) countries, where
also life extension by cheap repairing of the products is more available.
Box 1. Example of smartphones.
An estimated designed lifetime of a smartphone in Germany is 2-8-years with the average use time
of 2 years reaching its end-of-life at 6th year (Cordella, Alfieri et al. 2020). In other countries, like
e.g., Sweden, smartphones on average reach their end-of-life at around 4th year (Table 4), although
more than half of Nordic consumers have a smartphone for less than two years (Deloitte 2019).
If functional phones are kept in stock after the 2 years of their average use, the remaining
functional lifetime is in the range of 2-3 years depending on quality and upgrades. According to
Halebop, at least 20% of consumers still at least 4-year-old functional phones at home,
corresponding to around 2 million units in Sweden (Halebop 2020).
Shares of phones in storage and those given/sold for 2nd life is not well known in Sweden. Studies
in Germany and the U.S. showed that up to two thirds of smartphones live a 2nd life (Cordella,
Alfieri et al. 2020). Products of best quality are typically re-circulated in domestic markets and can
be competitive with mid- to low-end device depending on depreciation rates of different brands
and the perceived quality. Products of lower quality usually are destined to markets with lower
purchasing power.
There is still a knowledge gap regarding how EEE is handled after their 2nd life. An investigation on
mobile phones of 2016 showed that up to 95 % collected by Swedish mobile providers go to reuse
in other European countries, of which ca. 35% end up in in Asia or Africa, in countries lacking
proper waste management systems (SverigesNatur 2016). The remaining EEE is either kept at
homes or go into end-of-life waste management system along with mixed municipal or sorted
electronic waste.
15Report C 588-P Reusability and the potential environmental impact of small electronics – Literature review and
discussion
Box 2. Example of vacuum cleaners.
For some electronics (e.g. home appliances) where consumer obsolescence plays a minor roll, the
reuse potential could be minor or even no-existent. For instance, a study by EIONET (Bachér,
Dams et al. 2020) argues that consumers expect standard mains-operated domestic vacuum
cleaners to last longer than they actually do (actual-life time is around 8 years vs expected lifetimes
of 10.3 years). For such products there is no or low reuse potential without available cost-effective
repair infrastructures. It is unlikely that larger functional home appliances, such as vacuum
cleaners (except smaller, like robot vacuum cleaner) are kept at home unused.
2.3.3 Functional vs dysfunctional electronics
Unused EEE items kept at home could be divided into functioning and dysfunctional.
The potential of reusing dysfunctional EEE is usually very low, especially for items of low economic
value (e.g. old toys) or outdated electronics (e.g. ICT, above their designed lifetime). Their repair costs
are often much higher than the residual value. Some EEE products lose value rather rapidly. In
Europe, for instance, the value of a smartphone is halved after 1 year and can be as low as 20% of the
original value after 3 years. Meanwhile, replacement of a broken display can cost about 15-40% of the
products original price and up to 10% for other smaller repairs (see Table 5). Only products of higher
economic value (such as ICT products) could be potentially reused if their repair requires minor
efforts/resources (e.g. change of batteries). The reuse potential might increase if cheaper repairs are
available (e.g. in countries with lower labour costs). Some companies, like e.g. GEAB in Lund
(Sweden) exploits the lower repair costs in other countries, like Poland, where repaired phones are re-
sold for reuse.
Table 5. Summary of information on products costs for smartphones (Europe)
Cost category Average value (based on values in 2018)
Purchase price
- Low-end < 130 EUR/product
- Medium 320 EUR/product
- High-end >480 EUR/product
Value of product (reuse) 54% of original price after 1 year, 32 % of after 2 years, 20% after 3 years
Repair/refurbishment costs About 15-40 % of the product price for display; usually above 10% of the
products price for other repairs
Source: Cordella, Alfieri et al. (2020) OBS. Values includes VAT, lower VAT for repair is used in Sweden.
Meanwhile functional EEE have a much higher potential to be reused, but it still depends on a
product group. Some products, like e.g. ICT (smartphones, tablets and laptops) are perceived to age
rapidly by consumers and their demand for a 2nd life might be uncertain. For some rapidly aging
products, the quality, brand and make might play a positive role. However, little information is so far
publicly available. Companies repairing large volumes of used electronics, like Inrego, might have
useful insights in such issues.
16Report C 588-P Reusability and the potential environmental impact of small electronics – Literature review and
discussion
3 Potential impacts/benefits of circular solutions
The potential environmental impact of a deposit-refund system for EEE depends on how it balances
with the existing management systems for WEEE. This chapter discusses several potential outcomes
induced by the introduction of a deposit-refund system for small electronics and discusses the
pathways of:
- Increased recycling vs incineration;
- Increased recycling vs storage;
- Increased domestic reuse vs recycling.
As data were not sufficient for any meaningful quantitative calculations of scenario impacts, the
discussion is based on qualitative evaluation based on a few examples. Hence, the discussion should
be regarded merely as a theoretical elaboration of possible impacts. Better insights require more
examples and in particular, more Swedish-based case studies.
3.1 Increased recycling vs incineration
3.1.1 Current situation
Some electronics (most often small) might enter mixed waste flows, and thus later end up in landfills
or are incinerated. According to several compositional studies for mixed household waste in Sweden,
in 2018 around 0.5 % of total municipal waste by weight were diverse WEEE and batteries (Avfall
Sverige 2019). According to another study (Avfall Sverige 2016), around 70% of this flow is electronics
(i.e. excluding batteries and other hazardous waste). In 2019, 2.42Mt of mixed household waste was
incinerated (Avfall Sverige 2019), which translates to ca. 8 000t of small electronics. This data is
uncertain regarding the types of electronics that enter the mixed waste flow, i.e. whether they are
smaller than 50 cm or it could also include products such as light bulbs, which are not in the focus of
this study. How much of WEEE ends up in mixed waste flows from commercial and waste imported
for incineration is even less known.
If considering that around 74,300 tonnes of small electronics are consumed annually in Sweden 5
(SMED, 2020), this makes that around 10% end up in incineration. As this stream most likely contains
electronics of low economic value, a potentially large part of it could be affected by a deposit on EEE
in terms of more organised returns.
3.1.2 Potential impact/benefits
In order to estimate the potential environmental impact of WEEE, both the composition of
the WEEE (by products) and the average composition (by materials) within different
product groups needs to be investigated, since large variations in terms of materials exists
among different product groups.
5 Internal consumption=import+production-export
17Report C 588-P Reusability and the potential environmental impact of small electronics – Literature review and
discussion
At this point, we could not find relevant empirical assessments comparing recycling and
incineration of just WEEE flows that enter incineration in Sweden. However, there are some
available examples that can illustrate the benefits of recycling.
3.1.2.1 Recycling
There several potential benefits of WEEE recycling in formalised (regulated) waste management
systems:
1. Material efficiency and related environmental benefits.
- Direct environmental savings. WEEE contains a large variety of materials. The extraction of
some materials (e.g., precious metals, CRMs) can have large environmental footprints due to
high energy intensities, risks of pollution at material extraction places, associated greenhouse
gas (GHG) emissions, significant amounts of solid waste and different social impacts in less
regulated countries). The recycling of several materials present in WEEE usually has lower
environmental and social burdens. A replacement of primary materials by secondary
materials, can contribute to potentially high environmental savings.
- Indirect environmental savings. Recycling of critical raw materials from WEEE might
address the supply volatility of several critical raw materials, especially if they sourced from
countries with unstable socio-economic systems or those holding the monopolies of supply.
Many critical materials are highly relevant to enable sustainable technologies (such as solar
panels, wind power equipment, electrical cars etc.), thus limitations in access to such
materials might indirectly compromise the future of green innovations.
2. Socio-economic benefits:
- May contribute to higher supply security of CRMs and other valuable materials required in
different high-tech sectors. Virgin deposits of CRMs increasingly required by the ICT and
other sectors are situated in politically unstable countries. Some countries outside the EU
today stand for up to 95% of mining and extraction of rare-earth elements, which makes the
EU reliant on imports. Increased recycling of CRM from WEEE in the EU might contribute to
securing the supplies. In some cases, the working conditions at specific sites can be sub-
standard by the modern requirements (Bachér, Dams et al. 2020), which can be indirectly
prevented if more CRM recycling took place in the EU.
- May contribute to conflict avoidance. The extraction of some virgin materials for EEE is
often located in conflict zones. Usually, armed groups finance their activities by informal
minim of critical raw materials based on underpaid or even forced labour. For instance, the
critical raw material tantalum (used in capacitors) is extracted from the columbite-tantalite
ore mined in conflict zones, such as Rwanda and Congo (Miliute-Plepiene and Youhanan
2019).
- Economic benefits. WEEE contains many valuable materials, such as rare and precious
metals. Their recycling from WEEE may break even with virgin materials and bring economic
and job-related benefits. There are little to no technological limitations for this, except for
possible inefficiencies in WEEE management and insufficient volumes for economic actors to
18Report C 588-P Reusability and the potential environmental impact of small electronics – Literature review and
discussion
justify their costs. Reducing WEEE losses and improving sorting can provide more economic
viability for CRM recycling from WEEE (Miliute-Plepiene and Youhanan 2019).
The main economic and often the environmental benefits of WEEE recycling relate to the presence of
valuable materials, and it is important to better understand the composition and the volumes of
different WEEE streams. An example of composition is presented in tables below.
Especially ICT products contain many critical materials. For instance, of the 83 stable and non-
radioactive elements in the periodic table, more than 60 can be found in smartphones(Cordella, Alfieri
et al. 2020). The majority are metals and some like iron and aluminium, available in large quantities.
Precious metals, such as gold, have since long ago been for interest for the recycling industry.
Table 6. An example of materials present in smartphones and its use. Blue – critical raw materials (CRMs),
gray – conflict materials (Based on Manhart A, Blepp M et al. (2016) & Andrae A. (2016) in (Cordella, Alfieri et
al. 2020))
Material Common use in smartphones Content per smartphone Content per smartphone
(g) (Based on Manhart et (g) (Based on Andrae
al. 2016) 2016)
Aluminium (Al) Case 22.18 8.69
Cooper (Cu) Wires, alloys, magnetic 15.12 36.25
shielding, PCB, speakers,
tactile engines
Plastics Case 9.53
Magnesium (Mg) Case 5.54
Cobalt (Co) Lithium-ion battery 5.38
Tin (Sn) Solder paste 1.21 2
Iron (steel) (Fe) Case 0.88 16.25
Tungsten (W) Vibration alert module 0.44
Silver (Ag) Solder, PCB 0.31 0.198
Gold (Au) PCB 0.03 0.121
Neodymium (Nd) Speakers Magnets 0.01
Tantalum (Ta) Capacitors 0.02
Indium (In) Display 0.01
Palladium (Pd) PCB 0.01 0.034
Gallium (Ga) LED-backlights 0.0004
Gadolinium (Gd) LED-backlights 0.0002
Europium (Eu) LED-backlights 0.0001
Cerium (Ce) LED-backlights 0.00003
Nickel 1.5
Zinc 1.213
Acrylonitrile 22.500
butadiene styrene
Poly(methy 1.875
methacrylate)
PA (Nylon) 1.625
PVC 18.750
Polyethylene-high- 8.625
density
19Report C 588-P Reusability and the potential environmental impact of small electronics – Literature review and
discussion
Material Common use in smartphones Content per smartphone Content per smartphone
(g) (Based on Manhart et (g) (Based on Andrae
al. 2016) 2016)
Polyester (e.g. 2.875
polyethylene
terephthalate)
Polycarbonate 2.625
Polypropylene 1.313
Polyurethane 1.625
Epoxy 20.000
Fiberglass 43.750
Glass 33.750
Others (glass, ceramic, 99.29
semiconductors)
Total 160 225.56
Table 7. Examples of material composition in ICT products: I-II notebooks (laptops), IX – cell Phones, X -
smart phones, XIV – tablets (Cucchiella, D’Adamo et al. 2015).
20Report C 588-P Reusability and the potential environmental impact of small electronics – Literature review and
discussion
Other small electronics, such as home appliances contain more “conventional” materials, e.g. 25- 80%
of bulky metals (iron, copper, steel) and up to 6-60 % of plastics (Table 8).
Table 8. Average material composition (%) of small home appliances groups (based on information from
(Magalini F., Kuehr R. et al. 2017)
Materials Food Hot Microwaves Personal Vacuum Other
processing water care cleaner small
ketlle household
appliances
Total share of 52.1 60.4 80.8 51.8 25.5 59.62
metals
Aluminium 11.5 4.3 0.47 4.0 5.1 10.2
Coper 6.2 4.6 12.5 20 3.5 3
Coper 2.1 0.13 0.1 0.38 0.05 0.05
+Aluminium
Stainless steel 6.7 1.8 0.92 6.3 4.2 0.87
Steel 25.6 49.6 66.8 21.1 12.6 45.5
Total share of 32.33 18.62 5.9 30.3 60.7 16.9
plastics
Acrylonitrile 0.45 2.9 1.5 3.2 10.8 5.8
Butadiene Styrene
Polystyrene - - 0.09 1 - -
Polyamide 1.5 1.1 - 4.9 - -
Polycarbonate - 0.04 0.05 0.2 - -
Polyethylene - 0.02 0.03 0.28 - -
Polypropylene 6 7.4 0.59 2.6 5.1 1.4
PVC 0.18 0.26 0.63 0.12 2 0.3
Other Plastics 24.2 6.9 3.1 18.0 42.8 9.4
Glass 1.3 7.6 6.4 0.53 - -
Concrete - - - 0.02 - -
Electronics 1.4 3.3 2.4 1.3 0.21 0.26
Other 12.9 10 4.6 16 13.8 23.6
Typically, ICT related product groups compared to “simple” households’ appliances are more
valuable from economic or the environmental point of view per product. However, due to the fact
that ICT waste is usually smaller in size and tend to be more dispersed, the benefits of recycling
between those two groups is not always clear and depend on waste volumes and collection and
recycling efficiencies.
An IVLs study of 2015 (Ivert L. K., Raadal H.L. et al. 2015) looked at the potential environmental
impacts of material production for various EEE fractions in different EEE categories to gauge the
potential environmental savings from their recycling (Figure 6). Recycled materials can replace virgin
materials, which often gives environmental savings. The potential GWP benefit of recycling was
found to be much greater and negative effects of emissions from extra transportation were negligible,
although it should of course be made as efficient as possible. The largest environmental impacts were
found in ICT products for abiotic depletion and toxicological impact categories, dominated by the
lifecycle of silver and copper. Toys, leisure and sports equipment were found to have high
environmental impacts, mainly due to high content of plastics of fossil origin and high energy
intensities. The study clearly showed there are clear potential savings from recycling, although
several shortcomings could be pointed out:
21Report C 588-P Reusability and the potential environmental impact of small electronics – Literature review and
discussion
- The study was based on an older WEEE classification (changed according to new version of
WEEE directive since August 14th in 2018);
- Some environmentally “charged” elements such as gold and other precious metals were not
included in ICT compositional analyses, which may have resulted in an underestimation of
some environmental benefits (of recycling), such as e.g. GWP;
- The study merely analysed the fact of the presence of materials in WEEE, which in reality
does not mean that they are recycled (some materials are not feasible to recycle today).
22Report C 588-P Reusability and the potential environmental impact of small electronics – Literature review and
discussion
Figure 6. Potential environmental impact from material production of one kg of the respective EEE fractions. For GWP category EEE compared to 1000 km transport of one kg
WEEE (Ivert L. K., Raadal H.L. et al. 2015)
23Report C 588-P Reusability and the potential environmental impact of small electronics – Literature review and
discussion
24Report C 588-P Reusability and the potential environmental impact of small electronics – Literature review and
discussion
Currently, WEEE recycling in Sweden (as well as many other countries) still focuses mainly on
precious materials and bulk materials (Figure 7). Partly technically and mainly economically it is not
feasible to recycle a range of critical materials such as rare earth elements (REE). However, many
precious metals (e.g., gold, palladium, silver) and other bulk ferrous and non-ferrous metals (e.g.,
iron, steel alloys, copper and aluminium) have significant environmental benefits if their recycling
replaces virgin uses.
Figure 7. Material composition of separately collected category “diverse electronics” and its recycling
according to El-Kretsen; small and ICT electronics are likely to end up as “diverse” (data by El-Kretsen
(2019)).
Material recycling of precious and rare metals can give significant economic benefits, for which
reason they are indeed recycled. Table 9 illustrates average market prices around 2019 for different
metals alongside their estimated quantities in different products. The total value of recyclable metals
present in 1 mlj pieces of electronic device may vary between 20 and 70 bil. kr in smartphones and up
to 120 bil. kr in the laptop computers.
Publications detailing the content of critical and precious metals in different kinds of EEE show
significant differences in the reported values, which means that at best the information should be
used as an estimate of the magnitude of the amounts in different product groups. The differences
could be explained by product diversity in a group, ways to measure the material content (e.g.,
experimental vs. theoretical) and that material content changes with time (higher concentrations in
older products)(Bakas, Herczeg et al. 2016). Therefore, the materials’ content of critical metals in
different product groups presented here should be seen only as indicative.
25Report C 588-P Reusability and the potential environmental impact of small electronics – Literature review and
discussion
One of current and future challenges to increase the recycling of precious metals in WEEE is the
diminishing concentrations of precious metals on a per product level. Technological advancements
(e.g. ever thinner conductive interconnects in microchips or thinner contact layers on printed circuit
boards (PCBs)) allow reducing the intensities of rare/precious metals per product. However, with the
increasing consumption of EEE the use of environmentally sensitive materials in EEEs is still going to
increase, albeit the decreasing concentrations, which impedes recycling(Jilvero, Sjölin et al. 2017).
Therefore, the economic effect of recycling depends on WEEE collection efficiencies, reduction of
losses in waste management chains, recycling efficiencies, quality of recycled materials and price
levels of virgin materials.
26Report C 588-P Reusability and the potential environmental impact of small electronics – Literature review and
discussion
Table 9. Illustration of the value of metals (SEK) per 1 million pieces of EEE devices.
Materials Average LCD
price, kr/kg Smartphon Smartphone Simple phone notebooks Notebooks
(4) e (1) (2) Smartphone (3) (3) Tablets (3) (3) (3)
Iron (steel)
(Fe) 3 2,213 40,874 2,0122 2,7668 0 0 0
Aluminium
(Al) 21 462,384 18,1160 60,456 250,163 0 0 0
Copper (Cu) 56 851,054 2,040,391 788,013 1,463,453 1,519,740 7,598,699 7,598,699
Silver (Ag) 4925 152,6776 975,166 1,201,720 4,925,083 246,254 1,231,271 1,231,271
Gold (Au) 425624 12,768,733 51,500,558 16,173,729 10,214,987 18,727,476 93,637,378 93,637,378
Palladium
(Pd) 456026 4,560,262 15,504,890 6,840,393 4,104,236 3,648,210 18,241,048 18,241,048
Total, kr 20,171,423 70,243,039 25,084,434 20,985,590 24,141,679 120,708,395 120,708,395
Data estimated based on data reported in: (1) Manhart et al. 2016, (2) Andrae 2016, (3) Cucchiella, D’Adamo et al. (2015)(4) U.S. Geological Survey (2020)
Table 10. Illustration of composition (g) of different materials in ICT products.
Materials Smartphone Smartphone Smartphone Simple LCD Notebooks
(1) (2) (3) phone (3) Tablets (3) notebooks (3) (3)
Iron (steel)
(Fe) 0.88 16.25 8.00 11 0 0 0
Aluminium
(Al) 22.18 8.69 2.90 12 0 0 0
Copper (Cu) 15.12 36.25 14.00 26 27 135 135
Silver (Ag) 0.31 0.20 0.24 1 0.05 0.25 0.25
Gold (Au) 0.03 0.12 0.04 0.024 0.044 0.22 0.22
Palladium
(Pd) 0.01 0.03 0.02 0.009 0.008 0.04 0.04
Total weight,
g 160 230 120 80 500 3,500 3,500
Data sources (1) Manhart et al. 2016, (2) Andrae 2016, (3) Cucchiella, D’Adamo et al. (2015)
27Report C 588-P Reusability and the potential environmental impact of small electronics – Literature review and
discussion
3.1.2.2 Incineration
Although, we were not able to identify reliable information on the environmental impacts of WEEE
incineration, it is clear that it generates more environmental burdens than benefits. To the benefits
belong the energy content of plastics and the benefits from the recovery of easily recoverable
ferrous metals, although their value and quality is generally low. Other metals in WEEE (often
toxic) remain in the ashes and can pose several environmental and health risks.
3.2 Increased recycling vs stock storage by households
A deposit system can likely facilitate an increased collection of electronics that are kept by
households. The exact quantities of WEEE kept in disused product stocks is not certain. Statistics
are not existent except for some anecdotal evidences from few case studies based on surveys or
material balances (see chapter 1). It is rather evident that storing small valuable electronics at home
past their technical or practical use time is quite common, which implies a delay before older EEE
reach waste management systems or are being lost with other waste streams.
The longer the stocks are kept idle, the fewer possibilities there are to reuse old products before
they could be directed to remanufacturing or recycling. Material recyclers might potentially find
more value in older product stocks due to higher content of valuable materials. However, product
reuse has more environmental benefits than recycling and might bring even economic benefits. In
addition, stockpiling of WEEE by households can create certain risks, such as potential leakages or
fires caused by old batteries or releases of harmful substances present in old plastics. From these
two perspectives policy instrument, which would accelerate the forwarding of disused EEE to
reuse, remanufacturing or recycling, might be beneficial.
Another debatable question is whether or not a delay of WEEE in household stocks is actually
beneficial for the extraction of rare materials, given the current lack of technologies, volumes or
economic feasibility. Future waste management systems are likely to be more material efficient
including better sorting and fewer losses in waste management chains. At the moment this remains
a rhetorical question not supported by rigorous research or robust empirical evidences.
3.3 Increased reuse vs in stocks
This section shortly discusses the potential impacts of increased collection and domestic reuse vs
recycling. If the alternative is incineration (reuse vs incineration) the benefits of reuse would be
unquestionable (see the section “increased recycling vs incineration”).
3.3.1 Current situation
The quantities of small electronics in household storage and suitable for reuse are at large
unknown. So far, our insight suggests that about 20% of the Swedish population keeps about 2
million of disused mobile phones at home in a more or less permanent stock. These are largely still
suitable for a second life.
28Report C 588-P Reusability and the potential environmental impact of small electronics – Literature review and
discussion
More accurate estimates would need a more precise information about the age, functionality and
quantities (units or weight) in different categories. Purchasing data (on the basis of physical units
or new or extended subscription) are likely to be available through market research. Data about
annual collections by large re-users, such a e.g. Inrego, which stand for significant a market shares
of reuse/remanufacturing services might also be useful for more precise estimates of stocks vs. re-
use. Data from other large waste management players, such as e.g. El-Kretsen, could help estimate
the number of disused EEE falling into waste management schemes. Additional information could
be gathered from case studies with large send-hand players, such as e.g. Blocket, Swappie or
Tradera, who handle a certain share of aftersales in the consumer-to-consumer market segment.
The frame and scope limitations of assessment did not allow any deeper data mining along these
lines. Nevertheless, we think our suggestions are valuable for future evaluations.
3.3.2 Benefits of re-use vs recycling
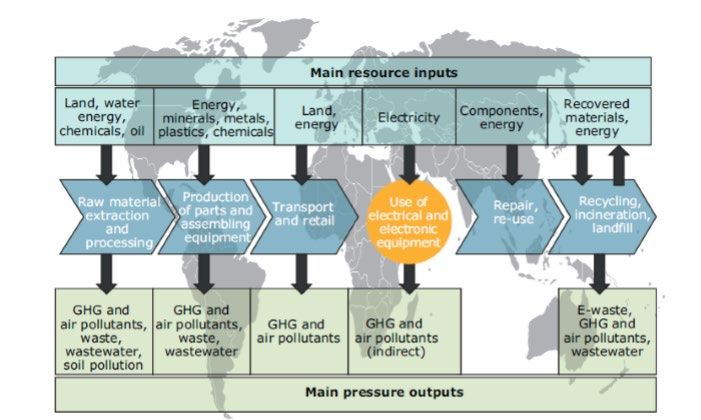
As presented in previous section, the lifecycles of many small technology-rich EEE products are
energy-, material-, and pollution-intensive (Figure 8). Still functional, not too old and high-quality
EEE products have the greatest potential for reuse, especially those with high potential for
technological obsolescence, e.g., IT and telecommunication products. An extension of the lifetime
of such products by reuse can potentially bring much more significant environmental benefits than
recycling.
Figure 8. An overview of the main resource inputs and pressure outputs of electrical and electronic
equipment value chain. Source: (Bachér, Dams et al. 2020)
Reuse usually can bring environmental benefits by replacing virgin materials and delaying waste
stages. A negative side of energy using products might be energy efficiency in the use stage (for
new products), which for some product groups is still improving at noticeable rates. For small
hand-held EEE this is probably less of an issue (compare a mobile phone to a refrigerator). A re-use
29You can also read