FAO Corporate Environmental Responsibility - Strategy 2017 2020
←
→
Page content transcription
If your browser does not render page correctly, please read the page content below
FAO
Corporate
Environmental
Responsibility
Strategy 2017 – 2020
The designations employed and the presentation of material in this
information product do not imply the expression of any opinion
whatsoever on the part of the Food and Agriculture Organization
of the United Nations (FAO) concerning the legal or development
status of any country, territory, city or area or of its authorities,
or concerning the delimitation of its frontiers or boundaries. The
mention of specific companies or products of manufacturers,
whether or not these have been patented, does not imply that these
have been endorsed or recommended by FAO in preference to others
of a similar nature that are not mentioned. The views expressed
in this information product are those of the author(s) and do not
necessarily reflect the views or policies of FAO.

© FAO, 2017
Contents                                    i

   Acknowledgements                    ii

   Authors                             ii

   Peer review / Guidance              ii

   Key messages                       iii

   Executive summary                   v

Mandates & environmental governance   1

Where we stand                        3

Way forward                           8

Funding mechanism                     10

   Conclusion                         11

   Annexes                            12

ii
     		Acknowledgements
     This Strategy was produced under the direction of Jean Phillippe Decraene, Chief of the FAO
     Infrastructure and Facilities Unit, and Tina Mittendorf, FAO Environmental Sustainability
     Management Focal Point. Guidance was provided by Maria Helena M.Q. Semedo (FAO Deputy
     Director General Climate and Natural Resources), René Castro Salazar (Assistant Director
     General of the FAO Climate, Biodiversity, Land and Water Department), and Martin Frick
     (Director of the FAO Climate and Environment Division).

     Authors
     Ilary Ranalli & Mitchell Hall (FAO Corporate Environmental Responsibility team of the FAO
     Infrastructure and Facilities Unit).

     Peer review / Guidance
     Saulo Ceolin (FAO Office of the Director General), Werner Deutsch (FAO Office of the
     Director General), Ilja Betlem (FAO Legal and Ethics Office), Nadia Scialabba (FAO Climate
     and Environment Division), Vasily Popov (FAO Office of Strategy, Planning and Resources
     Management), Fernanda Guerrieri (Assistant Director General, FAO Corporate Services
     Department), David William McSherry (FAO Finance Division), Preethi Braganza (FAO
     Administrative Services, Travel Unit), Arslen Bounemra (FAO Administrative Services,
     Procurement Unit).
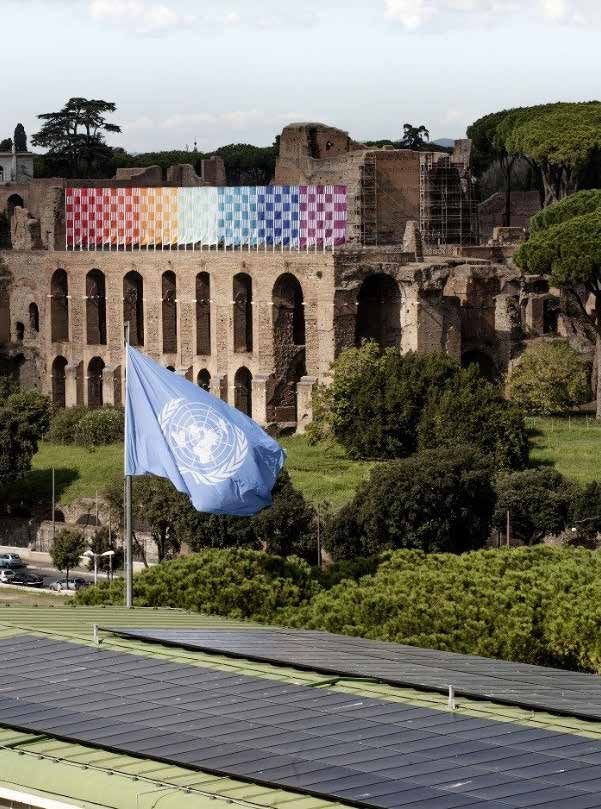
Key messages                                                                   iii

In 2007, the UN Secretary General Ban Ki Moon called the United Nations
to contribute to global efforts to safeguard our planet and climate. In
succession, the Chief Executives Board for Coordination officially decreed
their commitment towards this movement in October of the same year.

Since 2008, FAO adhered to the Moving Towards a Climate Neutral UN
initiative and began its long-term collaboration with the UN Issue
Management Group on Environmental Sustainability Management. The
Organization has monitored the carbon footprint of its functional operations
(facilities management, travel and fleet) and worked on several projects to
lower its environmental impact as a whole (cumulative reduction of over
10 000 000 kg of CO2 and over USD 1 000 000 since 2008).

On June 2016, FAO launched its Corporate Environmental Responsibility
Policy to reduce and eventually eliminate its potentially negative impact on
the climate. As a result, the Organization has already offset its emissions
relative to 2014 and 2015.

As part of the 2030 Agenda and in line with the Sustainable Development
Goals, with this Strategy FAO is committing to:
• Continue monitoring the environmental impact of its functional operations;
• Improve its ecological performance and reduce its GHG emissions by
  5.4% (as compared to the 2015 baseline) both at Headquarters and in
  Decentralized Offices and continue offsetting the remaining emissions that
  cannot be reduced;
• Embrace the circular economy principle when procuring goods and services
  and managing waste;
• Develop Environmental Management Systems for Offices.

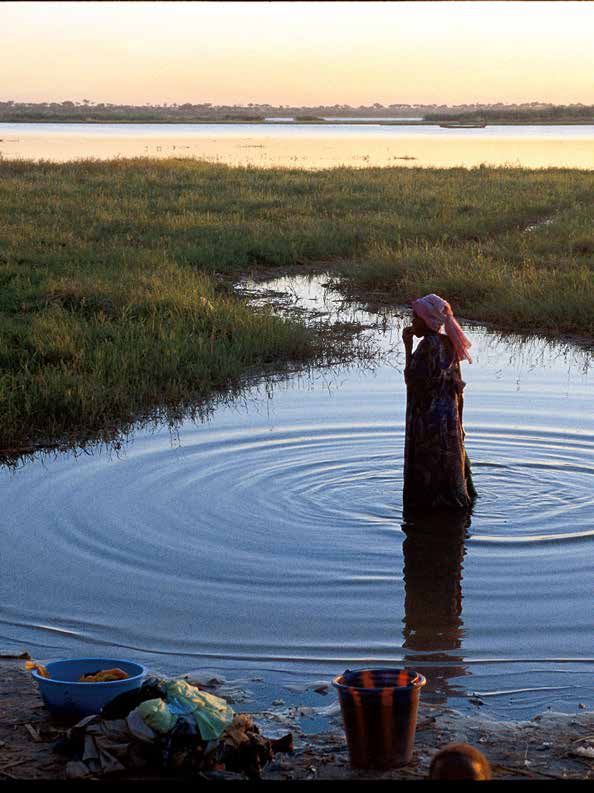
©FAO/M. Marzot
                 iv
Executive summary v In the past 8 years, FAO has monitored the carbon footprint of its functional operations (facilities management, travel and fleet) and worked on several projects to lower its environmental impact, in line with the Moving Towards a Climate Neutral UN initiative and in collaboration with the Issue Management Group on Environmental Sustainability Management. On occasion of the World Environment Day in June, 2016, the Organization launched its Corporate Environmental Responsibility Policy “as part of FAO’s commitment to reducing and eventually eliminating its potentially negative impact on the climate.”1 In line with the 2030 Agenda, FAO is committing to lower its environmental impact even further in order to fulfill the Organization’s mandate and Corporate Environmental Responsibility Policy. This Strategy includes an analysis of the current environmental performance of the Organization in the areas of Greenhouse Gas Emissions, energy efficiency, sustainable procurement, waste management and water usage. The Strategy also identifies the key steps needed to improve its ecological footprint, namely: • Adhere to the internal Corporate Environmental Responsibility Policy; • Continue monitoring of the environmental impacts from functional operations (i.e. Greenhouse Gas emissions, waste production, water usage) through annual Inventory exercises2 in compliance with UN-wide standards and in collaboration with the UN Issue Management Group for Environmental Sustainable Management (IMG); • Reduce approx. 5.4% of emissions stemming from functional operations in Headquarters and Decentralized Offices by 2020 (as compared to the 2015 baseline) through: -Energy use reduction measures -Transition from fossil-fuels to renewables; • Continue offsetting the remaining emissions that cannot be reduced through internal funding mechanism(s), as described later in this document; • Implement a circular economy strategy through: -Improved waste and water management practices, -Further efforts to sustainably procure goods and services; • Develop Environmental Management Systems to systematically improve the environmental footprint of key FAO Offices. 1 FAO Corporate Environmental Responsibility Policy, 2016. Available at fao.org/3/a-i5690e.pdf. 2 The latest report can be found at fao.org/3/a-i6991e.pdf.
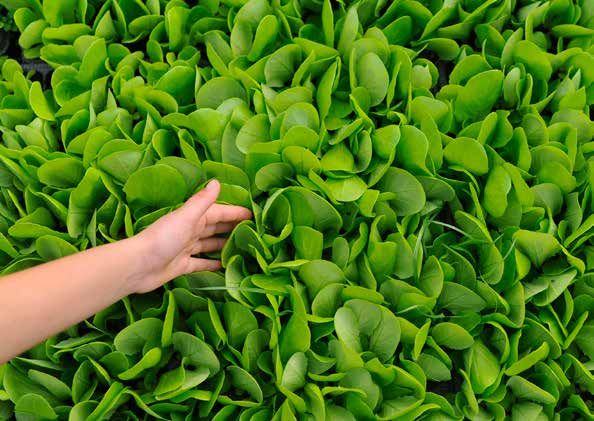
©FAO/G. Carotenuto
                         vi

                     •
Mandates & environmental 1
governance
In order to fulfill the Organization’s Organization’s global projects and
mandate and achieve its Strategic programmes, the Policy focuses on the
Objectives, FAO must utilize a significant environmental aspects of our functional
amount of physical and human resources operations (facilities management, official
in its operations – considering there over travel, and procurement). The three
500 global locations and more than 10 000 together form a comprehensive framework
personnel. These activities often carry with ensuring that any negative environmental
them environmental impacts which directly impacts stemming from the Organization’s
affect those most vulnerable whom the activities are minimized.
Organization strives to protect. While it is
impossible to completely eliminate these As the scope of corporate environmental
impacts in the foreseeable future, there are responsibility activities mainly focus on
many opportunities to reduce them. facilities, official travel and procurement,
this area has generally been managed
FAO joined the Moving Towards a Climate from within the FAO Corporate Services
Neutral UN initiative in 2008 after it Department (CS) – although often in close
was launched in 2007 by Secretary collaboration with other operational areas
General Ban Ki-moon and consequently including Energy and Tenure Division (NR),
endorsed by the Chief Executives Board Forestry (FO), Fisheries (FI), Security, Office
for Coordination (CEB) the following year. of Support to Decentralization (OSD),
Many other related commitments and Information Technology Division (CIO),
mandates have followed, which further Communications (OCC), and Partnerships
solidified the continuing attention to this (OPC). The current FAO Focal Point for
area.3 Particularly, FAO institutionalized Corporate Environmental Responsibility
its commitment to internal sustainability works in the Infrastructure and Facilities
with the publication of the FAO Corporate Management branch, as designated by
Environmental Responsibility Policy the Policy. Within this structure, the work
(Annex I) in June 2016.4 Complementary is managed through several internal
to the FAO Environmental and Social mechanisms:
Management Guidelines5 and Climate
Change Strategy6 which covers the • An Environmental Management System
(EMS)7, provides a systematic method
3 Some examples: UN Global Compact, UN General Assembly
Resolutions 66/288 ‘The future we want’, GA/Res/67/226, to track and monitor activities related
A/RES/67/215 (para 18) ‘Sustainable Development:
Promotion of New and Renewable Sources of Energy’, HLCM to environmental management and
decision on “Environmental Sustainability Management in also provide guidance on prioritizing
the UN System” 7-8 March 2013 and HLCM Strategic Plan
2013-2016, HLCM Strategic Plan 2013-2016. 7 It is a set of processes and practices modeled after international
4 Administrative Circular 2016/15, 7 June 2016. The standards (ISO-14001, EMAS) in-line with the UN Environmental
document is available at intranet.fao.org/fileadmin/user_ Management System Milestones Framework. The system has
upload/FAO_Communications/ac/AC16_15.pdf. been developed in response to the recommendations of the
5 FAO Environmental and Social Management Guidelines, High-Level Committee on Management (HLCM) and the CEB.
available at intranet.fao.org/fileadmin/user_upload/FAO_ A recent survey on the progress of UN agencies found that
Communications/ac/AC16_15.pdf. FAO ranked 2nd among the 17 surveyed in its progress towards
6 FAO Climate Change Strategy, available at fao.org/3/a-mr738e.pdf establishing an EMS.2
resources and related initiatives; • Ultimately implement and share best
• The Infrastructure and Facilities practices to lower the environmental
Management branch incorporates and footprint of the UN as a whole.
executes projects stemming from the FAO is actively involved in the
EMS – along with the normal branch mitigation and adaptation to climate
responsibilities – through its Activity change in the agriculture sector (crops,
Plan. Traditional operational activities livestock, forestry, fisheries) through
the achievement of its Strategic
and those related to environmental
Objectives.8 Moreover, the FAO Council
management are developed together
has recently endorsed the Report of
and seamlessly integrated. In this
the 25th Session of the Committee on
way, not only are the financial pieces Agriculture.9 Particularly, this document
considered, but also the environmental identified sustainable production and
aspects are weighed – often with climate change as the main priorities
synergetic results. (among the others) for FAO’s work in the
In the past 8 years FAO, along with Medium Term Plan 2018-21.10 Hence,
52 other UN agencies – which form Corporate Environmental Responsibility is
the Issue Management Group for paramount as part of the Organization’s
Environmental Sustainability Management work in supporting Member Countries
(hereafter known as IMG) – have to implement the 2030 Agenda for
strongly collaborated with UNEP and the Sustainable Development as well as the
Sustainable United Nations (SUN) group Paris Agreement on Climate Change.
on a variety of sustainability initiatives.
The collaborative efforts of the network
aim to:
• Monitor the environmental impact
of the UN system (through annual
inventory exercises dedicated to CO2
equivalent emissions, waste and water)
through the annual Greening the Blue
reports;
• Propose periodic Emission Reduction
Strategies and develop/implement
EMS’s; and
8 See the Strategic Objective 2 “Make agriculture, forestry and
fisheries more productive and sustainable”.
9 Report of the 25th Session of the Committee on Agriculture.
10 Unedited Report of the Council of FAO. Hundred and Fifty-fifth
Session. Rome, 5 – 9 December 2016 (page 2, point 10.a).Where we stand 3
FAO defines the quality of its work also by Monitoring
the degree to which it can reduce its impact
on the environment. For this reason, since In order to manage something, one must
2008 the Organization has translated its be able to measure and monitor it. Since
commitment to environmental sustainability 2008, an annual GHG inventory has been
into a holistic approach, which includes its conducted covering FAO’s global operations
functional activities. In line with several (2009 data not available). The charts below
SDGs, FAO has embedded environmental summarize the Organization’s emissions as
protection into its daily operations and absolute totals (Figure 1).12
developed a vision for environmental Figure 1. Emissions by year (tCO2e)
sustainability underpinned by targets in key 60
impact areas. 50
thousand tCO2e
40
Greenhouse gas emissions 30
The Paris Agreement set a very ambitious 20
agenda for the international community, 10
and recognized the critical role of -
companies and organizations in accelerating 2008 2010 2011 2012 2013 2014 2015
the challenging transition to a low-carbon Other Building related Air travel
future. Climate change can also be an
opportunity for growth and innovation In order to understand the overall expansion
though. FAO addresses climate change by: of our carbon footprint throughout the
years, it is important to highlight a few
• Conducting inventories of the tonnes changes to the Organization’s core business
Carbon Dioxide equivalent emissions and the GHG reporting methodology.
(tCO2e)11 it produces; First of all, despite an almost flat nominal
• Undertaking projects to reduce emissions budget and decline in posts overall, technical
and improve efficiency of operations; capacity in FAO has increased through the
• Offsetting unavoidable emissions. reinvestment of administrative reductions into
technical posts and resources. Moreover, the
Organization has remarkably invested in the
11 A greenhouse gas (or GHG for short) is any gas in the
process of decentralization – a key element to
atmosphere which absorbs and re‐emits heat, and thereby implement its strategy properly and to adapt
keeps the planet’s atmosphere warmer than it otherwise
would be. The main GHGs in the Earth’s atmosphere are its wide range of programmes and activities to
water vapour, carbon dioxide (CO2), methane (CH4), nitrous a constantly changing global environment. The
oxide (N2O) and ozone. GHGs occur naturally in the Earth’s
atmosphere, but human activities, such as the burning of fossil combination of these two factors has resulted
fuels, are increasing the levels of GHG’s in the atmosphere, in enhanced support to member countries
causing global warming and climate change. “Carbon dioxide
equivalent” or “CO2e” is a term used for describing different through FAO Decentralized Offices (DOs), but
greenhouse gases in a common unit. For any quantity and
type of greenhouse gas, CO2e signifies the amount of CO2
which would have the equivalent global warming impact. 12 Data available at the FAO Corporate Environmental
Responsibility 2016 Report.4
it has also sensibly resulted in an increase of The GRMS system was rolled out to FAO’s
air travel (e.g. +38% Travel Authorizations, TAs decentralized offices in 2013 and was fully
in 2015 as compared to 2014), which is FAO’s deployed and stabilized in early 2014. While
major source of emissions. Nevertheless, it is awaiting the final deployment of GRMS for
interesting to observe that – notwithstanding local air travel (i.e. in-country travel purchased
the increase in TAs – in the last few years by DOs) which should take place in 2017, we
there has been a drop in the quantity of can already observe a significant improvement
tCO2e emissions per TA (e.g. -20% in 2015 as of the reporting methodology and consequent
compared to 2014) and travelled kilometers increased reliability of the data.
per TA (-15%) (Figure 2). These ratios testify
that while FAO has travelled more to better Previous systems – e.g. Atlas Travel – did not
fulfil its mandate, it has done so on shorter allow for capturing the full TA itineraries but
distances and with a lower environmental only information about major destinations/
impact per project, in line with the airports; hence portraying only a partial
environmentally friendly air travel guidelines13 picture of FAO’s CO2e emissions from air travel.
implemented throughout FAO in 2012. On the contrary, having a more detailed and
granular understanding of each trip through
Moreover, FAO has significantly improved GRMS ultimately contributed to an overall
the monitoring of all Travel Authorizations increase in travelled km and CO2e emissions.
(TAs) raised at Headquarters (HQ) and in DOs.
Following the implementation of an Enterprise Lastly, while the greatest bulk of emissions
Resource Planning system (EPR) in November derives from air travel, a significant portion
2012, the recording of International travel has is due to FAO’s global facilities. In order to
moved from the legacy system (Atlas) to the better keep track of the energy situation in
Oracle based ERP system, known in FAO as the DOs and ultimately identify offices where
Global Resource Management System (GRMS). it is possible to implement energy saving
projects, the Corporate Environmental
Figure 2. tCO2e emissions and Km per TA Responsibility team has requested a stronger
1.20 participation of the DOs in the GHG
1.01 1.00 1.05 1.05
0.90
1.00 Inventory exercise. Local Focal Points have
0.84 responded to the call resulting in an 8%
0.80
increase of buildings accounted for in the
0.60
2015 exercise as compared to 2014.
0.40
0.20
In sum, the increase in CO2e emissions
reflects profound changes to the way the
0.00 Organization conducts its business, for
2013 2014 2015
tCO2e per TA Km per TA (0000) which reason the carbon footprint growth
can be partly justified. Nevertheless,
13 This relates to: the director-general’s bulletin 19 September
2013 No. 2013/54 “Official Travel of FAO Staff” which sets considering that climate change and its
limitations to amount of official travel; the FAO Manual physical, social and economic consequences
section 401.3.32 Travel by Air entitlement to economy vs.
business class travel rule. are being exacerbated by greenhouse gas
(GHG) emissions from human activities, FAO5
should further commit to reduce its own compare do 2012) and environmental (-20%
footprint and mitigate impacts. kWh consumption) standpoint (Figure 3 -
kWh and USD savings at HQ).
Reducing
While the scope of the work has expanded
The continuous monitoring through the over the years to include DOs as well, the HQ
GHG inventory exercises (and the HQ case study paves the way for an immediate
EMS) have resulted in the identification of strengthened support to these offices.
specific areas for improvement. Among the A network of Corporate Environmental
other way to address climate change, using Responsibility focal points, along with the
energy more efficiently helps reduce carbon even larger UN-wide web of focal points,
emissions, preserves our finite natural has so far provided a medium for sharing
resources and lowers costs.14 experiences and best practices with HQ
and among the DOs. The network presents
Projects implemented since 2008 related to new opportunities for collaboration in
Corporate Environmental Responsibility have the area of energy efficiency. There are
resulted in a cumulative annual reduction increasingly more energy supply issues in
of over 10 000 000 kg of CO2e in emissions various regions where FAO works (especially
while also achieving over USD 1 000 000 in in Africa), and this not only has financial
cumulative annual savings (Annex II). and environmental impacts, but also affects
the programme work for the offices and the
Activities in these areas historically focused
success of FAO delivering on its mandates.
on the HQ (e.g. corridor lighting upgrade,
Hence further technical and financial
solar photovoltaic system), with significantly
support is deemed necessary to ensure
positive results obtained both from a
operational efficiency in DOs.15
financial (-24% electricity costs in 2016 as
Figure 3. kWh and USD savings at HQ Offsetting
14 2.5
As part of the 2030 Agenda for Sustainable
12 Development, the IMG members committed
2.0
10 to be climate neutral as of 2020 (i.e. reducing
8 1.5 and offsetting the 2020 emissions reported
million USD
million kWh
in 2021).
6 1.0
4 Despite the fact that significant efforts
0.5 have been made in the past and shall
2
continue going forward, it has and will not
- - be possible in the near future to completely
2012 2013 2014 2015 2016
eliminate all of FAO’s emissions while still
14 This area of work is also particularly advantageous for the 15 A proposal for Capital Expenditure funding (FAO’s Strategy
Organization’s mandates and best interests, including financial for energy issues and reducing operational costs in
implications. Energy efficiency and conservation tie in directly to Decentralized Offices) that addresses these issues has been
FAO’s Strategic Objectives, particularly SO2: to make agriculture, drafted by CSAI in collaboration with OSD and CIO and is
forestry, and fisheries more productive and sustainable – with currently under review.
climate change being a major factor to contend with.6
effectively meeting its Strategic Objectives. Other areas of activity
For this reason, FAO purchased Certified
Emission Reduction credits (CERs) from the Besides energy and travel, other
Clean Development Mechanism (CDM)16 environmental impacts also occur from
which were invested into Adaptation Fund our operations, from waste management
projects17 - hence joining many other UN to water usage. It is worth mentioning
agencies in becoming climate neutral18. that while more difficult to accurately
quantify, great strides have been made in
Though FAO HQ achieved 8% emissions procurement, waste management and water
reductions (-257 tCO2e) in 2014 as usage through the FAO HQ EMS.
compared to the previous year, the carbon
footprint of the Organization as a whole Sustainable procurement
increased by 6% (+2,969 tCO2e). In order
to remedy this negative performance, FAO Many tenders and contracts have already
invested in Adaptation Fund projects that sought to maximize environmental
compensated for the unavoidable emissions considerations in the solicitation and
that FAO had produced in the same year. evaluation process of vendors while
Similarly, FAO achieved climate neutrality in continuing to ensure best value for
2015 by offsetting its remaining unavoidable money and in a way that does not
emissions. hinder competition. For example in 2015,
approximately 15% of all procurement
FAO can therefore claim climate neutrality tenders at HQ included some type of
for its 2014 and 2015 emissions19 and sustainability requirements20, as compared
– through its Corporate Environmental to 12% in 2014 and 8% in 2013. The focus
Responsibility Policy – it has committed to of sustainable procurement has so far
do so for the coming years. Notwithstanding been on FAO HQ’s purchases and contracts,
this huge progress, there is still a long hence more support could be given to
way ahead to further reduce emissions DOs (when feasible) and the commitment
(which remains the primary goal of the to procure sustainably could be officially
Organization) and consequently the institutionalized. Moreover, a better
unavoidable emissions to offset. monitoring system could be developed to
ensure that all sustainability practices are
16 The Clean Development Mechanism (CDM, http://cdm.
unfccc.int/) allows emission-reduction projects in developing captured and showcased for all product
countries to earn certified emission reduction (CER) credits,
each equivalent to one tonne of CO2e. A 2% levy on CERs is
types.
issued by the CDM to sustain the UNFCCC Adaptation Fund.
17 The Fund (www.adaptation-fund.org) finances adaptation
projects and programmes in developing countries that are
Parties to the Kyoto Protocol and particularly vulnerable to
the effects of climate change.
18 A total of 32 UN entities offset their greenhouse gas
emissions for 2015, making them climate neutral.
19 The CDM projects for 2014 emissions were CN3882, CN4685 20 Among the procurement sustainability requirements:
(fao.org/3/a-bl729e.pdf), while for 2015 emissions they compliance with relevant environmental standards and
were CN1749, CN1896, CN1900, CN2037 (fao.org/fileadmin/ labels (e.g. ISO- 14001), mandatory use of eco-friendly
user_upload/Corporate_Environmental_Responsibility/docs/ products, agreed takeback schemes.
Certificate_offsets_FAO_2015.pdf).7
Waste management Waste Production). This makes sustainable
waste management at HQ an area for
In order to keep the environmental further improvements in the future.
impact of waste at minimum, FAO tries
to effectively prevent waste through While it can be difficult to properly manage
sustainable procurement choices. We also waste in various locations in the world,
seek creative solutions that keep waste there are many areas where there may be
out of landfills, whether reducing (e.g. by services and facilities to do so. For example,
donating unsold product to food banks) in FAO staff at the regional office in Accra,
or recycling material before treatment, Ghana setup a paper recycling program,
incineration or disposal. Since 2008 FAO building on what other UN agencies had
has focused on better waste management already implemented. Another positive
within its HQ. A large initiative was example comes from the regional office in
implemented to establish waste separation Santiago (FAORLC), which was recognized
for recycling and composting. This by a national foundation devoted to
included installing separate waste bins environmental awareness in 2013 with an
throughout HQ building along with ongoing award. FAORLC was successful in recycling
communications campaigns to inform the 4.5 tonnes of old and unused electronic
staff about the programme. Nevertheless equipment as well as reducing its paper
– perhaps due to an insufficient usage by almost half just by changing
communication campaign and a high staff printer preferences. The office is now
turnover at HQ (i.e. HQ’s non-staff personnel recycling 350kg of glass, paper, cardboard,
represented 39% of the total personnel in tetrapak, cans and plastic bottles per month.
2015) – waste separation has not improved Building on these success stories, FAO HQ
significantly over the years (Figure 4 – Total can provide additional support tailored to
the specific area and in conjunction with in
Figure 4. Total waste (kg) production at HQ similar projects led by other UN agencies in
800 hopes to implements improvements in DOs.
600 Water management
thousand kg
400 Water issues (e.g. quality, scarcity, variability,
pollution) are increasing in quantity and
200 seriousness around the world and they will
be aggravated by the effects of climate
0 change that is already impacting some of
2013 2014 2015 2016 the planet’s most vulnerable rivers, lakes
Building materials Iron/Metal Undifferentiated and ecosystems. These issues are global
Wood Paper & cardboard Glass Metal Plastic and at the same time inherently local,8
thus FAO is committed to manage water
resources sustainably in all its premises.
Though further action is required in its
DOs, FAO has reported on its water quality21
and consumption at HQ since 2008.
Particularly, it is interesting to see that FAO
has decreased its water consumption by
44% and costs by 7% since 2008 (Figure
5 - Water Cubic Metre (m3) and USD savings
at HQ).
Figure 5. Water (m3) and USD savings at HQ
80 140
70 120
60
100
50
thousand USD
thousand m3
80
40
60
30
40
20
10 20
- -
2008 2009 2010 2011 2012 2013 2014 2015 2016
m3 USD
21 The water in Rome is considered safe and suitable to human
consumption. Moreover, FAO HQ conducts microbiological
tests of the faucets and dispensers (which are systematically
disinfected) in addition to the chemical analyses performed
©FAO
by the local National Health Service unit.Way forward 9
Considering that climate change and Energy use reduction measures:23
sustainability are some of the world’s most
pressing issues, and with more and more • Windows replacements at Headquarters
public and private organizations looking to • Data Centre and Disaster Recovery
partner and work with other organizations Renovation at Headquarters
that are following the path towards climate
neutrality, it is an opportune time for FAO to • Lighting upgrades at Headquarters and
take the next step. Today, the Organization in Decentralized Offices
has set second generation targets for • Heating, Ventilation and Air Conditioning
reducing greenhouse gas emissions and (HVAC) system replacement at
other environmental impacts (e.g. waste Headquarters
to landfill) to make certain our collective
• Air Travel reduction through increased
ecological footprint is minimized and a
support to teleconferencing and
culture of environmental responsibility is
fostered. awareness raising campaigns
Emission reduction plan Transition from fossil-fuels to renewables:
As part of the Corporate Environmental • Solar PV installations at Headquarters
Responsibility policy, FAO must implement and in Decentralized Offices
activities that will result in tangible emission • Purchase of electric cars for Headquarters
reductions for FAO. A previous Emission fleet
Reduction Plan (ERP) was developed in 2011
Some of the activities will be implemented
which spanned the 2012-2014 timeframe.
repeatedly in consecutive years, such
Having successfully met and exceeded those
as energy projects in different DOs (for
targets, the Organization is poised to now
further details and timeline, see Annex
address the post-2016 development period
III). These projects represent relatively
as it relates to internal operations.22 While
significant reductions in emissions – as
significant progress has been made, there
showed in the Figure 6 (Projected Total
are some key steps that need to be taken in
GHG Emissions tCO2e by emission source) –
order to further “green” FAO. More than 50
alongside advantageous financial return on
initiatives have been identified to be realized
investments. Moreover the projects destined
within the 2017-2020 period (Annex III).
to DOs will address high priority operational
While it is difficult to quantify all of the
issues such as adequate energy supplies and
projects with regards to actual emission
consequent safety standards and business
reductions and financial gains, a few key
continuity.
activities have been selected to be included
in the 2017-2020 emission reduction
targets: 23 Energy efficiency projects at the HQ also often qualify for the
22 Other agencies – such as UNDP, WFP, and UNFPA – have already Italian sponsored White Certificates program which provides
developed and are implementing Emission Reduction or Climate rebates on these types of investments, allowing for further
Neutral Strategies with reference to the current time period. financial savings.10
Figure 6. Projected total GHG emissions tCO2e by emission source
60 -5.4%
• Continued monitoring of waste,
increased waste separation and
50
reduced landfilling at HQ (although not
40 quantifiable at this time) as compared to
thousand tCO2e
30 the 2015 baseline;
20
• Waste reporting in DOs (starting from
Regional and then Sub-regional Offices
10
first) by 2019.
-
2008 2010 2011 2012 2013 2014 2015 2016 2017 2018 2019 2020
With regards to water management, FAO
Other Building related Air travel commits to keep monitoring its water usage
at HQ and start reporting the consumption
Circular economy, water in DOs (starting from Regional and then
management & EMS Sub-regional Offices first) by 2020 – in line
with the Greening the Blue Movement.
In order to pursue opportunities in the Moreover the Organization commits
field of sustainable procurement and to constantly look for opportunities
waste management, FAO is committing to streamline waste usage and pursue
to integrate the principles of circular efficiency in all its offices.
economy24 by working on some key
activities, namely: Finally, considering the instrumental role
that the HQ EMS has had in systematically
• Integration of sustainability improving the environmental footprint of the
considerations in at least 20% Rome office, FAO is committing to piloting
procurement tenders by 2020 and EMSs in no. 3 regional offices by 2020.
development of a monitoring system for
all product types;
• Institutional formalization of FAO’s
commitment to further reduce its impact
in the field of procurement through
a policy applicable at HQ and, when
possible, in DOs;
• Strengthened communication and
awareness-raising campaigns to
encourage environmentally virtuous
behaviors among the personnel;
24 Find out more about the Circular Economy at
ellenmacarthurfoundation.org/circular-economy/overview/
principles.Funding mechanism 11
Continuing to reduce the Organization’s over the ERP period. By following the above-
environmental footprint while achieving mentioned rational the first projects to
climate neutrality is the core goal of the overall implement could be for instance the purchase
approach. The funds necessary to accomplish of an electric vehicle for the HQ fleet, the
this goal and implement the proposed projects installation of a solar water heating system
amount to more than USD 3 million. and/or the renovation of the data centre.
Nevertheless, the proposed projects are In addition to the financial savings deriving
mostly associated with infrastructural works from infrastructural projects, FAO will also
(i.e. projects not related to travel), which benefit from the avoided offsetting costs
are led by CSAI. As the most advantageous that would derive from a business as usual
ones requires high upfront investments, CSAI state in which none of the proposed projects
will prioritize low-hanging fruit and smaller – and especially air travel reduction – is
projects that will cumulatively producing implemented.
savings over time. The Organization will
hence be able to use these savings to invest Therefore, USD 100 000 shall be set aside
in projects having larger initial price tags, each year from the Corporate Services
but with comparatively higher financial and (CS) budget in order to provide minimum
environmental saving potentials. The Figure financial support to initiate sustainability
7 (Annual Financial and %CO2e Savings projects and to purchase the necessary
from Infrastructural projects) describes CERs to offset FAO’s unavoidable
the financial savings deriving from the emissions.25 Additional funding will be
implementation of the proposed projects, requested depending on specific needs
alongside their share of CO2 equivalent 25 This projected amount dedicated to CERs is based on
current offsetting market prices and the anticipation that
savings as compared to the total reductions costs will rise in the coming years.
Figure 7. Annual financial and %CO2e savings from infrastructural projects
200 20
180 18
160 16
thousand USD
140 14
120 12
%
100 10
80 8
60 6
40 4
20 2
- 0
W nt o AC M chin uctio tem
W ow C M chin s (no (1)
ce ent AC gy R ng S leet
W dow Repl chin s (no 10)
me (no 10)
Lig epla eme t (no 10)
Lig ting eme t (no 40)
Lig ng gra (no 0)
Lig ting pgra e in 40)
Ou hting pgr de in DO
in DO
O
O
e
Im V in allati n in DO
(4)
Ind ved llatio in a O
O r L oof in a O
)
ntr en tio 4)
en atio (2)
W lar P ffice ighti Insu DO
)
)
ati n (3)
n
e
ast Re ery en ldin e
ast Re ery eno o.1 D
)
Da Cen re Re ova n (3
Da ecov ry Re ova n (1
Da Cen ry Re ova n (2
Re vati 40
Dis ster ecov cem bui grad
So r PV stal tion grad
Dis ster Rep llati ng U grad
Dis ow ins igh g U tio
So r PV Ligh ade a D
So r PV stal ng U a D
pr sta on a D
D
.4
Ce tre R nova on (
t (n g
n
on
n
a
a
a
.
.
.
.
.
F
a
Ma ed ys
o
o
n tio
l
in
in
Re lacement o Ene Hea r HQ
p
la on p
p
ti
ti
So doo Up de
n
hti Up nt
s
ov
e R ov
d
n
n
P nst tio
e
e
e
o
ti
n
a
n
n
Re cem ent ate cle f
gr
ti
ti
in la
la
R
e
oo R
a
a
ind s R ac
s R ac
c
U
U
W hi
L
r
r
ta
l
in
e
e
t
Re Data olar c Ve
r
ow ep
i
Dis er cov
er cov
o
ind f A
h
h
re
S tri
f
me o f
s
ind V
t
ta
ta
ta
s
lar
R
R
la
la
la
c
Ele
C
in
So
a
a
pla
pla
p
Annual financial savings (USD) % CO2 reduced12
Conclusion
(e.g. USD 1 million requested through the With this strategy, FAO can continue to be
Proposal for Capital Expenditure Funding a leader within the UN system and among
- FAO’s Strategy for energy issues and other global entities while also contributing
reducing operational costs in Decentralized to minimizing negative environmental
Offices).26 impacts – a motivating factor which closely
aligns with the Organization’s Strategic
Through such an arrangement, FAO will Objectives and the Sustainable Development
remain climate neutral while also continuing Goals.
to reduce emissions at the actual sources.
The less emissions the Organization
produces, the less CERs would need to be
purchased. While offsetting is essential for
climate neutrality, it is important to keep
in mind the goal of the model is to always
decrease emissions and other environmental
impacts, not just purchase offsets in place of
taking action internally.
26 The Proposal is currently under review by ODG.
©FAO/O. BunicAnnexes 13
Annex I the environment resulting from daily
Corporate environmental operations, benchmark with other similar
responsibility policy, June 5th 2016
organizations, and set biennial targets
Agricultural sectors are inherently for continuous improvement;
dependent on climate and consequently • Actively pursue energy, water and
may be negatively affected by climate travel efficiencies, along with reducing
change. FAO therefore dedicates a greenhouse gas emissions and pollution
significant amount of resources towards
in all parts of its operations, departments
agricultural development in areas that are
and functions by periodically setting
often most vulnerable to climate change.
By increasing efficiency and reducing concrete and realistic targets;
unnecessary negative impacts on the • Seek to reduce waste production and
environment, the Organization increases the further improve differentiation for
success towards achieving its five Strategic recycling;
Objectives established in 2013. Not only do
• Integrate environmental criteria into the
these measures help combat climate change,
procurement process where viable and
they also often lead to financial savings and
resiliency against external forces. in the best interests of the Organization
and its stakeholders;
In line with the Strategic Objectives and • Strive to integrate environmental
the Environmental and Social Management responsibility aspects into the way it
Guidelines, this policy spans all of FAO’s
organizes and conducts conferences and
operations worldwide while primarily
meetings;
focusing on the Administrative areas
including Facilities and Infrastructure, Travel, • Strive to become climate neutral no later
and Procurement. Taking into consideration than 2020 and thereafter by offsetting
the endorsement by the UN Chief Executives the emissions that cannot be reduced,
Board (CEB) of the Climate Neutral via purchasing carbon credits that meet
United Nations movement and the CEB the standards of the Clean Development
commitment to implement Environmental Mechanism (CDM) at a minimum;
Management Systems at the agency level,
this policy commits FAO to the following • Collaborate with other UN agencies to
principles and accountability framework. share knowledge and best practices.
The Organization will also contribute to
The Organization will: climate neutrality networks within the
High-Level Committee on Management
• Strive to comply with the applicable
(HLCM) and the Environment
guidelines related to its Corporate
Management Group (EMG);
Environmental Responsibility activities;
• Systematically implement an
• Monitor and measure its impact on
Environmental Management System as14
mandated by the UN Chief Executives Organization’s environmental impact
Board (CEB). At a minimum, this will such as improving efficiency and waste
include: management programmes;
-A document management system • Champion best practices and initiatives
which monitors and tracks past, current that help reduce the FAO’s environmental
and planned Corporate Environmental impact and simultaneously improve
Responsibility related activities as well as operational effectiveness.
progress; While it is important that Senior
-An annual greenhouse gas (GHG) Management provide the necessary
inventory of its facilities and travel leadership, each person working within
(HQ and Decentralized Offices). FAO FAO also bears responsibility for their
will use the same boundaries for its actions which affect the Organization’s
carbon footprint as indicated in the UN environmental impact.
Climate Neutral Strategy and further
agreed upon in the UN Environment
Management Group (EMG)
-An annual publication of FAO’s
Corporate Environmental Responsibility
Report which includes an Emission
Reduction Strategy.
Responsibility and accountability
The FAO Corporate Services Department
(CS) will be responsible for advancing
these principles and activities throughout
FAO Headquarters. The Assistant Director-
Generals/Regional Representatives will play
a similar role within their respective regions,
in collaboration with support staff from
Headquarters. Specifically, they are called
upon to:
• Encourage offices to participate in
the annual greenhouse gas inventory
exercise;
• Encourage and support awareness-
raising initiatives and participation by
staff in activities that help reduce the
©FAO/A. Pierdomenico15
Annex II • Installation of LED lighting and motion
Summary of past corporate sensor technology in the corridors
environmental responsibility (2016);
activities
• Installation of light sensors in all
Below you will find a summary of some other restrooms (2014);
projects and initiatives related to Corporate • Installation of water sensors in newly
Environmental Responsibility within FAO. renovated restrooms (2014);
Many have already been completed, some
are in progress, and some are planned • Substitution of lamps with LED ground
although not necessarily confirmed for floor Bldg. A entrance (2014);
implementation. Although not displayed • Installation of light sensors in large
here, figures on environmental impacts and marble stairs area (2014);
financial savings have been collected where
• Replacement of 100 windows (safety and
possible. Efforts will continue to quantify
these activities in order to further strengthen environmental) (2014);
the relationship between the financial and • Increased percentage of eco-friendly
environmental aspects of these investments. stationary (2014);
• Collaboration with SUN and European
Decentralized offices Union on Sustainable Events (2014);
• Outdoor lighting upgrade in Gambia • Elimination of ozone-depleting
(2016); refrigerants (2013);
• Energy audit in Sierra Leone (2016); • Inclusion of eco-friendly criteria in Dry
• Outdoor lighting upgrade in Ghana Cleaning procurement process (2013);
(2015); • Fair trade coffee and tea in cafes/
• Installation of 12 kWh Solar PV back-up cafeteria (2013);
system in Eritrea (2013); • Addition of 50 new parking spaces for
• Perform energy/efficiency audit at FAO bicycles (2013);
Regional Office in Santiago, Chile (RLC) • Closure of the petrol / car washing
(2012); station (2013);
• Paper recycling programme at FAO • Installation of 3rd set of doors in Bldg. D
Regional Office in Accra, Ghana (2012). to reduce draft, therefore saving energy
(2013);
Headquarters
• Implement waste diversification and
• Installation of a solar photovoltaic collection centre, including better
system (donated by the Government of separation and monitoring (2013);
Germany) for the roof of the Plenary Hall • Reduction of can sodas by installation of
(2016); drink dispensers in cafeteria (2013);16
• Introduction of nutritious fruit • Use of eco-friendly paint products
drinks dispensers in order to reduce (2012);
consumption of sodas as well as the • Integration of environmental aspects
associated waste from packaging (2013); into Philippine Room renovations (2012);
• Substitution of 13 elevators (2013); • Integration of environmental aspects
• Elimination of plastic utensils (only metal into Ethiopia Room renovations (2012);
or bio) (2013); • Elimination of plastic cups in all eating
• Reduction of plastic water bottles in and vending areas (only glass, bio and
cafeteria (2013); PLA) (2012);
• Installation of automatic hand-dryers, • Reduction of usable lifts during weekend
replacing paper towels (2013); from 4 to 2 (2012);
• Reduction of food waste leftovers (2013); • Implementation of an energy monitoring
• Elimination of plastic water bottles for system (2012);
conferences and meetings (2013); • Installation of automated lighting timers
• Installation of energy saving lighting in the cafeteria kitchen, kitchen hoods,
including solar tubes in the Bldg. B Main and the free flow area (2012);
Dining 8th floor (2013); • Inclusion of environmental criteria
• Sustainable procurement training in furniture purchases (procurement
tutorial mandatory for all procurement agreements with companies that are
staff (2013); ISO-14001) (2011);
• Bldg. C - catering storage area: • Substitution of lamps in Morocco Room
substitution refrigerant cells (2013); (2011);
• Increase video-conferencing (substitute • Installation of automatic timers on
for flights sometimes) (2012); corridor lights in Bldgs. A, B, C and D
(2010);
• Substitution of 4 chillers on Bldgs. A and
B, and 2 chillers on Bldg. C (2012); • Introduction of the “turn off library
lights” policy (timers for nights and
• Elimination of single-use cups at Bldg. C
weekends) (2010);
bar by installing a dish-washer. (2012);
• Substitution of halogen lamps with LED
• Training of catering staff on proper
in the stoplights at entrances (2010);
separation of waste (2012);
• Installation of 10 LED lights in bar “B” (8th
• Installation of organic waste compactor
floor), replacing 10 light bulbs of 60 W
(2012);
(2010);
• Integration of eco-label cleaning
• Substitution of 2 elevators (2010);
products into cleaning contract (2012);17
• Installation of water dispensers in
corridors and cafeterias (53) to help
reduce plastic bottle purchases (2010);
• Substitution of plastic bags in the
commissary with paper or cloth (2010);
• Installation of 174 flow reducers on
washroom faucets (2010);
• Installation of two electric chargers for
motor scooters (2010);
• Implementation of the “Workstation
Hibernation” policy (2009);
• Integration of environmental aspects
into the German Room (2006).
©Greeningtheblue/M. Lynn18
Annex III
Emission reduction plan,
Key activities (2017-2020)
TOT kgCO2e Annual Initial
emissions financial investment % CO2
Year Activity Location
reduction savings costs reduced
by 2020 (USD) (USD)*
Data centre renovation (1) HQ 58 782 6 473 - 0.8%
Disaster recovery renovation (1) HQ 575 866 81 903 - 8.0%
Windows replacement (no.140) HQ 300 840 30 988 512 400 4.2%
Outdoor lighting upgrade HQ 85 462 9 411 35 380 1.2%
Indoor lighting upgrade (A6 -
HQ 165 606 19 135 1 277 164
A24) 2.3%
2017
Solar PV installation in a DO DO 32 000 10 000 60 000 0.4%
Lighting upgrade in a DO DO 40 000 8 000 30 000 0.6%
Solar water heating HQ 88 924 5 016 71 031 1.2%
Electric car for HQ fleet HQ 6 987 1 403 7 320 0.1%
-0.5% GHG emissions from air
ALL 690 374 2 700 000 -
rravel 9.6%
Data centre renovation (2) HQ 1 346 947 100 775 - 18.8%
Disaster recovery renovation (2) HQ 410 829 84 446 - 5.7%
Windows replacement (no. 40) HQ 6 051 7 256 120 000 0.1%
Office LED lights HQ 161 700 23 741 610 000 2.3%
Solar PV installation building D HQ 201 000 24 945 158 600 2.8%
2018
Solar PV installation in a DO DO 24 000 10 000 60 000 0.3%
Lighting upgrade in a DO DO 30 000 8 000 30 000 0.4%
Replacement of AC machines
HQ 46 200 6 783 366 000
(no. 10) 0.6%
-0.5% GHG emissions from air
ALL 517 781 2 700 000 -
travel 7.2%
*Reductions from Air Travel will result from awareness raising campaigns that do not require dedicated funding.19
TOT kgCO2e Annual Initial
emissions financial investment % CO2
Year Activity Location
reduction savings costs reduced
by 2020 (USD) (USD)*
Data centre renovation (3) HQ 698 367 126 069 - 9.7%
Disaster recovery renovation (3) HQ 334 007 60 295 - 4.7%
Windows replacement (no. 40) HQ 42 977 7 256 120 000 0.6%
Replacement of AC machines
HQ 30 800 6 783 366 000
(no. 10) 0.4%
2019
Improved roof insulation HQ 59 290 13 058 183 000 0.8%
Solar PV installation in a DO DO 16 000 10 000 60 000 0.2%
Lighting upgrade in a DO DO 20 000 8 000 30 000 0.3%
-0.5% GHG emissions from air
ALL 345 187 2 700 000 -
travel 4.8%
Data centre renovation (4) HQ 409 380 180 319 - 5.7%
Disaster recovery renovation (4) HQ 194 837 85 820 - 2.7%
Windows replacement (no. 40) HQ 21 489 7 256 120 000 0.3%
Replacement of AC machines
HQ 15 400 6 783 366 000
2020 (no. 10) 0.2%
Solar PV installation in a DO DO 8 000 10 000 60 000 0.1%
Lighting upgrade in a DO DO 10 000 8 000 30 000 0.1%
-0.5% GHG Emissions from air
ALL 172 594 2 700 000 -
travel 2.4%I7526EN/1/07.17 fao.org/corporate-environmental-responsibility
You can also read