Species diversity and food web structure jointly shape natural biological control in agricultural landscapes - Nature
←
→
Page content transcription
If your browser does not render page correctly, please read the page content below

ARTICLE
                   https://doi.org/10.1038/s42003-021-02509-z                OPEN

                  Species diversity and food web structure jointly
                  shape natural biological control in agricultural
                  landscapes
                  Fan Yang1,4, Bing Liu1,4, Yulin Zhu1,4, Kris A. G. Wyckhuys1,2, Wopke van der Werf                                        3   & Yanhui Lu         1✉

                  Land-use change and agricultural intensification concurrently impact natural enemy (e.g.,
                  parasitoid) communities and their associated ecosystem services (ESs), i.e., biological pest
                  control. However, the extent to which (on-farm) parasitoid diversity and food webs mediate
1234567890():,;

                  landscape-level influences on biological control remains poorly understood. Here, drawing
                  upon a 3-year study of quantitative parasitoid-hyperparasitoid trophic networks from 25
                  different agro-landscapes, we assess the cascading effects of landscape composition, species
                  diversity and trophic network structure on ecosystem functionality (i.e., parasitism, hyper-
                  parasitism). Path analysis further reveals cascaded effects leading to biological control of a
                  resident crop pest, i.e., Aphis gossypii. Functionality is dictated by (hyper)parasitoid diversity,
                  with its effects modulated by food web generality and vulnerability. Non-crop habitat cover
                  directly benefits biological control, whereas secondary crop cover indirectly lowers hyper-
                  parasitism. Our work underscores a need to simultaneously account for on-farm biodiversity
                  and trophic interactions when investigating ESs within dynamic agro-landscapes.

                  1 State
                        Key Laboratory for Biology of Plant Diseases and Insect Pests, Institute of Plant Protection, Chinese Academy of Agricultural Sciences, Beijing, China.
                  2 University
                             of Queensland, Brisbane, Queensland, Australia. 3 Centre for Crop Systems Analysis, Wageningen University and Research, Wageningen, The
                  Netherlands. 4These authors contributed equally: Fan Yang, Bing Liu, Yulin Zhu. ✉email: luyanhui@caas.cn

                  COMMUNICATIONS BIOLOGY | (2021)4:979 | https://doi.org/10.1038/s42003-021-02509-z | www.nature.com/commsbio                                                1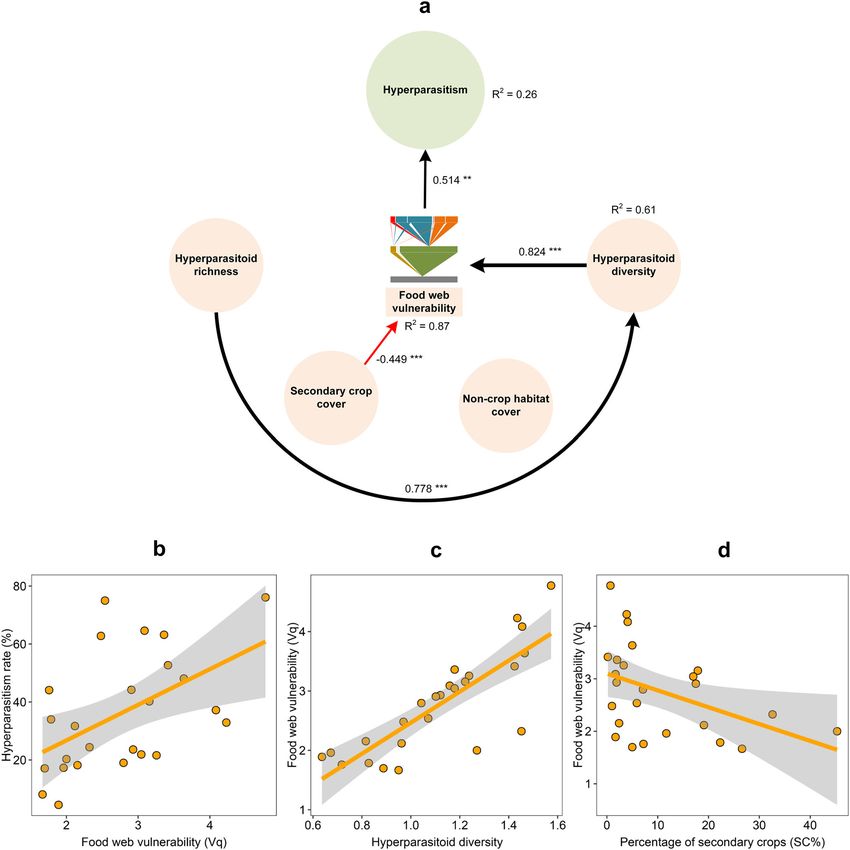
ARTICLE                                                             COMMUNICATIONS BIOLOGY | https://doi.org/10.1038/s42003-021-02509-z

B
       iodiversity secures the sound functioning and stability of          patterns do not necessarily hold across cropping systems and
       the world’s ecosystems1–4, though it is presently being lost        landscape contexts. By disentangling how species diversity and
       at unprecedented rates due to land-use change, chemical             food web complexity jointly mediate landscape-level impacts on
pollution, and agricultural intensification5,6. As a central pivot          biological control, one could facilitate the formulation of uni-
within the interplay between agri-food production and ecosystem            versal theorems. Farming systems in northern China are managed
service (ES) delivery7, insect biodiversity underpins globally             intensively by smallholders, and the resulting agro-landscapes
important services such as pollination and biological pest                 exhibit high levels of diversity and fragmentation47, i.e., diversi-
control8,9, which are valued at US $14 and $24 ha−1 y−1,                   fied secondary crop cultivation. In local cotton crops, aphids
respectively10. Alleviating the root causes of insect biodiversity         (Hemiptera: Aphididae) are a focal pest, and hymenopteran
loss carries broad societal benefits, as it can help restore ES             parasitoids are key biological control agents48. On-farm man-
delivery, improve resource-use efficiencies, raise the economic             agement and landscape context determine aphid colonization
solvency of farming operations, and bolster ecological resilience          rates and the action of EDS providers, e.g., hyperparasitoids49.
in the face of global change11,12.                                         The aphid-parasitoid network structure is equally influenced by
   The conversion of natural habitats to simplified, genetically            landscape complexity and management practices such as pesti-
uniform crop fields is a well-recognized driver of insect biodi-            cide or fertilizer applications50.
versity loss. While more diverse landscape mosaics buffer against             Here, drawing upon multiyear observational surveys in China’s
species loss for certain taxa13,14, ES-providing organisms, such as        cotton agro-landscapes, we examine how landscape composition
insectivorous predators and parasitoids, do not exhibit consistent         affects (1) the species diversity of different ES and EDS providers,
responses to landscape composition15. Within individual crop-              (2) food web structure and (3) the resulting ESs or EDSs, i.e.,
ping fields, biological control is affected by various aspects of           biological control or hyperparasitism. Furthermore, using path
agricultural intensification16, i.e., the incorporation of plant            analysis with structural equation modeling (SEM), we reveal how
diversity8,17, agronomic management such as tillage18 or agro-             on-farm food webs mediate landscape-level impacts on biological
chemical use19. Landscape composition equally shapes ecosystem             control. Our work shows how an in-depth characterization of
disservices (EDSs) such as pest colonization20, hyperparasitism21,         food web structure helps clarify the determinants of ecosystem
and intraguild predation22 or those provided by entomopatho-               functionality (ESs and EDSs) and can ultimately guide the design
genic fungi23—all of which interfere with on-farm biological               and deployment of ecologically based pest management strategies
control24. For example, EDS providers such as hyperparasitoids             at the landscape level.
thrive in complex landscapes25, and their action can destabilize
parasitoid communities and dampen overall parasitism26. Over-              Results
all, the net effects of landscape complexity are highly variable27,        Aphid-parasitoid diversity and tri-trophic food web structure.
and the resulting impacts on ES or EDS delivery are unclear28,             Throughout the 3-year study, a total of 2153 mummified (i.e.,
thus complicating efforts to reliably forecast biological control or       parasitized) aphids were collected from 25 different sites in
pest infestation pressure. However, this absence of consistent             northern China (Fig. 1a). DNA-based species identification and
relationships between landscape make-up and ecosystem func-                food web assembly revealed how 2503 parasitoid and hyperpar-
tionality can be resolved by adopting a multitrophic food web              asitoid individuals (11 species) were involved in 2386 distinct
perspective29.                                                             trophic interaction events. These included one target aphid pest
   Food webs describe species interactions within and between              (Aphis gossypii), 3 species of primary parasitoids (1569 indivi-
various trophic levels, and their composition dictates biodiversity-       duals), and 7 species of hyperparasitoids (934 individuals)
ecosystem functionality30,31. As a key food web metric, network            (Fig. 1b). The primary parasitoid community consisted mainly of
generality (i.e., mean number of host or prey species per con-             Binodoxys communis (Braconidae) (average ± SE as 91% ± 2% of
sumer) mediates ESs32, with high generality entailing the pre-             individuals), while Syrphophagus spp. (Encyrtidae) constituted
sence of multiple prey or host items for each consumer (i.e.,              40% ± 4% (average ± SE) of hyperparasitoid taxa. The aphid-
predator or parasitoid) within the food web33,34 and thereby               parasitoid-hyperparasitoid food web was highly stable over the
mitigating impacts of eventual species loss35. Conversely, food            years (see Supplementary Fig. 1).
web vulnerability (i.e., mean number of consumers per host or
prey) indicates how multiple consumers share one single prey or
host item, thus increasing competition for resources and even-             Direct effects of food web features on ecosystem services (ESs)
tually causing secondary extinction36. To date, host-parasitoid            and disservices (EDSs). We first assessed the direct effects of
models have been widely used to characterize food web                      three key quantitative metrics of primary-hyperparasitoid food
structure37 due to ease of sampling, quantitative interpretation of        web generality (Gq), vulnerability (Vq), and connectance (Cq) on
(multitrophic) interaction networks38, and advances in DNA-                selected ESs (parasitism rate on A. gossypii) and EDSs (hyper-
based molecular detection39,40. So far, this approach has allowed          parasitism rate) (Table 1). General linear model (GLM) analysis
capturing the direct effect of landscape-level variables on food           with multiple model selection inference showed that the best
web structure and ESs such as parasitism41 as well as EDSs, i.e.,          model (ΔAICc = 0) contained the unique predictor generality,
hyperparasitism. However, the necessary insights regarding how             which was negatively related to ESs (i.e., parasitism rate)
particular food web features mediate landscape-level impacts on            (P = 0.020, Supplementary Table 2), whereas food web vulner-
ES delivery are lacking.                                                   ability was positively related to EDSs (i.e., hyperparasitism rate)
   In general, landscape complexity favors biodiversity and often          (P = 0.007, Supplementary Table 2).
enhances biological control42, while on-farm management affects
myriad food web features43,44. However, there is only scant                Direct effects of landscape composition on different response
knowledge regarding the extent to which food web complexity                variables. We tested the direct landscape effects on ESs (para-
affects the abundance of biological control organisms and EDS              sitism rate) and EDSs (hyperparasitism rate), food web features,
providers, particularly within the highly dynamic and                      and parasitoid diversity individually (Table 1). Landscape factors
disturbance-prone context of agro-ecosystems45. Although on-               were previously selected based on correlation analysis and prin-
farm biological control relates to metrics such as community               cipal component analysis (PCA) (Supplementary Fig. 2). GLM
evenness, linkage strength, and network centrality46, these                analyses and model selection inference showed that landscape

2                        COMMUNICATIONS BIOLOGY | (2021)4:979 | https://doi.org/10.1038/s42003-021-02509-z | www.nature.com/commsbio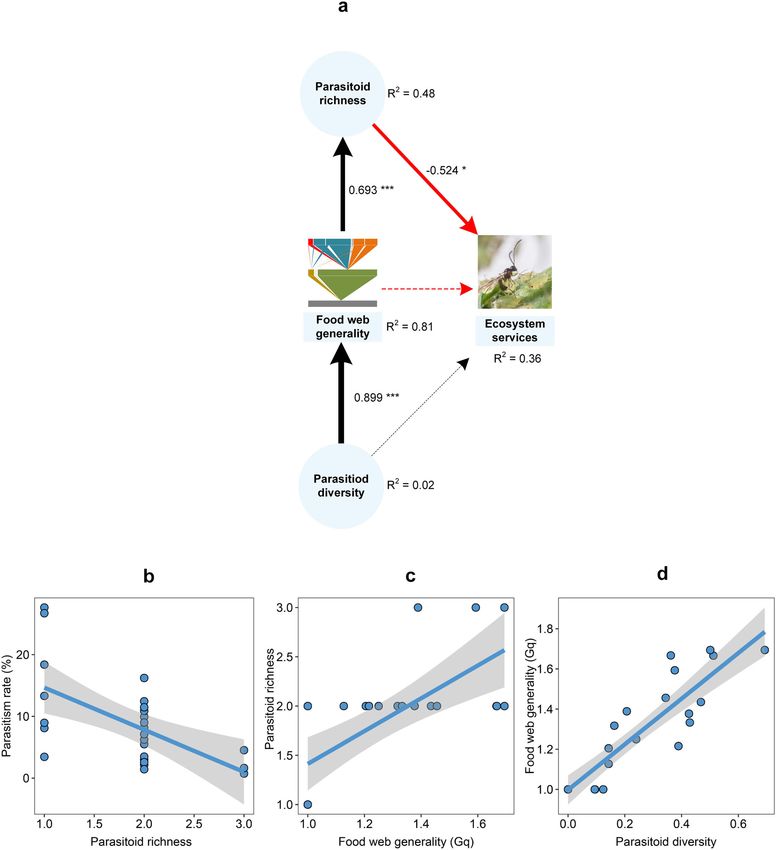
COMMUNICATIONS BIOLOGY | https://doi.org/10.1038/s42003-021-02509-z                                                                            ARTICLE

Fig. 1 Geographic distribution of study sites in northern China and aphid-primary-hyperparasitoid tri-trophic food web. From 2014 to 2016, a total of
25 sites were identified across four geographic regions in northern China (a). b Diagrams the overall quantitative food webs including three trophic levels,
with the lowest level (gray bar) comprising herbivorous hosts, i.e., the cotton aphid Aphis gossypii. Species numbered 1–3 are the primary parasitoids
(middle trophic level): Aphelinus albipodus, Aphidius gifuensis and Binodoxys communis; and 4–10 are the hyperparasitoid species (upper trophic level):
Phaenoglyphis villosa, Syrphophagus eliavae, Syrphophagus spp., Dendrocerus carpenteri, Dendrocerus laticeps, Asaphes spp., Pachyneuron aphidis. Species that are
marked with the same color belong to the same family. The width of a given triangle reflects the relative proportion of linkage effects.

factors had no direct influences on ESs and EDSs, although the                     Supplementary Tables 7–10). The parasitism rate was negatively
percentage of non-crop habitat (NCH) cover was (marginally)                       related to species richness (conditional average: P = 0.002, Sup-
negatively related to ESs (conditional average: P = 0.066) but                    plementary Table 8) but not to the Shannon diversity of primary
positively related to EDSs (conditional average: P = 0.077, Sup-                  parasitoids (P = 0.864). Food web generality was not related to
plementary Table 3). Additionally, no landscape factors were                      ESs (P = 0.685) when simultaneously considering other effects of
directly related to food web generality (P = 0.561), although                     predictors. Additionally, landscape variables such as the percen-
secondary crop cover (SC) was negatively related to food web                      tage of SC (P = 0.242) and cotton area cover (P = 0.736) had no
vulnerability (P = 0.034, Supplementary Table 4). No landscape                    direct effects on ESs. In particular, NCH cover remained (mar-
factors were related to the species richness or community diver-                  ginally) positively related to ESs (P = 0.055, Supplementary
sity (Shannon diversity) of either primary parasitoids or hyper-                  Table 8). For hyperparasitism, food web vulnerability was posi-
parasitoids (Supplementary Tables 5 and 6).                                       tively related to EDSs (conditional average: P = 0.040, Supple-
                                                                                  mentary Table 10). NCH had a (marginally) positive effect on
                                                                                  EDSs (P = 0.087), while no effects were found for other pre-
Direct effects of combinational predictors on ecosystem func-                     dictors, such as hyperparasitoid species richness (P = 0.103) and
tionality. Earlier GLM analyses allowed for an initial identifica-                 community diversity (P = 0.199).
tion of the direct effects of several predictors on ESs and EDSs.
However, as ecosystem functionality is determined by a multitude
of factors, linear mixed effect model (LMM) analysis helped                       Path analysis for assessing cascading effects. As a first step, the
assess the direct effects of combinational predictors belonging to                above GLMs and LMMs permitted the identification of the direct
three groups: landscape composition, species richness and                         effects of several predictors on the respective ES or EDS of aphid
diversity, and food web features, on ESs and EDSs (Table 1;                       parasitism or hyperparasitism. Next, a path analysis with

COMMUNICATIONS BIOLOGY | (2021)4:979 | https://doi.org/10.1038/s42003-021-02509-z | www.nature.com/commsbio                                                    3
ARTICLE COMMUNICATIONS BIOLOGY | https://doi.org/10.1038/s42003-021-02509-z
Table 1 Summarized effects of predictors on ecosystem services and food web metrics.
Method Predictor Response variable Coeffb P
Linear regression EDS ES 0.10 0.158
GLM Gq ES −0.13 0.020
GLM Vq EDS 0.12 0.007
GLM NCH ES 0.25 0.066
GLM Maize EDS 0.44 0.061
NCH EDS 0.88 0.077
GLM Intercepta Gq 1.26 0.561
GLM SC Vq −3.21 0.034
GLM Intercept Parasitoid richness 1.84COMMUNICATIONS BIOLOGY | https://doi.org/10.1038/s42003-021-02509-z ARTICLE Fig. 2 Causal paths between the ecosystem service (ES) of biological control and different predictors. In the SEM analysis, ES is the ultimate response variable, while parasitoid richness, parasitoid diversity and food web generality (Gq) are both predictors and response variables. The paths reveal both direct and indirect relationships between individual predictors and response variables. a Shows the paths after removing non-crop habitat (NCH). Standardized coefficients are shown for each path and scaled as line width. Black and red lines indicate either positive or negative relationships, with solid lines representing statistically significant effects and dotted lines showing nonsignificant effects (*P < 0.05; **P < 0.01; ***P < 0.001). R2 shows the explanatory proportion of the total variance for each response variable in the model (Supplementary Table 11). b–d Show significant relationships based on SEM analysis, with solid lines and shaded zones indicative of the regression lines and 95% confidence intervals (n = 25), respectively. diversity, management intensity, and the surrounding landscape effects of land-use variables on ecosystem functionality, i.e., aphid matrix. As ES-providing organisms such as insect parasitoids biological control. More specifically, path analysis revealed how exhibit inconsistent responses to landscape-level variables, often, parasitoid richness—as shaped by food web generality—and biological control cannot be reliably predicted across landscape diversity mediated landscape-level determinants of biological complexity gradients15. Here, we illustrated how particular fea- control. However, non-crop habitat cover exerted no effects on tures of insect food webs and diversity metrics modulated the parasitoid diversity and food web generality. Moreover, COMMUNICATIONS BIOLOGY | (2021)4:979 | https://doi.org/10.1038/s42003-021-02509-z | www.nature.com/commsbio 5
ARTICLE                                                                                        COMMUNICATIONS BIOLOGY | https://doi.org/10.1038/s42003-021-02509-z

 Table 2 Summarized effects of different predictors on ultimate ecosystem functionality.

 Ecosystem functionality                         Predictor                                         Direct effect                      Indirect effect                       Total effect
 ES (parasitism)                                 Parasitoid richness                               −0.524                                                                   −0.524
                                                 Food web generality (Gq)                                                             −0.363                                −0.363
                                                 Parasitoid diversity                                                                 −0.326                                −0.326
 EDS (hyperparasitism)                           Food web vulnerability (Vq)                       0.514                                                                    0.514
                                                 Hyperparasitoid diversity                                                             0.424                                  0.424
                                                 Hyperparasitoid richness                                                              0.329                                  0.329
                                                 Secondary crop cover (SC)                                                            −0.231                                −0.231

 For the ecosystem service (ES, parasitism rate), results were based on the last SEM analysis after removing the landscape variable (Fig. 2a). Parasitoid richness had a direct effect on the studied ES,
 whereas food web generality (Gq) and parasitoid diversity had indirect effects (calculated as indirect path effect products). For the studied ecosystem disservice (EDS, hyperparasitism rate), food web
 vulnerability (Vq) had a direct positive effect on hyperparasitism, while hyperparasitoid richness and diversity had cascading positive effects (Fig. 3a). Secondary crop cover (SC) had a cascading
 negative effect on EDS. Total effects are computed by summing the direct and indirect effects for each predictor.

parasitism was attenuated by parasitoid richness and indirectly                                        during aphid outbreaks, the latter metric can be skewed by
weakened by food web generality. A diverse parasitoid commu-                                           exponentially increasing aphid numbers (denominator) com-
nity could thereby dampen biological control. Hyperparasitism is                                       pared to parasitoid mummies (numerator)54. Additionally, in
an important EDS, with hyperparasitoids often compromising the                                         settings with complex food webs, primary parasitoids sustain
role of primary parasitoids in biological control51. In our study,                                     more hyperparasitoids and potentially reduce their interspecific
hyperparasitism was directly strongly tied to food web vulner-                                         competition in the food web due to down-top effects (prey affect
ability, with the latter parameter directly affected by the                                            natural enemies) (Supplementary Fig. 4a). A second food web
landscape-level SC (secondary crops) cover and hyperparasitoid                                         metric, i.e., food web vulnerability also exerted important impacts
diversity. While SC interfered with hyperparasitism, its effects                                       on hyperparasitism. In settings with high food web vulnerability,
were counteracted by hyperparasitoid diversity.                                                        hyperparasitoid richness was related to primary parasitoid
   Ecosystem functionality is usually shaped by multiple biotic                                        diversity and ultimately enhanced the hyperparasitism rate
and abiotic factors. In farming landscapes, non-crop habitat tends                                     (Fig. 3), which may have been caused by resource shortages, thus
to lift the population levels of beneficial organisms and benefit                                        potentially increasing interspecific competition due to top-down
biological control52. Non-crop habitat provides shelter, alter-                                        effects (natural enemies attack prey) in the food web (Supple-
native host items, and carbohydrate-rich foods as delivered by                                         mentary Fig. 4b).
pollen- or nectar-bearing plants53, which are resources that are                                          Food webs represent networks of different trophic relation-
often scarce in ephemeral, disturbance-prone agro-ecosystems20.                                        ships, with a weighted generality metric related to the food web
As such, non-crop habitat can benefit aphid parasitoid                                                  universality of the lower trophic level, the diversity of host items
populations54 and bolster parasitism levels55, which in turn lower                                     for the upper trophic level (i.e., hyperparasitoids) and the overall
pest damage and increase crop yields9. However, landscape-level                                        robustness of species interactions59. Food web vulnerability pre-
crop heterogeneity tends to benefit parasitoid richness and can                                         dicts trophic fragility33, in which more than one species in the
increase the level of biological control56. Natural enemies exhibit                                    upper trophic level shares one common resource item. Once the
taxa-specific responses to landscape context and ecosystem                                              food web structure is well characterized, its implications can be
alterations55,57. For instance, primary parasitoids thrive in com-                                     assessed in terms of ecosystem functionality60. In our study, food
plex landscapes, whereas simple landscapes often support diverse                                       web generality was positively related to parasitoid richness and
hyperparasitoid communities45. However, in our study, land-                                            negatively impacted their associated ESs (i.e., in-field parasitism
scapes with more non-crop habitat exhibited only marginal                                              rate), irrespective of landscape context. Our findings thus con-
increases in parasitism levels. Conversely, diverse farming land-                                      flicted with existing research results45,49 in which landscape
scapes (i.e., high secondary crop cover) were typified by lower                                         complexity has been deemed to be a key determinant of aphid-
food web vulnerability and attenuated hyperparasitism. Hence,                                          parasitoid food web structure61. More complex food webs with
crops such as peanut, soybean, sweet potato, vegetables, or fruit                                      diverse interactions can foster stability62 through trophic
trees likely provide a suite of (food, non-food) resources that                                        complementarity63, although individual species could lend
disproportionately favor primary parasitoids. This characteristic                                      stability64 and facilitate species coexistence65. In our study,
underscores an urgent need to clarify the relative contribution of                                     complex food webs sustained species-rich hyperparasitoid com-
non-crop habitat compared to that of other field- and landscape-                                        munities and thereby restrained biological control and destabi-
level parameters. Ideally, these multitrophic food web ecology                                         lized ecosystem functioning34. Although food web vulnerability
studies are conducted in cereal systems, where aphids and their                                        directly affected the hyperparasitism rate, no linear relationship
parasitoid species are exceptionally well studied45,52,54 and are                                      was detected between parasitism and hyperparasitism (Supple-
more speciose than are temperate cotton systems40.                                                     mentary Fig. 3). Therefore, the primary and hyperparasitoid
   In both natural and anthropogenic ecosystems, land-use                                              species that comprise the trophic interactions of on-farm food
change can directly affect the host-parasitoid food web                                                webs are expected to differentially contribute to ESs (i.e., biolo-
structure43,58. In our study, however, no (direct, indirect) effects                                   gical control) or EDSs (i.e., hyperparasitism).
of landscape composition on food web generality were detected.                                            By characterizing the extent to which food web structure
However, food web generality modulated the effects of parasitoid                                       mediates landscape-level impacts on ES delivery, we found that
diversity on the parasitism rate (Fig. 2). Complex food webs (i.e.,                                    network generality played a pivotal role in determining aphid
high generality) exhibited more links between trophic levels                                           biological control. Conversely, EDSs (i.e., hyperparasitism) were
(Supplementary Fig. 4a) and, in settings with diverse (primary)                                        dictated by network vulnerability and further modulated by
parasitoid communities, thus reduced parasitism rates. However,                                        landscape features (i.e., secondary crop cover) and (hyper)

6                                    COMMUNICATIONS BIOLOGY | (2021)4:979 | https://doi.org/10.1038/s42003-021-02509-z | www.nature.com/commsbio
COMMUNICATIONS BIOLOGY | https://doi.org/10.1038/s42003-021-02509-z ARTICLE Fig. 3 Causal paths between the ecosystem disservice (EDS) of hyperparasitism and different predictors. In the SEM analysis, EDS is the ultimate response variable, while hyperparasitoid richness and diversity and food web vulnerability (Vq) are both predictors and response variables. Non-crop habitat (NCH) and secondary crop cover (SC) are exogenous variables. The paths reveal both direct and indirect cascading relationships between predictors and response variables. a Shows the paths after removing all nonsignificant paths. Standardized coefficients are shown for each path and scaled as line width. Black and red lines indicate either positive or negative relationships, with solid lines representing significant effects and dotted lines showing nonsignificant effects (*P < 0.05; **P < 0.01; ***P < 0.001). R2 shows the explanatory proportion of the total variance for each response variable in the model (Supplementary Table 12). b–d Show the significant relationships based on SEM analysis, with solid lines and shaded zones indicative of regression lines and 95% confidence intervals (n = 25), respectively. parasitoid diversity. Our assessment is, however, constrained by a landscape-level crop heterogeneity could bolster parasitism rates number of elements, e.g., the species-poor herbivore community and simultaneously enhance the pest control action of other in China’s cotton agro-ecosystems and a rather simplified organisms66. By accentuating the contribution of species diversity quantification of parasitoid-mediated pest suppression. Never- and food web structure, our work can help refine ecological theless, our multitrophic food web analytical approach constitutes intensification schemes, guide landscape-level interventions to a powerful lens to quantitatively assess the relative contributions restore natural biological control, or amend existing “area-wide” of different (on-farm, landscape-level) determinants of ES deliv- agri-environment schemes67. Our food web approach also enables ery. Our findings showed that the active conservation of non-crop a more complete accounting of farm management, e.g., insecti- habitat (e.g., natural habitats, hedgerows, flower strips) or cide use, impacts on ESs, and permits an in-depth assessment of COMMUNICATIONS BIOLOGY | (2021)4:979 | https://doi.org/10.1038/s42003-021-02509-z | www.nature.com/commsbio 7
ARTICLE                                                                             COMMUNICATIONS BIOLOGY | https://doi.org/10.1038/s42003-021-02509-z

how (smallholder) farmers either bolster or degrade ecosystem                              calculated as follows:
functionality. Aside from enabling a step-change in applied agro-                                                                      S

                                                                                                                                          bik      b
ecological research, our empirically derived findings can help                                                           H N;k ¼  ∑           log2 ik                          ð2Þ
                                                                                                                                      i¼1 bk      bk
mitigate mounting anthropogenic pressures on agro-biodiversity
and their associated ESs in China and internationally.                                                                                 S    bkj          bki
                                                                                                                        H P;k ¼  ∑               log2                         ð3Þ
                                                                                                                                      i¼1 bk            bk
Methods                                                                                    where bik is the number of individuals of primary parasitoid species i attacked by
Study sites and landscape characterization. To assess the landscape-level effects          hyperparasitoid k, and b.k is the total number of primary parasitoids (column sum
on aphid parasitism and host-parasitoid food webs, we selected 25 different sites          of the parasitoid/host matrix) attacked by hyperparasitoid k; additionally, bkj is the
across a landscape gradient in the >3000 km2 cotton-growing region in China’s              number of individuals of hyperparasitoid j attacking primary parasitoid k, and bk. is
Hebei and Tianjin Provinces (116°30′−117°50′E, 38°39′–39°41′N). From 2014 to               the total number of hyperparasitoids (row sum of the parasitoid/host matrix)
2016, 7–10 sites were selected each year and spaced at a minimum distance of 3 km          attacking primary parasitoid k. The reciprocals of HN,k and HP,k are as follows:
to avoid spatial autocorrelation (Fig. 1a). Per site, 1500-m radius landscape sectors                                            H N;k
                                                                                                                                   2      if bk > 0
from the focal cotton field were digitized. Google Earth and land-use categories                                         nN;k ¼                                                ð4Þ
were defined by ground truthing, and the position of each focal cotton field was                                                       0   if bk ¼ 0
recorded using a handheld GPS unit (Model MG768, Beijing UniStrong Science &
Technology Co. Ltd., China). Imagery was digitized by using ArcGIS 10.2 (ESRI,                                                        2H P;k      if bk > 0
                                                                                                                         nP;k ¼                                                ð5Þ
Environmental Systems Research Institute, Inc., USA), and each landscape was                                                            0         if bk ¼ 0
classified into five land-cover types: (1) cotton, (2) maize, (3) secondary crops (i.e.,
soybean, peanut, sweet potato, vegetables, fruit orchards), (4) non-crop habitat (i.e.,    Gq is the mean number of host species per consumer. A high Gq signals an
grassland, shrubs, forest), and (5) urban (i.e., roads, cemented hard surface              increased number of host items for a given consumer, and Gq is calculated as
including buildings, water and abandoned land). The proportion of each land cover          follows:
type was quantified using Fragstats 4.0 software68. As a measure of landscape                                                       S
                                                                                                                                        b
diversity, we used Simpson’s inverse diversity index (SIDI), calculated as SIDI = 1/                                       Gq ¼ ∑ k nN;k                                      ð6Þ
                                                                                                                                    k¼1 b
Σ(pi)2, in which pi is the proportion of each land-use category within each 1500-m
radius of cotton agro-landscape69.                                                             Vq is the mean number of parasitoid species per host. A high Vq signals that one
                                                                                           host is parasitized by multiple species of consumers, and Vq is calculated as
                                                                                           follows:
Parasitism and hyperparasitism rate. Parasitoid-mediated biological control (i.e.,                                                 S
an ES) was quantified using the parasitism rate, or more specifically, the proportion                                                     b
                                                                                                                           Vq ¼ ∑ k np;k                                      ð7Þ
of mummified aphids among all aphids (i.e., mummies and live aphids). At each                                                        k¼1 b
site, the numbers of aphids and parasitoid mummies were recorded on 50 cotton                  Cq is the proportion of actual links of all possible links within the food web. Cq
plants in each of three randomly selected plots (min. 1000 m2) within the focal            is quantified as follows:
cotton field, with each plot at a min. 10 m distance from the field border to avoid
potential edge effects. Within each plot, five points were randomly chosen using a                                       1 S bk              S b
                                                                                                                  Cq ¼      ∑       nP;k þ ∑ k nN;k =s                        ð8Þ
Z-shaped sampling grid, and 10 plants were inspected at each point. In each field,                                       2 k¼1 b           k¼1 b
sampling was carried out three times (at 7–10-day intervals) from early July to
                                                                                           where s is the number of species acting in the food web. A high Cq signals an
mid-August when cotton aphids tended to reach outbreak levels70. In each plot,
                                                                                           increased availability of alternative resources for consumer populations.
mummified aphids were collected over a 15-min sampling window and indivi-
                                                                                               Food web interactions were visualized using the “bipartite” package74 in R
dualized within 1.5-mL centrifuge tubes with 95% ethanol. Next, samples were kept
at −20 °C for future PCR-based parasitoid identification. Sampling was exclusively          4.0.2 software73. All variables are described in Supplementary Table 1.
performed in insecticide-free cotton plots. The focal fields were managed without
pesticides during the whole study period, and farmers were financially compen-              Statistical analysis
sated for any yield loss that resulted from this modified management regime.                Landscape variables selection. First, we tested the correlations among five land-
    The hyperparasitism rate (i.e., an EDS) was calculated as the proportion of            cover variables, i.e., cotton, maize, SC, NCH and urban areas, and landscape
hyperparasitoids detected from mummy samples. If PCR-based parasitoid                      complexity (i.e., landscape diversity index, SIDI). The SIDI was highly correlated
identification revealed the presence of one or more hyperparasitoids from one               with maize cover (Supplementary Fig. 2a). To reduce the multicollinearity and
given mummified sample, the respective hyperparasitism rate was defined as 1. In             simplify subsequent analyses, we performed PCA after excluding the SIDI and the
the absence of hyperparasitoid DNA for a mummified sample, the hyperparasitism              urban land-cover category. The first two principal components (PCs) explained a
rate was maintained at 0.                                                                  total of 76% (43.8% of Dim1 and 32.1% of Dim2) of the variation in all dimensions.
                                                                                           The first axis (PC1) mainly represented the land-cover category of maize, whereas
                                                                                           the secondary axis (PC2) largely represented the NCH (Supplementary Fig. 2b).
Food web construction and parasitoid diversity. The DNA of mummified
                                                                                           Pearson’s correlation test was conducted using the “ggcor” package75, and PCA was
aphids was extracted using a modified Chelex extraction method. Next, multiplex
                                                                                           performed by the “vegan” package76 and visualized by the “factoextra” package77 of
and single PCRs were jointly used to detect aphid and parasitoid species, as in Zhu
et al.40. This method can detect the DNA of both parasitoid and hyperparasitoid            R 4.0.2 software73.
species in parasitized (or mummified) aphids39. Data were used to determine the
abundance, richness, and community diversity (Shannon’s diversity, H′) of primary          Direct effect analysis. To account for the direct effect of different predictors on
parasitoid and hyperparasitoid species. Abundance reflected the total number of             response variables, we first performed multivariate regression analysis by using
parasitoids at different trophic levels. Richness was the total number of species,         GLMs. In GLMs, we individually assessed predictors belonging to the same group,
while Shannon’s diversity was calculated as71 by using the “picante” package72 in R        i.e., landscape composition (land-cover categories cotton, maize, SC, NCH), food
4.0.2 software73:                                                                          web structural features (i.e., Gq, Vq, Cq), and diversity metrics (i.e., parasitoid or
                                                                                           hyperparasitoid richness, diversity) on the ultimate ES (parasitism rate) or EDS
                                                                                           (hyperparasitism rate). We selected the best-fit model based on the Akaike infor-
                                            S
                                                                                           mation criterion (AIC)78. Candidate models were selected with corrected AIC
                                  H0 ¼  ∑ pi lnpi                                  ð1Þ    (ΔAICc < 4) due to small samples79, and the Akaike weight (wi) indicated the
                                           i¼1                                             explanatory power of each model. The best-fit model was the one with the lowest
                                                                                           AICc (ΔAICc = 0). The variance-inflation factor (VIF) values showed no sig-
                                                                                           nificant multicollinearity (VIF < 2) between predictors in each group for the cor-
in which S is the species number and pi is the proportion of species i.                    responding models.
    For each study site, we assembled quantitative food webs. As the cotton aphid               Ecosystem functionality is usually not determined by a single factor; rather, it is
A. gossypii was the only host for resident parasitoids at our study sites, the             typically determined by the combined effect of different factors1,80. Hence, LMMs
ecological network assembly was focused on the primary parasitoid-                         were used to assess the direct effects of predictors from different functional groups
hyperparasitoid food webs. The structure of each food web was characterized using          (i.e., landscape factors, food web features, diversity of (hyper)parasitoid
three quantitative metrics: weighted generality (Gq), vulnerability (Vq), and              community). For parasitism, based on the previous direct analysis for the same
connectance (Cq). The above metrics are commonly used to describe the                      functional group, fixed effects were included for three landscape predictors (cotton,
interaction and complexity in ecological networks, including host-parasitoid food          SC, and NCH), one food web metric (Gq), species richness, and diversity of
webs43. The weighted quantitative metrics were calculated according to Bersier             primary parasitoids (Supplementary Table 7). For hyperparasitism, fixed effects
et al.33. For each taxon (k) within the different trophic levels, the diversity of         included three landscape variables (SC, NCH, and maize), hyperparasitoid richness
individuals at lower trophic levels, i.e., primary parasitoids (HN, host diversity), and   and diversity, and three food web metrics (Cq, Gq, Vq) (Supplementary Table 9).
higher trophic levels, i.e., hyperparasitoids (HP, consumer diversity), were               “Year” was set as the random effect for model convergence. To select and infer the

8                                COMMUNICATIONS BIOLOGY | (2021)4:979 | https://doi.org/10.1038/s42003-021-02509-z | www.nature.com/commsbio
COMMUNICATIONS BIOLOGY | https://doi.org/10.1038/s42003-021-02509-z ARTICLE
best model, we also performed conditional model averaging (ΔAICc = 0) from all 10. Costanza, R. et al. The value of the world’s ecosystem services and natural
candidate models (ΔAICc < 4), and we calculated the relative variable importance capital. Nature 387, 253–260 (1997).
(importance) based on the summarized Akaike weight for each model 11. Oliver, T. H. et al. Declining resilience of ecosystem functions under
(Supplementary Tables 8 and 10). biodiversity loss. Nat. Commun. 6, 10122 (2015).
The VIF values were calculated within the “car” package;81 GLM analysis, LMM 12. Naranjo, S. E., Ellsworth, P. C. & Frisvold, G. B. Economic value of biological
analysis and model selection and averaging were performed by using the “stats” control in integrated pest management of managed plant systems. Annu. Rev.
package73, “lme4” package82 and “MuMIn” package83 of R 4.0.2 software73, Entomol. 60, 621–645 (2015).
respectively. 13. Frishkoff, L. O. et al. Loss of avian phylogenetic diversity in neotropical
agricultural systems. Science 345, 1343–1346 (2014).
Cascaded effects assessment. Although regression analyses (GLMs or LMMs) 14. Mendenhall, C. D., Karp, D. S., Meyer, C. F. J., Hadly, E. A. & Daily, G. C.
showed direct effects of explanatory factors on response variables, they failed to Predicting biodiversity change and averting collapse in agricultural landscapes.
clarify cascading relationships between these different variables. ES or EDS delivery Nature 509, 213–217 (2014).
can be simultaneously affected by land-use cover, species diversity of ES- or EDS- 15. Karp, D. S. et al. Crop pests and predators exhibit inconsistent responses to
providing organisms and certain food web features45,84,85. To gauge how these surrounding landscape composition. Proc. Natl Acad. Sci. USA 115,
different variables jointly mediated ecosystem functionality, a path analysis through E7863–E7870 (2018).
piecewise SEMs was deployed86. Before the SEM path analysis, we tested the linear 16. Tamburini, G. et al. Agricultural diversification promotes multiple ecosystem
relationship between the parasitism rate (ES) and hyperparasitism rate (EDS). As services without compromising yield. Sci. Adv. 6, eaba1715 (2020).
no statistically significant patterns were recorded (Supplementary Fig. 3), we per- 17. Redlich, S., Martin, E. A. & Steffan-Dewenter, I. Landscape-level crop
formed path analysis for the ultimate response variables, parasitism and hyper- diversity benefits biological pest control. J. Appl. Ecol. 55, 2419–2428
parasitism, individually. (2018).
Both SEM analyses were executed in two steps. For the parasitism rate (ES), we 18. Muneret, L. et al. Evidence that organic farming promotes pest control. Nat.
first entered all paths into the model and included the nonsignificant effect of Sustain. 1, 361–368 (2018).
landscape composition (i.e., NCH). Second, we filtered the nonsignificant 19. Roubos, C. R., Rodriguez-Saona, C. & Isaacs, R. Mitigating the effects of
landscape effect and retained only parasitoid diversity, food web Gq and species
insecticides on arthropod biological control at field and landscape scales. Biol.
richness as predictors. Ultimately, path diagrams (Fig. 2a) were drawn to visualize
Control 75, 28–38 (2014).
the causal effects for different predictors on the target ES (i.e., parasitism rate). For
20. Roschewitz, I., Hucker, M., Tscharntke, T. & Thies, C. The influence of
the hyperparasitism rate (EDS), the primary model included two landscape
landscape context and farming practices on parasitism of cereal aphids. Agric.
variables (SC and NCH), hyperparasitoid richness and diversity, and food web Vq.
Ecosyst. Environ. 108, 218–227 (2005).
Second, we removed nonsignificant effects on ecosystem functionality and reran
the SEM analysis (Fig. 3a). Based on the directed separation tests, we tested a global 21. Frago, E., Pujadevillar, J., Guara, M. & Selfa, J. Hyperparasitism and seasonal
goodness-of-fit with Fisher’s C statistic to determine model fitness and obtain the patterns of parasitism as potential causes of low top-down control in Euproctis
final model87 (Supplementary Tables 11 and 12). Finally, we calculated the chrysorrhoea L. (Lymantriidae). Biol. Control 60, 123–131 (2012).
cascading and total effect of each predictor, thus explaining its respective cascaded 22. Rosenheim, J. A., Kaya, H. K., Ehler, L. E., Marois, J. J. & Jaffee, B. A.
effects on ecosystem functionality (i.e., parasitism and hyperparasitism) based on Intraguild predation among biological-control agents: theory and evidence.
the final models (Figs. 2a, 3a; Table 2). SEM analyses were performed by the Biol. Control 5, 303–335 (1995).
“piecewise SEM” package86 of R 4.0.2 software73. 23. Brobyn, P. J., Clark, S. J. & Wilding, N. The effect of fungus infection of
Metopolophium dirhodum [Hom.: Aphididae] on the oviposition behaviour of
the aphid parasitoid Aphidius rhopalosiphi [Hym.: Aphidiidae]. Entomophaga
Statistics and reproducibility. Statistical analysis of data was performed using R 33, 333–338 (1988).
software as described above. For all statistical analysis, data from 25 independent
24. Tscharntke, T. et al. Conservation biological control and enemy diversity on a
measurements was used. The exact number of replicates are indicated in individual
landscape scale. Biol. Control 43, 294–309 (2007).
figure captions and the methods.
25. Rand, T. A., van Veen, F. J. F. & Tscharntke, T. Landscape complexity
differentially benefits generalized fourth, over specialized third, trophic level
Reporting summary. Further information on research design is available in the Nature natural enemies. Ecography 35, 97–104 (2012).
Research Reporting Summary linked to this article. 26. Zhao, Z. H., Hui, C., He, D. H. & Li, B. L. Effects of agricultural intensification
on ability of natural enemies to control aphids. Sci. Rep. 5, 8024 (2015).
27. Vollhardt, I. M. G., Tscharntke, T., Wäckers, F. L., Bianchi, F. J. J. A. & Thies,
Data availability
C. Diversity of cereal aphid parasitoids in simple and complex landscapes.
All data generated in this study can be accessed from the Dryad Digital Repository.
Agric. Ecosyst. Environ. 126, 289–292 (2008).
https://doi.org/10.5061/dryad.pc866t1kz88.
28. Tomanović, Z. et al. Regional tritrophic relationship patterns of five aphid
parasitoid species (Hymenoptera: Braconidae: Aphidiinae) in agroecosystem-
Received: 17 March 2021; Accepted: 1 August 2021; dominated landscapes of southeastern Europe. J. Econ. Entomol. 102, 836–854
(2009).
29. Kaartinen, R. & Roslin, T. Shrinking by numbers: landscape context affects the
species composition but not the quantitative structure of local food webs. J.
Anim. Ecol. 80, 622–631 (2011).
30. Wang, S. & Brose, U. Biodiversity and ecosystem functioning in food webs: the
References vertical diversity hypothesis. Ecol. Lett. 21, 9–20 (2018).
1. van der Plas, F. Biodiversity and ecosystem functioning in naturally assembled 31. Garzke, J., Connor, S. J., Sommer, U. & O’Connor, M. I. Trophic interactions
communities. Biol. Rev. 94, 1220–1245 (2019). modify the temperature dependence of community biomass and ecosystem
2. Lefcheck, J. S. et al. Biodiversity enhances ecosystem multifunctionality across function. PLoS Biol. 17, e2006806 (2019).
trophic levels and habitats. Nat. Commun. 6, 6936 (2015). 32. Pocock, M. J. O. et al. The visualisation of ecological networks, and their use as
3. Fanin, N. et al. Consistent effects of biodiversity loss on multifunctionality a tool for engagement, advocacy and management. Adv. Ecol. Res. 54, 41–85
across contrasting ecosystems. Nat. Ecol. Evol. 2, 269–278 (2018). (2016).
4. Isbell, F. et al. Linking the influence and dependence of people on biodiversity 33. Bersier, L.-F., Banašek-Richter, C. & Cattin, M.-F. Quantitative descriptors of
across scales. Nature 546, 65–72 (2017). food-web matrices. Ecology 83, 2394–2407 (2002).
5. Sánchez-Bayo, F. & Wyckhuys, K. A. G. Worldwide decline of the 34. Tylianakis, J. M., Laliberté, E., Nielsen, A. & Bascompte, J. Conservation of
entomofauna: A review of its drivers. Biol. Conserv. 232, 8–27 (2019). species interaction networks. Biol. Conserv. 143, 2270–2279 (2010).
6. IPBES. Summary for policymakers of the global assessment report on 35. Gilbert, A. J. Connectance indicates the robustness of food webs when
biodiversity and ecosystem services of the Intergovernmental Science-Policy subjected to species loss. Ecol. Indic. 9, 72–80 (2009).
Platform on Biodiversity and Ecosystem Services. (IPBES secretariat, Bonn, 36. Williams, R. J. & Martinez, N. D. Simple rules yield complex food webs.
Germany, 2019). Nature 404, 180–183 (2000).
7. Smith, H. F. & Sullivan, C. A. Ecosystem services within agricultural 37. Galiana, N., Hawkins, B. A. & Montoya, J. M. The geographical variation of
landscapes—farmers’ perceptions. Ecol. Econ. 98, 72–80 (2014). network structure is scale dependent: understanding the biotic specialization
8. Barnes, A. D. et al. Biodiversity enhances the multitrophic control of of host–parasitoid networks. Ecography 42, 1175–1187 (2019).
arthropod herbivory. Sci. Adv. 6, eabb6603 (2020). 38. Banašek-Richter, C., Cattin, M.-F. & Bersier, L.-F. Sampling effects and the
9. Dainese, M. et al. A global synthesis reveals biodiversity-mediated benefits for robustness of quantitative and qualitative food-web descriptors. J. Theor. Biol.
crop production. Sci. Adv. 5, eaax0121 (2019). 226, 23–32 (2004).
COMMUNICATIONS BIOLOGY | (2021)4:979 | https://doi.org/10.1038/s42003-021-02509-z | www.nature.com/commsbio 9ARTICLE COMMUNICATIONS BIOLOGY | https://doi.org/10.1038/s42003-021-02509-z
39. Varennes, Y. D., Boyer, S. & Wratten, S. D. Un-nesting DNA Russian dolls— software program produced by the authors at the University of Massachusetts,
the potential for constructing food webs using residual DNA in empty aphid Amherst. http://www.umass.edu/landeco/research/fragstats/fragstats.html
mummies. Mol. Ecol. 23, 3925–3933 (2014). (2012).
40. Zhu, Y. L. et al. A molecular detection approach for a cotton aphid-parasitoid 69. Liu, B. et al. Secondary crops and non-crop habitats within landscapes
complex in northern China. Sci. Rep. 9, 15836 (2019). enhance the abundance and diversity of generalist predators. Agric. Ecosyst.
41. Staniczenko, P. P. A. et al. Predicting the effect of habitat modification on Environ. 258, 30–39 (2018).
networks of interacting species. Nat. Commun. 8, 792 (2018). 70. Lu, Y. H., Qi, F. J. & Zhang, Y. J. Integrated Management of Diseases and Insect
42. Thies, C. & Tscharntke, T. In Biocontrol-Based Integrated Management of Pests in Cotton (Golden Shield Press, Beijing 2010).
Oilseed Rape Pests (ed. Williams, I.H.). (Springer Netherlands, 2010). 71. Shannon, C. E., Weaver, W., Blahut, R. E. & Hajek, B. The Mathematical
43. Tylianakis, J. M., Tscharntke, T. & Lewis, O. T. Habitat modification alters the Theory of Communications (University of Illinois Press, Urbana, 1949).
structure of tropical host-parasitoid food webs. Nature 445, 202–205 (2007). 72. Kembel, S. W. et al. Picante: R tools for integrating phylogenies and ecology.
44. Grass, I., Jauker, B., Steffandewenter, I., Tscharntke, T. & Jauker, F. Past and Bioinformatics 26, 1463–1464 (2010).
potential future effects of habitat fragmentation on structure and stability of 73. R Development Core Team. R: A language and environment for statistical
plant-pollinator and host-parasitoid networks. Nat. Ecol. Evol. 2, 1408–1417 computing, Version 4.0.2. R Foundation for Statistical Computing, Vienna,
(2018). Austria. http://www.R-project.org (2020).
45. Gagic, V. et al. Food web structure and biocontrol in a four-trophic level 74. Dormann, C. F., Fründ, J. & Gruber, B. Package ‘bipartite’: Visualising
system across a landscape complexity gradient. Proc. Roy. Soc. B. 278, bipartite networks and calculating some (ecological) indices. (2019).
2946–2953 (2011). 75. Huang, H. Y., Zhou, L., Chen, J. & Wei, T. Y. ggcor: Extended tools for
46. Lundgren, J. G. & Fausti, S. W. Trading biodiversity for pest problems. Sci. correlation analysis and visualization. R package version 0.9.7. (2020).
Adv. 1, e1500558 (2015). 76. Oksanen, J. et al. vegan: community ecology package. R. package version 2, 5–6
47. Zhou, K. et al. Effects of land use and insecticides on natural enemies of (2020).
aphids in cotton: first evidence from smallholder agriculture in the North 77. Kassambara, A. & Fabian, M. factoextra: Extract and Visualize the Results of
China Plain. Agric. Ecosyst. Environ. 183, 176–184 (2014). Multivariate Data analyses. R package version 1.0.7. (2020).
48. Zhang, Z. Q. The natural enemies of Aphis gossypii Glover (Hom., Aphididae) 78. Akaike, H. An information criterion (AIC). Math. Sci. 14, 5–9 (1976).
in China. J. Appl. Entomol. 114, 251–262 (2009). 79. Burnham, K. P. & Anderson, D. R. Multimodel inference understanding AIC
49. Gagic, V. et al. Agricultural intensification and cereal and BIC in model selection. Sociol. Method. Res. 33, 261–304 (2004).
aphid–parasitoid–hyperparasitoid food webs: network complexity, temporal 80. Cardinale, B. J. et al. Effects of biodiversity on the functioning of trophic
variability and parasitism rates. Oecologia 170, 1099–1109 (2012). groups and ecosystems. Nature 443, 989–992 (2006).
50. Vollhardt, I. M. G. et al. Influence of plant fertilisation on cereal aphid- 81. Fox, J. & Weisberg, S. An R Companion to Applied Regression, Third Edition.
primary parasitoid-secondary parasitoid networks in simple and complex (Thousand Oaks CA: Sage., 2011).
landscapes. Agric. Ecosyst. Environ. 281, 47–55 (2019). 82. Bates, D., Mächler, M., Bolker, B. & Walker, S. Fitting linear mixed-effects
51. Sullivan, D. J. & Völkl, W. Hyperparasitism: multitrophic ecology and models using lme4. J. Stat. Softw. 67, 1–48 (2015).
behavior. Annu. Rev. Entomol. 44, 291–315 (1999). 83. Bartoń, K. MuMIn: Multi-Model Inference. R package version 1.43.17. (2020).
52. Dainese, M., Montecchiari, S., Sitzia, T., Sigura, M. & Marini, L. High cover of 84. Thompson, R. M. et al. Food webs: reconciling the structure and function of
hedgerows in the landscape supports multiple ecosystem services in biodiversity. Trends Ecol. Evol. 27, 689–697 (2012).
Mediterranean cereal fields. J. Appl. Ecol. 54, 380–388 (2016). 85. Tylianakis, J. M. & Binzer, A. Effects of global environmental changes on
53. Landis, D. A., Wratten, S. D. & Gurr, G. M. Habitat management to conserve parasitoid–host food webs and biological control. Biol. Control 75, 77–86
natural enemies of arthropod pests in agriculture. Annu. Rev. Entomol. 45, (2014).
175–201 (2000). 86. Lefcheck, J. S. piecewiseSEM: Piecewise structural equation modelling in r for
54. Thies, C., Roschewitz, I. & Tscharntke, T. The landscape context of cereal ecology evolution, and systematics. Methods Ecol. Evol. 7, 573–579
aphid-parasitoid interactions. Proc. Roy. Soc. B. 272, 203–210 (2005). (2016).
55. Plećaš, M. et al. Landscape composition and configuration influence cereal 87. Shipley, B. The AIC model selection method applied to path analytic models
aphid–parasitoid–hyperparasitoid interactions and biological control compared using a d-separation test. Ecology 94, 560–564 (2013).
differentially across years. Agric. Ecosyst. Environ. 183, 1–10 (2014). 88. Yang, F. et al. The data for “Species diversity and food web structure jointly
56. Sirami, C. et al. Increasing crop heterogeneity enhances multitrophic diversity shape natural biological control in agricultural landscapes”. Dryad, Dataset
across agricultural regions. Proc. Natl Acad. Sci. USA 116, 16442–16447 https://doi.org/10.5061/dryad.pc866t1kz (2021).
(2019).
57. Lichtenberg, E. M. et al. A global synthesis of the effects of diversified farming
systems on arthropod diversity within fields and across agricultural Acknowledgements
landscapes. Glob. Change Biol. 23, 4946–4957 (2017). We are very grateful to Dr. Jason Tylianakis, Dr. Claudio Gratton, and Dr. Lia Hemerik
58. Osorio, S., Arnan, X., Bassols, E., Vicens, N. & Bosch, J. Local and landscape for their helpful suggestions and revisions to an earlier version of the manuscript. This
effects in a host-parasitoid interaction network along a forest-cropland study was funded by the National Key R&D Program of China (2017YFD0201900) and
gradient. Ecol. Appl. 25, 1869–1879 (2015). the National Natural Science Funds of China (31572019, 31901892).
59. Dunne, J., Williams, R. & Martinez, N. Network topology and biodiversity loss
in food webs: robustness increases with connectance. Ecol. Lett. 5, 558–567 Author contributions
(2002). Y.L. conceived the idea that was refined by K.W. and W.W.; F.Y., B.L., and Y.Z. per-
60. Montoya, J. M., Rodríguez, M. A. & Hawkins, B. A. Food web complexity and formed the experiments. B.L. analyzed the data; F.Y., B.L., and Y.L. wrote the draft. All
higher-level ecosystem services. Ecol. Lett. 6, 587–593 (2003). authors contributed to the revision of the manuscript.
61. Hawkins, B. A. Parasitoid-host food webs and donor control. Oikos 65,
159–162 (1992).
62. Yeakel, J. D. et al. Diverse interactions and ecosystem engineering can stabilize Competing interests
community assembly. Nat. Commun. 11, 3307 (2020). The authors declare no competing interests.
63. Poisot, T., Mouquet, N. & Gravel, D. Trophic complementarity drives the
biodiversity-ecosystem functioning relationship in food webs. Ecol. Lett. 16,
853–861 (2013).
Additional information
Supplementary information The online version contains supplementary material
64. White, L., O’Connor, N. E., Yang, Q., Emmerson, M. C. & Donohue, I.
available at https://doi.org/10.1038/s42003-021-02509-z.
Individual species provide multifaceted contributions to the stability of
ecosystems. Nat. Ecol. Evol. 4, 1594–1601 (2020).
Correspondence and requests for materials should be addressed to Y.L.
65. Ho, H.-C., Tylianakis, J. M. & Pawar, S. Behaviour moderates the impacts of
food-web structure on species coexistence. Ecol. Lett. 24, 298–309 (2021). Peer review information Communications Biology thanks the anonymous reviewers for
66. Holland, J. M. et al. Agri-environment scheme enhancing ecosystem services: their contribution to the peer review of this work. Primary Handling Editors: Quan-Xing
A demonstration of improved biological control in cereal crops. Agric. Ecosyst. Liu and Caitlin Karniski.
Environ. 155, 147–152 (2012).
67. Batary, P., Dicks, L., Kleijn, D. & Sutherland, W. The role of agri-environment Reprints and permission information is available at http://www.nature.com/reprints
schemes in conservation and environmental management: European Agri-
Environment Schemes. Conserv. Biol. 29, 1006–1016 (2015).
Publisher’s note Springer Nature remains neutral with regard to jurisdictional claims in
68. McGarigal, K., Cushman, S., Maile, N. & Ene, E. FRAGSTATS v4: Spatial
published maps and institutional affiliations.
Pattern Analysis Program for Categorical and Continuous Maps. Computer
10 COMMUNICATIONS BIOLOGY | (2021)4:979 | https://doi.org/10.1038/s42003-021-02509-z | www.nature.com/commsbioCOMMUNICATIONS BIOLOGY | https://doi.org/10.1038/s42003-021-02509-z ARTICLE
Open Access This article is licensed under a Creative Commons
Attribution 4.0 International License, which permits use, sharing,
adaptation, distribution and reproduction in any medium or format, as long as you give
appropriate credit to the original author(s) and the source, provide a link to the Creative
Commons license, and indicate if changes were made. The images or other third party
material in this article are included in the article’s Creative Commons license, unless
indicated otherwise in a credit line to the material. If material is not included in the
article’s Creative Commons license and your intended use is not permitted by statutory
regulation or exceeds the permitted use, you will need to obtain permission directly from
the copyright holder. To view a copy of this license, visit http://creativecommons.org/
licenses/by/4.0/.
© The Author(s) 2021
COMMUNICATIONS BIOLOGY | (2021)4:979 | https://doi.org/10.1038/s42003-021-02509-z | www.nature.com/commsbio 11You can also read