Assessment of microbial α-diversity in one meter squared topsoil
←
→
Page content transcription
If your browser does not render page correctly, please read the page content below
Soil Ecol. Lett.
https://doi.org/10.1007/s42832-021-0111-5

RESEARCH ARTICLE

Assessment of microbial α-diversity in one meter squared
topsoil
Shuzhen Li1,2, Xiongfeng Du1,3, Kai Feng1,3, Yueni Wu1,3, Qing He1,3, Zhujun Wang1,3, Yangying Liu1,3,
Danrui Wang1,3, Xi Peng1,3, Zhaojing Zhang4, Arthur Escalas5, Yuanyuan Qu2, Ye Deng1,3,4 ,*

1 CAS Key Laboratory of Environmental Biotechnology, Research Center for Eco-Environmental Sciences, Chinese Academy of Sciences,
  Beijing 100085, China
2 Key Laboratory of Industrial Ecology and Environmental Engineering (Ministry of Education), School of Environmental Science and
  Technology, Dalian University of Technology, Dalian, 116024, China
3 College of Resources and Environment, University of Chinese Academy of Sciences, Beijing 100049, China
4 Institute for Marine Science and Technology, Shandong University, Qingdao 266237, China
5 MARBEC, Université de Montpellier, CNRS, IRD, IFREMER, Montpellier Cedex 5, 34090, France

HIGHLIGHTS                                       GRAPHICAL              ABSTRACT

• Roughly 15 919 to 56 985 prokaryotic spe-
cies inhabited in 1 m2 grassland topsoil.
• Three clustering tools, including DADA2,
UPARSE and Deblur showed huge differ-
ences.
• Nearly 500 000 sequences were required
to catch 50% species.
• Insufficient sequencing depth greatly
affected observed and estimated richness.
• Higher order of Hill numbers reached satura-
tion with fewer than 100 000 sequences.

                                                 ABSTRACT

ARTICLE INFO                                     Due to the tremendous diversity of microbial organisms in topsoil, the estimation of saturated
                                                 richness in a belowground ecosystem is still challenging. Here, we intensively surveyed the 16S
Article history:                                 rRNA gene in four 1 m2 sampling quadrats in a typical grassland, with 141 biological or technical
                                                 replicates generating over 11 million sequences per quadrat. Through these massive data sets and
Received March 7, 2021                           using both non-asymptotic extrapolation and non-parametric asymptotic approaches, results
Revised June 15, 2021                            revealed that roughly 15 919±193, 27 193±1076 and 56 985±2347 prokaryotic species inhabited
                                                 in 1 m2 topsoil, classifying by DADA2, UPARSE (97% cutoff) and Deblur, respectively, and
Accepted June 20, 2021
                                                 suggested a huge difference among these clustering tools. Nearly 500 000 sequences were required
                                                 to catch 50% species in 1 m2, while any estimator based on 500 000 sequences would still lose about
Keywords:                                        a third of total richness. Insufficient sequencing depth will greatly underestimate both observed and
                                                 estimated richness. At least ~911 000, ~3 461 000, and ~1 878 000 sequences were needed for
Grassland                                        DADA2, UPARSE, and Deblur, respectively, to catch 80% species in 1 m2 topsoil, and the numbers
Topsoil                                          of sequences would be nearly twice to three times on this basis to cover 90% richness. In contrast, α-
                                                 diversity indexes characterized by higher order of Hill numbers, including Shannon entropy and
Prokaryote                                       inverse Simpson index, reached saturation with fewer than 100 000 sequences, suggesting
Richness                                         sequencing depth could be varied greatly when focusing on exploring different α-diversity
α-diversity                                      characteristics of a microbial community. Our findings were fundamental for microbial studies that
                                                 provided benchmarks for the extending surveys in large scales of terrestrial ecosystems.
Hill number
                                                                                                                        © Higher Education Press 2021

* Corresponding authors
E-mail address: yedeng@rcees.ac.cn (Y. Deng)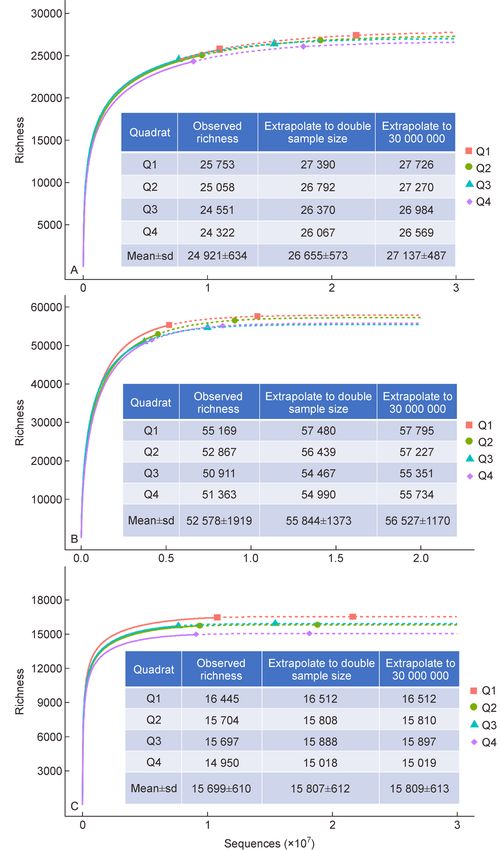
2                                                                      Assessment of microbial α-diversity in one meter squared topsoil

1 Introduction                                                      estimation of species richness.
                                                                       In another aspect, the indexes of α-diversity, i.e., Shannon
Species richness is a fundamental measurement for commu-            entropy (Shannon, 1948) and inverse Simpson index (Simp-
nity α-diversity, as well as forming the basis of many              son, 1949), have been regarded as the best choice to quantify
ecological models of community structure (Gotelli and               abundance-based species diversity in both macro- and micro-
Colwell, 2001). However, for soil prokaryotic assemblages           ecological surveys (Haegeman et al., 2013; Alberdi and
(i.e., bacterial and archaeal community), it is believed that       Gilbert, 2019). Recently, Chao et al. unified all commonly used
saturated richness, even approximate saturation, has never          α-diversity indexes as Hill numbers by setting up a weighted
been reached due to insufficient sampling of the tremendous          value (q) to the abundances (Ellison, 2010; Chao et al.,
number of individuals (Gotelli and Colwell, 2001; Schloss and       2014b). This unified statistical approach on measuring
Handelsman, 2006; Roesch et al., 2007). High-throughput             biodiversity has been refined and improved in recent years,
techniques, as sequenced 16S rRNA genes in environmental            but few studies have incorporated their diversity surveys
DNA, have become powerful tools to characterize this                through this approach (Haegeman et al., 2013; Kang et al.,
astonishing diversity of microorganisms (Roesch et al.,             2016; Hu et al., 2019). Since Hill number provides a
2007). The simplest way to measure microbial richness is to         convenient way to compare diversity estimates between
count how many species, as represented by Operational               different studies, it has been recommended for DNA based
Taxonomic Units (OTUs) or Amplicon Sequence Variants                diversity analysis (Alberdi and Gilbert, 2019). Species rich-
(ASVs), are observed within a sample. Many studies have             ness, as a fundamental component of α-diversity, can be
attempted to uncover this extraordinary diversity, especially at    integrated to Hill numbers with the weighted value q = 0. As q
large, even global scales (Tedersoo et al., 2014; Delgado-          rises, Hill number begins to take account of abundance and is
Baquerizo et al., 2018; Wu et al., 2019). In contrast, little       increasingly influenced by high-abundance species, some
research has focused on species richness at small scales. In        other commonly used indices, including Shannon entropy (q =
fact, it is more advantageous to conduct thorough sampling at       1) and inverse Simpson index (q = 2), can be obtained to offer
small scales to compensate for the potential under-sampling         insights into dominance and other community characteristics.
bias that could result in an underestimation of richness. It can       In this study, we conducted an intensive sampling
also provide a baseline value for microbial diversity in a given    campaign (564 replicates in total) in a grassland in northern
small area, and a theoretical basis for large-scale extrapola-      China by using a nested sampling design in four sampling
tion.                                                               quadrats (1 m2 of topsoil). We attempted to address two
    In general, for diverse prokaryotic taxa, as more individuals   fundamental questions through this deep sequencing. (i) How
are sequenced, more species will be observed. Thus, several         many prokaryotic (including bacterial and archaeal) species
extrapolation methods have been employed to infer the total         inhabit 1 m2 of grassland topsoil (0-20 cm)? (ii) What are the
richness (Chao and Chiu, 2016). The first is asymptotic              impacts of sequencing depth on the α-diversity profiles
approach based on species richness estimators. For exam-            through Hill number measurement?
ple, some indicators infer the richness by taking into account
the rare species present in the tail of the abundance
                                                                    2 Material and methods
distribution (Hugerth and Andersson, 2017), such as Chao1,
ACE, and abundance-Jack1 (Abundance-based Coverage
Estimator) (Heltshe and Forrester, 1983; Chazdon et al.,            2.1 Study site
1998; Chao et al., 2014a), which could be classed into
individual-based assessment. Alternatively, neglecting the          Our study was conducted in a semiarid temperate steppe in
species abundances, sample-based assessment only con-               Duolun County (42°02′ N, 116°17′ E, 1324 m a.s.l.), Inner
siders species accumulation with the increase in number of          Mongolia Autonomous Region of China. This grassland is
samples, with the representative indicators including Chao2,        located in a natural grazing region without fertilizer or pesticide
ICE, and incidence-Jack1 (Incidence-based Coverage Esti-            usages. This site belongs to typical temperate zone habitat,
mator) (Chao, 1987; Lee and Chao, 1994). The second is non-         and characterized by a semiarid continental monsoon climate.
asymptotic approach based on rarefaction and extrapolation.         Annual mean temperature is 2.1°C and annual mean
The sample-size-based rarefaction and extrapolation of              precipitation is ~385.5 mm (Zhang et al., 2017a). Soil is
species richness has been proposed and recommended,                 Haplic Calcisols (FAO classification) or chestnut soil (Chinese
which can be rarefied to small sample sizes or extrapolated to       classification) with a mean bulk density of ~1.31 g cm–3.
large sample sizes (Chao and Jost, 2012; Colwell et al.,            Perennials are dominated species, including Artemisia frigida,
2012). These types of asymptotic strategies construct a             Agropyron cristatum, Cleistogenes squarrosa, and Stipa
unified sampling framework for quantifying and comparing             krylovii (Ru et al., 2018).
richness across multiple communities based on finite samples
(Chao and Chiu, 2016). Overall, both non-asymptotic extra-          2.2 Soil sampling
polation and non-parametric asymptotic approaches can
complement each other and provide a more accurate                   We selected four square plots, each with an area of 1 m2 (1 m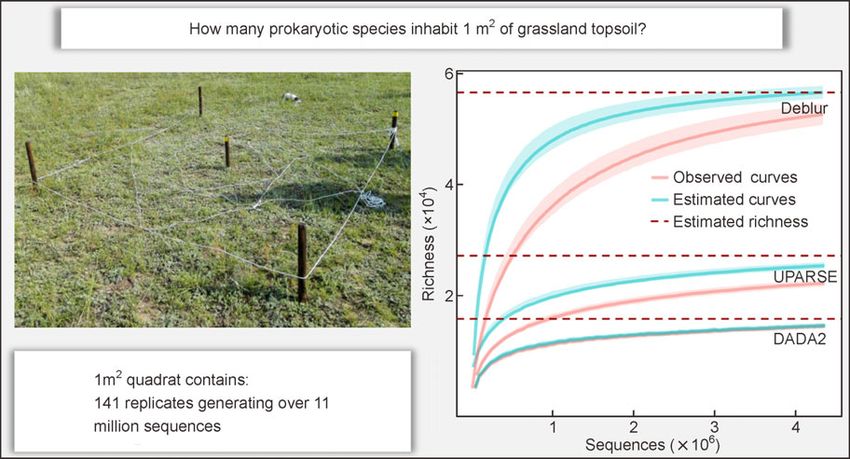
Shuzhen Li et al. 3
1 m), as quadrats (named Q1, Q2, Q3 and Q4) from the performed in a 20 μL mixture with 10 μL SuperReal PreMix
steppe within a 2000 m transect. In each quadrat, 33 soil Plus (SYBR Green, TIANGEN, FP205), 10 ng of template
cores/samples (0-20 cm depth and 4 cm in diameter) were DNA and 1.5 μL of 10 μM primer (10 μM; Forward: 5′-CCTA-
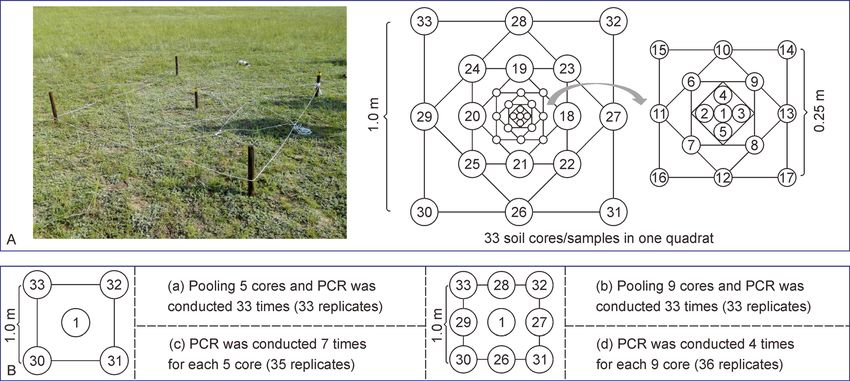
collected by a nest design in August 2017 (Fig. 1). Soils were CGGGAGGCAGCAG-3′; Reverse: 5′-TTACCGCGGCTGCT-
sieved through a 2 mm mesh to remove roots and rocks. GGCAC-3′). Each reaction was performed in triplicate with
Samples were immediately stored in iceboxes and transferred parallel negative controls under denaturing for 15 min at 95°C,
to the laboratory. Thereafter, some technical replicates, 40 cycles of 10 s at 95°C, 30 s at 50°C and 32 s at 72°C in a
including extracting DNA before or after soil sample mixing CFX96 Touch Real-Time PCR Detection System (BioRad).
and different sequencing barcodes on each sample, were Copy numbers of the 16S rRNA gene were normalized and
made to further ensure the robustness of our results. In all, calculated using the ΔCt method. According to previous
each quadrat included 33 samples with total of 141 replicates. studies, the number of 16S rRNA gene copies is approxi-
A detailed description of replicate design is available in our mately an order of magnitude greater than the number of total
previous research (Li et al., 2021), as well as given in the prokaryotes (Bressan et al., 2015; Zhang et al., 2017c). We
Supplementary Methods. used this knowledge to convert 16S rRNA gene copy number
to prokaryotic cell number. Prokaryotic cell number was then
applied to scaling laws (Locey and Lennon, 2016) to estimate
2.3 Measurement of soil properties
species richness.
Subsamples from each soil sample were collected to measure
the total nitrogen (TN), ammonium nitrogen (NH4+-N), nitrate 2.6 Data processing
nitrogen (NO3–-N), and total organic carbon (TOC) at the
Institute of Soil Science, Chinese Academy of Sciences Raw sequences were quality filtered and analyzed with a
(Nanjing, China). TN was measured by potassium persulfate public Galaxy pipeline (http://mem.rcees.ac.cn:8080) (Feng
oxidation method, NH4+-N and NO3–-N were quantified with et al., 2017). Sequences were demultiplexed according to
NH4Cl extraction method, TOC was estimated with potassium sample-specific barcodes with one mismatch allowed, and
dichromate oxidation-ferric salt titration method (Bao, 2000). then barcodes and primers were trimmed. Paired of
In addition, soil pH was measured in 1:2.5 (W/V) suspension sequences were merged by FLASH, and low-quality bases
of soil in distilled water. Soil moisture content was calculated with an average quality score lower than 20 were discarded by
by the weight loss after thoroughly dry. Btrim (Kong, 2011; Magoc and Salzberg, 2011). Additionally,
sequences with any ambiguous bases were removed and
2.4 DNA extraction, PCR and high-throughput sequencing only sequences within 245–260 bp were kept. After quality
trimming, Operational Taxonomic Units (OTUs) were gener-
A total of 0.5 g soil was used to extracted DNA via a FastDNA ated using UPARSE at 97% sequencing similarity threshold
SPIN kit for soil (Qbiogene, Solon OH). The 16S rRNA gene (Edgar, 2013; Zhang et al., 2017b). Singletons, which are
was amplified using primer set 515F (5′-GTGCCAGCMGCC- defined as OTUs with only one read across all replicates, were
GCGGTAA-3′) and 806R (5′-GGACTACHVGGGTWTCTAAT- discarded. In addition, Deblur and DADA2 were also
3′) targeting the V4 hypervariable region with sample-specific conducted to further explore their commonalities in microbial
paired barcodes (Caporaso et al., 2012). The polymerase ecology studies and provide more messages in microbial
chain reaction (PCR) was performed in a 50 μL mixture, richness estimation. Deblur was applied to generate Amplicon
including 0.5 μL Taq DNA polymerase (TaKaRa), 5 μL of 10 Sequence Variants (ASVs), only sequences which appear at
PCR buffer, 1.5 μL dNTP mixture, 1.5 μL of 10 μM each least 10 times study wide and 1 time per sample were
primer, 1 μL of template DNA (20–30 ng μL–1), and 39 μL retained, other parameters were default options according to
ddH2O. The reaction conditions were as follows: denaturation the recommendation from Deblur workflow (Amir et al., 2017).
at 94°C for 1 min, 30 cycles of 94°C for 20 s, 57°C for 25 s, For DADA2 pipeline, we used standard filtering parameters in
68°C for 45 s, thereafter extension at 68°C for 10 min. PCR filterAndTrim function: maxN = 0 (sequences with ambiguous
products was purified with E.Z.N.A.® Gel Extraction Kit nucleotides), truncQ = 2 (truncate reads at the first instance of
(Omega Bio-Tek, Inc., USA), quantified by Nanodrop 2000 a quality score less than or equal to 2) and maxEE = 2
and pooled in equimolar concentrations. Sequencing library (maximum number of expected errors allowed in a read).
was constructed under the instructions of Illumina® Considering our big data set, “pseudo” option was used in
VAHTSTM Nano DNA Library Prep Kit (Vazyme Biotech dada function to perform sample inference. For other steps in
Co., Ltd). Sequencing was performed on Illumina Hiseq DADA2, the workflow recommended by the DADA2 pipeline
PE250 kit (Guangdong Magigene Biotechnology Co., Ltd). tutorial (1.8) was utilized to generate an ASV table followed
the default parameters (Callahan et al., 2016).
2.5 Quantitative PCR (qPCR)
2.7 Statistical analysis
Extracted DNA was further quantified by qPCR to determine
the 16S rRNA gene abundance. qPCR reaction was For each different classification algorithms, data from 141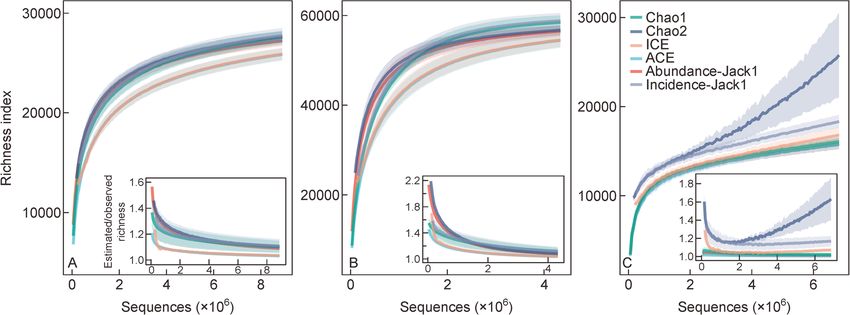
4                                                                             Assessment of microbial α-diversity in one meter squared topsoil

replicates in each quadrat were pooled before further                      defined as (Hill, 1973):
analysis. Two approaches, including an asymptotic approach                                                     !1=ð1 – qÞ
                                                                                                   X
                                                                                                   S
via species richness estimation, and a non-asymptotic                                    q
                                                                                             D¼          pqi                , q³0 and q≠1
approach via standardized sample size were applied to infer                                        i¼1
species richness. For asymptotic approach, various non-
                                                                          S is the species number, pi is the relative abundance of
parametric richness estimators were used for estimating the
                                                                          species i. D is the diversity value, which includes the three
theoretical number of species by fossil package in R project
                                                                          most important diversity measures: species richness (q = 0),
(Vavrek, 2011). To be specific, as estimates of unseen
                                                                          the exponential of Shannon entropy (q = 1), and the inverse of
richness are based on observed rare species, either
                                                                          Simpson index (q = 2).
abundance (Chao1, ACE and Jack1) or incidence (Chao2,
ICE and Jack1) based methods were performed for estima-
tion, to reduce the preference of investigator and for mutual              2.9 Data availability
corroboration (Chao et al., 2005; Rajakaruna et al., 2016). For
non-asymptotic approach, rarefaction and extrapolation                     Raw data after sequencing have been deposited in the
curves were created on the basis of standardized sample                    Genome Sequence Archive (Wang et al., 2017) in BIG Data
size, to test whether the retained reads were enough to cover              Center (Zhang et al., 2019a), Beijing Institute of Genomics
the vast majority of species and estimate the theoretical                  (BIG), Chinese Academy of Sciences (http://bigd.big.ac.cn/
richness. Additionally, diversities based on Hill number were              gsa). Accession number is CRA001897.
calculated. Non-asymptotic estimate approach and Hill
numbers were implemented by iNEXT package in R project
                                                                          3 Results
(Hsieh et al., 2016). Representative sequences obtained by
UPARSE, Deblur and DADA2 were classified into different
                                                                          3.1 Sampling design, overall sequencing effort and
taxonomy by Bayesian classifier against the RDP training set,
                                                                          community composition
respectively (Wang et al., 2007). All results were visualized
using ggplot2 package in R project (Ginestet, 2011).                      To address accurate microbial diversity in 1 m2 of topsoil, an
                                                                          intensive sampling effort was implemented across four
2.8 Measurement of Hill numbers                                           quadrats positioned in a typical grassland (Fig. 1). Measure-
                                                                          ment of soil properties of these samples showed that there
Hill number (or effective number of species) means the                    was a low heterogeneity within each quadrat, while there were
number of equally abundant species that are required to give              some degrees of environmental heterogeneity among quad-
the same value of a diversity measure (Chao et al., 2014b). It’s          rats (Table S1). After quality control of the sequences, a total
a mathematically unified parametric family of diversity indexes            of 54 122 060 reads were retained, resulting in 16 145 431,
distinguishing themselves by a parameter (q), which deter-                13 554 635, 11 659 856, and 12 762 138 reads for quadrats
mines the sensitivity of the index to species relative                    Q1, Q2, Q3, and Q4, respectively. These sequences were
abundances. The Hill number of order q in a sample is                     used for subsequent species classifications by UPARSE or

    Fig. 1 Detailed experiment design for sampling in one quadrat. (A) 33 soil cores/samples in one quadrat. (B) Four pooling strategies.
Shuzhen Li et al. 5
Deblur. Meanwhile, DADA2 was conducted by raw sequen- We may assume for the moment that the value for richness
cing output. After OTU or ASV generation, the four quadrats, extrapolated to the maximum sample size is the value of
respectively, retained 7 681 474 to 10 993 500 sequences by theoretical richness, i.e., 27 137 for UPARSE, 56 527 for
UPARSE, 3 733 659 to 5 194 295 sequences by Deblur and Deblur and 15 809 for DADA2. Based on this hypothesis, we
7 697 276 to 10 815 483 sequences by DADA2 (Table S2). examined the number of reads required to achieve different
The microbial communities across these four different proportions of the theoretical richness (Table 1). Roughly
quadrats were identified. 57.70%, 59.60% and 45.70% 45 538±6226, 81 235±10 224 and 11157±829 reads for
species were shared among all four quadrats for UPARSE, UPARSE, Deblur and DADA2, respectively, would only
Deblur and DADA2, respectively (Supplemental Fig. S1). The account for 20% of species in 1m2 grassland topsoil. For
number of species unique to each quadrat was very small in UPARSE and Deblur, nearly 500 000 sequences were
UPARSE (2.00% to 5.01%) and Deblur (0.55% to 3.49%), required to reach 50% of species, while roughly 100 000
while this number was higher in DAD2 (8.24% to 12.8%). sequences were enough for DADA2. This number is much
Among three classification algorithms, DADA2 identified the higher than the reads per sample, or even per site, currently
fewest phyla (34) and they were all within UPARSE’s radius obtained from high-throughput microbial sequencing studies,
(39). Phyla obtained by both of DADA2 and UPARSE were especially considering this number only applies to a small
included in Deblur (43). Highly similar community composition area (1 m2). To catch 80% richness, about 3 461 562±
was observed via the different classification methods. 297 567, 1 878 148±174 972 and 911 446±212 892 sequenc-
Actinobacteria, Proteobacteria, Acidobacteria, Thaumarch- es were needed for UPARSE, Deblur and DADA2, respec-
aeota, Firmicutes, Verrucomicrobia, Bacteroidetes, Gemma- tively, and the numbers of sequences would be nearly twice
timonadetes, and Planctomycetes were the dominant phyla on this basis to cover 90% richness. Furthermore, UPARSE
(abundance>2%) present in grassland (Supplemental could cover more diverse species with a small sample size,
Fig. S2a). Abundance of Thaumarchaeota was higher by while Deblur captured more species when sample size was
UPARSE, and DADA2 identified more abundance of Actino- large, that is, Deblur requires less sequencing depth when the
bacteria, Acidobacteria and Gemmatimonadetes. Additionally, goal is to observed over 50% species in 1 m2 grassland
genera belonged to Nitrososphaera, Gp4, Spartobacteria topsoil compared with UPARSE. Overall, DADA2 was the best
genera incertae sedis, Bacillus, Rubrobacter, Gp6, Gaiella, at catching species under the same sequencing depth.
and Gemmatimonas were predominant (Supplemental
Fig. S2b). UPARSE reckoned more abundance of Nitroso-
3.3 The richness estimation by non-parametric asymptotic
sphaera than Deblur and DADA2.
approach
3.2 The richness estimation by non-asymptotic extrapolation For asymptotic approach, six different non-parametric rich-
approach ness estimators, including Chao1, Chao2, ACE, ICE, abun-
dance-Jack1, and incidence-Jack1, were chosen to estimate
In this study, the first crucial question we focused on was how the theoretical species numbers in each quadrat. Richness
many prokaryotic species inhabit 1 m2 of topsoil. For the non- estimations were 27 193±1076 for UPARSE, 56 985±2347
asymptotic approach, rarefaction and extrapolation curves for Deblur, and 18 215±3789 for DADA2 (Table 2). The
were created based on standardized sample size (Fig. 2). Due estimated richness increased rapidly with the sample size at
to the extremely high sequencing depth, the rarefaction curve the beginning, and then gradually leveled off, while the ratio of
passed the inflection point and tended to flatten out. At this estimated richness to observed richness declined quickly at
point, different classification algorithms could greatly impact first and tended to flatten off to approximately 1 at greater
the final number of OTUs or ASVs, both observed and sequencing depth, except for three incidence-based coverage
estimated. The average observed richness was 24 921±634 estimators (ICE, incidence-Jack1 and Chao2) by DADA2
for UPARSE, 52 578±1919 for Deblur and 15 699±610 for (Fig. 3). We use Chao2 as a typical example to illustrate this
DADA2, a 3.35-fold difference between the maximum and the result. According to the classical define of Chao2: SChao2 ¼
minimum. To estimate the theoretical richness, the rarefaction m – 1 Q21
Sobs þ , where Sobs is observed richness, m is
curve was first extrapolated to double the sample size by m 2Q2
using the default setting of iNEXT package in R (Fig. 2). The sample number, Q1 is the frequency of uniques (species that
extrapolation curve was basically flat and estimated richness occur in only one sample) and Q2 is the frequency of
for UPARSE, Deblur and DADA2 were 26 655±573, 55 844± duplicates (species that occur in only two samples). This
1373 and 15 807±612, respectively. On that basis, if one anomaly was mainly caused by abnormally increasing Q1 with
continues to extrapolate until 30 or 20 million of reads, the more sample size by DADA2 (Supplemental Fig. S3). Mean-
number of species will increase slightly to 27 137±487, 56 527 while, ICE and incidence-Jack1 also include Q1 in their
±1170 and 15 809±613 for UPARSE, Deblur and DADA2 formular, so the effect was also visible. This anomaly
respectively. The following increases of richness could be suggested that DADA2 may be inapplicable to incidence-
negligible because all curves were approximately saturated based coverage estimator in our study. Based on these
(Fig. 2). results, we did not consider incidence-based coverage6 Assessment of microbial α-diversity in one meter squared topsoil
Fig. 2 Rarefaction and extrapolation curves by (A) UPARSE, (B) Deblur, and (C) DADA2. The points at the end of the solid line are the
number of observed species. The points on the dotted line are the species number obtained by extrapolating to the double current sequence
number. Embedded table shows observed or estimated richness under different sequences. sd is standard deviation.Shuzhen Li et al. 7 Table 1 Required sequences to reach specific proportion of theoretical species. Proportion of theoretical species Sequences (UPARSE) Sequences (Deblur) Sequences (DADA2) 10% 18 616±2776 26 551±3720 3318±384 20% 45 538±6226 81 235±10 224 11 157±829 30% 110 625±13 428 166 617±17 656 25 729±2687 40% 253 096±16 536 293 464±29 653 52 563±6460 50% 501 266±42 870 481 417±49 278 105 194±18 894 60% 960 509±84 623 755 494±68 604 201 101±28 049 70% 1 817 972±157 057 1 178 895±103 394 405 203±69 567 80% 3 461 562±297 567 1 878 148±174 972 911 446±212 892 90% 7 015 759±688 290 3 277 020±383 091 2 456 694±840 372 Fig. 3 Relationships of sequences and richness index (A) UPARSE, (B) Deblur, and (C) DADA2. The image embedded in the lower right corner is the ratio of estimated richness divided by observed richness with different sample size. The shaded regions around the curves are the average value±95% confidence interval. estimators for DADA2, and adjusted richness estimations Deblur and DADA2 reached 75.44% from Chao1, 88.39% were 15 919±193 (Adjusted value in Table 2). By comparing from Chao2 and 87.59% from Jack1 of the theoretical all estimators, Chao1 and Chao2 indexes were closest to the richness, respectively. These results highlight how insufficient observed richness at all sequencing depths, while ACE (ICE) sequencing depth will cause great deviations not only in and abundance-Jack1 (incidence-Jack1) intersected as the observed richness, but also in estimated richness by sequencing deepened by UPARSE and Deblur. commonly used richness estimation indexes. While these non-parametric richness estimators have been widely applied in estimating microbial community richness, 3.4 Diversity characterized by high order of Hill numbers high number of reads, as seen in this study, are rarely obtained as the typical sampling effort generally returns Richness has become one of the most fundamental and 10 000 to 100 000 sequences per sample. In this context, we important indicators of community diversity. However, this applied the estimated richness for each estimator in Table 2 as measurement does not consider the abundance of individuals the number of theoretical richness. According to this result, we within a community, limiting our understanding of α-diversity. estimated the proportion of estimated richness to theoretical Recently, richness (Hill, q = 0) has been unified into a general richness using 50 000 to 1 000 000 reads (Tables S3, S4, S5). framework of Hill numbers. As all Hill numbers are presented Using 50 000 reads per sample, the range of estimates were as intuitive units of effective numbers of species, they can be 26.76% to 33.38% for UPARSE, 23.13% to 35.08% for Deblur, directly compared across orders q, especially for Shannon and 36.79% to 42.27% for DADA2. With a sampling effort of entropy (Hill, q = 1) and inverse Simpson index (Hill, q = 2). 1 000 000 reads, the highest richness estimation for UPARSE, Here we explored the relationships of sequencing depth on
8

Table 2 Observed and estimated richness by non-parametric asymptotic approach.
Methods            Observed richness        Chao1               Chao2               ACE                 ICE         Abundance-Jack1     Incidence-Jack1             Average

UPARSE                24 921±634          27 255±539          27 634±546         25 855±611         25 934±614         28 113±585          28 365±594            27 193±1076
                                        (91.43±0.60%)       (90.18±0.58%)      (96.38±0.18%)      (96.09±0.17%)      (88.64±0.42%)       (87.85±0.40%)

Deblur                52 578±1919        56 534±1173         56 780±1127        54 477±1618        54 615±1618        59 541±1188         59 962±1198            56 985±2347
                                        (92.98±1.65%)       (92.58±1.74%)      (96.50±0.73%)      (96.26±0.76%)      (88.29±1.76%)       (87.67±1.80%)

DADA2                 15 699±610          15 809±613         25 764±4716         15 806±616         16 848±869         16 141±635         18 920±1047            18 215±3879
                                        (99.30±0.39%)       (62.05±8.16%)      (99.33±0.22%)      (93.23±1.33%)      (97.27±0.78%)       (83.04±1.55%)      (Adjusted: 15 919±193)

The values in parentheses are the ratio of the observed richness to the estimated richness. Adjusted value for DADA2 was the average value of three abundance-based coverage estimators
(Chao1, ACE and Abundace-Jack1).
                                                                                                                                                                                          Assessment of microbial α-diversity in one meter squared topsoil
Shuzhen Li et al. 9
observed Hill numbers and estimated theoretical Hill numbers 2016). In our study, a total of 141 replicates per a 1 m2 quadrat
(Table 3). From our results, observed Hill numbers were were collected and sequenced, and by far the deepest
almost the same as the estimated numbers. Estimated sequencing of a small-scale area were obtained (Table S2).
Shannon entropy was found to be among 1134 and 1915, Additionally, although the larger spatial distance among the
and estimated inverse Simpson index were among 181 and four quadrats lead to the existence of environmental hetero-
447 for three clustering methods. Only a small number of geneity, the community composition and the final observed
reads are required to calculate Hill values. For example, richness were relatively stable (Supplemental FigureS1, S2).
10 000 reads were adequate to characterize over 50% and These provided a solid foundation to obtain accurate richness
95% of estimated Shannon entropy and inverse Simpson estimations. Taking together, the results of both the non-
index within 1 m2 of topsoil. Furthermore, we plotted observed asymptotic extrapolation and non-parametric asymptotic
Hill numbers profile as a continuous function of the parameter approaches showed similar species richness (Fig. 3,
q (Supplemental Fig. S4). The steep declines of curves with a Table 2). Measurements from UPARSE 97% similarity cutoff,
higher q demonstrated an uneven distribution of species Deblur and DADA2 can provide benchmarks for further
relative abundances. Additionally, this diversity profile char- diversity range between 27 137±487 to 27 193±1076,
acterized the degree of dominance in the assemblage vividly. 56 527±1170 to 56 985±2347, and 15 809±613 to 15 919
Sequencing depth mainly contributed in low q, and the curves ±193, respectively.
of different sequencing depth, from 10 000 to all reads, Richness is a central concept in understanding microbial
gradually converged, especially with q≥1. communities. Over the past decade, numerous studies have
been performed to try to uncover this fundamental measure-
ment, especially for a gram of soil. Previous works have
4 Discussion identified richness estimations of approximately 10 000 from
the top 10 cm of soil from a boreal forest (Torsvik et al., 1990),
4.1 The diversity profile of prokaryotes in 1 m2 topsoil 1 million for soil (Gans et al., 2005) while this number has
(0–20 cm depth) of grassland been questioned (Bunge et al., 2006; Volkov et al., 2006),
2000 to 5000 for soil (Schloss and Handelsman, 2006), and
Soil microbial communities are among the most important, 26 140 to 53 533 from the top 10 cm of forest soil (Roesch et
diverse, and complex assemblages in the biosphere (Zhou al., 2007). Overall, estimates of the bacterial richness per
et al., 2011). The richness of soil microorganisms has been gram of soil have varied between thousands to millions,
studied for over a century. Although recent advances in greatly misleading ecological surveys of microorganisms. The
marker gene sequencing technology and bioinformatic reasons for this huge difference could be assigned to
analysis have provided drastic improvements, the majority of insufficient sequencing depth compared to the research
prokaryotic diversity still remains undiscovered (Delgado- scale, different estimation methods, and large biases hidden
Baquerizo et al., 2018; Knight et al., 2018). The current within some methods. Therefore, it is necessary to conduct
consensus is that richness based on sampling data through estimates by using multiple feasible estimation methods with
marker gene sequencing technology is highly dependent on deep sequencing at appropriate scales. Recently, Locey and
sample size (Colwell and Coddington, 1994; Chiu and Chao, Lennon formulated a microbial richness-abundance scaling
Table 3 Relationships of sequencing depth to Hill numbers and coverages.
Methods
UPARSE Deblur DADA2
4
Reads (10 ) Shannon entropy Inverse Simpson Shannon entropy Inverse Simpson Shannon entropy Inverse Simpson
(Hill, q = 1) (Hill, q = 2) (Hill, q = 1) (Hill, q = 2) (Hill, q = 1) index (Hill, q = 2)
1 801.87±94.61 210.66±61.07 899.30±127.42 177.72±53.89 1333.34±139.27 427.36±119.77
2 903.60±111.83 213.01±62.29 1059.81±161.88 179.40±54.76 1530.81±168.77 437.13±124.48
3 952.14±120.15 214.07±63.07 1145.91±181.21 179.97±55.06 1622.44±182.74 440.50±126.11
5 1001.97±128.69 214.38±63.01 1243.62±203.62 180.43±55.29 1713.32±196.55 443.23±127.44
10 1051.51±137.03 214.92±63.29 1354.54±229.22 180.77±55.47 1798.77±209.19 445.30±128.46
50 1109.98±146.25 215.32±63.50 1516.37±264.59 181.05±55.62 1887.91±221.64 446.97±129.28
100 1120.64±147.82 215.37±63.52 1551.69±271.28 181.08±55.63 1901.57±223.46 447.18±129.38
Total reads 1132.82±149.31 215.42±63.55 1586.53±275.84 181.11±55.65 1915.20±225.21 447.37±129.47
Estimated value 1134.63±149.76 215.42±63.55 1597.73±278.84 181.11±55.65 1915.20±225.21 447.37±129.4710 Assessment of microbial α-diversity in one meter squared topsoil
relationship which could be applied to estimate species number of sequencing reads required varies greatly. Addi-
richness based on the total abundance of prokaryotes, and tionally, Hill numbers, especially for Shannon entropy and
concluded there were 1011–1012 microbial species on earth inverse Simpson index, have been recommended to quantify
(Locey and Lennon, 2016). According to their unified scaling and compare microbial taxonomic diversity (Haegeman et al.,
law: S = 7.6 ´N0.35 and inputting our measured cell numbers in 2013; Alberdi and Gilbert, 2019). Our strong results proved the
1 m2 grassland topsoil (0-20 cm), it was predicted that robustness of Shannon entropy and inverse Simpson index
average richness would reach 973 510 in our quadrats with their good consistency under discriminatory sequencing
(Table S6). This number was roughly between 36, 17 and depths (Supplemental Fig. S4). As Hill numbers have
61-fold higher than the richness estimated using our data by excellent estimation properties, this method could greatly
UPARSE, Deblur and DADA2, respectively. As their dom- advance future research.
inance scaling law has not been verified on such a small
scale, the inconsistencies with our results indicate that there
4.3 The Effect of clustering strategies on diversity
may be potential deviations in its applications, especially at
measurement
local scales.
A key, albeit often overlooked, factor in determining diversity is
related to the algorithms used to cluster sequences into OTUs
4.2 The Effect of sequencing depth on diversity estimation
or ASVs. Producing accurate diversity information from
Certainly, the depth of sequencing showed a significant millions of reads is a primary requirement of all marker gene
impact on the observed richness, which further influenced studies. To achieve this goal, many clustering methods based
estimated richness (Table 1, Tables S3, S4, S5). It should be on different algorithms, have been implemented in recent
noted that there are some biases raised by various non- years (Nguyen et al., 2015). However, inconsistency among
parametric richness estimators, including Chao1, Chao2, algorithms is increased by the way they consider species with
ACE, ICE abundance-Jack1, and incidence-Jack1. It is no low abundances. UPARSE, a widely applied method, sug-
doubt that these indices have been widely applied in gests removing singletons (Edgar, 2013), while Deblur and
microbiome associated analyses to compensate for the DADA2 use error profiles to obtain putative error-free reads at
potential under-sampled data and estimate theoretical rich- single-nucleotide resolution and further generate ASVs
ness (Caporaso et al., 2011; Tu et al., 2016; Zhou et al., 2016; (Callahan et al., 2016; Amir et al., 2017). The recommended
Deng et al., 2018; Zhang et al., 2019b). However, while these parameters for Deblur suggest keeping only the sequences
estimators did show small differences, they also showed which appeared a minimum of 10 times within a study. In our
mutual corroboration in this study. Our results strongly study, even though we followed all of the default recommen-
suggested that insufficient sequencing depth would still dations, there were still large differences between the
underestimate the final richness even when using these algorithms, e.g., richness derived from Deblur was nearly
estimators. For example, by non-asymptotic extrapolation twice as much as UPARSE, and 3.3-fold more than DADA2.
approach, nearly 500 000 sequences only reach 50% of Regardless of the specific method chosen, it is difficult to
species. While by non-parametric asymptotic approach, robustly distinguish sequencing errors from true rare species.
estimated richness based on 500 000 sequences could only To guarantee the biological significance of the retained
achieve around 57% to 64%, 65% to 77% and 50% to 77% for sequences, some low-abundance sequences must be dis-
UPARSE, Deblur and DADA2, respectively. At present, the carded, which inevitably leads to the loss of richness. Indeed,
retained sequences in a large number of studies have not previous studies have pointed out that rare species cause a
exceeded 500 000 for one site, much less for one sample. In serious problem for estimating species richness (Mao and
this state, not only the observed richness, but also the Colwell, 2005; Haegeman et al., 2013). While there is no silver
estimated richness will be grossly underestimated by about a bullet, the choice will rely on the relative risk of pseudo
third of total richness. Considering how small the area (1 m2) richness versus taxon bias in addressing particular ecological
we focused on, future research needs to continue to increase questions. In our study, our focus is not to compare the
the sequencing depth for a more accurate richness estimation difference among these methods and explore the behind
in soil microbial surveys. mechanism, instead, we try to use various widely applied
Under-sampling is a major source of bias for the diversity methods to provide as much messages as possible, for
assessment, and these biases are typically more severe for reference in future research.
Hill numbers with low orders of q (Chao and Jost, 2015).
Higher order of q gives more weight to high abundance of
5 Conclusion
species, which would largely reduce the effect of the
undetected species. During our own analyses, in contrast to
richness, Hill numbers of higher order could reach saturation It is important to note that quantifying the astonishing diversity
with relatively fewer sequences (Table 3). Our results provided of soil microorganism is a great challenge. Based on our
explicit evidence to demonstrate that when the focus is on analyses from non-asymptotic extrapolation and non-para-
exploring different characteristics of the community, the metric asymptotic approaches at a small and controllableShuzhen Li et al. 11
scale by thorough sampling, we deduced that the number of structure and associations analyzed via marker genes. FEMS
prokaryotic species was on the order of 27 137±487 to 27 193 Microbiology Reviews 40, 686–700.
±1076, 56 527±1170 to 56 985±2347, and 15 809±613 to Bao, S., 2000. Soil and Agricultural Chemistry Analysis. China
15 919±193 by UPARSE 97% cutoff, Deblur and DADA2 in Agricultural Press, Beijing.
1 m2 of grassland topsoil, respectively. We acknowledged that Bressan, M., Gattin, I.T., Desaire, S., Castel, L., Gangneux, C., Laval,
our estimation was not exactly accurate due to the biases K., 2015. A rapid flow cytometry method to assess bacterial
inherent to the marker gene sequencing process (Gohl et al., abundance in agricultural soil. Applied Soil Ecology 88, 60–68.
2016), technical errors such as potential arbitrariness of Bunge, J., Epstein, S.S., Peterson, D.G., 2006. Comment on
treating low abundance sequences in OTU or ASV clustering “Computational improvements reveal great bacterial diversity and
(Balint et al., 2016), and internal limitations of non-parametric high metal toxicity in soil”. Science 313, 918c.
or parametric estimators (O'Hara, 2005; Bunge et al., 2014). Bunge, J., Willis, A., Walsh, F., 2014. Estimating the number of
However, by using these massive sequences, our results still species in microbial diversity studies. Annual Review of Statistics
provided a valuable benchmark for future research. Given our and Its Application 1, 427–445.
results, further improvement of sequencing depth is needed to Callahan, B.J., McMurdie, P.J., Rosen, M.J., Han, A.W., Johnson, A.J.
better capture undetected observed as well as estimated A., Holmes, S.P., 2016. DADA2: High-resolution sample inference
species richness. In addition, if a study focuses on the α- from Illumina amplicon data. Nature Methods 13, 581–583.
diversity as represented by higher order Hill numbers, the Caporaso, J.G., Lauber, C.L., Walters, W.A., Berg-Lyons, D., Huntley,
sequencing depth can be appropriately downregulated to J., Fierer, N., Owens, S.M., Betley, J., Fraser, L., Bauer, M.,
lower the cost. Also, a deeper and more thorough view of Gormley, N., Gilbert, J.A., Smith, G., Knight, R., 2012. Ultra-high-
species diversity at this small scale will contribute greatly to throughput microbial community analysis on the Illumina HiSeq
the extrapolation at larger scales in the future studies. and MiSeq platforms. ISME Journal 6, 1621–1624.
Caporaso, J.G., Lauber, C.L., Walters, W.A., Berg-Lyons, D.,
Conflict of interest Lozupone, C.A., Turnbaugh, P.J., Fierer, N., Knight, R., 2011.
Global patterns of 16S rRNA diversity at a depth of millions of
The authors declare that they have no conflict of interest. sequences per sample. Proceedings of the National Academy of
Sciences of the United States of America 108, 4516–4522.
Acknowledgments Chao, A., 1987. Estimating the population-size for capture recapture
data with unequal catchability. Biometrics 43, 783–791.
This study was supported by the National Natural Science Chao, A., Chazdon, R.L., Colwell, R.K., Shen, T.J., 2005. A new
Foundation of China (NSFC Grant No. U1906223), the National statistical approach for assessing similarity of species composition
Key Research and Development Program (Grant No. with incidence and abundance data. Ecology Letters 8, 148–159.
2019YFC1905001). The authors are very grateful to Dr. James Chao, A., Chiu, C.H., 2016. Nonparametric Estimation and Compar-
Walter Voordeckers for careful edition on the final version. We ison of Species Richness 1–11.
thank the convenience provided by Restoration Ecology Experi- Chao, A., Gotelli, N.J., Hsieh, T.C., Sander, E.L., Ma, K.H., Colwell, R.
mental Demonstration Research Station of Institute of Botany, K., Ellison, A.M., 2014a. Rarefaction and extrapolation with Hill
CAS. numbers: a framework for sampling and estimation in species
diversity studies. Ecological Monographs 84, 45–67.
Electronic supplementary material Chao, A., Jost, L., 2012. Coverage-based rarefaction and extrapola-
tion: standardizing samples by completeness rather than size.
Supplementary material is available in the online version of this Ecology 93, 2533–2547.
article at https://doi.org/10.1007/s42832-021-0111-5 and is Chao, A., Jost, L., 2015. Estimating diversity and entropy profiles via
accessible for authorized users. discovery rates of new species. Methods in Ecology and Evolution
6, 873–882.
Chao, A.N., Chiu, C.H., Jost, L., 2014b. Unifying species diversity,
Reference phylogenetic diversity, functional diversity, and related similarity
and differentiation measures through Hill numbers. Annual Review
Alberdi, A., Gilbert, M.T.P., 2019. A guide to the application of Hill of Ecology, Evolution, and Systematics 45, 297–324.
numbers to DNA-based diversity analyses. Molecular Ecology Chazdon, R.L., Colwell, R.K., Denslow, J.S., Guariguata, M.R., 1998.
Resources 19, 804–817. Statistical methods for estimating species richness of woody
Amir, A., McDonald, D., Navas-Molina, J.A., Kopylova, E., Morton, J. regeneration in primary and secondary rain forests of northeastern
T., Xu, Z.Z., Kightley, E.P., Thompson, L.R., Hyde, E.R., Gonzalez, Costa Rica. Forest Biodiversity Research. Monitoring and Model-
A., Knight, R., 2017. Deblur rapidly resolves single-nucleotide ing 20, 285–309.
community sequence patterns. mSystems 2, e00191–e16. Chiu, C.H., Chao, A., 2016. Estimating and comparing microbial
Balint, M., Bahram, M., Eren, A.M., Faust, K., Fuhrman, J.A., Lindahl, diversity in the presence of sequencing errors. PeerJ 4, e1634.
B., O’Hara, R.B., Opik, M., Sogin, M.L., Unterseher, M., Tedersoo, Colwell, R.K., Chao, A., Gotelli, N.J., Lin, S.Y., Mao, C.X., Chazdon, R.
L., 2016. Millions of reads, thousands of taxa: microbial community L., Longino, J.T., 2012. Models and estimators linking individual-12 Assessment of microbial α-diversity in one meter squared topsoil
based and sample-based rarefaction, extrapolation and compar- Debelius, J., Gonzalez, A., Kosciolek, T., McCall, L.I., McDonald,
ison of assemblages. Journal of Plant Ecology 5, 3–21. D., Melnik, A.V., Morton, J.T., Navas, J., Quinn, R.A., Sanders, J.
Colwell, R.K., Coddington, J.A., 1994. Estimating terrestrial biodiver- G., Swafford, A.D., Thompson, L.R., Tripathi, A., Xu, Z.J.Z.,
sity through extrapolation. Philosophical Transactions of the Royal Zaneveld, J.R., Zhu, Q.Y., Caporaso, J.G., Dorrestein, P.C., 2018.
Society of London. Series B, Biological Sciences 345, 101–118. Best practices for analysing microbiomes. Nature Reviews.
Delgado-Baquerizo, M., Oliverio, A.M., Brewer, T.E., Benavent- Microbiology 16, 410–422.
Gonzalez, A., Eldridge, D.J., Bardgett, R.D., Maestre, F.T., Kong, Y., 2011. Btrim: A fast, lightweight adapter and quality trimming
Singh, B.K., Fierer, N., 2018. A global atlas of the dominant program for next-generation sequencing technologies. Genomics
bacteria found in soil. Science 359, 320–325. 98, 152–153.
Deng, Y., Ning, D.L., Qin, Y.J., Xue, K., Wu, L.Y., He, Z.L., Yin, H.Q., Lee, S.M., Chao, A., 1994. Estimating population-size via sample
Liang, Y.T., Buzzard, V., Michaletz, S.T., Zhou, J.Z., 2018. Spatial coverage for closed capture-recapture models. Biometrics 50, 88–
scaling of forest soil microbial communities across a temperature 97.
gradient. Environmental Microbiology 20, 3504–3513. Li, S., Deng, Y., Du, X., Feng, K., Wu, Y., He, Q., Wang, Z., Liu, Y.,
Edgar, R.C., 2013. UPARSE: highly accurate OTU sequences from Wang, D., Peng, X., Zhang, Z., Escalas, A., Qu, Y., 2021. Sampling
microbial amplicon reads. Nature Methods 10, 996–998. cores and sequencing depths affected the measurement of
Ellison, A.M., 2010. Partitioning diversity. Ecology 91, 1962–1963. microbial diversity in soil quadrats. Science of the Total Environ-
Feng, K., Zhang, Z.J., Cai, W.W., Liu, W.Z., Xu, M.Y., Yin, H.Q., Wang, ment 767, 144966.
A.J., He, Z.L., Deng, Y., 2017. Biodiversity and species competition Locey, K.J., Lennon, J.T., 2016. Scaling laws predict global microbial
regulate the resilience of microbial biofilm community. Molecular diversity. Proceedings of the National Academy of Sciences of the
Ecology 26, 6170–6182. United States of America 113, 5970–5975.
Gans, J., Wolinsky, M., Dunbar, J., 2005. Computational improve- Magoc, T., Salzberg, S.L., 2011. FLASH: fast length adjustment of
ments reveal great bacterial diversity and high metal toxicity in soil. short reads to improve genome assemblies. Bioinformatics
Science 309, 1387–1390. (Oxford, England) 27, 2957–2963.
Ginestet, C., 2011. ggplot2: Elegant Graphics for Data Analysis. Mao, C.X., Colwell, R.K., 2005. Estimation of species richness:
Journal of the Royal Statistical Society Series a-Statistics in Mixture models, the role of rare species, and inferential challenges.
Society 174, 245–245. Ecology 86, 1143–1153.
Gohl, D.M., Vangay, P., Garbe, J., MacLean, A., Hauge, A., Becker, A., Nguyen, N.H., Smith, D., Peay, K., Kennedy, P., 2015. Parsing
Gould, T.J., Clayton, J.B., Johnson, T.J., Hunter, R., Knights, D., ecological signal from noise in next generation amplicon sequen-
Beckman, K.B., 2016. Systematic improvement of amplicon cing. New Phytologist 205, 1389–1393.
marker gene methods for increased accuracy in microbiome O’Hara, R.B., 2005. Species richness estimators: how many species
studies. Nature Biotechnology 34, 942–949. can dance on the head of a pin? Journal of Animal Ecology 74,
Gotelli, N.J., Colwell, R.K., 2001. Quantifying biodiversity: procedures 375–386.
and pitfalls in the measurement and comparison of species Rajakaruna, H., Drake, D.A.R., Chan, F.T., Bailey, S.A., 2016.
richness. Ecology Letters 4, 379–391. Optimizing performance of nonparametric species richness
Haegeman, B., Hamelin, J., Moriarty, J., Neal, P., Dushoff, J., Weitz, J. estimators under constrained sampling. Ecology and Evolution 6,
S., 2013. Robust estimation of microbial diversity in theory and in 7311–7322.
practice. ISME Journal 7, 1092–1101. Roesch, L.F., Fulthorpe, R.R., Riva, A., Casella, G., Hadwin, A.K.M.,
Heltshe, J.F., Forrester, N.E., 1983. Estimating species richness using Kent, A.D., Daroub, S.H., Camargo, F.A.O., Farmerie, W.G.,
the Jackknife procedure. Biometrics 39, 1–11. Triplett, E.W., 2007. Pyrosequencing enumerates and contrasts
Hill, M.O., 1973. Diversity and evenness: A unifying notation and its soil microbial diversity. ISME Journal 1, 283–290.
consequences. Ecology 54, 427–432. Ru, J.Y., Zhou, Y.Q., Hui, D.F., Zheng, M.M., Wan, S.Q., 2018. Shifts of
Hsieh, T.C., Ma, K.H., Chao, A., 2016. iNEXT: an R package for growing-season precipitation peaks decrease soil respiration in a
rarefaction and extrapolation of species diversity (Hill numbers). semiarid grassland. Global Change Biology 24, 1001–1011.
Methods in Ecology and Evolution 7, 1451–1456. Schloss, P.D., Handelsman, J., 2006. Toward a census of bacteria in
Hu, Y.J., Veresoglou, S.D., Tedersoo, L., Xu, T.L., Ge, T.D., Liu, L., soil. PLoS Computational Biology 2, 786–793.
Chen, Y.L., Hao, Z.P., Su, Y.R., Rillig, M.C., Chen, B.D., 2019. Shannon, C.E., 1948. A mathematical theory of communication. Bell
Contrasting latitudinal diversity and co-occurrence patterns of soil System Technical Journal 27, 379–423.
fungi and plants in forest ecosystems. Soil Biology & Biochemistry Simpson, E.H., 1949. Measurement of diversity. Nature 163, 688–688.
131, 100–110. Tedersoo, L., Bahram, M., Polme, S., Koljalg, U., Yorou, N.S.,
Hugerth, L.W., Andersson, A.F., 2017. Analysing microbial community Wijesundera, R., Ruiz, L.V., Vasco-Palacios, A.M., Thu, P.Q.,
composition through amplicon sequencing: From sampling to Suija, A., Smith, M.E., Sharp, C., Saluveer, E., Saitta, A., Rosas,
hypothesis testing. Frontiers in Microbiology 8, 1561. M., Riit, T., Ratkowsky, D., Pritsch, K., Poldmaa, K., Piepenbring,
Kang, S., Rodrigues, J.L.M., Ng, J.P., Gentry, T.J., 2016. Hill number M., Phosri, C., Peterson, M., Parts, K., Partel, K., Otsing, E.,
as a bacterial diversity measure framework with high-throughput Nouhra, E., Njouonkou, A.L., Nilsson, R.H., Morgado, L.N., Mayor,
sequence data. Scientific Reports 6, 38263. J., May, T.W., Majuakim, L., Lodge, D.J., Lee, S.S., Larsson, K.H.,
Knight, R., Vrbanac, A., Taylor, B.C., Aksenov, A., Callewaert, C., Kohout, P., Hosaka, K., Hiiesalu, I., Henkel, T.W., Harend, H., Guo,Shuzhen Li et al. 13 L.D., Greslebin, A., Grelet, G., Geml, J., Gates, G., Dunstan, W., Young, M., Yue, H.W., Zhang, Q., Zhang, W., Zhang, Y., Zhou, H. Dunk, C., Drenkhan, R., Dearnaley, J., De Kesel, A., Dang, T., D., Brown, M., Consortium, G.W.M., 2019. Global diversity and Chen, X., Buegger, F., Brearley, F.Q., Bonito, G., Anslan, S., Abell, biogeography of bacterial communities in wastewater treatment S., Abarenkov, K., 2014. Global diversity and geography of soil plants. Nature Microbiology 4, 1183–1195. fungi. Science 346, 1078. Zhang, X.M., Johnston, E.R., Li, L.H., Konstantinidis, K.T., Han, X.G., Torsvik, V., Goksoyr, J., Daae, F.L., 1990. High diversity in DNA of soil 2017a. Experimental warming reveals positive feedbacks to bacteria. Applied and Environmental Microbiology 56, 782–787. climate change in the Eurasian Steppe. ISME Journal 11, 885– Tu, Q.C., Deng, Y., Yan, Q.Y., Shen, L.N., Lin, L., He, Z.L., Wu, L.Y., 895. Van Nostrand, J.D., Buzzard, V., Michaletz, S.T., Enquist, B.J., Zhang, X.X., Zhang, R.J., Gao, J.S., Wang, X.C., Fan, F.L., Ma, X.T., Weiser, M.D., Kaspari, M., Waide, R.B., Brown, J.H., Zhou, J.Z., Yin, H.Q., Zhang, C.W., Feng, K., Deng, Y., 2017b. Thirty-one 2016. Biogeographic patterns of soil diazotrophic communities years of rice-rice-green manure rotations shape the rhizosphere across six forests in the North America. Molecular Ecology 25, microbial community and enrich beneficial bacteria. Soil Biology & 2937–2948. Biochemistry 104, 208–217. Vavrek, M.J., 2011. fossil: Palaeoecological and palaeogeographical Zhang, Z., Qu, Y., Li, S., Feng, K., Wang, S., Cai, W., Liang, Y., Li, H., analysis tools. Palaeontologia Electronica 14:1T Xu, M., Yin, H., Deng, Y., 2017c. Soil bacterial quantification Volkov, I., Banavar, J.R., Maritan, A., 2006. Comment on “Computa- approaches coupling with relative abundances reflecting the tional improvements reveal great bacterial diversity and high metal changes of taxa. Scientific Reports 7, 4837. toxicity in soil”. Science 313, 918. Zhang, Z., Zhao, W.M., Xiao, J.F., Bao, Y.M., Wang, F., Hao, L.L., Zhu, Wang, Q., Garrity, G.M., Tiedje, J.M., Cole, J.R., 2007. Naive J.W., Chen, T.T., Zhang, S.S., Chen, X., Tang, B.X., Zhou, Q., Bayesian classifier for rapid assignment of rRNA sequences into Wang, Z.H., Dong, L.L., Wang, Y.Q., Ma, Y.K., Zhang, Z.W., Wang, the new bacterial taxonomy. Applied and Environmental Micro- Z., Chen, M.L., Tian, D.M., Li, C.P., Teng, X.F., Du, Z.L., Yuan, N., biology 73, 5261–5267. Zeng, J.Y., Wang, J.Y., Shi, S., Zhang, Y.D., Wang, Q., Pan, M.Y., Wang, Y.Q., Song, F.H., Zhu, J.W., Zhang, S.S., Yang, Y.D., Chen, T. Qian, Q.H., Song, S.H., Niu, G.Y., Li, M., Xia, L., Zou, D., Zhang, Y. T., Tang, B.X., Dong, L.L., Ding, N., Zhang, Q., Bai, Z.X., Dong, X. S., Sang, J., Li, M.W., Zhang, Y., Wang, P., Gao, Q.W., Liang, F., Li, N., Chen, H.X., Sun, M.Y., Zhai, S., Sun, Y.B., Yu, L., Lan, L., Xiao, R.J., Liu, L., Cao, J., Abbasi, A.A., Shireen, H., Li, Z., Xiong, Z., J.F., Fang, X.D., Lei, H.X., Zhang, Z., Zhao, W.M., 2017. GSA: Jiang, M.Y., Guo, T.K., Li, Z.H., Zhang, H., Ma, L., Gao, R., Zhang, Genome Sequence Archive. Genomics, Proteomics & Bioinfor- T., Li, W.L., Zhang, X.Q., Lan, L., Zhai, S., Zhang, Y.P., Wang, G.D., matics 15, 14–18. Wang, Z.N., Xue, Y.B., Sun, Y.B., Yu, L., Sun, M.Y., Chen, H.X., Hu, Wu, L.W., Ning, D.L., Zhang, B., Li, Y., Zhang, P., Shan, X.Y., Zhang, H., Guo, A.Y., Lin, S.F., Xue, Y., Wang, C.W., Ning, W.S., Zhang, Y., Q.T., Brown, M., Li, Z.X., Van Nostrand, J.D., Ling, F.Q., Xiao, N.J., Luo, H., Gao, F., Guo, Y.P., Zhang, Q., Zhou, J.Q., Huang, Z., Cui, Zhang, Y., Vierheilig, J., Wells, G.F., Yang, Y.F., Deng, Y., Tu, Q.C., Q.H., Miao, Y.R., Ruan, C., Yuan, C.H., Chen, M., Jinpu, J., Gao, Wang, A.J., Zhang, T., He, Z.L., Keller, J., Nielsen, P.H., Alvarez, P. G., Xu, H.D., Li, Y.M., Li, C.Y., Tang, Q., Peng, D., Deng, W.K., J.J., Criddle, C.S., Wagner, M., Tiedje, J.M., He, Q., Curtis, T.P., Members, B.D.C., 2019a. Database resources of the BIG Data Stahl, D.A., Alvarez-Cohen, L., Rittmann, B.E., Wen, X.H., Zhou, J. Center in 2019. Nucleic Acids Research 47, D8–D14. Z., Acevedo, D., Agullo-Barcelo, M., Andersen, G.L., de Araujo, J. Zhang, Z.J., Deng, Y., Feng, K., Cai, W.W., Li, S.Z., Yin, H.Q., Xu, M. C., Boehnke, K., Bond, P., Bott, C.B., Bovio, P., Brewster, R.K., Y., Ning, D.L., Qu, Y.Y., 2019b. Deterministic assembly and Bux, F., Cabezas, A., Cabrol, L., Chen, S., Etchebehere, C., Ford, diversity gradient altered the biofilm community performances of A., Frigon, D., Gomez, J.S., Griffin, J.S., Gu, A.Z., Habagil, M., bioreactors. Environmental Science & Technology 53, 1315–1324. Hale, L., Hardeman, S.D., Harmon, M., Horn, H., Hu, Z.Q., Jauffur, Zhou, J.Z., Deng, Y., Shen, L.N., Wen, C.Q., Yan, Q.Y., Ning, D.L., S., Johnson, D.R., Keucken, A., Kumari, S., Leal, C.D., Lebrun, L. Qin, Y.J., Xue, K., Wu, L.Y., He, Z.L., Voordeckers, J.W., Van A., Lee, J., Lee, M., Lee, Z.M.P., Li, M.Y., Li, X., Liu, Y., Luthy, R.G., Nostrand, J.D., Buzzard, V., Michaletz, S.T., Enquist, B.J., Weiser, Mendonca-Hagler, L.C., de Menezes, F.G.R., Meyers, A.J., M.D., Kaspari, M., Waide, R., Yang, Y.F., Brown, J.H., 2016. Mohebbi, A., Oehmen, A., Palmer, A., Parameswaran, P., Park, Temperature mediates continental-scale diversity of microbes in J., Patsch, D., Reginatto, V., de los Reyes, F.L., Robles, A.N., forest soils. Nature Communications 7, 12083. Rossetti, S., Sidhu, J., Sloan, W.T., Smith, K., de Sousa, O.V., Zhou, J.Z., Wu, L.Y., Deng, Y., Zhi, X.Y., Jiang, Y.H., Tu, Q.C., Xie, J.P., Stephens, K., Tian, R.M., Tooker, N.B., Vasconcelos, D.D., Van Nostrand, J.D., He, Z.L., Yang, Y.F., 2011. Reproducibility and Wakelin, S., Wang, B., Weaver, J.E., West, S., Wilmes, P., Woo, quantitation of amplicon sequencing-based detection. ISME S.G., Wu, J.H., Wu, L.Y., Xi, C.W., Xu, M.Y., Yan, T., Yang, M., Journal 5, 1303–1313.
You can also read