Marine Science ICES Journal of
←
→
Page content transcription
If your browser does not render page correctly, please read the page content below
ICES Journal of
Marine Science
ICES Journal of Marine Science (2016), 73(7), 1901– 1911. doi:10.1093/icesjms/fsw053

Contribution to the Themed Section: ‘Seascape Ecology’
Original Article

                                                                                                                                                      Downloaded from https://academic.oup.com/icesjms/article/73/7/1901/2458758 by guest on 12 December 2020
Community – environment interactions explain octopus-catshark
spatial overlap
Patricia Puerta 1 *, Mary E. Hunsicker 2, Manuel Hidalgo 1, Patricia Reglero1, Lorenzo Ciannelli 3,
Antonio Esteban 4, Marı́a González 5, and Antoni Quetglas1
1
 Instituto Español de Oceanografı́a, Centre Oceanográfico de les Baleares, Muelle de Poniente s/n, Apdo. 291, 07015 Palma de Mallorca, Spain
2
 NOAA, Northwest Fisheries Science Center, 2115 SE OSU Drive, Newport, OR 97366, USA
3
 College of Earth, Ocean, and Atmospheric Sciences, Oregon State University, 104 CEOAS Administration Building, Corvallis, OR 97331, USA
4
 Instituto Español de Oceanografı́a, Centro Oceanográfico de Murcia, Magallanes 2, Apdo. 22, 30740 San Pedro del Pinatar (Murcia), Spain
5
 Instituto Español de Oceanografı́a, Centro Oceanográfico de Málaga, Puerto Pesquero s/n, Apdo. 285, 29640 Fuengirola (Málaga), Spain
*Corresponding author: tel: +34 971 133 720; fax: +34 971 404 945; e-mail: patrix.puerta@gmail.com
Puerta, P., Hunsicker, M. E., Hidalgo, M., Reglero, P., Ciannelli, L., Esteban, A., González, M., and Quetglas, A. Community–
environment interactions explain octopus-catshark spatial overlap. – ICES Journal of Marine Science, 73: 1 901–1911.

Received 1 July 2015; revised 10 March 2016; accepted 12 March 2016.

The octopus Eledone cirrhosa and the catshark Scyliorhinus canicula present the same feeding habits and distributional preferences in the
Mediterranean Sea. We explore patterns of spatial overlap between these species to address coexistence and infer possible competition from
spatial patterns in the western Mediterranean Sea. A spatially explicit modelling approach revealed that spatial overlap mainly responded to
the distribution of shared resources, where coexistence is allowed by different ecological processes. Catshark (k-strategy) was highly abundant
and widely distributed. However, the fluctuating population dynamics of octopus (r-strategy) explained the variations in spatial patterns of
overlap. Spatial structuring across the study area was observed both in population distributions and in species interactions (coexistence or exclu-
sion). Areas with high resources in terms of specific prey items (Catalan Sea) or alternative supplies, such as niche opportunities and ecosystem
functions defined by community diversity (Balearic Islands), favoured species coexistence. Sea surface temperature showed opposite effects on
overlap in northern and southern regions of the study area, which were not related to differences in species sensitivity. We suggest a surface
trophic link, where different phytoplankton communities at each region might have opposite responses to temperature. This triggers contrasting
mechanisms of food transfer to deeper benthic communities that subsequently facilitates species overlap. Characterizing how benthic and pelagic
seascape properties shape species interactions across space and time is pivotal to properly address community spatial dynamics and move towards
ecosystem-based management for sustainable fisheries and conservation planning.
Keywords: benthic-pelagic coupling, coexistence, competition, Eledone cirrhosa, Mediterranean, Scyliorhinus canicula, spatial distribution, species
interactions.

Introduction                                                               environmental conditions. Other factors such as resource availabil-
Species and populations are typically non-randomly allocated in the        ity, community complexity, or interactions among species are more
nature. How they are distributed is a cornerstone in our knowledge         usually than not ignored, despite their importance in dictating
of marine ecosystems, not only for addressing ecological and bio-          spatial patterns of species across different seascapes (Ciannelli
geographic questions but also for management and conservation,             et al., 2008; Kordas et al., 2011; Johnson et al., 2013). Multispecies
forecasting and assessment of global change impacts (Dambach               and ecosystem models are an exception because they take into
and Rödder, 2011; Albouy et al., 2014). Often, species distribution       account and quantify interspecific and trophic relationships.
research has focused on the relationships between abundance and            However, spatial patterns of foodwebs and ecosystem functioning

# InternationalCouncil for the Exploration of the Sea 2016. All rights reserved.
For Permissions, please email: journals.permissions@oup.com
1902                                                                                                                                P. Puerta et al.

are usually excluded due to difficulties in the parameterization and         local and regional scales in the western Mediterranean. We hypothe-
the lack of spatial information on all ecosystems compartments               size that seascapes with high resources in terms of productivity and
(Kempf et al., 2013 and references therein).                                 diversity will favour the spatial overlap by lessening competitive
    The aforementioned limitations of species distribution model-            interactions.
ling are manifest in cephalopod research. Recent studies addressed
the keystone role of cephalopods in foodwebs (Coll et al., 2008,             Methods
2013; André et al., 2010; Gasalla et al., 2010), but usually trophic
                                                                             Biological data
interactions are described based on stomach contents and prey–
predator relationships without spatial context (e.g. Staudinger              Data on species abundance were collected from the Spanish trawl
et al., 2013; Rodhouse et al., 2014 and references therein). There is        surveys carried out as part of the Mediterranean International
particularly a dearth of information on competition between cepha-           Trawl Survey (MEDITS) project, which has been conducted since
lopods and other taxonomic groups (but see for instance Butler and           1994. The geographical range of the surveys covers the entire
                                                                             Spanish western Mediterranean Sea, including the Balearic Islands

                                                                                                                                                       Downloaded from https://academic.oup.com/icesjms/article/73/7/1901/2458758 by guest on 12 December 2020
Lear, 2009; Link and Auster, 2013). Trophic interactions are crucial in
shaping the population dynamics and distributions of cephalopods             (Figure 1). The MEDITS surveys are performed annually between
(Rodhouse et al., 2014; Stewart et al., 2014; Puerta et al., 2015).          May and July during day-time. An experimental trawl gear (GOC
However, the high dependence of cephalopods on environmental                 73) is used to ensure high catchability of demersal species (Bertrand
fluctuations (Pierce et al., 2008; Rodhouse et al., 2014) may mask           et al., 2002). Sampling followed an international standardized pro-
the effect of species interactions in distributional patterns.               tocol (Bertrand et al., 2002), with predefined stations based on bathy-
    In this study, we explore the patterns in spatial overlap between        metric strata (10–50, 50–100, 100–200, 200–500, and 500–800 m)
an octopus, Eledone cirrhosa, and one of its putative competitors, the       that were approximately replicated each year. For the present study,
catshark Scyliorhinus canicula, in the western Mediterranean Sea.            we included surveys performed from 2001 to 2012 and stations
Both species are common in the Mediterranean and especially abun-            sampled for at least 5 of the 12 available years. Sampling information
dant in the western basin (Belcari et al., 2002; Ellis et al., 2009). They   (date, time, position, depth, duration, distance trawled, vertical, and
are found mainly on the lower continental shelf and the upper slope          wing opening of the net) and species weight and number were
between 50 and 400 m depth and across all types of substrates (Boyle         recorded.
and Rodhouse, 2005; Gouraguine et al., 2011; Pennino et al., 2013;               Using the information of each sampling station, the abundances of
Puerta et al., 2015). Additionally, the two species exhibit size segre-      E. cirrhosa and S. canicula were transformed to standardized densities
gation in depth distributions, with juveniles inhabiting shallower           (individuals km22). Similarly, total prey densities were calculated; a
waters, between 100 and 200 m depth (Belcari et al., 2002;                   broad group of benthic crustaceans were selected as potential prey
Gouraguine et al., 2011; Puerta et al., 2014a). The octopus and the          items based on previous research (Valls et al., 2011; Puerta et al.,
catshark are bottom dwelling and most active at night (Cobb                  2015). Community indicators such as total species biomass
et al., 1995; Sims et al., 2001). They are opportunistic feeders with        (g km22) and the Shannon–Wiener diversity index (H′ ) were also
similar diets (Boyle et al., 1986; Valls et al., 2011; Martinho et al.,      calculated per station. Only macrofaunal species (fish, crustaceans,
2012; Puerta et al., 2015), mainly predating on decapod crustaceans,         and cephalopods) were included in the calculations of these two indi-
usually crabs.                                                               cators, since other taxonomic groups were neither identified nor
    Similarities in the distribution and feeding habits between              recorded consistently over time and space. These taxonomical
octopus and catshark can suggest a potential competition for                 groups account for 88% of the survey catches. These community
resources. However, while inferring imprints of competition from             indicators can be also interpreted as a proxy of the fishing effort
spatial patterns is challenging, studies indicate that competition           across the study area, since the main consequences of fishing
effects can be discernible from local to regional (few hundred km)           impact is the degradation of the community by diminishing species
geographical ranges (Gotelli et al., 2010; Araújo and Rozenfeld,            diversity and biomass (Worm and Lotze, 2009; Coll et al., 2012).
2014). Additionally, habitat and/or feeding overlap do not necessar-         Finally, the densities of octopus and catshark were summed across
ily imply competition, except for instance when resources are in             the entire sampling area in each year to estimate plausible population
short supply (Hofer et al., 2004; Link and Auster, 2013). Overlap            sizes and investigate density-dependent effects on species overlap.
and competition among species also vary with the environmental
and community context (Hofer et al., 2004; Orrock and Watling,               Environmental data
2010; Boström-Einarsson et al., 2014; Cormon et al., 2014) due to           Sea surface temperature (SST, 8C) and chlorophyll a concentration
the spatial variation of population density, resource availability,          (Chla, mg m23) were obtained from satellite remote sensing data for
fishing impact, or species sensitivity to changing habitat conditions.       each sampling station and year. Using 8-day composites files of 4 km
    In this paper, the patterns in spatial overlap between octopus and       resolution, we extracted Chla and SST values in a 9-km radius
catshark are assessed in relation to environmental, trophic, and             around each sampled station and calculated monthly averages
community indicators, along with density-dependent effects. Here             back from the date of sampling. This spatio-temporal resolution
we combine three issues of species interactions and spatial distribu-        allows characterizing the local oceanography of the study area and
tions, which have been poorly investigated in empirical systems. We          minimizes cloud impact on the measurements. Environmental
examine the interaction (i) between two species of different taxo-           data were obtained from different sensors to cover the temporal
nomic groups, (ii) at the population level (Link and Auster, 2013            range of collected biological data. SST dataset were supplied by
and references therein), and (iii) including biotic factors that can         AVHRR (2001–2002) and MODIS (2003–2012) sensors (NASA’s
dictate their interactions (e.g. species diversity; Johnson et al.,          Goddard Space Flight Center), while Chla dataset were obtained
2013) at broad spatio-temporal scales. For this purpose and attempt-         from Sea WiFS (2001– 2002) and MODIS (2003 –2012) sensors
ing to infer possible interspecific competition from spatial patterns, a     (NOAA CoastWatch Program). Differences in measurement
spatially explicit model is used to assess species coexistence at both       between sensors are negligible (Walton et al., 1998; Kilpatrick et al.,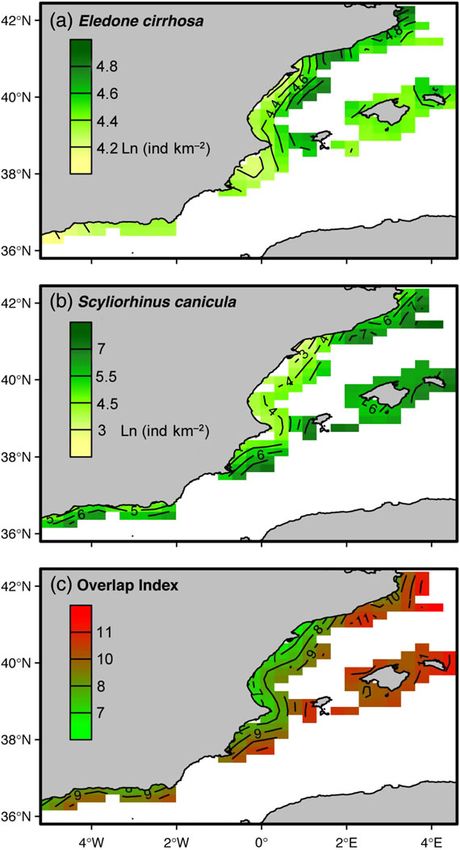
Community– environment interactions explain octopus-catshark spatial overlap                                                             1903

Figure 1. Sampling stations in the western Mediterranean Sea. Isobaths from 200 to 1000 m are shown.                                            Downloaded from https://academic.oup.com/icesjms/article/73/7/1901/2458758 by guest on 12 December 2020

2001). Due to the strong seasonality of the western Mediterranean Sea      each sampling station (defined by latitude, f and longitude, l)
and the rapid increase in SST during spring and summer (Santoleri          and year (y), as following:
et al., 1994), we applied generalized additive models (GAMs) to
remove temporal trends in SST values associated with the differences
in the dates of surveys. Residuals of SSTwere retained to be included as                 O(f,l),y = log(xsp1,(f,l),y · xsp2,(f,l),y ).
an explanatory variable in the model approach.

                                                                           Only stations where at least one of the species was present were
Data analysis                                                              included in the calculation of overlap. Before this calculation,
Overlap index                                                              species densities were standardized to make the overlap index de-
Spatial overlap between octopus and catshark was calculated as the         pendent only on spatial variability, rather than interannual vari-
natural logarithm of multiplied densities (x) of the two species at        ability of population abundances. Standardization was performed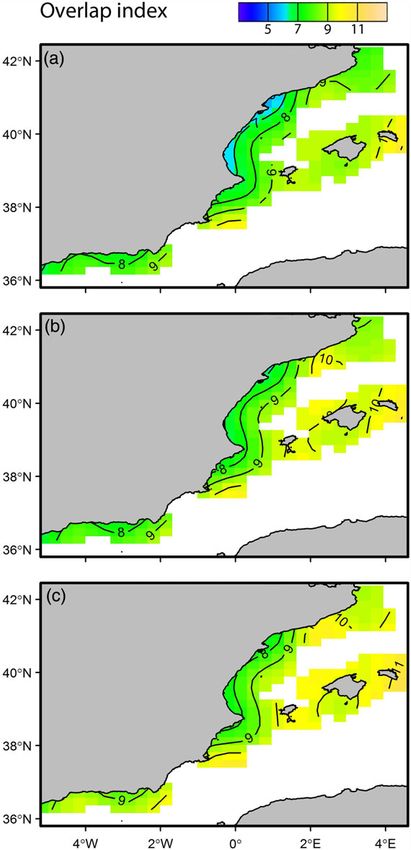
1904                                                                                                                                P. Puerta et al.

as follows:                                                                 overfitting, the knots for univariate and two-dimensional smoothers
                                                                            were restricted to 4 and 20, respectively.
                       x(f,l),y − xy                                           Starting from the full model above, a backward stepwise approach
                                      + min(xy ),
                             s2y                                            was performed by removing one term at a time. Full and reduced
                                                                            models were compared using Akaike information criterion (AIC) as
where the density of each species at a station and year x( f,l),y is        a measure of goodness of fit and genuine cross validation (gCV) as
demeaned and divided by standard deviation of density in the cor-           a measure of the complete out-of-sample predicted mean squared
responding year. The minimum density value in the year y was                error. The latter criterion determines which model was optimal for
then added to ensure (i) the overlap index were .0 (even if only            predictions. The best model was selected by minimizing both AIC
one of the species were found) and (ii) the normal distribution             and gCV criterions. Standard model diagnostics and residuals check-
of data.                                                                    ing were performed for homogeneity of variance, the absence of tem-
    In contrast to previous studies, the contribution of neighbour          poral autocorrelation and violation of normality assumptions.

                                                                                                                                                       Downloaded from https://academic.oup.com/icesjms/article/73/7/1901/2458758 by guest on 12 December 2020
stations to density value at a given station were not taken into            Observations and model residuals were also checked for the lack of
account (Ciannelli and Bailey, 2005; Hunsicker et al., 2010),               spatial correlation applying directional variograms and spatial plots
because the distances that the two species move from their dwelling         to evaluate the best model. Additionally, the coefficients of regression
areas (,20 km; Cobb et al., 1995; Rodrı́guez-Cabello et al., 2004,          (slopes) between the overlap index and each of the spatially explicit
2007; Boyle and Rodhouse, 2005) are shorter than the average dis-           covariates were extracted from the best model. These coefficients (sig-
tance between sampling stations.                                            nificant slopes based on 95% confidence interval) display the strength
                                                                            of the effect of a given covariate in the overlap at each geographical
                                                                            position. All calculations and models were coded in R software
Model formulation                                                           (version 3.1.2.), using the vegan and mgcv libraries.
GAMs were used to explore the influence of density-dependent
effects (population size), trophic resources (prey densities), com-
munity indicators (total biomass and diversity), and environment
                                                                            Results
(SST, Chla) on species overlap. In heterogeneous systems, local con-        Spatial patterns in biotic and environmental factors
ditions experienced by individuals across the geographic gradient           Spatial variability of the biotic and environmental factors in the
can be very different from the mean averaged conditions in the              study area is shown in Figure 2. Prey densities are patchily distribu-
entire region (Bacheler et al., 2009; Bartolino et al., 2011; Ciannelli     ted, with higher abundances in the northern area of the mainland
et al., 2012; Puerta et al., 2015). Therefore, we applied a spatially ex-   (Catalan Sea) and the Balearic Islands. These areas also presented
plicit GAM where linear relationships between overlap index and the         higher community diversity values, especially in the islands. Total
covariates are assumed, but these relationships are allowed to change       community biomass was larger in the southern area (Alboran Sea)
smoothly in relation to the geographical position.                          and the islands. Chla concentrations remained very low across the
    In the model formulation,                                               entire region, except in the Alboran Sea close to the Strait of
                                                                            Gibraltar. Finally, a north-south gradient of increasing temperatures
  O(f,l),y = s1 (f, l) + s2 (depth(f,l) ) + te(f, l, size) + s3 (f, l)      is observed from residual SST.

              × prey (f,l),y + s4 (f, l) × biomass(f,l),y + s5 (f, l)
                                                                            Spatial patterns in overlap
              × H(f,l),y + s6 (f, l) × SST(f,l),y + s7 (f, l)               A total of 1297 samples taken during 2001–2012 were included in the
              × Chla(f,l),y                                                 analysis (108 + 14 trawls per year). Densities of catshark were much
                                                                            higher (250–800 individuals km22) than those of octopus (60–
geographic position (longitude f, latitude l) and depth were                170 individuals km22). Spatial distribution of species densities and
included as smoothing functions denoted by s. The spatially explicit        overlap index is shown in Figure 3. The distribution of high-density
terms were included for log-transformed prey densities (prey) and           areas in octopus followed the deep continental shelf from the
total biomass in the community (biomass), diversity index (H), re-          Catalan Sea down to the Balearic Islands, where intermediate dens-
sidual SST, and Chla concentrations. The variation in overlap (re-          ities were found (Figure 3a). Very low densities were detected in the
sponse) explained by the spatially explicit terms depends on the            Alboran Sea. In contrast, the catshark distribution showed high-
weighted sum of the same smoothing function evaluated at different          density values across the entire study region, except the inshore
covariate values. Additionally, the effects of population size (size)       waters in the central coast of the mainland under the influence of
were tested independently for the two species. To do that, we used          Ebro river run-off (Figure 3b). Areas of high species overlap mainly
the formulation above in two different models, including octopus            covered the Catalan Sea and the Balearic Islands (Figure 3c), and
or catshark annual densities in the size term in each case. This            appeared to coincide with the distribution of S. canicula.
allows evaluating density-dependent effects at different population
sizes and testing the contribution of each species to overlap patterns,     Model selection
since large differences in the population abundances between species        Two model formulations were tested. They only differed in the in-
were observed in the preliminary analysis. A tensor product smooth-         clusion of octopus or catshark population size, but the model out-
er (te) was included for the size term. Tensor products are more ap-        comes and effects of covariates were the same. In both cases, all
propriate for interactions fitted over covariates with different units      predictor covariates were retained except Chla, which did not
(combining different smoothers, a two-dimensional thin plate re-            present significant effects on the overlap index (Table 1). The
gression for f, l, and univariate cubic regression spline for size).        density-dependent effects of population size greatly improved the
This formulation assumes gradual changes in the overlap distribu-           model fits. However, inclusion of octopus population size resulted
tion related to variations in the population size. To reduce                in a better fit in terms of AIC, gCV, and deviance explained
Community– environment interactions explain octopus-catshark spatial overlap                                                                   1905

                                                                                                                                                         Downloaded from https://academic.oup.com/icesjms/article/73/7/1901/2458758 by guest on 12 December 2020
Figure 2. Spatial variability across the study area of the resources (prey densities), community indicators (Shannon– Wiener diversity index, H; total
biomass) and environmental (chlorophyll a concentration, Chla; residual SST) factors. This figure is available in black and white in print and in
colour at ICES Journal of Marine Science online.

(61.8%). Therefore, the best model selected included the spatially ex-       overlap distribution. First, the overlap increased in the regions
plicit effects of prey densities, total biomass, diversity, and residual     where high overlap values were previously detected, the Balearic
SST, along with density-dependent effect of the octopus population           Islands and the Catalan Sea. The Alboran Sea and the central
size and a mean bathymetric and geographic effect. Directional var-          coast of the mainland stayed uniform with low overlap values re-
iograms (90 and 135 directions) of overlap index data showed a no-           gardless of population size. Second, considering only the high
ticeable spatial autocorrelation. However, the model residuals did           overlap areas, overlap values increased from the boundaries to
not showed any dependence pattern (Supplementary Figure S1).                 the centre of overlap area as the population size increased.
Since spatial correlation structure disappeared from the model, it
should not influence the estimates and uncertainty.                          Spatially explicit effects
                                                                             Significant slopes were found between the overlap index and all
Density-dependent effect of population size                                  covariates included as spatially explicit terms in the model,
Increases in the annual population size of octopus resulted in               showing contrasting local effects across the study area
gradual changes in the overlap with catshark (Figure 4). Two                 (Figure 5). Positive effects of prey densities were observed in
spatial patterns were detected in relation to the variation in the           the Catalan Sea and the islands, where the maximum overlap
1906 P. Puerta et al.
Discussion
The spatial patterns of the octopus Eledone cirrhosa and the catshark
Scyliorhinus canicula revealed that the overlap of these two species
increased as their shared prey densities (benthic crustaceans)
increased. Competition between the species could be expected as re-
source limitation might occur at small spatial and temporal scales in
the western Mediterranean Sea. Oligotrophy, pronounced seasonal-
ity in productivity (Estrada, 1996; Bosc et al., 2004; D’Ortenzio and
Ribera d’Alcalà, 2009) and degradation of habitat conditions, com-
munity, and species interactions by fishing pressure (Coll et al., 2006,
2012; Corrales et al., 2015) can all lead to food limitations. Our model
approach allows considering spatial patterns in a relative broad geo-
Downloaded from https://academic.oup.com/icesjms/article/73/7/1901/2458758 by guest on 12 December 2020
graphic area, while the species overlap and its drivers are evaluated at
local scales where imprints of competitive interactions can be still
discernible (Araújo and Rozenfeld, 2014). However, deducing pro-
cesses from spatial patterns are still a challenge in ecological research
and inferences should be taken with caution. The results showed that
spatial and diet overlap does not necessarily imply competition and
a constraint in the species-specific distributions. This is in accord-
ance with the theoretical framework of species interactions which
indicates that species overlap at broad scales are only evident
when actually there is no negative relationship between those
species (Gotelli et al., 2010; Araújo and Rozenfeld, 2014). As we
hypothesized, different ecological mechanisms allow for successful
coexistence of species with the same resource requirements (Hofer
et al., 2004). Density-dependent, environmental, trophic, and com-
munity factors play a role in the coexistence between the octopus
and the catshark across the study area.
Overlap was not spatially homogeneous, since the overlap index
depends on the species abundance and distribution. Catshark
showed much higher densities than octopus across the study area.
Additionally, the spatial pattern in the overlap was similar to the cat-
shark distribution. However, variability in octopus population size
better described variations in overlap patterns. The differences in the
species life history strategies may explain those patterns. Catshark is
a long-lived species (k-strategy), which usually presents densities
close to carrying capacity and successive coexisting generations.
The long lifespan and the demographic buffering support more
steady populations over time, and higher success in fluctuating
environments (Reznick et al., 2002 and references therein). Opposite
Figure 3. Spatial distribution of log-transformed densities of octopus traits (r-strategy) define the cephalopod life cycles. The short lifespan
(Eledone cirrhosa) and catshark (Scyliorhinus canicula) and the overlap with no overlap among generations, make populations very sensitive
index estimated for the two species. This figure is available in black and to changing conditions (Pierce et al., 2008), especially at local scales
white in print and in colour at ICES Journal of Marine Science online. (Puerta et al., 2014b). They display high fluctuations as a consequence.
High overlap values (i.e. high densities of the two species) were
between the species was observed. In contrast, the positive effects detected in the northern mainland (Catalan Sea) and the Balearic
of total biomass in the community were generalized across the Islands, indicating a low or lack of competition in these areas. In
entire region. However, the strength of this effect was higher in contrast, the low overlap areas corresponded to low densities of cat-
the areas with maximum overlap. A different pattern was observed shark and octopus and were not affected by species population size.
for the effects of the community diversity. Positive effects were Catshark was only absent in the central coast of the mainland, where
present in the islands and continuing southwards throughout the low biomass and diversity were also observed. These patterns in the
mainland coast, following approximately the boundary of the community indicators agree with the high fishing pressure observed
overlap distribution. Additionally, negative effects of diversity were nearby the Ebro river mouth (Coll et al., 2012; Navarro et al., 2015,
detected in the most southwestern region, close to the Strait of 2016). Due to the long-living strategy, elasmobranchs are very sen-
Gibraltar. Finally, both negative and positive effects were also sitive to long-term disturbances such as fishing pressure since popu-
observed related to residual SST. In the Catalan Sea, the overlap lations present low resilience and recovery (Guijarro et al., 2012;
was negatively influenced by temperature, while the southern bound- Barausse et al., 2014; Navarro et al., 2015, 2016; Quetglas et al.,
ary of the overlap distribution and part of the Alboran Sea presented 2016). In accordance with previous research (Cartes et al., 2013;
positive effects. The colder and warmer SST records characterized, re- Navarro et al., 2015, 2016), these results point the high fishing pres-
spectively, these two regions. sure of this area as responsible for the decline of elasmobranchTable 1. Comparison of full and reduced GAMs of overlap index.
Model AIC gCV Dev (%)
O(f,l) ¼ s1( f,l) + s2(depth(f,l)) + te( f,l,size.S) + s3( f,l)*prey (f,l),y +s4( f,l)*biomass (f,l), y + s5( f,l)*H (f,l), y + s6( f,l)*SST (f,l), y + s7( f,l)*Chla (f,l), y 4720.57 2.43 60.70
O(f,l) ¼ s1( f,l) + s2(depth(f,l)) + te( f,l,size.S) + s3( f,l)*prey (f,l),y +s4( f,l)*biomass (f,l), y + s5( f,l)*H (f,l), y + s6( f,l)*SST y(f,l), y 4717.79 2.41 60.50
O(f,l) ¼ s1( f,l) + s2(depth(f,l)) + te( f,l,size.S) + s3( f,l)*prey (f,l),y +s4( f,l)*biomass (f,l), y + s5( f,l)*H (f,l), y 4719.72 2.39 60.40
O(f,l) ¼ s1( f,l) + s2(depth(f,l)) + te( f,l,size.E) + s3( f,l)*prey (f,l),y +s4( f,l)*biomass (f,l), y + s5( f,l)*H (f,l), y + s6( f,l)*SST (f,l), y + s7( f,l)*Chla (f,l), y 4704.83 2.43 61.80
O(f,l) 5 s1( f,l) 1 s2(depth(f,l)) 1 te( f,l,size.E) 1 s3( f,l)*prey (f,l),y 1 s4( f,l)*biomass (f,l), y 1 s5( f,l)*H (f,l), y 1 s6( f,l)*SST (f,l), y 4700.87 2.38 61.80
O(f,l) ¼ s1( f,l) + s2(depth(f,l)) + te( f,l,size.E) + s4( f,l)*biomass (f,l), y + s5( f,l)*H (f,l), y + s6( f,l)*SST (f,l), y 4708.82 2.40 61.20
Full model of overlap index (O(f,l)) includes longitude ( f ), latitude(l), depth, E. cirrhosa (size.E) or S. canicula (size.S) population size, prey densities (prey), total biomass in the community (biomass), diversity (H), sea
surface temperature (SST) and chlorophyll concentration (Chla) as covariates. Dev, deviance explained; AIC, Akaike Information Criterion; gCV, genuine Cross Validation. Best model is in bold.
Community– environment interactions explain octopus-catshark spatial overlap
Figure 4. Changes in the spatial patterns of overlap index between
(c) Population size ¼ 20 000 ind km2. This figure is available in black
1907
Population size ¼ 3000 ind km2. (b) Population size ¼ 9000 ind km2.
in octopus found in the Alboran Sea could also reflect a prior
(Puerta et al., 2015). High densities in prey and catshark and low
hydro-dynamism and varying conditions in the southern area
populations highly resilient and therefore, their spatial distribution
(Alboran Sea) may make this area less suitable to cephalopods
is mainly forced by the short-term environmental variability, being
suitability. In contrast, the fast-living strategy makes cephalopod
and white in print and in colour at ICES Journal of Marine Science online.
no affected by fishing impact (Caddy and Rodhouse, 1998; Coll
et al., 2013; Navarro et al., 2015; Quetglas et al., 2016). The high
octopus and catshark, with increases in the octopus population size. (a)
populations, along with changes in salinity that can lessen habitat
Downloaded from https://academic.oup.com/icesjms/article/73/7/1901/2458758 by guest on 12 December 20201908 P. Puerta et al.
Downloaded from https://academic.oup.com/icesjms/article/73/7/1901/2458758 by guest on 12 December 2020
Figure 5. Spatially explicit effects of resources (prey densities), community indicators (Shannon – Wiener diversity index, H; total biomass), and
environmental (residual SST) factors on the overlap index. Only significant positive (blue) and negative (red) effects (regression slopes based on 95%
confidence interval) are shown. Patterns of spatial overlap are presented (grey contour), with high and low values of overlap indicated by dark and
light grey shading, respectively. This figure is available in black and white in print and in colour at ICES Journal of Marine Science online.
competitive exclusion process in this area. However, the effects of and nutrient-rich waters from the Gulf of Lions (Estrada, 1996;
other factors not considered in this study, e.g. substrate, predation, D’Ortenzio and Ribera d’Alcalà, 2009) that can supply enough
or local seasonality in octopus populations (Vargas-Yáñez et al., resources to maintain prey and competitor populations at relatively
2009; Puerta et al., 2014b) cannot be discarded. high densities.
According to the species range hypothesis, populations living at Very high diversity was observed around the Balearic Islands,
distributional boundaries are more influenced by environmental where the high overlap was more related to this factor than to
changes because habitat conditions are less suitable there than in prey densities. High species diversity is associated with complex,
the core distribution area (Rosenzweig, 1991; Brunel and Boucher, diverse, and “healthy” seascapes in structure and functioning
2006). In a similar way, species overlap was more sensitive to popu- (Thrush et al., 2006; Foley et al., 2010 and references therein).
lation size effects in the boundaries of high overlap areas, i.e. Catalan This pattern is in agreement with the lower fishing pressure and
Sea and Balearic Islands, where prey densities were lower compared better state of conservation observed in the islands compared with
with the core. As predator population sizes increased, their spatial the mainland areas (Moranta et al., 2008; Quetglas et al., 2012;
overlap first increased in the boundaries, which might reflect a strat- Navarro et al., 2015, 2016). These systems provide more opportun-
egy to reduce competition and diversify diets (see below). In contrast, ities to exploit different resources, thus favouring species coexistence
under high-population densities, the species overlap extended to the (Bonin et al., 2009; Geange and Stier, 2010). Opportunistic species
central area, where higher prey densities were found. In accordance with wide range of prey items, such as octopus and catshark, may
with these results, positive effects of prey were observed in the high show slightly different feeding habits to avoid competition in high re-
overlap areas. These results reinforced our hypothesis of shared source and complex ecosystems. For instance, in addition to benthic
resources as a mechanism for spatial overlap, where coexistence is crustaceans, the two species also consume polychaetes, molluscs, or
allowed by other ecological processes. Despite the considerable small fishes (Valls et al., 2011; Puerta et al., 2015). These results are in
fishing pressure reported in the Catalan Sea (Moranta et al., 2008; agreement with the regional effect observed for total biomass in the
Quetglas et al., 2012; Navarro et al., 2015, 2016), intermediate and community, which showed a general increment in overlap when
high values of biomass and diversity, respectively, were observed in resources (specific prey items and others) are higher.
this area. The Catalan Sea is one of the most productive areas in In the western Mediterranean, trophic pathways are the most
the western Mediterranean due to the influence of the upwelling plausible link between surface conditions, such as SST, and benthicCommunity– environment interactions explain octopus-catshark spatial overlap 1909
communities (Cartes et al., 2009; Fanelli et al., 2013). Residual SST address community spatial dynamics and move towards ecosystem-
showed contrasting spatial effects on overlap along the temperature- based management (Sexton et al., 2009; Foley et al., 2010; Link and
geographic gradient. Similar SST spatial effects were also detected in Auster, 2013) for sustainable fisheries and conservation planning.
the distribution of the two species (Supplementary Figure S2), sug-
gesting a common response to SST in the benthic community. This Supplementary data
response is likely related to differences in the foodwebs and the Supplementary material is available at the ICESJMS online version
energy transfer efficiency between northern and southern regions of the manuscript.
of the study area (Fanelli et al., 2013). Benthic communities are
mainly supported by surface primary production throughout verti- Acknowledgements
cal flux of organic matter (Turner, 2015 and references therein), We are very grateful to all scientists and vessel crew that participated in
which in turn depend on the type of phytoplankton community the MEDITS surveys. This research is supported by the project
(Guidi et al., 2009). In the western Mediterranean, phytoplankton “ECLIPSAME” (Synergistics effects of Climate and Fishing on the de-
Downloaded from https://academic.oup.com/icesjms/article/73/7/1901/2458758 by guest on 12 December 2020
composition change seasonally from a dominance of large cells mersal ecosystems of the North Atlantic and western Mediterranean,
during winter and spring blooms to a higher contribution of the CTM2012-37701) financed by the Spanish Ministry of Economy and
pico-size fraction in summer (Agawin et al., 1998, 2000; Arin et al., Competitiveness. Surveys were co-funded by the Directorate-General
2005). Residuals of SST indicated that northern and southern areas for Maritime Affairs and Fisheries (DG-MARE) of the European
were at different stages of the seasonal transition during spring Commission and the Spanish Institute of Oceanography (IEO). P.P.
(Figure 2). Therefore, opposite spatial effects of SSTmight reflect dif- is supported by the funding of FPI grant BES-2010-030315 from the
ferent mechanisms supplying resources from surface to deeper Spanish Ministry of Economy and Competitiveness. M.E.H.’s
benthic communities via primary producers that lastly favour funding is provided by the Gordon and Betty Moore Foundation.
species overlap. M.H. was funded by MYFISH project (EU contract number 289257)
Lower values and negative spatial effects of SST observed in the and a post-doctoral contract from the regional government of the
Catalan Sea might be associated with the influence of colder and Balearic Islands, Dirección General d’Educació, Personal Docent,
nutrient-richer waters from the Gulf of Lions over time (Miquel Universitats i Recerca, co-funded by the European Social Fund
et al., 2011; Heimbürger et al., 2013; Estrada et al., 2014) that 2014-2020. L.C. acknowledges support from the National Science
trigger the spring bloom (Estrada, 1996; D’Ortenzio and Ribera Foundation, grant number: 1140207.
d’Alcalà, 2009). In contrast, the southern areas are warmer and
more oligotrophic, showing no blooms (D’Ortenzio and Ribera
References
d’Alcalà, 2009). At the residual SST observed here, pico-
Agawin, N. S. R., Duarte, C. M., and Agustı́, S. 1998. Growth and abun-
phytoplankton community is expected to be already dominant
dance of Synechococcus sp. in a Mediterranean bay: seasonality and
(Agawin et al., 1998, 2000; Partensky et al., 1999; Arin et al., relationship with temperature. Marine Ecology Progress Series,
2005). Warmer temperatures increase productivity and turnover 170: 45– 53.
rates of pico-size cells (Agawin et al., 1998, 2000), which might Agawin, N. S. R., Duarte, C. M., and Agustı́, S. 2000. Nutrient and tem-
explain the positive effects of SST. Regardless of the mechanism, perature control of the contribution of picoplankton to phytoplan-
the rapid vertical fluxes (few days from subsurface production to ton biomass and production. Limnology and Oceanography, 45:
seabed, Peterson et al., 2005) might favour the octopus-catshark 591– 600.
overlap. It is worth noting that during spring, a deep chlorophyll Albouy, C., Velez, L., Coll, M., Colloca, F., Le Loc’h, F., Mouillot, D., and
Gravel, D. 2014. From projected species distribution to food-web
maximum is also observed under the thermocline (Estrada, 1996),
structure under climate change. Global Change Biology, 20:
which may also influence the benthic community. 730– 741.
The present study highlights the necessity of a deeper knowledge André, J., Haddon, M., and Pecl, G. T. 2010. Modelling climate-
in species interactions combining small and large spatial scales. change-induced nonlinear thresholds in cephalopod population
Distribution and interaction patterns between species arose from dynamics. Global Change Biology, 16: 2866– 2875.
local variability in the seascapes across geographical ranges, where Araújo, M. B., and Rozenfeld, A. 2014. The geographic scaling of biotic
community and trophic features play an important role. However, interactions. Ecography, 37: 406– 415.
some other factors should be considered in future research to Arin, L., Estrada, M., Salat, J., and Cruzado, A. 2005. Spatio-temporal
improve the inference of competitive interactions from spatial pat- variability of size fractionated phytoplankton on the shelf adjacent
terns. For instance, information on fishing pressure could provide to the Ebro river (NW Mediterranean). Continental Shelf
Research, 25: 1081– 1095.
more accurate description of the spatial pattern in overlap.
Bacheler, N. M., Bailey, K. M., Ciannelli, L., Bartolino, V., and Chan,
Additionally, the segregation by size described for the two species K-S. 2009. Density-dependent, landscape, and climate effects on
can also play a role in the octopus-catshark competitive interactions. spawning distribution of walleye pollock Theragra chalcogramma.
The results described a spatial structuring not limited to population Marine Ecology Progress Series, 391: 1 – 12.
distributions and also observed for the species interactions (coexist- Barausse, A., Correale, V., Curkovic, A., Finotto, L., Riginella, E.,
ence or exclusion). Areas with high resources in terms of specific Visentin, E., and Mazzoldi, C. 2014. The role of fisheries and the en-
prey items (Catalan Sea) or alternative supplies, such as niche op- vironment in driving the decline of elasmobranchs in the northern
portunities and ecosystem functions, defined by community diver- Adriatic Sea. ICES Journal of Marine Science, 71: 236– 240.
sity (Balearic Islands) favoured species coexistence. Our study also Bartolino, V., Ciannelli, L., Bacheler, N. M., and Chan, K-S. 2011.
Ontogenetic and sex-specific differences in density-dependent
suggests that pelagic seascapes (surface temperature and primary
habitat selection of a marine fish population. Ecology, 92: 189 – 200.
production) are not independent of the benthic realm, and the
Belcari, P., Tserpes, G., González, M., Lefkaditou, E., Marceta, B., and
dynamic benthic-pelagic coupling needs to be taking into account in Manfrin, G. P. 2002. Distribution and abundance of Eledone cirrhosa
oligotrophic systems such as the Mediterranean Sea. Characterizing (Lamarck, 1798) and E. moschata (Lamarck, 1798) (Cephalopoda?:
species interactions across space and time is pivotal to properly Octopoda) in the Mediterranean Sea. Scientia Marina, 66: 143 – 155.1910 P. Puerta et al.
Bertrand, J. A., Gil de Sola, L., Papaconstantinou, C., Relini, G., and Cormon, X., Loots, C., Vaz, S., Vermard, Y., and Marchal, P. 2014.
Souplet, A. 2002. The general specifications of the MEDITS Spatial interactions between saithe (Pollachius virens) and hake
surveys. Scientia Marina, 66: 9 – 17. (Merluccius merluccius) in the North Sea. ICES Journal of Marine
Bonin, M. C., Srinivasan, M., Almany, G. R., and Jones, G. P. 2009. Science, 71: 1342– 1355.
Interactive effects of interspecific competition and microhabitat Corrales, X., Coll, M., Tecchio, S., Bellido, J. M., Fernández, Á. M., and
on early post-settlement survival in a coral reef fish. Coral Reefs, Palomera, I. 2015. Ecosystem structure and fishing impacts in the
28: 265 –274. northwestern Mediterranean Sea using a food web model within a
Bosc, E., Bricaud, A., and Antoine, D. 2004. Seasonal and interannual comparative approach. Journal of Marine Systems, 148: 183– 199.
variability in algal biomass and primary production in the Dambach, J., and Rödder, D. 2011. Applications and future challenges in
Mediterranean Sea, as derived from 4 years of SeaWiFS observations. marine species distribution modeling. Aquatic Conservation:
Global Biogeochemical Cycles, 18: GB1005. Marine and Freshwater Ecosystems, 21: 92– 100.
Boström-Einarsson, L. E., Bonin, M. C., Munday, P. L., and Jones, G. P. D’Ortenzio, F., and Ribera d’Alcalà, M. 2009. On the trophic regimes of
2014. Habitat degradation modifies the strength of interspecific the Mediterranean Sea?: a satellite analysis. Biogeosciences, 6:
competition in coral dwelling damselfishes. Ecology, 95: 3056– 3067. 139– 148.
Downloaded from https://academic.oup.com/icesjms/article/73/7/1901/2458758 by guest on 12 December 2020
Boyle, P., and Rodhouse, P. 2005. Cephalopods Ecology and Fisheries. Ellis, J., Mancusi, C., Serena, F., Haka, F., Guallart, J., Ungaro, N.,
Blackwell Science, London. Coelho, R., et al. 2009. Scyliorhinus canicula. www.iucnredlist.org
Boyle, P. R., Grisley, M. S., and Robertson, G. 1986. Crustacea in the diet (last accessed 11 May 2015).
of Eledone cirrhosa (Mollusca: Cephalopoda) determined by sero- Estrada, M. 1996. Primary production in the northwestern Mediterranean.
logical methods. Journal of the Marine Biological Association of Scientia Marina, 60: 55–64.
the United Kingdom, 66: 867– 879.
Estrada, M., Latasa, M., Emelianov, M., Gutiérrez-Rodrı́guez, A.,
Brunel, T., and Boucher, J. 2006. Pattern of recruitmennt variability in Fernández-Castro, B., Isern-Fontanet, J., Mouriño-Carballido, B.,
the geographical range of the exploited northeast Atlantic fish et al. 2014. Seasonal and mesoscale variability of primary production
species. Journal of Sea Research, 55: 156– 168. in the deep winter-mixing region of the NW Mediterranean. Deep
Butler, M. J., and Lear, J. A. 2009. Habitat-based intraguild predation by Sea Research Part I: Oceanographic Research Papers, 94: 45 – 61.
Caribbean reef octopus Octopus briareus on juvenile Caribbean spiny Fanelli, E., Cartes, J. E., Papiol, V., and López-Pérez, C. 2013.
lobster Panulirus argus. Marine Ecology Progress Series, 386: 115–122. Environmental drivers of megafaunal assemblage composition and
Caddy, J. F., and Rodhouse, P. G. 1998. Cephalopod and groundfish biomass distribution over mainland and insular slopes of the
landings: evidence for ecological change in global fisheries? Balearic Basin (Western Mediterranean). Deep Sea Research Part I:
Reviews in Fish Biology and Fisheries, 8: 431– 444. Oceanographic Research Papers, 78: 79 – 94.
Cartes, J., Fanelli, E., Lloris, D., and Matallanas, J. 2013. Effect of envir- Foley, M. M., Halpern, B. S., Micheli, F., Armsby, M. H., Caldwell, M. R.,
onmental variations on shark and other megafauna assemblages in Crain, C. M., Prahler, E., et al. 2010. Guiding ecological principles for
the deep Mediterranean Sea over the last 60 years. Climate marine spatial planning. Marine Policy, 34: 955 –966.
Research, 55: 239– 251.
Gasalla, M. A., Rodrigues, A. R., and Postuma, F. A. 2010. The trophic
Cartes, J. E., Maynou, F., Fanelli, E., Papiol, V., and Lloris, D. 2009. role of the squid Loligo plei as a keystone species in the South
Long-term changes in the composition and diversity of deep-slope Brazil Bight ecosystem. ICES Journal of Marine Science, 67:
megabenthos and trophic webs off Catalonia (western 1413– 1424.
Mediterranean): are trends related to climatic oscillations?
Progress in Oceanography, 82: 32– 46. Geange, S. W., and Stier, A. C. 2010. Priority effects and habitat com-
plexity affect the strength of competition. Oecologia, 163: 111 – 118.
Ciannelli, L., and Bailey, K. M. 2005. Landscape dynamics and resulting
species interactions: the cod-capelin system in the southeastern Gotelli, N. J., Graves, G. R., and Rahbek, C. 2010. Macroecological
Bering Sea. Marine Ecology Progress Series, 291: 227– 236. signals of species interactions in the Danish avifauna. Proceedings
of the National Academy of Sciences of the United States of
Ciannelli, L., Bartolino, V., and Chan, K-S. 2012. Non-additive and non-
America, 107: 5030– 5035.
stationary properties in the spatial distribution of a large marine fish
population. Proceedings of the Royal Society B: Biological Sciences, Gouraguine, A., Hidalgo, M., Moranta, J., Bailey, D. M., Ordines, F.,
279: 3635– 3642. Guijarro, B., Valls, M., et al. 2011. Elasmobranch spatial segregation
in the western Mediterranean. Scientia Marina, 75: 653– 664.
Ciannelli, L., Fauchald, P., Chan, K. S., Agostini, V. N., and Dingsør,
G. E. 2008. Spatial fisheries ecology: recent progress and future pro- Guidi, L., Stemmann, L., Jackson, G. a., Ibanez, F., Claustre, H.,
spects. Journal of Marine Systems, 71: 223– 236. Legendre, L., Picheral, M., et al. 2009. Effects of phytoplankton com-
munity on production, size, and export of large aggregates: a
Cobb, C. S., Williamson, R., and Pope, S. K. 1995. The responses to the
epistellar photoreceptors to light and their effect on circadian world-ocean analysis. Limnology and Oceanography, 54:
rhythms in the lesser octopus, Eledone cirrhosa. Marine and 1951– 1963.
Freshwater Behaviour and Physiology, 26: 59– 69. Guijarro, B., Quetglas, A., Moranta, J., Ordines, F., Valls, M., González,
Coll, M., Navarro, J., Olson, R. J., and Christensen, V. 2013. Assessing the N., and Massutı́, E. 2012. Inter- and intra-annual trends and status
trophic position and ecological role of squids in marine ecosystems indicators of nektobenthic elasmobranchs off the Balearic Islands
by means of food-web models. Deep Sea Research Part II: Topical (northwestern Mediterranean). Scientia Marina, 76: 87– 96.
Studies in Oceanography, 95: 21 – 36. Heimbürger, L. E., Lavigne, H., Migon, C., D’Ortenzio, F., Estournel, C.,
Coll, M., Palomera, I., Tudela, S., and Dowd, M. 2008. Food-web dy- Coppola, L., and Miquel, J. C. 2013. Temporal variability of vertical
namics in the South Catalan Sea ecosystem (NW Mediterranean) export flux at the DYFAMED time-series station (Northwestern
for 1978– 2003. Ecological Modelling, 217: 95 – 116. Mediterranean Sea). Progress in Oceanography, 119: 59– 67.
Coll, M., Palomera, I., Tudela, S., and Sardà, F. 2006. Trophic flows, eco- Hofer, U., Bersier, L. F., and Borcard, D. 2004. Relating niche and spatial
system structure and fishing impacts in the South Catalan Sea, overlap at the community level. Oikos, 106: 366– 376.
Northwestern Mediterranean. Journal of Marine Systems, 59: 63–96. Hunsicker, M., Ciannelli, L., Bailey, K., and Zador, S. 2010. Processes
Coll, M., Piroddi, C., Albouy, C., Ben Rais Lasram, F., Cheung, W. W. L., driving differences in major food web linkages of the Gulf of
Christensen, V., Karpouzi, V. S., et al. 2012. The Mediterranean Sea Alaska and eastern Bering Sea ecosystems. ICES CM 2010/S:06.
under siege: spatial overlap between marine biodiversity, cumulative Johnson, A. F., Jenkins, S. R., Hiddink, J. G., and Hinz, H. 2013. Linking
threats and marine reserves. Global Ecology and Biogeography, 21: temperate demersal fish species to habitat: scales, patterns and future
465– 480. directions. Fish and Fisheries, 14: 256– 280.Community– environment interactions explain octopus-catshark spatial overlap 1911
Kempf, A., Stelzenmüller, V., Akimova, A., and Floeter, J. 2013. Spatial as- Quetglas, A., Guijarro, B., Ordines, F., and Massutı́, E. 2012. Stock
sessment of predator-prey relationships in the North Sea: the influence boundaries for fisheries assessment and management in the
of abiotic habitat properties on the spatial overlap between 0-group Mediterranean: the Balearic Islands as a case study. Scientia
cod and grey gurnard. Fisheries Oceanography, 22: 174–192. Marina, 76: 17 – 28.
Kilpatrick, K. A., Podestá, G. P., and Evans, R. 2001. Overview of the Quetglas, A., Rueda, L., Alvarez-Berastegui, D., Guijarro, B., and
NOAA/NASA advanced very high resolution radiometer Massutı́, E. 2016. Contrasting responses to harvesting and environ-
Pathfinder algorithm for sea surface temperature and associated mental drivers of fast and slow life history species. PLoS ONE, 11:
matchup database. Journal of Geophysical Research: Oceans, 106: e0148770.
9179– 9197. Reznick, D., Bryant, M. J., and Bashey, F. 2002. r- and K-selection revis-
Kordas, R. L., Harley, C. D. G., and O’Connor, M. I. 2011. Community ited: the role of population regulation in life-history evolution.
ecology in a warming world: the influence of temperature on inter- Ecology, 83: 1509 – 1520.
specific interactions in marine systems. Journal of Experimental Rodhouse, P. G. K., Pierce, G. J., Nichols, O. C., Sauer, W. H. H., Arkhipkin,
Marine Biology and Ecology, 400: 218– 226. A. I., Laptikhovsky, V. V., Lipiński, M. R., et al. 2014. Environmental
Link, J. S., and Auster, P. J. 2013. The challenges of evaluating competi- effects on cephalopod population dynamics: implications for manage-
Downloaded from https://academic.oup.com/icesjms/article/73/7/1901/2458758 by guest on 12 December 2020
tion among marine fishes: who cares, when does it matter, and what ment of fisheries. Advances in Marine Biology, 67: 99–233.
can one do about it? Bulletin of Marine Science, 89: 213– 247. Rodrı́guez-Cabello, C., Sánchez, F., Fernández, A., and Olaso, I. 2004. Is
Martinho, F., Sá, C., Falcão, J., Cabral, H. N., and Pardal, M. Â. 2012. the lesser spotted dogfish (Scyliorhinus canicula) population from
Comparative feeding ecology of two elasmobranch species, the Cantabrian Sea a unique stock? Fisheries Research, 69: 57 – 71.
Squalus blainville and Scyliorhinus canicula, off the coast of Rodrı́guez-Cabello, C., Sánchez, F., and Olaso, I. 2007. Distribution pat-
Portugal. Fishery Bulletin, 110: 71 – 84. terns and sexual segregations of Scyliorhinus canicula (L.) in the
Miquel, J. C., Martı́n, J., Gasser, B., Rodriguez-y-Baena, A., Toubal, T., and Cantabrian Sea. Journal of Fish Biology, 70: 1568– 1586.
Fowler, S. W. 2011. Dynamics of particle flux and carbon export in the Rosenzweig, M. L. 1991. Habitat selection and population interactions?:
northwestern Mediterranean Sea: a two decade time-series study at the
the search for mechanism. The American Naturalist, 137: S5 – S28.
DYFAMED site. Progress in Oceanography, 91: 461–481.
Santoleri, R., Böhm, E., and Schiano, M. E. 1994. The sea surface tem-
Moranta, J., Quetglas, A., Massutı́, E., Guijarro, B., Hidalgo, M., and
perature of the Western Mediterranean Sea: historical satellite
Diaz, P. 2008. Spatio-temporal variations in deep-sea demersal com-
thermal data. In Seasonal and Interannual Variability of the
munities off the Balearic Islands (western Mediterranean). Journal
Western Mediterranean Sea, pp. 155– 176. Ed. by P. E. La Viollette.
of Marine Systems, 71: 346– 366.
American Geophysical Union, Washington, DC.
Navarro, J., Cardador, L., Fernández, Á. M., Bellido, J. M., and Coll, M.
Sexton, J. P., McIntyre, P. J., Angert, A. L., and Rice, K. J. 2009. Evolution
2016. Differences in the relative roles of environment, prey availabil-
and ecology of species range limits. Annual Review of Ecology,
ity and human activity in the spatial distribution of two marine
Evolution, and Systematics, 40: 415– 436.
mesopredators living in highly exploited ecosystems. Journal of
Biogeography, 43: 440 – 450. Sims, D., Nash, J., and Morritt, D. 2001. Movements and activity of male
Navarro, J., Coll, M., Cardador, L., Fernández, Á. M., and Bellido, J. M. and female dogfish in a tidal sea lough: alternative behavioural strategies
2015. The relative roles of the environment, human activities and and apparent sexual segregation. Marine Biology, 139: 1165–1175.
spatial factors in the spatial distribution of marine biodiversity in Staudinger, M. D., Juanes, F., Salmon, B., and Teffer, A. K. 2013. The dis-
the Western Mediterranean Sea. Progress in Oceanography, 131: tribution, diversity, and importance of cephalopods in top predator
126– 137. diets from offshore habitats of the Northwest Atlantic Ocean. Deep
Orrock, J. L., and Watling, J. I. 2010. Local community size mediates eco- Sea Research Part II: Topical Studies in Oceanography, 95: 182 – 192.
logical drift and competition in metacommunities. Proceedings of the Stewart, J. S., Hazen, E. L., Bograd, S. J., Byrnes, J. E. K., Foley, D. G.,
Royal Society B: Biological Sciences, 277: 2185–2191. Gilly, W. F., Robison, B. H., et al. 2014. Combined climate- and prey-
Partensky, F., Blanchot, J., and Vaulot, D. 1999. Differential distribution mediated range expansion of Humboldt squid (Dosidicus gigas), a
and ecology of Prochlorococcus and Synechococcus in oceanic waters: a large marine predator in the California Current System. Global
review. Bulletin de ĺInstitut Océanographique, 19: 457 – 475. Change Biology, 20: 1832– 1843.
Pennino, M. G., Muñoz, F., Conesa, D., López-Quílez, A., and Bellido, Thrush, S. F., Gray, J. S., Hewitt, J. E., and Ugland, K. I. 2006. Predicting
J. M. 2013. Modeling sensitive elasmobranch habitats. Journal of the effects of habitat homogenization on marine biodiversity.
Sea Research, 83: 209– 218. Ecological Applications, 16: 1636– 1642.
Peterson, M. L., Wakeham, S. G., Lee, C., Askea, M. A., and Miquel, J. C. Turner, J. T. 2015. Zooplankton fecal pellets, marine snow, phytodetri-
2005. Novel techniques for collection of sinking particles in the tus and the ocean’s biological pump. Progress in Oceanography, 130:
ocean and determining their settling rates. Limnology and 205– 248.
Oceanography: Methods, 3: 520 – 532. Valls, M., Quetglas, A., Ordines, F., and Moranta, J. 2011. Feeding ecology
Pierce, G. J., Valavanis, V. D., Guerra, A., Jereb, P., Orsi-Relini, L., Bellido, of demersal elasmobranchs from the shelf and slope off the Balearic
J. M., Katara, I., et al. 2008. A review of cephalopod–environment inter- Sea (western Mediterranean). Scientia Marina, 75: 633–639.
actions in European Seas. Hydrobiologia, 612: 49–70. Vargas-Yáñez, M., Moya, F., Garcı́a-Martı́nez, M., Rey, J., González, M.,
Puerta, P., Hidalgo, M., González, M., Esteban, A., and Quetglas, A. and Zunino, P. 2009. Relationships between Octopus vulgaris land-
2014a. Role of hydro-climatic and demographic processes on the ings and environmental factors in the northern Alboran Sea
spatio-temporal distribution of cephalopods in the Western (Southwestern Mediterranean). Fisheries Research, 99: 159– 167.
Mediterranean. Marine Ecology Progress Series, 514: 105– 118. Walton, C. C., Pichel, W. G., Sapper, J. F., and May, D. A. 1998. The de-
Puerta, P., Hunsicker, M. E., Quetglas, A., Álvarez-Berastegui, D., velopment and operational application of nonlinear algorithms for
Esteban, A., González, M., and Hidalgo, M. 2015. Spatially explicit the measurement of sea surface temperatures with the NOAA polar-
modeling reveals cephalopod distributions match contrasting orbiting environmental satellites. Journal of Geophysical Research:
trophic pathways in the western Mediterranean Sea. PLoS ONE, Oceans, 103: 27999– 28012.
10: e0133439. Worm, B., and Lotze, H. K. 2009. Changes in marine biodiversity as an
Puerta, P., Quetglas, A., and Hidalgo, M. 2014b. Modelling seasonal indicator of climate change. In Climate Change: Observed Impacts
variability of cephalopod abundances of three contrasting species on Planet Earth, pp. 263 –279. Ed. by T. M. Letcher. Elsevier BV,
from Western Mediterranean Sea. ICES CM 2014/P:02. Oxford. 492 pp.
Handling editor: Francis JuanesYou can also read