Intra-stock diversity in egg specific gravity of Atlantic cod in Icelandic waters - Faculty of Life and Environmental Sciences University of ...
←
→
Page content transcription
If your browser does not render page correctly, please read the page content below
Intra-stock diversity in egg specific gravity
    of Atlantic cod in Icelandic waters

            Lovísa Ólöf Guðmundsdóttir

  Faculty of Life and Environmental Sciences
             University of Iceland
                      2013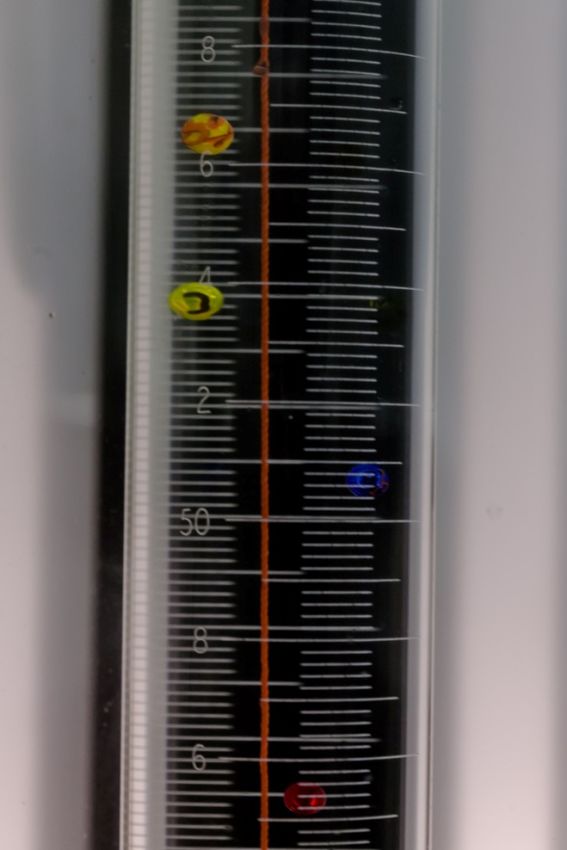
Intra-stock diversity in egg specific gravity
    of Atlantic cod in Icelandic waters

               Lovísa Ólöf Guðmundsdóttir

      90 ECTS thesis submitted in partial fulfillment of a
           Magister Scientiarum degree in Biology

                          Advisor(s)
                 Prof. Guðrún Marteinsdóttir
                       Dr. Olav Kjesbu
                  Dr. Timothy B. Grabowski

                   Faculty Representative
                  Sveinn Kári Valdimarsson

         Faculty of Life and Environmental Sciences
         School of Engineering and Natural Sciences
                     University of Iceland
                    Reykjavik, April 2013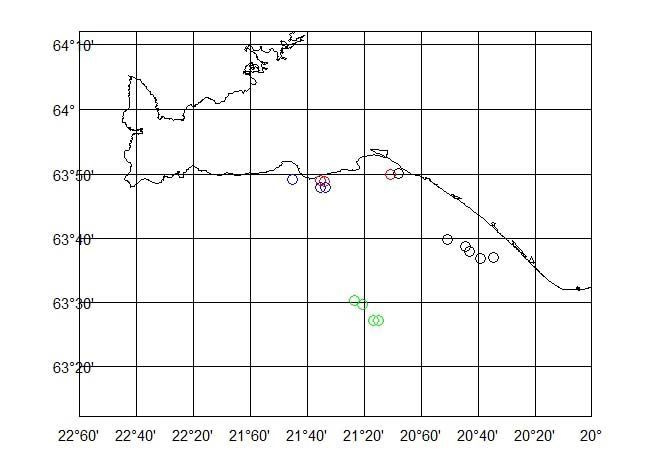
Intra-stock diversity in egg specific gravity of Atlantic cod in Icelandic waters
Egg specific gravity of cod in Icelandic waters.
90 ECTS thesis submitted in partial fulfillment of a Magister Scientiarum degree in
Biology

Copyright © 2013 Lovísa Ólöf Guðmundsdóttir
All rights reserved

Faculty of Life and Environmental Sciences
School of Engineering and Natural Sciences
University of Iceland
Askja, Sturlugötu 7
107, Reykjavik
Iceland

Telephone: 525 4000

Bibliographic information:
Lovísa Ólöf Guðmundsdóttir, 2013, Intra-stock diversity in egg specific gravity of Atlantic
cod in Icelandic waters, Master’s thesis, Faculty of Life and Environmental Sciences,
University of Iceland.

Printing: Háskólaprent
Reykjavik, Iceland, May 2013
Abstract
The specific gravity of fish eggs affects their vertical distribution in the water column and
thus their transportation routes and survival. Previous studies have shown that egg specific
gravity can be adapted to the local conditions, for instance to reduce the chances of
unsuitable drift routes or to avoid hostile conditions for development. The Icelandic cod
stock has been shown to consist of two distinct behavioural types, usually referred to as
frontal or coastal fish that occupy the same spawning grounds but exhibit either deep-water
or shallow-water migration behaviour outside the spawning periods. The main objective of
this study was to compare the egg specific gravity of the two behaviour types of cod found
in Icelandic waters and see if it contributes to the maintenance of the two groups. Eggs
were collected and fertilized in vitro from spawning grounds southwest of Iceland in April
2010 and 2011. Egg specific gravity obtained from days 2, 3 and 4 after fertilization
showed no difference between the behaviour groups while there were strong indications of
the eggs of frontal cod being lighter than the eggs of coastal cod during the last stages of
development. Egg diameter was also found to vary between the two groups as frontal cod
produced larger eggs than coastal cod. These results reveal previously unknown
differences in the life-history of the two behaviour groups and might be attributed to
environmental factors or genetics.

Útdráttur
Eðlisþyngd fiskeggja hefur áhrif á lóðrétta dreifingu þeirra í sjónum og þar af leiðandi
dreifingu þeirra með mismunandi straumum og hugsanlega afkomu. Fyrri rannsóknir hafa
sýnt að eðlisþyngd fiskeggja getur verið aðlöguð að umhverfisaðstæðum, til dæmis til að
draga úr líkum á óhentugu reki eða til að forðast óhagstæðar aðstæður fyrir þroskun. Sýnt
hefur verið fram á að íslenski þorskstofninn er samsettur úr tveimur aðgreindum
atferlisgerðum sem nota þó sama hrygningarsvæði. Þessar gerðir eru yfirleitt kallaðar
grunnfars- og djúpfarsþorskar og byggist aðgreining á atferli þeirra utan hrygningartíma,
þar sem grunnfarsþorskurinn heldur sig á grunnslóð allan ársins hring á meðan
djúpfarsþorskur flytur sig á dýpri slóðir í hitaskilin austur og vestur af landinu. Megin
markmið þessarar rannsóknar var að bera sama eðlisþyngd eggja þessara tveggja
atferlisgerða til að sjá hvort hún gæti stuðlað að aðgreiningu hópanna. Eggjum var safnað á
hrygningarstöðvum suðvestur af Íslandi í apríl 2010 og 2011. Eðlisþyngd eggja mæld á
degi 2, 3 og 4 eftir frjóvgun sýndi engin merki aðgreiningar milli atferlisgerðanna en
vísbendingar fundust um að egg djúpfarsþorsks væru léttari en egg grunnfarsþorsks á
seinni stigum þroskunar. Þvermál eggjanna var einnig breytilegt milli hópa þar sem egg
djúpfarsþorsks voru stærri en egg grunnfarsþorsks. Þessar niðurstöður sýna áður óþekktan
breytileika í lífsferlum þessara tveggja atferlisgerða og má mögulega eigna
umhverfisþáttum eða erfðum.
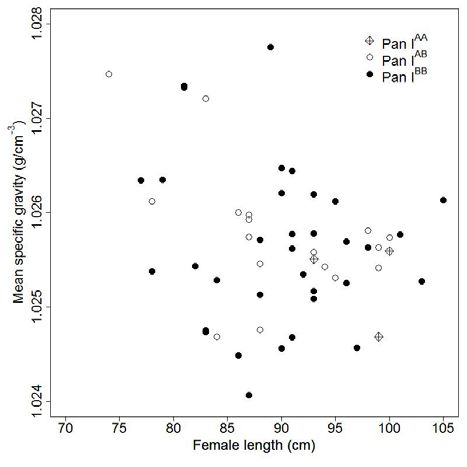
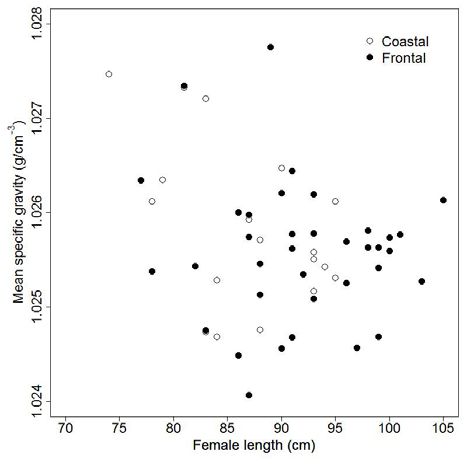
Table of Contents
List of Figures ..................................................................................................................... vi

List of Tables ...................................................................................................................... vii

Abbreviations .................................................................................................................... viii

Acknowledgements ............................................................................................................. ix

1 Background ..................................................................................................................... 1
  1.1 Reproduction ........................................................................................................... 1
  1.2 Types of eggs........................................................................................................... 1
  1.3 Egg structure and oogenesis .................................................................................... 2
  1.4 From fertilization to hatching .................................................................................. 2

2 Introduction ..................................................................................................................... 1

3 Methods............................................................................................................................ 5
  3.1 Sampling at sea ........................................................................................................ 5
  3.2 Egg specific gravity ................................................................................................. 7
  3.3 Egg diameter and chorion thickness ........................................................................ 9
  3.4 Statistical analysis ................................................................................................. 10

4 Results ............................................................................................................................ 13
  4.1 Exploring the data ................................................................................................. 13
  4.2 Egg specific gravity ............................................................................................... 16
  4.3 Egg diameter and chorion...................................................................................... 17
  4.4 Variation during incubation................................................................................... 19
  4.5 Comparison with 1996 data ................................................................................... 22

5 Discussion ...................................................................................................................... 25

Bibliography ....................................................................................................................... 29

Appendix A......................................................................................................................... 35

                                                                   v
List of Figures
Fig. 1. Sampling locations at the main spawning grounds of cod, southwest of
Iceland. The different colours represent the 4 sampling dates: black =
06.04.11, red = 07.04.10, blue = 13.04.10, green = 16.04.11. Note that
two sampling locations from 07.04.10 and two from 16.04.11 overlap. ............ 6
Fig. 2. Equipment set-up for preparing the gradient column. Two glass pipes were
secured in drilled holes in the cap of each flask. Rubber tube was fitted
on the glass pipes, connecting the two flasks and column. The whole
system was made airtight using insulating tape and sealant. A clip was
put on the rubber tube running from the flask to the column so the
waterflow could be stopped at any point. The two flasks, marked A and B,
were placed on a shelf above the empty column; flask B was put on a
magnetic stirrer and flask A adjusted to the same height. ................................. 7
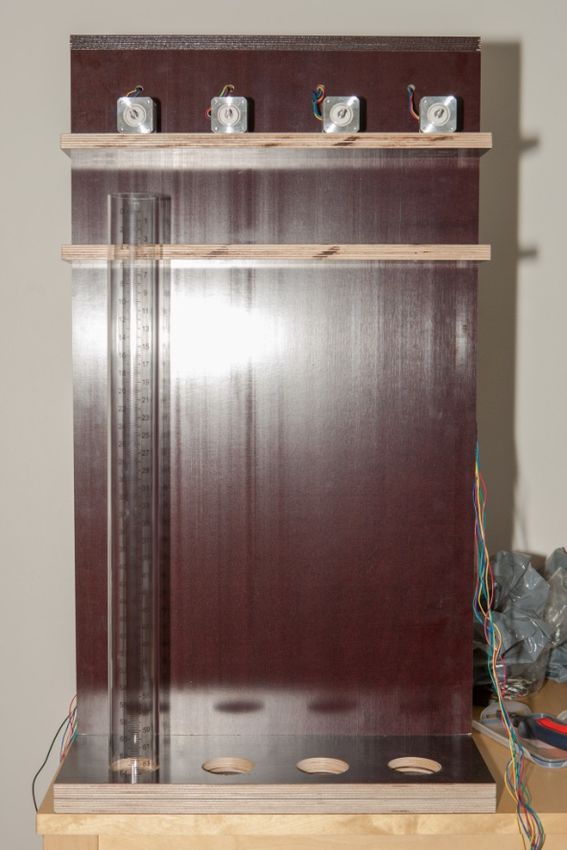
Fig. 3. A set of four new columns (one shown) and motors were built for this
experiment (left). The salinity-gradient was calibrated with colour-coded
calibration floats of known specific gravity, four of which are shown here
emerged in a gradient column (right). ............................................................... 8
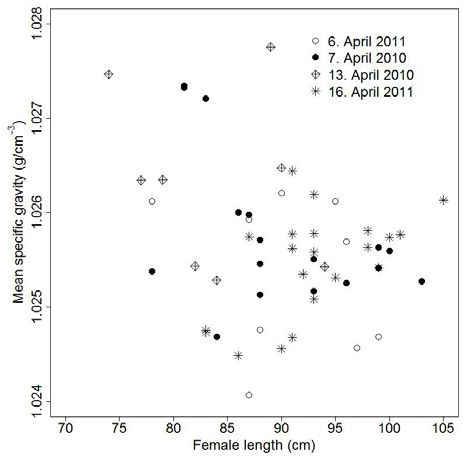
Fig. 4. The relationship between egg specific gravity and female length explored in
relation to female behaviour type, female genotype and sampling date. ......... 14
Fig. 5. Boxplot comparing the egg specific gravity of coastal and frontal fish and a
scatterplot of egg specific gravity against chorion thickness. Shown is the
regression line for the average values of all females in the mixed model........ 16
Fig. 6. Boxplot showing the mean egg diameter of each female in a comparison
between coastal and frontal cod. Scatterplot shows the correlation
between diameter and chorion. ........................................................................ 17
Fig. 7. Boxplot comparing chorion thickness of coastal and frontal fish. .......................... 18
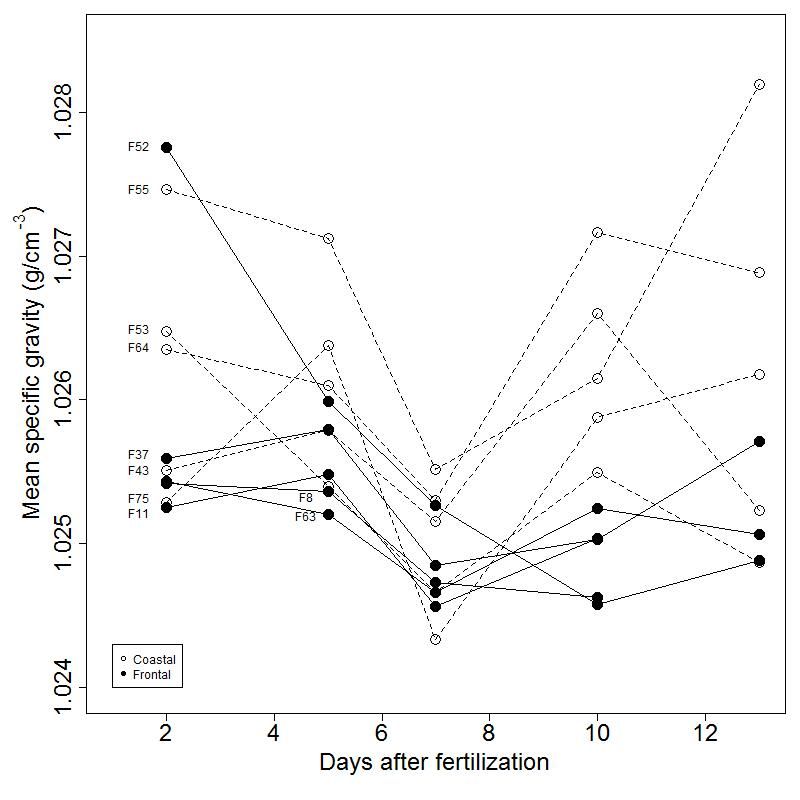
Fig. 8. Specific gravity of the eggs of ten females from fertilization to hatching, empty
circles represent coastal fish while filled circles represent frontal fish.
See appendix 1 for details on each female. ...................................................... 20
Fig. 9 The first two pictures show eggs on day 10 after fertilization. The remainder of
the pictures are taken on day 13 after fertilization (some have begun
hatching). .......................................................................................................... 22
Fig. 10. Comparisons of the 1996 study and the present study. Boxplot compares the
mean specific gravity of the two studies. Scatterplots show specific
gravity against female length and egg diameter in 1996 and 2010/2011.
Regression lines show the positive correlations from 1996. ............................ 23
vi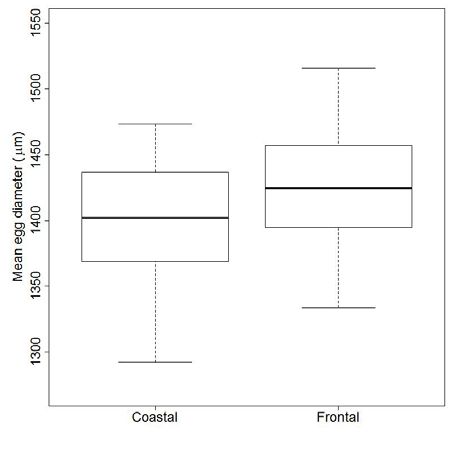
List of Tables
Table 1. Listing of the measurements done at each day after fertilization............................ 9

Table 2. Means (± SD) of female size (length, weight), condition (HSI, K), and egg
          properties (diameter, chorion, specific gravity) of Atlantic cod captured
          southwest of Iceland during April 2010 and 2011. .......................................... 15

Table 3. Coastal and frontal behaviour type comparisons. Frequencies of each
          genotypes for both behaviours. Means (± SD) of female size (length,
          weight) and condition (HSI, K) and means (± SD) of egg properties
          (diameter, chorion, specific gravity). ............................................................... 15

                                                       vii
Abbreviations
HIS = Hepatosomatic index
K = Fulton’s K condition factor
SE = Standard error
SD = Standard deviation
ppt = parts per thousand
ANOVA = Analysis of variance
viiiAcknowledgements
Firstly I thank my advisors. My supervisor, Guðrún Marteinsdóttir, for inspiring me to
pursuit a degree in marine biology in the first place, for providing me with the opportunity
to do so and her guidance along the way. My advisor Timothy B. Grabowski for his help in
getting this project started, teaching me scientific writing and his quick response and
valuable input in the writing of this thesis. My advisor Olav S. Kjesbu for welcoming me at
the Institute of Marine Research in Bergen, broadening my knowledge on egg specific
gravity and help during the writing of this thesis.
Thanks to all my co-workers at MARICE over the years. All of you have provided
inspiration, support and of course good times. Special thanks to: Lisa Anne Libungan who
amongst other things taught me to sample and fertilize eggs, Jónas Páll Jónasson for
helping me strip cod and for both fun and informative conversations, Svavar Örn
Guðmundsson and Klara Jakobsdóttir for their help during sampling, Bruce J. McAdam
and Heidi E. Pardoe for their help with sampling and statistical work, Kai Logemann
valuable discussions on the hydrodynamics of Iceland, Hlynur Bárðarson for analysing the
otoliths acquired in this study and statistical help, Guðni Magnús Eiríksson for his help
during statistical analysis and writing of this thesis and finally Pamela J. Woods for all her
time spent helping me with the statistical analysis and writing. Additional thanks go to
Jóhannes Guðbrandsson and Martin Moersdorf for guiding me on the use of mixed models.
The Marine Research Institute is thanked for their contribution in this project, especially
the guys at the Marine Experimental Station (MES) at Staður in Grindavík: Agnar
Steinarsson, Matthías Oddgeirsson, Kristján Sigurðsson, Njáll Jónsson and Tómas Árnason
for their all their help and advice. The captain and crew of Kristbjörg VE-71 and Friðrik
Sigurðsson ÁR are thanked for their help. Thanks to the Icelandic Research Fund for
supporting this project.
Special thanks to all the great people in Askja’s Cakeclub, your sweetness kept me going.
Finally, my sincerest thanks go to my fiancé, Kjartan Árni Albertsson, who helped me so
much through all my studies and supported me every step of the way.
ix1 Background
1.1 Reproduction
Fishes show a great diversity in their reproduction strategies such as those linked with
sexuality, spawning and parental behavior, response and sensitivity to environmental
factors, and specific features of gametogenesis (Bone and Moore 2008). One element of
these reproductive variations is fertilization. The most common type of reproduction in
fishes is oviparity which is characterized by an external fertilization (Diana 1995).
Viviparous and ovoviviparous fishes both bear live young but differ in terms of egg
development as viviparity has placental development for embryos while ovoviviparity does
not (Diana 1995). Parental care varies dramatically among fishes. The eggs of marine
species that spawn in open water will have virtually no parental care as they drift with the
currents (Diana 1995; Kunz 2004). Apart from these broadcast-spawning species, most
species show some type of egg care characterized as guarding species, external bearers or
internal bearers (Kunz 2004). The number of eggs that a female produces, the fecundity of
the female, increases with her size and age (Bone and Moore 2008; Kunz 2004). The size
of the ovary is limited by the size of the female, requiring high fecundity females to
produce small eggs and vice versa (Bone and Moore 2008). Fecundity tends to be higher in
marine fishes that spawn into open water than in those that exhibit parental care (Bone and
Moore 2008). Some fishes are batch spawners, producing several batches of eggs
throughout the spawning season while others have one-off spawning, spawning all their
eggs at once (Bone and Moore 2008). Egg size tends to decrease throughout the spawning
season in batch spawners (Bone and Moore 2008). Many species exhibit some kind of
migration to spawn. Catadromous fishes spend most of their lives in freshwater but migrate
to the ocean to spawn (Bone and Moore 2008) while anadromous fishes exhibit the
opposite life history strategy, even returning to the exact freshwater stream were they were
born (homing) to spawn (Bone and Moore 2008; Diana 1995). Migration to spawning sites
is believed to facilitate the selection of optimum habitats for eggs and larvae (Diana 1995).
1.2 Types of eggs
The eggs of oviparous marine fishes are classified into three main categories based on their
buoyancy, Δρ, which is defined as the difference in specific gravity between the egg, ρe,
and the ambient water, ρw. so that Δρ = ρw - ρe (Sundby 1991). Pelagic eggs are positively
buoyant, causing them to rise to the surface layer in calm conditions (Solemdal and
Sundby 1981; Sundby 1997; Sundby 1991). The positive buoyancy of pelagic eggs is
achieved through high water levels (83-92%), lipids and oil drops (Craik and Harvey 1987;
Kunz 2004). Bathypelagic eggs have higher specific gravity than the upper mixed layer but
lower than the bottom layer and are often neutrally buoyant in the pycnocline (Sundby
1991). Benthic laid eggs have negative buoyancy as their specific gravity is higher than
that of the bottom layer (Sundby 1991). This high specific gravity is due to their low water
content (60-70%) and small perivitelline spaces (Kunz 2004). Turbulence caused by wind
and currents can however mix all of the three egg types at various depths in the water
1column (Solemdal and Sundby 1981; Sundby 1997; Sundby 1991). This does not apply for all eggs as some will maintain their position through other mechanisms such as being adhered to the substrate or floating vegetation (Kunz 2004). 1.3 Egg structure and oogenesis Most eggs are spherical but other shapes are known such as oval, ovoid, pyriform and even cross-shaped (Helfman et al. 1997; Kunz 2004). Eggs vary considerably in size although a diameter around 1 mm is the most common (Miller and Kendall 2009). Pelagic eggs are usually smaller than demersal eggs (Kunz 2004; Miller and Kendall 2009). The term oogenesis is used to represent the developmental period of eggs and occurs within the ovary (Helfman et al., 1997). Yolk is produced during vitellogenesis which is the last stage in oocyte development (Kunz 2004). It is divided into lipid yolk and proteid yolk, where lipid yolk is present as a varying number of oil droplets (not found in all species) and proteid yolk is the large yolk mass characteristic for teleost eggs (Kunz 2004). These oil droplets may provide the embryo with nutrition, hydrostatic lift and when pigmented may provide protection from radiation (Helfman et al. 1997). The proteid yolk contains the necessary nutrients for embryo development and includes complex carbohydrates, lipids and proteins (Kunz 2004). The cortical alveoli embedded cortex surrounds the yolk. It is made up of two layers, an outer layer bonded by the oolemma and a less dense deeper layer containing organelles (Kunz 2004). The outermost part of the egg is the layered envelope, which plays various parts in egg development (Kunz 2004). The oolemma is the plasma membrane of the egg cell and like previously noted is adjacent to the cortex (Kunz 2004). The layer exterior to the oolemma is the Zona radiate, traditionally referred to as the egg chorion in publications (Kunz 2004). The oocytes swell as a result of a massive influx of water, a process called hydration, which occurs after vitellogenesis but before ovulation (Craik and Harvey 1987). Egg hydration is thought to be the result of loss of phosphorus from yolk protein, rise in potassium and yolk proteolysis (Craik and Harvey 1987; Kunz 2004). When the chorion gets in contact with water it hardens which increases its toughness (Kunz 2004). The chorion is a semipermeable leakage or sieve membrane and it does not prevent uptake of water and minerals (Kunz 2004). 1.4 From fertilization to hatching Fertilization takes place outside of the body in oviparous fishes and occurs when a sperm passes through a funnel-shaped hole called microphyle that sits above the animal pole of the egg (Bone and Moore 2008; Helfman et al. 1997). For most species there is one narrow microphyle which allows only one sperm to enter the egg and thus preventing polyspermy (Bone and Moore 2008; Helfman et al. 1997). This activates the oocyte which resumes development. Upon fertilization the vitelline membrane separates from the chorion forming a perivitelline space (Bone and Moore 2008; Helfman et al. 1997). This is produced by an expansion of the envelope, decrease in the volume of cytoplasm and a cortical reaction where the cortical alveoli are released into the space between the egg envelope and the cytoplasm (Kunz 2004; Miller and Kendall 2009). A net flow of water into the perivitelline space caused by the colloidal material that was released during the cortical reaction takes place at the same time (Kunz 2004; Miller and Kendall 2009). The perivitelline space helps with osmotic regulation of the egg as well as providing additional protection and lubrication (Miller and Kendall 2009). The vitelline membrane is the site of osmoregulation and contains a large number of chloride cells (Bone and Moore 2008). In 2
pursuant to the formation of the perivitelline space, the chorion goes through the process of
hardening; a calcium-dependent process which provides further protection for the egg
(Bone and Moore 2008; Helfman et al. 1997; Kunz 2004).

The eggs of most fishes are telolecithal. This means that cytoplasm is concentrated at the
animal pole of the egg while the yolk is positioned at the vegetative pole (Bone and Moore
2008). This causes the egg to touch the membrane at the vegital half of the egg and the
perivitelline space to surround the cytoplasm (Friðgeirsson 1978). As the yolk contains
more water than the embryo, the eggs float with the vegital half up which might also
protect the blastodisc/blastoderm from direct sunlight (Friðgeirsson 1978; Kunz 2004).
Fishes’ eggs generally exhibit meroblastic pattern of cleavage (Bone and Moore 2008).
Then cells form only at the animal pole of the egg and cleavage does not go through the
entire yolk (Miller and Kendall 2009). Cell division proceeds as normally, a blastodisc is
formed on the yolk, covered by the periblast that metabolizes the yolk for the embryo
(Friðgeirsson 1978; Miller and Kendall 2009). When the zygote reaches the morula stage it
is a solid ball of 32 cells (blastomeres) forming the blastodermal cap. The blastula stage
occurs when the mass of cells begins to flatten and encircle the yolk and the edge of the
cell mass thickens (Miller and Kendall 2009). During gastrulation the three primary germ
layers are formed and consequently the first indications of an embryo can be seen
(Friðgeirsson 1978; Miller and Kendall 2009). Cells will also continue to grow around the
yolk until only a small circle remains (blastopore). By the end of gastrulation neural tube,
notochord, myomeres, brain and optic vesicles are formed and finally the blastopore closes
(Miller and Kendall 2009). Organogenesis follows gastrulation and internal organs are
developed (Friðgeirsson 1978). Heart forms and starts beating, more myomeres are added
and finbuds appear (Miller and Kendall 2009). The tail lifts off the yolk, the body
lengthens and eventually the embryo starts moving inside the egg (Miller and Kendall
2009). At the end of organogenesis hatching cells appear on the head of the embryo that
secrete enzymes that weaken the membrane thus allowing the embryo to hatch
(Friðgeirsson 1978). The hatched larvae may still have a large yolk sac (Helfman et al.
1997). The time from fertilization to hatching varies between species and can depend on
temperature, oxygen and salinity (Miller and Kendall 2009).

                                                                                           3
2 Introduction
The positive link between abundance of early life stages of fish and subsequent year-class
strength, indicates that the drift from spawning sites to nursery habitats might be important
in stock recruitment dynamics (Begg and Marteinsdóttir 2002; Ottersen and Loeng 2000).
The vertical distribution of the eggs in the water column will affect the temperature
regime, hatching conditions, transport and thus survival (Sundby 1991; Vikebø et al.
2005). An important factor affecting egg vertical distribution is egg specific gravity. The
eggs of the Atlantic cod (Gadus morhua) have positive buoyancy which means that they
rise to the surface in calm conditions but spread deeper during higher turbulence, induced
by wind and currents (Solemdal and Sundby 1981; Sundby 1997; Sundby 1991). The
positive specific gravity of pelagic eggs is achieved through very high water content
(>90%) and to some degree through high lipid content, although the function of lipids is
mainly thought to be nutritive. This high water content is the result of a post-vitellogenic
uptake of water during a process called hydration, an osmotic consequence of proteolysis
and influx of potassium and sodium (Craik and Harvey 1987). High water content is then
maintained through the low water permeability of the egg, keeping the egg hyposmotic to
the ambient seawater (Craik and Harvey 1987; Riis-Vestergaard 1984). Cod eggs do not
contain oil drops that can provide the egg hydrostatic lift (Riis-Vestergaard 2002). Amino
acids and salts work to make the egg heavier, but the protein rich chorion surrounding the
egg is the heaviest component (Craik and Harvey 1987; Kjesbu et al. 1992; Mangor-Jensen
1987). Egg size has also been shown to be a decisive factor determining the vertical
distribution of Atlantic cod eggs (Kjesbu et al. 1992; Marteinsdóttir and Begg 2002;
Nissling and Vallin 1996; Vallin and Nissling 2000). Links between egg dispersal and
local hydrodynamics can be achieved through fine-tuned differences in the aforementioned
factors influencing egg specific gravity among species or populations. Such adaptation is
evident in both Baltic cod and Norwegian coastal cod. Altantic cod inhabiting the brackish
water of the Baltic Sea produce lighter eggs with higher water content than their marine
counterparts, which is necessary to keep the eggs above the oxygen deprived layers of
these water masses (Nissling et al. 2002; Nissling and Vallin 1996; Thorsen et al. 1996). It
has been suggested that the fine-scale population structure observed in Norwegian coastal
cod is maintained through egg retention in the fjords where spawning aggregations form.
This retention is achieved through the adjustment of the specific gravity of the eggs to the
local environment. This causes the eggs to have a subsurface vertical distribution and avoid
the surface where their chances of being transported out of the fjord are highest (Knutsen
et al. 2007; Myksvoll et al. 2011; Stenevik et al. 2008).
Generally, the formation and maintenance of intra-stock diversity in terms of
reproductively isolated populations is thought to be less common among broadcast-
spawning marine species compared to those that have a more limited offspring dispersal
patterns. Most marine species release eggs or larvae into the open ocean where they
disperse with currents over large distances into areas that provide either hostile or
favourable nursery conditions (Heath et al. 2008). This widespread dispersal capability is
believed to result in extensive gene flow, thus prohibiting the establishment of fine-scale
population structures (Hauser and Carvalho 2008). However, in recent time, innovative
1genetic approaches and recordings of behaviour with technologically advanced instruments have supplied us with evidence of fine-scale population structure among even the most mobile of species (Conover et al. 2006; Hutchings et al. 2007; Ward 2000). Ocean currents may cause separation through differential transportation of eggs and larvae or through retention close to the spawning sites (Asplin et al. 1999; Cowen et al. 2000; Myksvoll et al. 2011; Stenevik et al. 2008). Likewise, adult behaviour and homing can lead to separation over relatively small geographical scales (Thorrold et al. 2001). Atlantic cod is historically the most important fish stock to Icelandic commercial fisheries. Due to its importance in the Icelandic economy, it has been the main subject of a high number of different types of studies. Several of these indicate the presence of various ecotypes of cod occupying Icelandic waters (see citations below). Otolith shape and chemistry have been shown to effectively discriminate between cod from north and south of Iceland as well as fish spawning below and above 125 m (Jónsdóttir, Campana, & Marteinsdóttir, 2006a, 2006b; Petursdottir, Begg, & Marteinsdóttir, 2006). Likewise, growth and condition have been shown to vary between north and south and by depth (Jónsdóttir et al. 2008). Some of these differences may be attributed to different migration behaviours. Pálsson and Þorsteinsson (2003) reported the findings of different types of foraging strategies among cod occupying the waters southwest of Iceland. By using data storage tags (DSTs) they were able to identify two main behaviours of cod: a) shallow- water migration behaviour, exhibited by fish spending most of their time above 200 m, and b) deep-water migration behaviour of fish spending a considerable amount of time deeper than 200 m. These two behaviours are often referred to as coastal and frontal behaviour and fish exhibiting these distinct migration patterns coastal and frontal fish. Fish morphology, particularly the gap between the caudal and anal fins, has been suggested to be an identification tool for behaviour: migrating frontal cod have bigger fin gaps than the stationary coastal cod (McAdam et al. 2012). Growth, condition and habitat selection by depth have been shown to be connected to the frequency of A and B alleles at the Pan I locus (Jónsdóttir et al. 2001, 2002; Pampoulie et al. 2006; Jónsdóttir et al. 2008). A combined study of DSTs and genetic analyses also revealed a relationship between the genotype of the Pan I locus and behavioural type (Pampoulie et al. 2008). They showed that fish carrying the Pan IAA genotype were more likely to occupy shallow water than fish carrying the Pan IBB genotype, which usually displayed deep-water migration behaviour while the heterozygous fish exhibited both behaviour types. It should be noted that the Pan I locus has been shown to be under natural selection and that a neutral marker is yet to be identified (Pogson and Mesa 2004). The causes behind the observed behavioural differences are uncertain. A recent study on the habitat use of the Icelandic cod suggests that the two behaviour types also stay segregated by depth during spawning, even though they occupy the same spawning grounds (Grabowski et al. 2011). The results of an ongoing study on the otolith shape of fish with DST-data indicate that otolith shape can be a useful tool in discriminating the two behaviour types (Bárðarson, in prep.). In this study both genotype and otolith morphology will be used to distinguish maternal behavioural types and the specific gravity of their eggs compared. The relationships between egg specific gravity and maternal or egg properties will be explored in order to broaden our understanding of how the observed ecotypes of cod may coexist and successfully contribute to recruitment of the stock. As egg specific gravity is affected by female size, age and condition, differences in life histories of the coastal and frontal fish may produce different vertical distributions of eggs (Jónsdóttir et 2
al., 2008; Kjesbu et al., 1992; Marteinsdóttir & Begg, 2002; Nissling, Kryvi, & Vallin,
1994; Vallin & Nissling, 2000). The effects of egg diameter and chorion thickness will be
analysed to determine mechanistic causes for differences in egg specific gravity. This
study will also represent the first analysis of chorion thickness in Icelandic cod eggs. Egg
specific gravity will be recorded throughout development to refine our knowledge of how
egg drift pattern may change throughout development. Finally, the results will be
compared to previous studies, particularly the study by Marteinsdóttir and Begg (2002) on
egg specific gravity of Icelandic cod.

                                                                                          3
3 Methods
3.1 Sampling at sea
Atlantic cod were collected from spawning grounds southwest of Iceland during four
sampling events in 07 and 13 April 2010 and 06 and 16 April 2011 (Fig. 1). The cod used
in this experiment were captured using gillnets deployed from commercial fishing vessels
at various depths (33 – 107 m). Gametes were stripped from fully ripe individuals and
fertilized in vitro onboard the vessel. Eggs from each female were fertilized in 1-L plastic
containers with milt from a single male captured in the same net as the female. The
fertilized eggs from each cross were reared separately throughout the duration of the
experiment. The eggs were kept in 32 ppt water that was frequently changed to ensure
sufficient oxygen levels, and transported to an experimental lab within 12 hours of
fertilization. Parents were tagged for later identification and stored on ice until landing.
In 2010 the egg specific gravity estimates were measured at the Marine Experimental
Station (MES) at Staður in Grindavík, whereas in 2011 they were measured at the
Innovation Center Iceland in Reykjavík. In Grindavík, most of the eggs were kept in 25-L
hatching silos with continuous water supply and maintained at approximately 7.5°C and 32
ppt salinity. As there were not enough hatching silos for the eggs of all females, the
remaining eggs were kept in 1.5-L plastic containers at 6-8°C. The eggs that were reared in
silos were chosen at random to minimize the effects of this difference. In 2011 all eggs
were kept in 1.5-L plastic containers at 5.5 –7.5°C. Water in plastic containers was
changed manually once per day.
The adult cod were processed within 12 hrs of capture following the protocols described by
McAdam et al. (2012). Briefly, total length was measured to the nearest cm, and whole-
body, gutted and liver weights were measured to the nearest g for each individual. A tissue
sample was removed from the gills of each individual and preserved in 95% ethanol.
Tissue samples were sent to an external laboratory (Matís, Reykjavík, Iceland) to be
genotyped at the Pan-I locus following the protocol described by Pampoulie et al. (2006b)
and using the primers described by Nielsen et al. (2007). Fish age was determined by
otolith inspection at the Marine Research Institute in Reykjavik, Iceland. Otolith
morphology analyses were performed at MARICE, University of Iceland following the
methods described by Bárðarson (in prep.) to assign each female to a behavioural type
(coastal or frontal) (Pálsson and Thorsteinsson 2003).
5Fig. 1. Sampling locations at the main spawning grounds of cod, southwest of Iceland. The
different colours represent the 4 sampling dates: black = 06.04.11, red = 07.04.10, green
= 13.04.10, blue = 16.04.11.
63.2 Egg specific gravity
The specific gravity of the eggs was determined using a salinity-gradient column as
described by Coombs (1981). A gradient was prepared using two glass flasks, caps, glass
pipes, rubber tubes, a magnetic stirrer and a graduated glass column (850 mm in length, 50
mm in diameter) closed at one end (Fig. 2). The gradient was established by mixing both
low and high salinity solution in the two flasks, representing the desired span of the salinity
gradient. Flask A contained 1550 ml of approximately 40 ppt solution while flask B
contained 500 ml of approximately 21 ppt solution. The solution from flask B was
siphoned through a long rubber tube, reaching all the way to the bottom of the column. As
the whole system was airtight, the same amount of water was siphoned from flask A to
flask B as was siphoned from flask B to the column. This slowly increased the salinity of
the water flowing into the column, raising the less saline water to the top of the column.
The rubber tube was removed slowly after the column had been filled to avoid disturbing
the gradient.
Fig. 2. Equipment set-up for preparing the gradient column. Two glass pipes were secured
in drilled holes in the cap of each flask. Rubber tube was fitted on the glass pipes,
connecting the two flasks and column. The whole system was made airtight using
insulating tape and sealant. A clip was put on the rubber tube running from the flask to the
column so the waterflow could be stopped at any point. The two flasks, marked A and B,
were placed on a shelf above the empty column; flask B was put on a magnetic stirrer and
flask A adjusted to the same height.
The gradient was calibrated with seven colour-coded calibration floats (Martin Instrument
Co., Ltd., Wednesbury, West Midlands, UK) with known specific gravity ranging from
1.0195 g cm-3 to 1.0278 g cm-3 at 23°C (Fig. 1Fig. 3). As the experiment was done at 5.5 –
8°C the correct densities of the floats at that temperature had to be calculated using the
following formula provided by the manufacturer of the floats:
23 0.000028 Eq. 1
7where ρe is the specific gravity of the float during the experiment, ρ23°C is the given specific gravity of the floats at 23°C and te is the temperature at which the experiment was conducted. The floats were lowered and raised in the column with a basket attached with a nylon thread to a slowly rotating spindle above the column. The low speed of the basket caused only a minimum disturbance of the gradient. The floats positioned themselves in the gradient where their density was matched by that of the fluid around them. The height of each float in the column was documented and later used along with the known density to construct a curve to calculate the specific gravity of the eggs based on their height in the column, read to the nearest mm. The gradient was calibrated at least twice a day or after any disturbance was suspected to have affected it (Fig. 3). Fig. 3. A set of four new columns (one shown) and motors were built for this experiment (left). The salinity-gradient was calibrated with colour-coded calibration floats of known specific gravity, four of which are shown here emerged in a gradient column (right). Eggs from 59 females were measured once on day 2, 3 or 4 after fertilization to generate point estimates of specific gravity (table 1). According to Jung et al. (2012), egg specific gravity changes little until day 4. Still to minimize any effect caused by different measurement days, the females were chosen at random each day. Time constraints resulted in that eggs from four females to be first measured on day 5 after fertilization. A linear mixed-effects model with female ID as a random effect and day as a fixed effect revealed a difference in specific gravity between days 2 and 5 after fertilization. These four females were therefore excluded from all further analysis. Approximately 30 – 60 eggs from a single female were placed in the basket and lowered into the column for each trial. The eggs floated out of the basket and positioned themselves where they were in hydrostatic balance in the established gradient. After the eggs had stabilized, usually after 10 –20 8
minutes, their heights in the column was documented by using the scale on the glass
column (reported to the nearest 0.0001 g cm-3). The height of the egg was always
determined by the same researcher (LÓG) to ensure consistency. The eggs from 10 females
(all sampled in 2010) were used to generate a ‘point measurements’ incubation time series
of specific gravity by measuring them on 2, 5, 7, 10 and 13 day post-fertilization. An
infection rendered all measurements of egg specific gravity made after 5 days post-
fertilization unreliable in the 2011 time series.

Table 1. Listing of the measurements done at each day after fertilization.

             Days after fertilization                  Actions
                        2               17 females measured for point estimates
                                          10 females measured for time series

                        3               20 females measured for point estimates

                        4               22 females measured for point estimates

                        5               4 females measured for point estimates
                                         10 females measured for time series

                        7                 10 females measured for time series

                       10                 10 females measured for time series

                       13                 8 females measured for time series

3.3 Egg diameter and chorion thickness
Samples of eggs from each female were examined and photographed under ca. 10x
magnification with an Evolution LC colour camera (Media Cybernetics, Bethesda,
Maryland, USA) connected to a Leica MZ9.5 binocular microscope (Leica Microsystems,
Wetzlar, Germany) to evaluate egg quality before eggs from the same female were placed
in the salinity gradient. Egg diameter was determined for each female by measuring
approximately 50 eggs from these images using Image J v. X (Abràmoff et al. 2004)

Eggs used for determining chorion thickness were sampled on days 3 – 4 after fertilization,
fixed in 3.6 % formalin buffered with seawater for a minimum of four weeks, and then
placed in fresh water for two weeks. The method used to measure the chorion thickness
was developed by Kyung-Mi Jung (PhD student, University of Bergen, personal
communication, May 2011). The eggs were placed on a wax plate and dried thoroughly
using a paper slip. Using a sharp scalpel, the eggs were halved and placed in a drop of
water where their internal material was removed to make the inner edge of the chorion
                                                                                          9
clear. The two halves of each egg were then placed on a depression slide (well slide) with
the open edge facing upwards in a drop of water mixed with a small amount of detergent
(the brand ‘Zalo’). The soap reduces the surface tension of the water and prevents the
halves from sticking to the water surface, thereby allowing them to settle in the centre of
the well and reducing measurement error due to differential depths in the water drop. The
halves were photographed with a MicroPublisher 5.0 RTV (QImaging, Surrey, Canada)
connected to a Nikon AZ100 confocal microscope (Nikon Instruments Inc., New York,
USA) under a 400× magnification. The microscope was set with the light source
underneath the sample and the exposure regulated, with water in the well of the depression
slide, so that the grey value was 145 ± 2 within a square of 32,400 pixels in the centre of
the picture. The backlit chorion appeared as a clear black circle on the images, so that the
chorion thickness could be measured using ImageJ. Photographs were taken of two
sections of the chorion for each egg and the mean of 10 chorion thickness measurements
were retained for each section. Three eggs from each female were measured to determine
mean chorion thickness per female
3.4 Statistical analysis
Female condition was reflected using the hepatosomatic index (HSI) and Fulton’s K
condition factor (K), calculated as:
100
100
Gutted weight was reported following removal of viscera but not gills. Chorion volume
was calculated with the aid of the standard equation for a volume of sphere:
4
π r r
3
where r1 is the radius of the egg and r2 is the radius of the egg minus the thickness of the
chorion.
An specific gravity to salinity conversion table, provided by the LaMotte Company
(Chestertown, MD, USA), was used to estimate at what salinity the eggs were neutrally
buoyant.
Sampling dates were compared using ANOVA and linear mixed-effect model with female
ID as random effect and sampling day as fixed effect. Variation in egg specific gravity was
presented using linear mixed-effects models and maximum likelihood. The mixed-effects
models were used to account for random variation in egg specific gravity among females
while testing for fixed effects in the models. Female length, age, HSI, K, and behaviour
type along with chorion thickness were included as fixed effects, with interaction between
behaviour type and the aforementioned variables. Length and weight were highly
correlated so weight was excluded from fixed effects. A full mixed effects model was
fitted with all explanatory variables and maximum likelihood tests were performed to
determine whether the fixed effects were significant predictors of egg specific gravity.
10Factors that did not have a statistically significant contribution to the model were dropped
to obtain the optimal model. ANOVA of the optimal model was then used to test for
significant effects of each variable.
The significance of the relationship between egg diameter, egg chorion and maternal
factors was assessed using linear models and following the description above to find the
optimal model. The results of this study were compared to those of the 1996 study of
Marteinsdóttir and Begg (2002). The 1996 dataset was reduced to the same size range of
females as was used in the present study. Mean specific gravity of each female was
calculated for the dataset used in this study to match the 1996 dataset. Egg specific gravity
between the two years was compared using ANOVA. The relationships between egg
specific gravity against female length and egg diameter for the reduced 1996 dataset were
examined using linear regression. All statistical analyses were performed using R v. 2.11.1
(R Development Core Team 2009).
114 Results 4.1 Exploring the data A linear mixed-effects model with female ID as a random effect and day as a fixed effect revealed a difference in specific gravity between days 2 and 5 after fertilization. These four females were therefore excluded from all further analysis. Chorion thickness could not be obtained for two of the 59 females used in this study and one was identified as an outlier and removed. Three females had crystallized otoliths that could not be assigned to a cod behavioural type. The final dataset therefore included 54 females. This study found no difference in egg specific gravity between sampling dates (linear mixed- effect model: P = 0.84) nor did egg diameter vary (ANOVA: P = 0.08). These comparisons were done as egg specific gravity and diameter have been shown to vary with batch number and thus changing throughout spawning (Kjesbu et al. 1992; Kjesbu 1989; Marteinsdóttir and Steinarsson 1998; Nissling et al. 1994). As no difference was detected it was assumed that each sampling date represented a random sample from the spawning aggregation and the data was pooled for further analysis (Fig. 4; Table 1). The otolith method was used to assign behavioural type to each female. It was based on discriminant analysis, which gave the average discriminant score of 92. Both behaviour types were caught on all sampling dates and throughout the sampling range (Table 2). Pan IAB genotype fish was dominant in the coastal behavioural type (53%) while the Pan IBB genotype was dominant in the frontal fish (77%). Only three Pan IAA genotype fish were captured, one was categorized as being coastal while two were assigned to being frontal.
Fig. 4. The relationship between egg specific gravity and female length explored in relation to
female behaviour type, female genotype and sampling date.

14
Table 2. Means (± SD) of female size (length, weight), condition (HSI, K), and egg properties (diameter, chorion, specific gravity) of Atlantic
cod captured southwest of Iceland during April 2010 and 2011.

 Sampling              Coastal/frontal   Depth       Length                                             Diameter      Chorion     Specific gravity
               n                                                 Weight (g)       K         HSI
   date                                   (m)         (cm)                                                (µm)          (µm)          (g/cm3)
 06.04.11      9            4/5          52-68        92±8       6459±2173 0.80±0.08 11.59±2.84         1444±37      6.91±0.78     1.0255±0.008
 07.04.10      17           6/11         33-66       90±8        5648±1550 0.76±0.07      9.25±3.66      1417±51     6.63±0.84     1.0258±0.0008
 13.04.10      8            5/3          96-103      83±7        4341±970     0.73±0.06   8.20±2.80      1426±51     6.85±0.92     1.0263±0.0009
 16.04.11      20           4/16         35-68       93±6        6214±1279 0.76±0.07 10.72±2.46          1401±52     6.77±0.46     1.0255±0.0005

Table 3. Coastal and frontal behaviour type comparisons. Frequencies of each genotypes for both behaviours. Means (± SD) of female size
(length, weight) and condition (HSI, K) and means (± SD) of egg properties (diameter, chorion, specific gravity).

 Behaviour               Pan IAA/ Pan IAB/        Length                                              Diameter      Chorion      Specific gravity
                   n                                          Weight (g)      K           HSI
   type                    Pan IBB (%)             (cm)                                                 (µm)          (µm)           (g/cm3)
  Coastal       19           5/53/42               87±7     5270±1372 0.77±0.07       9.10±3.15       1398±54      6.74±0.95      1.0258±0.008
     Frontal    35            6/21/73             92±7      6086±1685 0.76±0.07 10.53±3.03            1425±46      6.78±0.55     1.0256±0.0007

15
4.2 Egg specific gravity Mean egg specific gravity per female ranged from 1.0241 to 1.0278 g/cm3 which corresponds roughly to a salinity of 29.5 to 34.5 ppt. Linear mixed-effect model with egg chorion thickness and female total length as explanatory variables was the optimal model for egg specific gravity (Specific gravity = 1.031 + 0.0008 × chorion – 0.00003 × length – 0.000006 × diameter, Fig. 5). A highly significant positive relationship was between chorion thickness and egg specific gravity (F1, 50 = 33,920, P < 0.0001). Egg specific gravity decreased significantly with female size (F1, 50 = 7.949, P = 0.01). Egg specific gravity was also found to decrease as the eggs got bigger (F1, 50 = 12.699, P = 0.0008). No difference in egg specific gravity was detected between coastal and frontal fish (P = 0.63; Fig. 5Fig. 5). There was no correlation between female condition, HSI and K, or age and specific gravity (P = 0.16 [HSI], P = 0.13 [K], (P = 0.91 [age]). No interactions were found between behaviour type and the other variables tested (always P > 0.05). Fig. 5. Boxplot comparing the egg specific gravity of coastal and frontal fish. A scatterplot of egg specific gravity against chorion thickness, female length and egg diameter. 16
4.3 Egg diameter and chorion
Egg diameter ranged from 1291.96 to 1515.94 μm. Behaviour type along with chorion
thickness produced the optimal model for egg diameter (Egg diameter = 1177.294 +
32.765 × chorion + 25.356 × behaviour type, r2 = 0.25). Frontal fish was found to produce
larger eggs than coastal fish (F1, 51 = 4.252, P = 0.04; Fig. 6). A significant correlation
between egg diameter and egg chorion thickness was observed (F1, 51 = 15.816, P =
0.0003; Fig. 6). Female length and age did not affect egg diameter (P = 0.59 [length], P =
0.17). As for egg specific gravity was female condition, HSI and K, not found to correlate
with egg diameter (P = 0.47 [HSI]), P = 0.59 [K]) nor was there a significant interaction
between behaviour type and the other explanatory variables (always P > 0.05).

Fig. 6. Boxplot showing the mean egg diameter of each female in a comparison between
coastal and frontal cod. Scatterplot shows the correlation between diameter and chorion.

Egg chorion thickness ranged from 4.472 to 8.162 μm and occupied around 2.0 – 3.4% of
the total egg volume. Chorion thickness did not differ significantly between females of
different behaviour type (P = 0.841; Fig. 7). Chorion did not have a significant relationship
with any of the maternal factors (P = 0.63 [age], P = 0.34 [weight], P = 0.29 [HIS], P =
0.42 [K], P = 0.40 [age]).

17
Fig. 7. Boxplot comparing chorion thickness of coastal and frontal fish.

18
4.4 Variation during incubation
Egg specific gravity changed throughout development for all of the tested females (Fig. 8).
A very high variation in egg specific gravity existed among females on the first and last
day of measurements, ranging 1.0253-1.0278 g/cm3 and 1.0249-1.0282 g/cm3,
respectively. A separation between coastal and frontal females was noticed as development
progressed as coastal females seemed to have heavier eggs than frontal females. This
difference was significant on day 10 after fertilization (t-test, P = 0.006). Changes in egg
specific gravity from fertilization to hatching varied among females, with the biggest
variance for a single female being 0.0032 g/cm3 (F52). With the exception of these females
and two more (F53 and F75), egg specific gravity did not change very much from days 2 to
5 after fertilization. The specific gravity was lowest on day 7 after fertilization for eggs
from eight of the ten females tested. Various trends in specific gravity were observed after
day 7. The mean standard deviation per day after fertilization was less than 0.001 g/cm3. It
was highest on days 10 and 13 after fertilization (0.0009 and 0.0007 g/cm3 respectively).
The eggs of all females hatched, two had already hatched on day 13 fertilization while the
others initiated hatching at day 13 after fertilization (Fig. 9).

19
Fig. 8. Specific gravity of the eggs of ten females from fertilization to hatching, empty
circles represent coastal fish while filled circles represent frontal fish. See appendix 1 for
details on each female.

20
F8    F11

 F37   F43

 F52   F53

21
F55                                           F63

 F64                                           F75

Fig. 9 The first two pictures show eggs on day 10 after fertilization. The remainder of the
pictures are taken on day 13 after fertilization (some have begun hatching).The ID of each
female is given in the upper left corner of each picture.

4.5 Comparison with 1996 data
The results of this study were compared to those of Marteinsdóttir and Begg (2002). The
dataset was reduced to containing the same size range of females as used in the present
study (n = 36). Mean egg specific gravity was higher in the present study than it was in
1996 (1.0247 ± 0.0010 g/cm3 [1996], 1.0257 ± 0.0008 g/cm3 [2010/2011], F1,90 = 25.669,
P < 0.0001; Fig. 10). The positive relationship that Marteinsdóttir and Begg (2002)
reported between egg specific gravity and female length persisted for the reduced data:

Specific gravity = 1.019 + 0.0000655 × length (r2 = 0.34, P = 0.0001, Fig. 10),

as did the positive correlation between specific gravity and egg diameter:

22
Specific gravity = 1.011 + 0.00001 × egg diameter (r2 = 0.35, P = 0.0001, Fig. 10)
1.028
1.027
Mean specific gravity (g cm )
-3
1.026
1.025
1.024
1.023
1996 2010/2011
1.028
1.028
1.027
1.027
Mean specific gravity (g cm )
Mean specific gravity (g cm )
-3
-3
1.026
1.026
1.025
1.025
1.024
1.024
1.023
1.023
1996 1996
2010/2011 2010/2011
70 80 90 100 110 1250 1300 1350 1400 1450
Female length (cm) Mean egg diameter (m)
Fig. 10. Comparisons of the 1996 study and the present study. Boxplot compares the mean
specific gravity of the two studies. Scatterplots show specific gravity against female length
and egg diameter in 1996 and 2010/2011. Regression lines show the positive correlations
from 1996.
235 Discussion This is the first study that attempts to compare phenotypic egg traits, such as egg specific gravity, that may influence the vertical position of the eggs and larvae in the water column and consequently means of dispersal between the two behaviour types of Icelandic cod. Point estimates of egg specific gravity, obtained from the first third of development, showed no difference between coastal and frontal cod. Measurements taken throughout development however revealed that coastal females tended to have heavier eggs than frontal females during the last third of development. Egg diameter varied significantly between the two behaviour groups with frontal fish producing larger eggs than coastal. This suggests that there is a difference in the eggs of the two behaviour groups, which might be the result of the different habitats these two groups occupy outside of spawning or an underlying genetic difference. The Icelandic cod stock contains individuals that exhibit “frontal” or “coastal” behaviour. The discrimination between these two types is based on habitat choice during foraging, whereby the frontal migrate into deep waters and practise vertical migrations over thermal fronts during most part of the year while the coastal cod remain in relatively shallow water throughout the year (Jónsdóttir et al. 2008; Jónsdóttir et al. 2006b; Pampoulie et al. 2008; Pampoulie et al. 2006; Pálsson and Thorsteinsson 2003). Point estimates of egg specific gravity, measured on days 2, 3 and 4 after fertilization, showed no difference between frontal and coastal cod spawning southwest of Iceland. Indications of a difference between the two behaviour groups was however revealed during the last third of development as the eggs of coastal females tended to have higher specific gravity than those of frontal females. This difference was significant on day 10 after fertilization. The eggs of two frontal females had already hatched by day 13. The lack of significant difference between the eggs of coastal and frontal females on day 13 might be attributed to the two missing values. Egg diameter was also found to vary between behaviour groups as the eggs produced by frontal cod were larger than those of their coastal dwelling counterparts. This is in keeping to frontal fish producing somewhat lighter eggs as a negative relationship between egg diameter and egg specific gravity was found. These results indicate that there is a difference in the eggs of the two groups. This variation might be the result of the different life histories of the two groups such as difference in ambient temperature or food resources. This might however also be the result of an underlying genetic variation. The eggs were neutrally buoyant at approximately 29.5-34.5 ppt. In 2010 and 2011 the salinity in the sampling locations was in the range of 34.3 – 35.2 ppt at depths 0-100 meters with the exception of one measurement at 2 meters depth in 2011 where the salinity was 31.5 ppt (http://www.hafro.is/Sjora/). This means that all the eggs are pelagic and that most will float to the surface layers in calm conditions although wind and waves can rapidly mix the eggs down to greater depths (Solemdal and Sundby 1981; Sundby 1991). The suggested variation in egg specific gravity between coastal and frontal fish during the later stages of development will therefore probably not suffice to separate the eggs of the two groups. This indicates that the planktonic life history stages can mix and drift together to shared nursery grounds making it unlikely that the vertical distribution of the eggs is 25
You can also read