Implementation and status of priority measures to reduce nitrogen and phosphorus leakage - REPORT
←
→
Page content transcription
If your browser does not render page correctly, please read the page content below
REPORT

Implementation and status of priority
measures to reduce nitrogen and
phosphorus leakage
Summary of Country Reports

Baltic Compass, Work Package 3
Editors: Eva Salomon and Martin Sundberg, JTI
                                                April 2012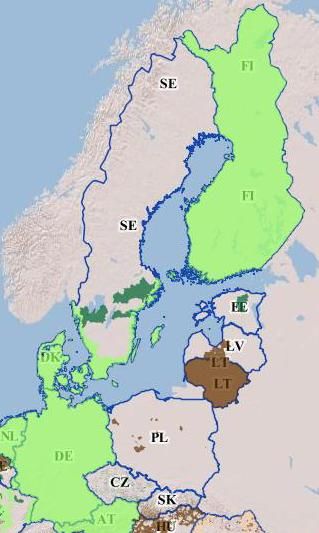
Contents
Introduction ....................................................................................................................... 3
     Nitrate vulnerable zones ............................................................................................ 4

Materials ........................................................................................................................... 5
   Biosecurity ................................................................................................................. 5

Method .............................................................................................................................. 6
   Process for setting up the „List of priority measures‟ for reducing nitrogen and
   phosphorus leaching (BAT list). ................................................................................ 6
   Templates for country reports .................................................................................... 7
   Biosecurity ................................................................................................................. 8

Country-specific comments on country reports ................................................................ 9
Summary of results in national country reports .............................................................. 10
   Measures with official goals, regulated in legislation or economically subsidised . 10
   Applicable and important measures ......................................................................... 11
   Measures implemented in most countries ................................................................ 13
   Measures implemented in only a few countries....................................................... 14
   Estimated characteristics of measures ..................................................................... 19

Summary tables on national country reports .................................................................. 23
    Reading instructions for tables ................................................................................ 23
    1. Promoting long-term grass cultivation on arable land ......................................... 24
    2. Vegetative cover in autumn and winter on arable land ....................................... 24
    3. Soil tillage management....................................................................................... 24
    4. Fertilisation management ..................................................................................... 25
    5. Improved spreading technology for manure and chemical fertilisers .................. 27
    6. Avoiding the application of chemical fertilisers and manure to high-risk areas . 29
    7. Measures to optimise soil pH and improve soil structure .................................... 29
    8. Adapted feeding ................................................................................................... 29
    9. Reducing ammonia losses in animal houses ........................................................ 31
    10. Storage of manure .............................................................................................. 31
    11. Constructed wetlands for nutrient reduction/retention ...................................... 32
    12. Buffer zones along water areas and erosion-sensitive field areas ..................... 33
References ....................................................................................................................... 34
3

Introduction
The partners in Work Package 3 (WP3) in the Baltic Compass project have together
identified a list of 25 priority agricultural measures that can be used to reduce
nitrogen and phosphorus leakage. Most of these measures can be found in country-
specific regulations and some are eligible for economic subsidies.
All participating countries in Baltic Compass have used these measures in the
production of individual country reports entitled „Implementation and Status of
Priority Measures‟. This report is a summary of all country reports, and describes the
situation in September 2011. All individual country reports can be downloaded from
www.balticcompass.org.
The objectives with producing national country reports were to:
       Establish a common understanding of differences and similarities between
       countries in how the priority measures have been implemented.
       Produce a summary for authorities, agricultural and advisory organisations of
       the current situation concerning implementation of measures.

The following partners in Baltic Compass, Work Package 3, produced individual
country reports and contributed to this summary report:
       JTI – Swedish Institute of Agricultural and Environmental Engineering,
       Sweden (Work Package leader.)
       ITP – The Institute of Technology and Natural Sciences in Falenty, Poland
       LAAS – Lithuanian Agricultural Advisory Service, Lithuania
       LLUR – State Agency for Agriculture, Environment and Rural Areas in
       Schleswig-Holstein, Germany
       MTT – Agrifood Research Finland, Finland
       RUE – Scientific and Practical Center of the National Academy of Sciences
       of Belarus for Agricultural Mechanization, Belarus
       SJV – Swedish Board of Agriculture, Sweden
       ZSA – Latvian Union Farmers Parliament, Latvia

Country reports for Denmark and Estonia were provided by:
       Knowledge Centre for Agriculture, Denmark
       Ministry of Agriculture Agri-Environment Bureau, Estonia

It was not part of the original plan to include biosecurity measures in this specific
report. The main biosecurity activity „Establishing connection with water protection
and biosecurity considerations to provide additional inputs for measures, investments
and integration of policies‟ is placed in WP5 (Task 4). However, we saw an
advantage in presenting the results for pathogen leakage (biosecurity considerations)
4
together with nitrogen and phosphorus leakage as a way to obtain a better overview
of the potential of each measure already at this stage, relating to sub-activity 5.4.2
„Identify single on-farm measures which combine mitigation of nutrient losses and
health risks‟.
Biosecurity aspects in this report were provided by:
SLU – Swedish University of Agricultural Sciences, Department of
Biomedical Sciences and Veterinary Public Health, Sweden
Nitrate vulnerable zones
According to the EU Nitrate Directive, Member States in the EU have designated
territories draining into waters that are, or could be, affected by high nitrate levels or
eutrophication as vulnerable zones. Austria, Denmark, Finland, Germany, Ireland,
Lithuania, Luxembourg, Malta, the Netherlands and Slovenia have decided to
provide the same level of protection to their whole territory, rather than designate
nitrate vulnerable zones. Figure 1 shows designated nitrate vulnerable zones as
submitted by Member States around the Baltic Sea for monitoring progress of
implementation of the Nitrate Directive (Council Directive 91/676/EEC of 12
December 1991 concerning the protection of waters against pollution caused by
nitrates from agricultural sources). Member States are required to review, and if
necessary revise, nitrate vulnerable zones at least every four years.
Source: EUROPEAN COMMISSION
JOINT RESEARCH CENTRE
Institute for Environment &
Sustainability Rural, Water and
Ecosystem Resources Unit
http://fate.jrc.ec.europa.eu/elisa-viewer
Figure 1. Nitrate vulnerable zones in Member States around the Baltic Sea.5 Materials The basis of all country reports and of this summary report is a list of 25 priority measures, including a general definition of each measure. The 25 measures were selected by the representatives from each participating country in WP3. Each country report presents national data for those measures that are relevant in that country. A country-specific definition of a measure is also included in the country reports when relevant. Furthermore, countries were able to add new country-specific measures not on the original list. Biosecurity The term biosecurity is used widely and usage varies between sectors and countries. The Food and Agricultural Organization of the United Nations (FAO) has a wide definition of biosecurity as: “…a strategic and integrated approach that encompasses the policy and regulatory frameworks (including instruments and activities) that analyse and manage risks in the sectors of food safety, animal life and health, and plant life and health, including associated environmental risk. Biosecurity covers the introduction of plant pests, animal pests and diseases, and zoonoses, the introduction and release of genetically modified organisms (GMOs) and their products, and the introduction and management of invasive alien species and genotypes. Biosecurity is a holistic concept of direct relevance to the sustainability of agriculture, food safety, and the protection of the environment, including biodiversity.” (www.fao.org). However, reference to biosecurity considerations in this report is made with the focus on leakage of manure from the farm, e.g. transmission of infectious disease agents to the environment via manure run-off, and pathogens transmitted faecally-orally. Zoonoses can be transmitted from animals to humans, for example via the food chain and in contact with contaminated water. They include Salmonella spp., Campylobacter jejuni, Verotoxin-producing Escherichia coli (VTEC, EHEC), Cryptosporidium parvum and Hepatitis E virus. Animal pathogens (pests) spread faecally-orally can potentially be transmitted via water. However, this has not been investigated to the same extent as for waterborne human diseases. Animal-to-animal transmission is probably more significant, but water has been shown to act as a vector for Salmonella spp. and VTEC transmission between herds in Sweden (Arosenius, 2011; Lahti et al., 2010). Another pathogen that can potentially be transmitted via water is Mycobacterium paratuberculosis. Antibiotic resistance. Many antibiotics used in veterinary medicine are only partially metabolised by treated animals and enter the environment with manure application. However, the substances are diluted by that stage. A more important input is that of already resistant bacteria shed by the treated animals (Kummerer, 2004), since this brings the risk not only of transmission of pathogens, but also of the normal microbiota becoming resistant and thereby further able to transmit genes encoding for resistance. Faecal indicators (e.g. E. coli and faecal enterococci) are part of the normal microbiota in mammals and are used in water management as markers of faecal pollution and therefore health risks. The indicators are, in general, not pathogenic but can gain virulence factors (toxins, adherence proteins, resistance etc.) by horizontal gene transfer and spontaneous mutation (Kelly et al., 2009; Muniesa et al., 2006).
6

They can also carry genes and plasmids coding for antibiotic resistance, which can
be transmitted to closely related pathogens (Wiedenbeck and Cohan, 2011). Another
rationale for discussing faecal indicators and their transmission via manure is that E.
coli and enterococci are mentioned in various guidelines such as the Bathing Water
and Drinking Water Directives (2006/7/EC and 98/83/EC respectively) and manure
run-off may prevent Member States from achieving compliance with these.

Method
Process for setting up the ‘List of priority measures’ for reducing
nitrogen and phosphorus leaching (BAT list).
Based on Swedish guidelines (SJV, 2008), JTI initially drew up a list of 41 relevant
measures in short titles. In October 2010, the other WP3 partners were asked to
supplement this list with national established measures regarded as relevant for
reduction of nitrogen and phosphorus leaching. Partners were also requested to
indicate on the list whether each measure was regulated in legislation and/or eligible
for economic subsidies. This resulted in a total of 71 measures being included on the
list. At a WP3 meeting in Helsinki in November 2010, all measures on the list were
discussed and classified as either B (Back to list), N (Not on list) or I (Innovative).
This process resulted in a reduced list of 25 selected priority measures, where some
of the individual measures regarded as related were merged together. An additional
11 measures were classified as innovative (I) and were placed on a separate list,
which is not presented here.
The selected priority measures are listed in abbreviated form below with the
numeration used.
1. Promoting long-term grass cultivation on arable land
2. Vegetative cover in autumn and winter on arable land
3. Soil tillage management
     3.1. Reducing soil tillage
     3.2 Time of the year effects
4. Fertilisation management
     4.1. Adapting the amounts of chemical fertiliser and manure applied
     4.2. Calculating nutrient balances on farm and/or field level
     4.3. Avoiding the spreading of chemical fertilisers and manure during high-risk periods
     4.4. No or reduced phosphorus fertiliser for high soil phosphorus fields or part of fields
5. Improved spreading technology for manure and chemical fertilisers
     5.1 Site-specific dosage
     5.2 Combi-drilling
     5.3 Incorporation
     5.4 Liquid manure
     5.5 Solid manure
     5.6 Manure spreading and ammonia emissions – general measures
6. Avoiding the application of chemical fertilisers and manure to high-risk areas
7. Measures to optimise soil pH and improve soil structure
8. Adapted feeding
     8.1 Adopting phase feeding of livestock
     8.2 Reducing dietary nitrogen and phosphorus intake
     8.3 Phytase supplementation
     8.4 Wet feed and fermentation
7
9. Reducing ammonia losses in animal houses
10. Storage of manure
11. Constructed wetlands for nutrient reduction/retention
11.1 Sedimentation ponds
11.2 Constructed wetlands
12. Buffer zones along water areas and erosion-sensitive field areas
A brief description of each of the 25 priority measures was then created in order to
establish a distinct definition. The list, with a set of descriptions, was sent out for
comments in February 2011 and thereafter revised. The descriptions provided can be
found in the Summary Tables section at the end of this report.
Templates for country reports
In order to facilitate mapping the implementation status of measures in the partner
countries, a template for the country report was developed and discussed at a meeting
in Riga in February 2011. After some modifications and improvements, the template
was sent out to partners on 3 March 2011. In the template, definitions of all 25
priority measures were given. In connection with each measure, the partners were
asked to provide information within the standard format shown below. The
individual country reports were discussed during meetings in Minsk (June) and
Stockholm (November) and during this time gradually revised and improved.
Describe this measure in your country if different :
1. Is there any official quantified goal that states to what extent this measure should be implemented?
If "Yes";
a) specify quantity and unit:
b) if applicable, what year to be realized?
c) give reference(s):
If "No", what is your expert opinion of the desirable level in 5 years?
quantity and unit:
2. To what extent is this measure implemented today in relation to goal set above?
"0"=Not at all; "10"=Goal already reached
3. If goal is not reached; how do you judge the possibilities to fulfill it?
"0"=Impossible; "10"=Very good
Comments:
Comments on why the goal is easy/difficult to reach, what are the most important parameters in your country:
Is this measure regulated in legislation? If “Yes”; national or regional rules
Reference(s) to legislation:
Comments:
Is this measure entitled to economic subsidy? If “Yes”; national or regional subsidy rules
Reference(s) to subsidy rules:
Comments:8 During the meeting in Minsk in June 2011, a proposal was made to gather additional information regarding the economic conditions for implementation of the priority measures. An economic appendix to the main country report was therefore constructed and sent out on 15 September 2011. This template also had a standard format to provide the information, see below. Is this measure applicable in your country? If “No”; please motivate why Comments: Is this measure important in order to reach country-specific environmental goals? If “No”; please motivate why Comments: Is this measure entitled to economic subsidy? If “Yes”; national or regional subsidy rules Reference(s) to subsidy rules: If “Yes”, please continue below. If “No”, go to next measure! What is the economic subsidy-level based on? I.e. land value, cost for measure, loss of profit, value for society, cost for construction? Comments: To what extent is the farmers cost for implementation subsidized in Rural Development Programme (RDP): or/and other national program: ? Comments: Is the economic subsidy followed by any obligations? For example; is it a commitment for a specific number of years, or is it a yearly engagement? Are there commitments regarding maintenance? Comments: It should be borne in mind when reading this report that as no economic subsidies are available in Belarus, that country chose not to complete the economic appendix. As Denmark and Estonia are not partners in WP3, suitable organisations in these countries were identified and contacted in December 2011 for supplementary information using the same templates. In Denmark the information was provided by the Knowledge Centre for Agriculture and in Estonia by the Ministry of Agriculture Agri-Environment Bureau. The templates were deliberately constructed to include as many questions as possible, with a Yes/No or grading answer. This is because such questions are easy to compile in tables or graphs, which are convenient to use for comparisons between countries. For more detailed information concerning different aspects of implementation of the priority measures in the countries, see the complete versions of the individual country reports, which are available at the Baltic Compass website www.balticcompass.org. Biosecurity Since biosecurity was not planned to be part of the report, pathogen leakage was assessed on the reduced list of 25 priority measures. This assessment was performed through expert judgments and a literature review. In an initial meeting the measures were judged on how and in what way they could affect biosecurity. Then each measure was judged by reading relevant literature. At a second meeting the effect of each measure was graded after a joint discussion.
9

Each measure was graded according to how, if implemented, it could have an effect
on pathogen leakage from manure (Table 1). In the section „Estimated characteristics
of measures‟, the gradings for biosecurity considerations regarding each measure are
presented with comments.
Table 1. Gradings used for biosecurity

Grade       Effect on biosecurity
0           No effect on biosecurity
(+)         Can have an effect or an indirect effect (depends)
+           Has an effect
++          Will reduce the risk of pathogen leakage significantly

Country-specific comments on country reports
Finland
The Nitrate Directive and the Environmental Protection Act determine the baseline
practices for agricultural production in Finland. According to these items of
legislation, farms must follow cross-compliance rules in order to obtain the single
farm payment. In addition to CAP subsidies, almost all farms belong to the agri-
environmental subsidy scheme, where they must first fulfil measures common for all
participating farms and then select a few alternative measures according to the region
and production system of the farm.
Germany
The information given in the country report for Germany refers to the Federal State
of Schleswig-Holstein.
In Schleswig-Holstein, several of the measures on the list are defined in an explicit
way in regulations and directives, for example measures 2, 4, 6, 7, 10 and 12. Most
of these measures are regulated in legislation without subsidies; a few of them are
voluntary and eligible for subsidies (measures 2 and 12).
Some of the measures on the list are not explicitly defined and are not eligible for
subsidies in Schleswig-Holstein. For this reason, the answers given in the relevant
section of the questionnaire were „No‟ or „No answer‟ (especially measures 3 and 5).
These measures are an integral part of the Code of Good Agricultural Practice – a
comprehensive collection of practical advice, recommendations and legislation
covering the main fields of agricultural activity, which is applicable on a voluntary
basis in the whole territory of Germany. The fact that these measures are not defined
in a concrete way in regulations or Regional Development Programmes does not
necessarily mean that they are not known or practised by farmers in Schleswig-
Holstein.
More information about Good Agricultural Practice and water monitoring results can
be found e.g. in the Nitrates Report: http://www.bmu.de/files/english/pdf/application/
pdf/nitrates_report_2008_en.pdf
10

Summary of results in national country reports

Measures with official goals, regulated in legislation or economically
subsidised
The relative proportions of the 25 measures that had a national official goal, were
regulated in legislation, or were eligible for economic subsidies are summarised for
each country in Table 2.
Table 2. Number of measures for each country that have official goals, regulated in
legislation or economically subsidised. For country abbreviations see Summary Tables
section

Num. of measures with:      BY   DK   EE        FI   DE   LV   LT   PL   SE
Official goal               11   15    6        13    7   11    6    3    13
Legislation                 12   17    9         6   10   10    6   13    12
Econ. subsidy                0    3   15        15    3   12   10    3    11
Off. goal & legisl.         10   14    3         5    7   10    6    3     6
Off. goal & econ. subsidy    0    3    6        12    0    7    3    2     7
Legisl. & econ. subsidy      0    3    6         5    3    6    3    3     5

An official goal can be a tool to evaluate the degree of implementation of a measure
during a certain time period. At the time of the survey, around half the measures had
official national goals in Belarus, Denmark, Finland, Latvia and Sweden, while a
minor proportion of the 25 measures had official national goals in Estonia, Germany,
Lithuania and Poland. Denmark had most of the 25 measures regulated by
legislation. In Estonia and Finland the majority of the measures were economically
subsidised. In Latvia and Lithuania, all measures that were regulated in legislation
(10 and 6, respectively) also had official goals. In Denmark the same 3 measures that
were economically subsidised also had official goals.
All countries except Belarus had measures that were both regulated in law and
economically subsidised. One reason for this is that countries can have legislation
that regulates the measure on both national and regional level, where the regional
level put more extensive demands on implementation. In such cases, economic
subsidies can be a tool to support implementation.
The countries differed in the strategy they used to implement measures, as illustrated
in Figure 2. Denmark, Finland and Sweden all had official goals for a major
proportion of the measures, but Finland to a high degree used economic subsidies for
implementation, while Denmark used legislation. Sweden occupied an intermediate
position, with a mix of legislation and economic subsidies. This demonstrates that
while Finland, Denmark and Sweden have chosen to work with official goals for the
majority of the measures on the list, the countries differ in the implementation
strategy.
11

                                    Percentage of measures with official goal that are ….
                                          Figures within brackets indicate number of measures with official goal
                          100
                                                   FI (13)

                           80
                                                                      EE (6)
                                                                                                                          PL (3)
economically subsidised

                                                                                                          LV (11)
                           60
                                                          SE (13)
                                                                                                                       LT (6)
                           40

                                                                                                             DK (15)
                           20

                                                                                                             BY (11)     DE (7)
                            0
                                0        20                  40                    60                   80                  100
                                                         regulated in legislation

Figure 2. Percentage of measures with official goals that are regulated in legislation (x-axis)
and economically subsidised (y-axis).

Applicable and important measures
The outcome of each country‟s judgments of applicability and the importance of the
25 measures are summarised in Figures 3 and 4. The participants had a broad
definition of what is an applicable measure. In general, it was defined as what is
regulated in legislation and/or economically subsidised and what is also commonly
used today in agriculture. The participants also had a broad definition of what is an
important measure. In general, it was defined as what is regulated in legislation
and/or economically subsidised, and also where there is a common agreement that
the measure can decrease nitrogen and phosphorus losses to waters. Many
participants found it difficult to make a judgment and also to make separate
judgments of applicability and importance, as they did not fully grasp the difference.
However, the uncertainty did not include all measures, indicating that some measures
were particularly difficult to judge. The proportion of the 25 measures that were
difficult to judge and for which no answer was filled in is indicated in Figures 3 and
4. Only Sweden had some measures with no answer concerning applicability.
Concerning importance, Germany had no answer on about 75% of the measures.
In Finland and Sweden, almost 100% of the 25 measures were judged to be
applicable, followed by Denmark and Estonia with about 60%, Germany, Latvia and
Lithuania with about 40% and Poland with 20%. A comment made by several
countries was that a measure was judged to be not applicable when the costs for the
measure were too heavy a burden for the farmer. The capacity for making
investments on the farm can be one explanation for the difference between countries
in the proportion of measures judged to be applicable. The judgment of importance
for each country gave a different picture than the judgment of applicability. Finland,
Germany and Sweden judged a smaller amount of the 25 measures to be important
than applicable. A possible interpretation is that those countries have used some
measures for which there is uncertainty about their efficiency in reducing nitrogen
12
and phosphorus losses. Denmark, Estonia and Poland judged a larger amount of the
25 measures to be important than applicable. A possible interpretation of this is that
these countries have identified some measures where there is a common agreement
on their efficiency in reducing nitrogen and phosphorus losses, but due to country-
specific conditions they are not commonly used in agriculture. Lithuania had equal
proportions of measures judged to be applicable and important.
Applicable measures
100% No answer
No
80% Yes
60%
40%
20%
0%
DK EE FI DE LV LT PL SE
Figure 3. Percentage of the 25 measures on the list judged to be applicable in each country.
Yes = measure applicable, No = measure not applicable, No answer = No judgement.
Important measures
100%
No answer
No
80% Yes
60%
40%
20%
0%
DK EE FI DE LV LT PL SE
Figure 4. Percentage of the 25 measures on the list judged to be important in each country.
Yes = measure important, No = measure not important, No answer = No judgement.13 Measures implemented in most countries The number of countries where a measure has been implemented with legislation and/or economic subsidy is shown in Figure 5. It can be seen that seven countries have formulated official goals concerning the measures: 2. „Vegetative cover in autumn and winter on arable land‟ and 6. „Avoiding the application of chemical fertilisers and manure to high-risk areas‟. Measure 2 includes a quantification of goal targeting in many countries, but is formulated differently between countries. The quantification of goals can also differ between regions within the country. For example, quantification of a goal can be the area occupied by winter crops, where the definition of what is an approved winter crop differs between countries. Several crops are defined as winter crops in each country, with both annual crops and perennial crops occurring. At the time of survey, Denmark, Finland, Poland and Sweden had quantified goals concerning catch crops. Quantification of a goal can also include a certain area with reduced/no tillage outside the growing period. Measure 6 includes a goal in most countries. The reason is probably that this measure is strictly regulated by law in all countries, so implementation is expected to be 100%. Two additional measures are regulated in legislation in all countries, namely 4.3 „Avoiding the spreading of chemical fertilisers and manure during high-risk periods‟ and 10 „Storage of manure‟. The reason why all countries have legislation concerning these three measures may be consensus about the major impact of these measures on reducing nitrogen and phosphorus losses from agriculture. How feasible these measures are for each country to implement can partly be understood by reading the comments in the national country reports. One example is the range of comments given concerning measure 10. Lithuania commented that farmers do not want to invest in manure storage facilities, Germany and Denmark saw no difficulties in implementing measure 10 as it is regulated in legislation and Poland anticipated difficulties related to investment costs for the farmer. Thus, some countries still identified barriers to implementation of storage capacity for manure, although legislation requiring this exists. The two measures for which seven countries had economic subsidies are 2. „Vegetative cover in autumn and winter on arable land‟ and 12. „Buffer zones along water areas and erosion-sensitive field areas‟. However, the degree of compensation differed between countries, see Summary Tables for details. For measure 2, Estonia, Germany and Poland compensated farmers‟ costs for implementation by less than 100%, Lithuania and Sweden provided 100% compensation and Finland and Latvia compensated farmers‟ costs by more than 100%. For measure 12, Germany, Latvia, Lithuania and Poland compensated farmers‟ costs by less than 100%, Sweden by 100% and Finland by more than 100%. The numbers of countries in which a measure has been judged applicable and important, respectively, are shown in Figure 6. It should be emphasised that as Belarus did not complete the economic appendix template, the maximum number of countries in this figure is eight. The three measures that all these eight countries judged to be applicable were 2. „Vegetative cover in autumn and winter on arable land‟, 4.3 „Avoiding the spreading of chemical fertilisers and manure during high- risk periods‟ and 10 „Storage of manure‟. Measures 4.3 and 10 were also among the measures which all countries regulated in legislation. Measure 2 was one of the two measures for which most countries had economic subsidies. The same three measures, i.e. number 2, 4.3 and 10, were judged by the eight countries to be
14

important, as was measure 4.1 „Adapting the amounts of chemical fertilisers and
manure applied‟.

Top five measures
There seems to be a good agreement between countries on which measures have a
significant effect on reducing nitrogen and phosphorus losses, and thus most
countries use the tools legislation and/or economic subsidies to implement these
measures. The top five measures were:
    2. Vegetative cover in autumn and winter on arable land
    4.3. Avoiding the spreading of chemical fertilisers and manure during high-risk
    periods
    6. Avoiding the application of chemical fertilisers and manure to high-risk areas
    10. Storage of manure
    12. Buffer zones along water areas and erosion-sensitive field areas
Measures 4.3, 6, 10 and 12 were also judged to be measures that will reduce
pathogen leakage significantly, see Figure 7. Thus, measures on the top five list are
highly relevant to implement at farm level to reduce nitrogen and phosphorus
leaching losses and to improve biosecurity.
Future work should focus on developing tools that are adapted to country-specific
conditions and result in a fast and efficient implementation of these measures in
agricultural practices. The efficiency of the measures is highly dependent on
management, which highlights the importance of tools for knowledge transfer to
farmers. Tools to evaluate the implications for agricultural practices are also needed
in order to quantify the nitrogen and phosphorus reduction capacity and the
improvement in biosecurity.

Measures implemented in only a few countries
As Figure 5 shows, some measures were rarely implemented by legislation and/or
economic subsidies in any country at all and did not have official goals.

Adapted feeding
The measures 8.1 „Adopting phase feeding of livestock‟, 8.2 „Reducing dietary
nitrogen and phosphorus intake‟, 8.3 „Phytase supplementation‟ and 8.4 „Wet feed
and fermentation‟ have been implemented in two countries. Denmark is the one
country that has legislation concerning 8.2 and 8.3. Sweden has legislation
concerning 8.3. Both Danish and Swedish legislation relies on present knowledge
concerning the effect of feed utilisation by animals on the amounts of nitrogen and
phosphorus excreted in faeces and urine. In Denmark, phosphorus for animal feeding
is taxed by 4 Danish crowns per kg, resulting in phytase being used in feed to save
money on phosphate. Denmark also commented that when farmers get new
environmental approval, reducing dietary nitrogen and phosphorus intake is part of
Best Available Techniques. Sweden permits a higher animal density per hectare if
phytase is included in feed for laying hens and pullets.
The reason why few countries have implemented these measures seems not to be
lack of knowledge concerning efficient feed utilisation of nitrogen and phosphorus,
but other reasons. One reason can be lack of country-specific statistics. Sweden
commented that the use of phytase supplementation is unknown and therefore no
15 quantification can be made of reduced phosphorus content in animal manures. Another reason can be lack of knowledge concerning how one part of the animal production chain influences subsequent steps in the chain. Feed utilisation efficiency has an impact on the amounts of nitrogen and phosphorus in animal manure. This influences the storage capacity and spreading area requirements, which in turn influence the need for investment in facilities and techniques in order to achieve high use efficiency for nitrogen and phosphorus in crop production and minimise plant nutrient losses. The degree of use efficiency is to a high extent dependent on management concerning both animal and crop production, which highlights the importance of knowledge transfer to farmers, but also knowledge transfer between researchers, authorities and advisory services working with either animal production or crop production. That would facilitate development of measures that integrate the whole farm system, thus avoiding sub-optimisations of one part of the production chain leading to increased nitrogen and phosphorus losses in another part. Measure 8.1 was judged to have a direct or indirect effect on biosecurity (Figure 7). The reason is that a measure beneficial for animal health, such as optimised feeding, reduces the prevalence of pathogens. Healthy animals require less frequent treatment with antibiotics, leading to decreased risk of transmission of antibiotic-resistant bacteria. Future work should focus on developing knowledge transfer tools that are adapted to country-specific conditions and result in high feed use efficiency on the farm. Tools to evaluate the outcome of the knowledge transfer are also needed so that the effect on nitrogen and phosphorus reducing capacity and on animal health and usage of antibiotics can be quantified. Constructed wetlands for nutrient reduction/retention The measures 11.1 „Sedimentation ponds‟ and 11.2 „Constructed wetlands‟ have been implemented with economic subsidies in three countries, namely Estonia, Finland and Sweden. One reason why few countries have implemented these measures can be high investment costs. Sweden commented that the investment costs are high and the costs for maintaining the phosphorus sedimentation capacity are currently unknown. Another reason is that these measures can result in reduced areas of arable land. Sweden commented that the value of arable land has increased, which means that it is not attractive to convert arable land to wetland. Other reasons for not implementing the measures can be lack of knowledge concerning the effect. Denmark commented that “it has to be scientifically proven that a constructed wetland is a powerful environmental measure for Danish conditions”. Poland commented that “there is lack of scientific research confirming effectiveness and purposefulness of application of constructed wetlands in Poland”. A third reason can be that these measures might not have any significant effect concerning country- specific conditions. Poland commented that “there are hundreds of thousands of small reservoirs with an area less than one hectare. These include mid-field ponds, so called water little eyes, which accumulate large quantities of nutrients flowing from the fields. Part of mid-field ponds plays the role of sedimentation ponds.” Poland also commented that “constructed wetlands are not applied as an official measure but are understood primarily as objects of the soil-plant wastewater treatment of sewage. Constructed wetlands are not being built in order to retain nutrients flushed from fields.”
16

Measures 11.1 and 11.2 were judged to have an effect on pathogen transmission
(Figure 7). Thus these measures can be considered not only to reduce nitrogen and
phosphorus leaching losses, but also to improve biosecurity.
Future work should focus on knowledge building adapted to country-specific
conditions concerning these measures. More knowledge is needed about nitrogen and
phosphorus reducing capacity, investments and maintenance costs, and construction
on contract between involved partners, such as landowners and users. There is also a
need to develop monitoring tools to evaluate nitrogen and phosphorus reducing
effects over several years. The efficiency of the measures is highly dependent on
management, which highlights the importance of tools for knowledge transfer to the
managers of constructed wetlands/sedimentation ponds.
17

Figure 5. Proportion of the countries surveyed (n=9) that has an official goal, legislation and/or economic subsidy for each measure.
18

Figure 6. Proportion of the countries surveyed (n=8) that judged each measure as applicable and important.
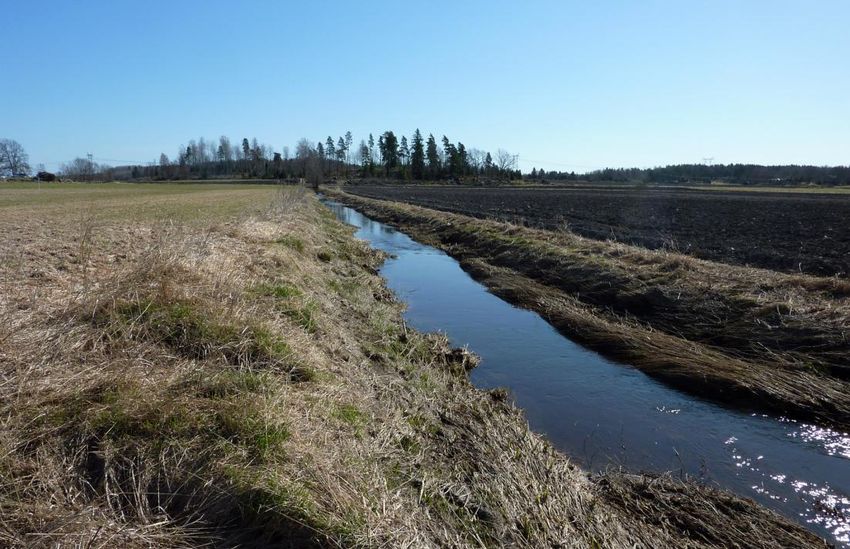
19

Estimated characteristics of measures
Management and technology
In the process of setting up the „List of priority measures‟ for reducing nitrogen and
phosphorus leaching (BAT list), ten of the measures were characterised by the WP3
partners as pure management measures (M), see Figure 7. The potential of these
measures to have a reducing effect on nitrogen and phosphorus leaching depends to a
high degree on how well the measure fits in with normal farm management practices
and the farmer‟s skills and engagement. Five of the measures were characterised as
pure technology measures (T). According to comments in national country reports,
the bottle-neck of implementing the measures is the farmer‟s investment capacity.
However, the farmer‟s education level is also an important prerequisite for his/her
ability to exploit the potential of the technology. Ten of the measures were
characterised as both management and technology measures (M/T), which means
that both aspects are considered to have a significant impact on the nutrient reducing
effect of the measure.
Reducing effect on nitrogen and phosphorus
In the process for setting up the „List of priority measures‟ for reducing nitrogen and
phosphorus leaching (BAT list), seven of the measures were characterised by the
WP3 partners as mainly being efficient in reducing leaching of nitrogen, see Figure
7. Four of the measures were characterised as mainly being efficient in reducing
leaching of phosphorus. Thirteen of the measures were characterised as being
efficient in reducing leaching of both nitrogen and phosphorus. Thus, there are
several measures available for decreasing nitrogen and phosphorus losses, although
the focus in most countries has been nitrogen due to the implementation of the
Nitrate Directive (Council Directive 91/676/EEC of 12 December 1991).
Biosecurity
Basically, measures beneficial for animal health (optimised feeding and reducing
ammonium levels in the house, reducing the prevalence of pathogenic
microorganisms) will have an indirect effect on the transmission of pathogens from
the farm. Furthermore, healthy animals require treatment with antibiotics less
frequently and another positive effect is a reduction in transmission of antibiotic-
resistant bacteria. However, some zoonoses, e.g. Campylobacter jejuni and
Verotoxin-producing E. coli (VTEC, EHEC, E. coli O157 and other serotypes) do
not cause clinical symptoms in adult animals and the prevalence of these may not be
reduced. In addition, measures with an indirect effect on biosecurity will not
decrease the leakage of faecal indicators, e.g. E. coli and faecal enterococci, to
surface water.
All measures providing barriers reducing manure run-off from arable land will not
only provide risk mitigation in terms of pathogens, but will also reduce faecal
indicator transmission to surface water and are therefore important at sites close to
beaches in order to fulfil the Bathing Water Directive (2006/7/EC). The measures
were graded according to how well they can reduce the transmission of pathogens
from the farm (Table 1), as discussed below.
Measures and effects
Reduced surface run-off losses and less erosion will lead to reduced bacterial
contamination of surface water and thus an effect in terms of reduced pathogen
leakage to surface water. This means that measures 1 and 7 can have an effect on
20

reduced leakage of pathogens and faecal indicators from manure to surface water.
Measure 2. „Vegetative cover in autumn and winter on arable land‟ may have an
effect on pathogens added to the soil via manure through reduced erosion.
Furthermore, pathogen uptake by plants is possible (Solomon and Mathews, 2005)
but debated (e.g. Johannesen et al., 2005). Even if human and animal pathogens are
taken up via the root system, this will most likely represent an insignificant fraction
of the total amount in the soil manure matrix. Measure 3.1. „Reducing soil tillage‟
can reduce mineralisation, but it is not likely to affect pathogen leakage from, or
inactivation in, the soil. As a matter of fact, lower soil activity may improve
pathogen survival (Lang and Smith, 2007) but this will probably not lead to any
significant differences in terms of biosecurity risks.
For measures 4 and 5, „Fertilisation management‟ and „Improved spreading
technologies‟, the effect is dependent on the total amount of manure spread and how
this manure is managed. If it leads to increased use of manure it can have a negative
impact on biosecurity. However, there are other measures (manure management and
technologies; safe manure, stored or treated to reduce pathogens and applied for
limited run-off) that can counteract increased use of manure from a biosecurity point
of view. For example, deploying measures 4.3. „Avoiding the spreading of chemical
fertilisers and manure during high-risk periods‟ (heavy rainfall, flooded or snow
covered fields and during frost), 5.1. „Incorporation‟ or 5.4. „Injection of liquid
manure‟ would reduce the potential run-off to surface water considerably. Another
management measure with great potential in reducing biosecurity risks is 6.
„Avoiding the application of chemical fertilisers and manure to high-risk areas‟.
Avoiding the application of manure on land with a risk of run-off to surface water
(fields with a significant slope, adjacent to water or draining to nearby water) would
reduce water contamination significantly. The least farmers can do in areas adjacent
to water is to implement measure 12. „Buffer zones along water areas and erosion-
sensitive field areas‟.
Suitable storage (measure 10) reduces the risk of manure leakage. In addition,
inactivation (time- and temperature-dependent) of pathogens takes place during
storage. According to Guan and Holley (2003), a storage time of 90 days at 25 °C is
enough for acceptable inactivation of the zoonotic agents listed in the introduction
(apart from HEV), while the potential exists to eliminate most pathogens at higher
temperatures (> 50 °C) (Nyberg et al., 2012). However, spore-forming bacteria such
as Clostridium spp. and Bacillus spp. are not reduced significantly (Bagge, 2009).
These genera contain pathogenic and opportunistic pathogenic species (for example
Cl. chauvoie, difficile and botulinum, B. anthracis). Furthermore, B. cereus can cause
problems in the dairy industry (Andersson et al., 1995).
Constructed wetlands (measure 11) are extensively used to polish secondary treated
wastewater to reduce nitrogen, phosphorus and pathogen levels in receiving waters
and have a positive effect on the transmission of faecal indicators to comply with the
Bathing Water Directive (2006/7/EC). Ponds and wetlands also reduce pathogen
transmission to surface water. However, the biosecurity effects will depend on the
possible exposure of humans and livestock to the ponds/wetlands. Furthermore,
ponds/wetlands serve as attractive bird habitats with the potential for vector
transmission of pathogens, and as breeding grounds for mosquitoes (Schäfer et al.,
2004).
21

Animal health
As explained above, all feeding strategies optimising animal health have a positive
impact from a biosecurity point of view, with less infections and, as a consequence,
less antibiotics use. Measure 8.1. „Adopting phase feeding of livestock‟ is not only
beneficial for nutrient use efficiency but also reduces the risk of introducing
pathogens to a herd. For example, a strict all-in/all-out batch management system,
with decontamination of the rearing rooms between consecutive batches, is
recommended to control Salmonella infection in growing pigs (Lurette et al., 2011).
Keeping young cattle in the same group throughout rearing reduces the prevalence of
EHEC (Ellis-Iversen et al., 2008). Ammonia emissions in the house have a negative
impact on animal health, with an increased prevalence of respiratory diseases that, if
bacterial, may need antibiotic treatment. Therefore measure 9. „Reducing ammonia
losses in animal houses‟ can have an indirect effect on the transmission of antibiotic-
resistant bacteria from the farm.
Concluding remarks
Healthy animals need less antibiotic treatment and produce more saleable product.
Some of the 25 measures on the list can improve animal health and are therefore
beneficial for the farmer as well as from a biosecurity point of view. Manure
management is pertinent in reducing biosecurity risks. This means proper storage (no
risk of leakage to water, time for pathogen inactivation), treatment to inactivate
pathogens (optional), time and technique of application and avoiding high risk areas
or including a buffer zone when fields are adjacent to water. Fields close to water
with a significant slope (>10%) should not be fertilised at all.
Fertiliser application should be adapted to the environmental status of the field and
manure should not be spread on flooded or saturated ground or on ground which is
frozen or covered by snow. Preferably, fertilisers should be injected into the soil or
incorporated within hours after application in order to limit nitrogen losses and
surface run-off, and hence be beneficial from a biosecurity point of view.
22

                                                                                                         a                  b                  c                 d
Priority measures                                                                                 Type             Effect       "Popularity"       Biosecurity
1. Promoting long-term grass cultivation on arable land                                             M                N/P             6                  L, +
2. Vegetative cover in autumn and winter on arable land                                             M                N/P             9                 L, (+)
3. Soil tillage management
     3.1. Reducing soil tillage                                                                   M/T               N/(P)              5                0
     3.2 Time of the year effects                                                                 M                 N/(P)              5              L, (+)
4. Fertilisation management
     4.1. Adapting the amounts of chemical fertiliser and manure applied                          M/T                N/P               8              L, (+)
     4.2. Calculating nutrient balances on farm and/or field level                                M                 N/(P)              6                0
     4.3. Avoiding the spreading of chemical fertilisers and manure during high-risk periods      M                  N/P               9              L, ++
     4.4. No or reduced phosphorus fertiliser for high soil phosphorus fields or part of fields   M/T                 P                7                0
5. Improved spreading technology for manure and chemical fertiliser
     5.1 Site-specific dosage                                                                      T                  N                4              L, (+)
     5.2 Combi-drilling                                                                            T                  N                3               L, +
     5.3 Incorporation                                                                             T                  N                7              L, ++
     5.4 Liquid manure                                                                             T                  N                8               L, +
     5.5 Solid manure                                                                              T                  N                6               L, +
     5.6 Manure spreading and ammonia emissions – general measures                                M/T                 N                6              L, (+)

6. Avoiding the application of chemical fertilisers and manure to high-risk areas                  M                 N/P               9              L, ++
7. Measures to optimise soil pH and improve soil structure                                         M                 (P)               6                0
8. Adapted feeding
    8.1 Adopting phase feeding of livestock                                                       M/T                N/P               0             AH, (+)
    8.2 Reducing dietary nitrogen and phosphorus intake                                           M                  N/P               1                0
    8.3 Phytase supplementation                                                                   M                   P                2                0
    8.4 Wet feed and fermentation                                                                 M/T                 P                0                0
9. Reducing ammonia losses in animal houses                                                       M/T                 N                3             AH, (+)
10. Storage of manure                                                                             M/T                N/P               9              L, ++
11. Constructed wetlands for nutrient reduction/retention
    11.1 Sedimentation ponds                                                                      M/T                 P                3               L, +
    11.2 Constructed wetlands                                                                     M/T                N/P               3               L, +
12. Buffer zones along water areas and erosion-sensitive field areas                              M                  N/P               9              L, ++
a) M = Management                                  b) N = Nitrogen                                           d) AH = Improved animal health
   T = Technology                                     P = Phosphorus                                            L = Reduced surface run-off
   M/T = Both Management and Technology               N/P = Both Nitrogen and Phosphorus                        0 = No effect
                                                      () = Uncertain effect                                     (+) = Can have a direct or indirect effect
 c) The number of countries with either                                                                         + = has an effect
    legislation or subsidy, or both (max is 9)                                                                  ++ = Will reduce the risk of pathogen leakage significantly

Figure 7. Characterisation of the 25 measures according to type (M, T, M/T), effect, popularity and biosecurity in the countries surveyed.
23
Summary tables on national country reports
In the country reports from Denmark, Estonia and Finland some new measures were
added, see the respective country reports.
Reading instructions for tables
Country codes
Belarus BY
Denmark DK
Estonia EE
Finland FI
Germany DE
Latvia LV
Lithuania LT
Poland PL
Sweden SE
Colour codes: YES NO No answer
Explanation of codes used in tables:
BY DK EE FI DE LV LT PL SE
1)
Official goal 4/6 -/- 10/- 10/10 5/6 5/8 -/-
2)
Legislation n - r n n n n r r
3)
Econ. Subsidy n 5yr
4 n
4)
Obligation n - r n
5 n n n r r
1) The first figure indicates to what extent the measure is implemented today in relation
to goal; "0"=Not at all; "10"=Goal already reached. The second figure is a judgement
of the possibilities to fulfil the goal; "0"=Impossible; "10"=Very good.
“-“= No judgement.
2) Letters n and r indicate whether the legislation is national or regional.
“-“= Not specified.
3) The figure indicates the subsidy level in Rural Development Programme (RDP);
1=below 50%, 2=below 100%, 3=100%, 4=above 100%.
Letters n and r indicate whether the subsidy is national or regional.
4) The figure indicates the time-period of obligation in years.24
1. Promoting long-term grass cultivation on arable land
Cultivation of grass or legume/grass crops on arable land with high/low inputs of
nitrogen and phosphorus and high/low outputs of feed, food or other services can
reduce nitrogen and phosphorus leaching and surface run-off losses, as well as soil
erosion, compared with annual crops on arable land.
Crop rotations including permanent grass or legume/grass crops can decrease
nitrogen leaching, compared with crop rotations dominated by annual crops.
BY DK EE FI DE LV LT PL SE
Official goal 7/6 10/10 10/- 3/4 10/-
Legislation nn n n r r
Econ. subsidy n 5yr
2n 5yr
4 nr 5yr
3n 3r
Obligation n n 5 5 5 r
2. Vegetative cover in autumn and winter on arable land
Annual winter crops, such as winter wheat or winter rape, can provide a vegetative
cover that actively takes up available nitrogen and phosphorus from the soil more
efficiently than annual spring crops in a seasonal period with high precipitation and
cool climate.
Catch crops can be under-sown in the main crop simultaneously or just after sowing
of that main crop. When the main crop is harvested, the catch crop has an established
root system ready to take up nitrogen from the soil during late summer and autumn.
Nitrogen that could otherwise have been leached is then taken up and incorporated
into plant material. The catch crop is ploughed under as late as possible in autumn, or
in spring. Perennial ryegrass (Lolium perenne L.) as a catch crop is an effective
measure to reduce nitrogen leaching in spring cereal crop production. The use of
catch crops is reported to reduce nitrogen leaching in several studies. The effect of
the catch crop on nitrogen leaching depends on precipitation and drainage conditions,
available nitrogen amounts in soil and how successfully the catch crop establishes.
BY DK EE FI DE LV LT PL SE
Official goal 5/5 10/10 10/- 10/- 8/10 3/6 5/8
Legislation n n n r r r r
Econ. subsidy 5yr
2n 45yr
nr 5yr
2r 5yr
4r 5yr
3n 2Yn 5yr
3r
Obligation 5 5 5 5 5 Y 5
3. Soil tillage management
3.1. Reducing soil tillage by conversion from ploughing to a minimal or no tillage
system, or conversion from deep ploughing to shallow ploughing can reduce
mineralisation of organic matter in soil. Typical techniques include using discs or
tines to cultivate the soil, or direct drilling into stubble (no-till).25
BY DK EE FI DE LV LT PL SE
Official goal 2/6 10/- 7/10
Legislation n r
Econ. subsidy n 1n 3n 1n r
Obligation n Y Y 5 r
3.2 Time of the year effects. Postponing tillage actions from autumn to spring
means that the mineralised nitrogen becomes available for uptake by the established
spring crop, which also provides surface cover.
BY DK EE FI DE LV LT PL SE
Official goal 4/4 10/10 10/10 1/8
Legislation n n
Econ. subsidy 4Yn 5yr
1 n 5yr
3r
Obligation Y 5yr
5 5yr
5
4. Fertilisation management
4.1. Adapting the amounts of chemical and organic fertilisers applied.
Animal density is measure of the number and type of animals kept on the farm in
relation to the arable area available for spreading their manure (RAMIRAN, 2010).
Animal density is used as a tool to balance the amounts of nitrogen and phosphorus
produced in manure to available spreading area on the farm in order to avoid excess
application of nitrogen and phosphorus with manure.
Considering crop requirements of nitrogen and phosphorus in the fertilisation plan is
essential in order to avoid excessive applications. The nitrogen and phosphorus
content of manure must be considered in the fertiliser plan in order to adjust the need
for chemical fertilisers and avoid excessive applications.
Sampling and analysing nitrogen and phosphorus in manure provides information on
their concentrations and the distribution of plant-available nitrogen (NH4-N + NH3-
N) and organic nitrogen. The effect of the manure can then be valued in the
fertilisation plan. Manure characteristics can vary widely. Liquid manure is a general
term that denotes any manure from housed livestock that flows under gravity and can
be pumped (RAMIRAN, 2010). Liquid manure can have a high proportion of plant-
available nitrogen in the total nitrogen content. Solid manure is a general term that
denotes any manure from housed livestock with large amounts of bedding that does
not flow under gravity, cannot be pumped but can be stacked in a heap (RAMIRAN,
2010). Solid manure can have a high proportion of organic nitrogen in the total
nitrogen content.
Sampling and analysing nitrogen and phosphorus in arable soil provides information
on soil fertility concerning these nutrients, which should be considered in the
fertilisation plan in order to avoid excessive fertiliser applications or declining soil
fertility.26
BY DK EE FI DE LV LT PL SE
Official goal 10/10 8/- 9/10 10/10 5/7 8/9
Legislation n n - n r n r r
Econ. subsidy 5yr
2 n 5yr
4 n n 2Yn 2r
Obligation n n
5 5- n r n Yr r
4.2. Calculating nutrient balances on farm and/or field level
Calculating nitrogen and phosphorus inputs/outputs and balances on farm and/or
field level is a performance tool and a policy tool for assessing the environmental
impact. The tool can also be used to monitor and evaluate the impacts of alternative
manure and chemical fertiliser management practices and technologies on nitrogen
and phosphorus use on the farm. When farm nitrogen and phosphorus balances can
be linked to within-farm sources and flows, there is a good possibility of identifying
the weakest link and possible improvements for the farm. The tool can be used to
assess the risk of ammonia losses from manure management and the risk of nitrogen
leaching losses to water.
BY DK EE FI DE LV LT PL SE
Official goal 9/9 10/10 3/7 7/-
Legislation n n n r r
Econ. subsidy 5yr
4n
Obligation n 5 n n r r
4.3. Avoiding the spreading of chemical fertilisers and manure during high-risk
periods.
The timing of chemical fertiliser and manure application is a key factor in achieving
high plant nutrient use efficiency. Poor timing is one of the most important sources
of large nitrogen leaching loads.
BY DK EE FI DE LV LT PL SE
Official goal 5/5 10/10 6/5 10/10 7/7 7/9
Legislation n n n n n n n r r
Econ. subsidy 5yr
4 n n
Obligation n n n n
5 n n n r r
4.4. No or reduced phosphorus fertiliser for high soil phosphorus fields or part
of fields.
When the soil phosphorus values increase beyond the agronomic optimum range,
there is a reasonably consistent pattern whereby phosphorus leaching increases
significantly. However, phosphorus leaching has large spatial and temporal
variations and can be influenced by several factors interacting with each other. It is
therefore important to consider site-specific factors in order to identify measures to
reduce phosphorus leaching.You can also read