Autonomous Lidar-Based Monitoring of Coastal Lagoon Entrances
←
→
Page content transcription
If your browser does not render page correctly, please read the page content below
remote sensing
Article
Autonomous Lidar-Based Monitoring of Coastal
Lagoon Entrances
Bilal Arshad * , Johan Barthelemy                    and Pascal Perez

                                          SMART Infrastructure Facility, University of Wollongong, Wollongong, NSW 2522, Australia;
                                          johan@uow.edu.au (J.B.); pascal@uow.edu.au (P.P.)
                                          * Correspondence: bilal@wizedynamics.com.au; Tel.: +61-2-4239-2329

                                          Abstract: Intermittently closed and open lakes or Lagoons (ICOLLs) are characterised by entrance
                                          barriers that form or break down due to the action of wind, waves and currents until the ocean-
                                          lagoon exchange becomes discontinuous. Entrance closure raises a variety of management issues
                                          that are regulated by monitoring. In this paper, those issues are investigated, and an automated
                                          sensor solution is proposed. Based upon a static Lidar paired with an edge computing device. This
                                          solar-powered remote sensing device provides an efficient way to automatically survey the lagoon
                                          entrance and estimate the berm profile. Additionally, it estimates the dry notch location and its
                                          height, critical factors in the management of the lagoon entrances. Generated data provide valuable
                                          insights into landscape evolution and berm behaviour during natural and mechanical breach events.

                                          Keywords: coastal monitoring; estuaries; IoT; lidar; remote sensing

                                1. Introduction

                                                Within ecosystem coastal areas provide critical services, such as ecotourism, climate
Citation: Arshad, B.; Barthelemy, J.;     regulation, storm and wave protection, and recreational regions; yet they only comprise
Perez, P. Autonomous Lidar-Based          5% of the earth’s land surface [1]. The impact of global temperature change, rising sea-
Monitoring of Coastal Lagoon
                                          levels, and rapid urbanization is increasingly affecting coasts. Thus, there is a demand
Entrances. Remote Sens. 2021, 13, 1320.
                                          for long-term coastal monitoring and effective management initiatives, including coastal
https://doi.org/10.3390/rs13071320
                                          lagoons. Coastal lagoons are common features (nearly 13%) of the coastal systems [1]. They
                                          are regions where water, atmosphere, and land interact in a complex environment, that
Academic Editor: Paweł Terefenko
                                          is constantly been changed by humans and natural influence [1]. Along the coastline of
                                          Australia, approximately 61 out of 135 estuarine systems have intermittently open and
Received: 6 February 2021
Accepted: 29 March 2021
                                          closed lagoon entrances. Of these, 44 are artificially opened when the berm height exceeds a
Published: 30 March 2021
                                          pre-defined threshold. The rest are kept open by breakwaters and training walls, primarily
                                          to provide boating access but also to improve water quality and maximize flushing [2].
Publisher’s Note: MDPI stays neutral
                                                Coastal lagoons which alternate between being closed and open to the ocean are
with regard to jurisdictional claims in
                                          commonly referred to as Intermittently Closed and Open Lakes or Lagoons (ICOLLs) [3].
published maps and institutional affil-   For wave-dominated entrances, the intermittent open and closed behaviour of estuaries is
iations.                                  caused by the infill process reducing the average channel cross-sectional area relative to
                                          river or tidal dominated systems. Unintended closure of estuaries might have dramatic
                                          consequences during flash flood events or water contamination by hazardous substances.
                                          Thus, understanding the dynamics of such process is crucial to managing lagoons and
Copyright: © 2021 by the authors.
                                          estuaries, especially in densely populated coastal areas.
Licensee MDPI, Basel, Switzerland.
                                                Due to the intermittent nature of rainfall in south-eastern Australia, the open/closed
This article is an open access article
                                          cycles of ICOLLs are not seasonal. The frequency and timing of the entrance opening are
distributed under the terms and           dependent on the factors such as catchment size, water levels in creeks or rivers and height
conditions of the Creative Commons        of the sand berm. Lagoon entrances are usually characterized by a sand berm, formed
Attribution (CC BY) license (https://     from sediments deposited by tides, winds, and waves from the ocean. This natural process
creativecommons.org/licenses/by/          increases the vertical growth of the berm and the peak height is determined by the wave
4.0/).                                    runup [4]. The berm prevents water flow from the lagoon to the ocean and vice versa,

Remote Sens. 2021, 13, 1320. https://doi.org/10.3390/rs13071320                                      https://www.mdpi.com/journal/remotesensing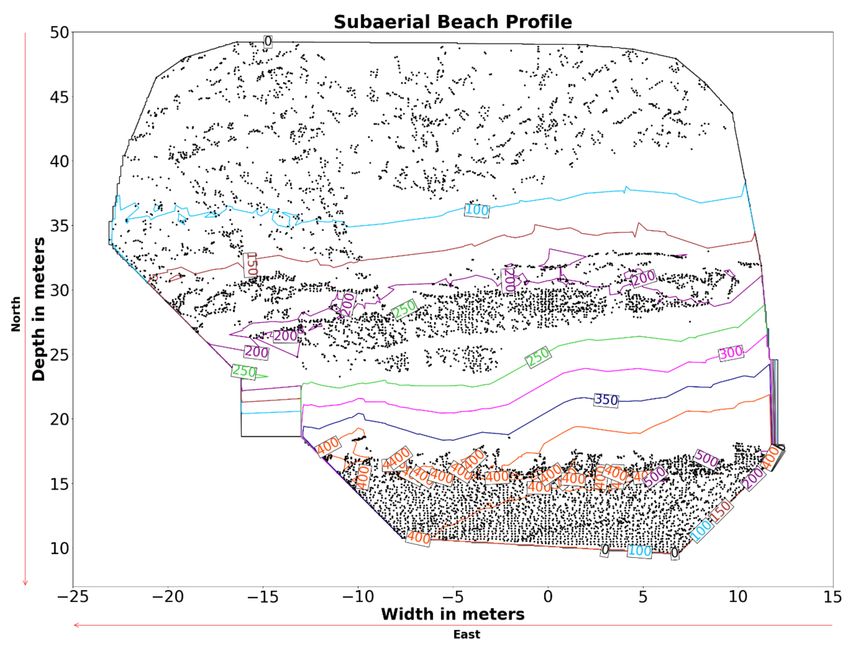
Remote Sens. 2021, 13, 1320                                                                                               2 of 19

                                    which can cause the lagoon to overflow and inundate low-lying residential areas, due to
                                    the water build-up behind the berm [5]. Therefore, monitoring berm height is crucial as
                                    this is one of the important factors for authorities to consider when planning to breach
                                    the entrance.
                                          The decision to mechanically breach an entrance (lowering or removal of the berm)
                                    entails several considerations., such as the negative impacts on local flora and fauna.
                                    Henceforth, artificial breach is carefully considered by the local authorities, in order to
                                    strike a balance between the social, economic and ecological risks. As the timing of the
                                    intervention is a key to success, regular monitoring of lagoon entrances and sand berms
                                    is necessary.
                                          Usually, the effective management of lagoon entrances is based on a pre-determined
                                    tolerated threshold for the maximum berm height (This is known as “maintain a dry
                                    notch”). A dry notch is the minimum height of the berm that is not affected by normal
                                    hydraulic beach processes (wave run-up and tides). A well-designed dry notch allows
                                    water behind the berm to naturally open the lagoon during a flood event. However, in
                                    many instances, there is a need to excavate the dry notch in order to provide such an outlet
                                    and avoid upstream inundation (Figure 1). Therefore, it is important to regularly monitor
                                    the berm through observation height markers or/and regular in situ surveys to maintain
                                    the presence of a dry notch [6].

                              Figure 1. Importance of berm and dry notch management for lagoon entrances.

                                         This study seeks to address the need for active and on-demand monitoring of lagoons
                                    via automating the task of in situ surveying. As the systematic review by Arshad et al. [7]
                                    highlighted that lagoon monitoring is still conducted manually and it requires further
                                    investigation. In this paper, various remote sensing technologies [8] have been explored to
                                    automate the management of the lagoon entrances. It is hypothesized that lagoon entrance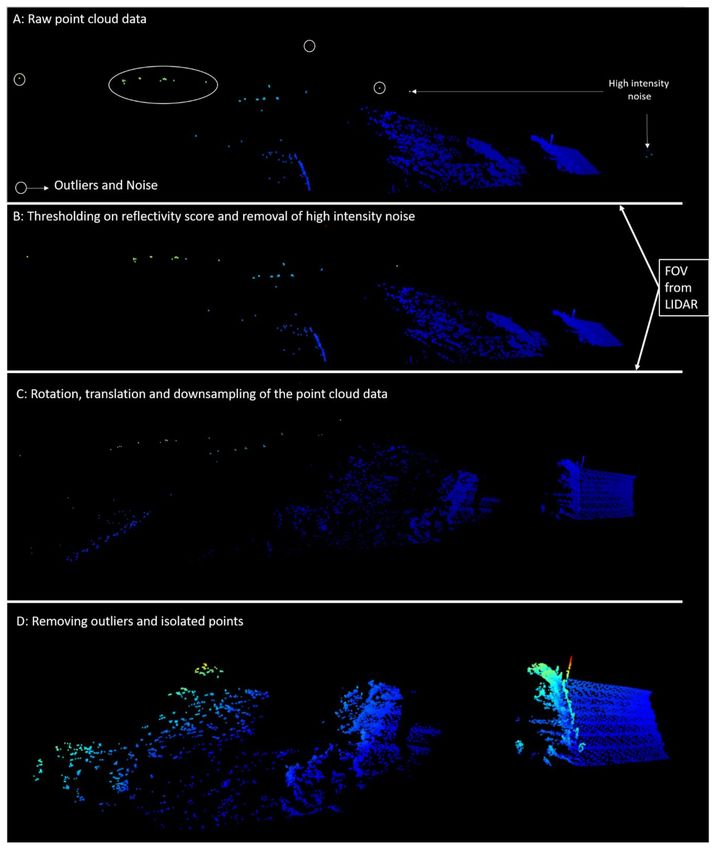
Remote Sens. 2021, 13, 1320                                                                                            3 of 19

                              management can be automated by using a remote sensing station consisting of a continuous
                              scanning light detection and ranging (Lidar) sensor paired with an edge computing device
                              to construct a topographic profile of the lagoon entrance. This study further contributes
                              towards estimating the height and location of a dry notch, thus assisting local authorities to
                              manage lagoon entrances effectively. This paper is organized as follows: Section 2 reviews
                              recent advancements in coastal monitoring and management. Methodology including
                              study site, monitoring setup and data processing are presented in Section 3. Section 4
                              presents discussion and lastly, Section 5 presents conclusion and future direction for
                              the research.

                              2. Recent Advancements in Coastal Monitoring and Management
                                   Remote sensing technologies such as computer vision and internet of things (IoT)
                              sensors available to develop an early warning system have previously been covered in
                              a systematic review [7,9]. This section will look at the recent advancements in coastal
                              management from a monitoring perspective, including ground-based camera systems,
                              satellite, unmanned aerial vehicles (UAVs) and Lidar-based technologies.

                              2.1. Camera-Based Remote Sensing
                                    Frequent in situ surveying of estuaries is challenging and costly therefore an alternate
                              approach is required which is free from manual work and thus serves the purpose of
                              continuous monitoring with no human input. Since 1996 in Australia, ARGUS coastal
                              imaging system has been commonly used to monitor the coastal environment [10]. A typical
                              coastal imaging system consists of four or five elevated cameras to provide a 180-degree
                              view of the shoreline. This automated coastal monitoring station takes images and patches
                              them together to cover the whole coastal area. Image/video analysis is then performed to
                              observe shoreline behaviour [11], sandbar behaviour [12], nearshore morphology [13], and
                              contributes to other coastal-related research areas [10]. Such monitoring has an advantage
                              over traditional surveys as it captures both spatial and temporal data that can be utilized
                              to understand coastline response to storms. A study conducted at Narrabeen–Collaroy in
                              Australia by Harley et al. [14] utilized approximately 5 years of both time-exposure and
                              variance image data to develop an empirical relationship between change in beach width
                              and wave energy of storms. This work was extended by Beuzen et al. [15] and utilized
                              approximately 10 years of coastline data to develop a Bayesian Network to predict coastline
                              response to storms.
                                    Video-based remote sensing data provide flexibility and a long-term source of data,
                              for which estuary behaviour can be explored under the influence of changing environmen-
                              tal conditions. Another example of video-based remote monitoring is surf cameras [16].
                              Surfcams are used around the world to provide surfers with information about conditions
                              of the beach, so they can plan their trip accordingly. Mole et al. [16] in their work identified
                              the use of existing surfcams networks for capturing both shoreline change and the real-time
                              effect of waves. The authors utilized surfcams to capture the daily movement of coastline
                              position and inshore waves at seven beaches in New South Wales, Australia. Addition-
                              ally, Bracs et al. [17] utilized surfcams to capture quantitative shoreline positional data.
                              The study used surfcams at 9 diverse sites along the south-eastern Australian shoreline.
                              Their study compared an estimate of shoreline elevation between surfcams and real-time
                              kinematic global navigation satellite system (RTK-GNSS) surveys. After calibrating the
                              surfcams, standard deviations (SDs) error of 1 to 4 m (horizontal) was observed when com-
                              pared to RTK-GNSS survey. When compared to Argus-derived shoreline dataset an error
                              of 2 m (horizontal) was observed. Recently Umberto et al. [18] presented a methodological
                              approach to exploit surfcams for coastal morphodynamic studies. This study offered a
                              procedure to geo-rectify the online streamed images by utilizing ground control points and
                              estimating the unknown camera parameters to generate accurate rectified planar images
                              for quantitative analysis of coastal behaviour. Furthermore, Sanchez-Garcia et al. [19] pre-
                              sented a method of projecting terrestrial images into geo-referenced planes to minimise the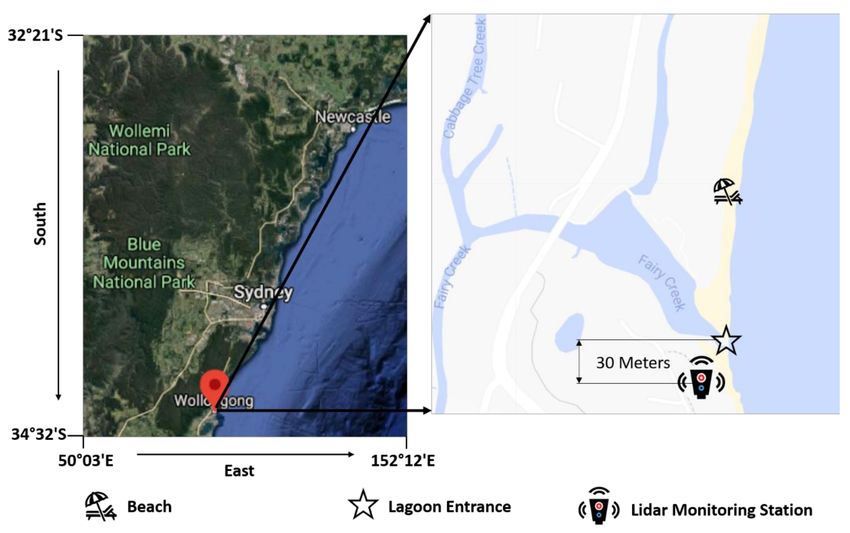
Remote Sens. 2021, 13, 1320                                                                                           4 of 19

                              error of existing low-elevation surfcams. As surf cameras continue to grow in number, such
                              resources will become increasingly valuable in expanding coverage of coastal monitoring.
                                    Following from surfcams, recent advancements in camera technology and availability
                              of such technology in smartphones indicates that there are unexploited opportunities
                              for coastline monitoring [20] using crowd-sourced photos. For instance, citizen science
                              launched the CoastSnap program [21], where several known photo points have been
                              installed, creating monitoring locations. These crowd-sourced images are provided by
                              the general public visiting beaches via widely used digital media platforms or through
                              instructions provided on photo points to share photos with researchers and the local
                              community [22]. The first photo point station was commissioned at Narrabeen–Collaroy
                              embayment and provided the opportunity to generate a shoreline dataset for coastal
                              management and research. The photo point station consists of a basic camera cradle that
                              controls and stabilizes the viewpoint of the smartphone camera. The general public can
                              then place their phone in the bracket and take pictures of the view and upload them
                              to their preferred database. This, however, brings some challenges such as the wide
                              range of smartphone, low-resolution images, manual adjustment of smartphones, and
                              uncertainty in image capture times. Similar to surfcams, ground points were measured at
                              the time of installation for every CoastSnap, and such information is used to geo-reference
                              and rectifies each image submitted by the community participants. However, coastal
                              monitoring via both surfcams and ARGUS monitoring station relies on known camera
                              parameters, whereas for CoastSnap intrinsic and extrinsic parameters (i.e., azimuth pitch,
                              focal length, and roll) of the smartphone cameras are computed on the fly and computed
                              numerically via surveyed ground control points in the photo [23]. This crowd-sourced
                              method opens new opportunities for emerging countries, where coastal research is limited
                              due to lack of resources, but social media and smartphone usage are high.

                              2.2. Satellite-Derived Remote Sensing Approach
                                    High-resolution satellite imagery, i.e., Landsat 1–5 multispectral scanner (MSS) (60 m),
                              Landsat 4–5 thematic mapper (TM) (30 m), Landsat 7 enhanced thematic mapper (ETM+)
                              (30 m), Landsat 8 operational land imager (OLI) (30 m) and Sentinel-2 (10 m/20 m/60 m)
                              are becoming freely available, hence there are new opportunities to remotely monitor
                              coastal areas more frequently. Such data offer mapping of estuaries immediately after
                              or during events, such as floods due to change in sea level, or via human disturbances.
                              Additionally, there is potential for monitoring the sea level and intertidal zones of coastal
                              lagoons. For example, Salameh et al. [1] demonstrated the ability of altimetry to retrieve the
                              landscape of the intertidal zone and the sea surface height. Furthermore, a study conducted
                              by Liu et al. [24] explored the super-resolution technique that utilized 29 years of Landsat
                              imagery data to derive monthly, seasonal and annual trends to demonstrate coastline
                              variability. More recently, machine learning is playing an important role in mapping
                              satellite imagery data. For example, Park et al. [25] utilized a support vector machine
                              (SVM) learning classifier on high-resolution imagery data (acquired from PlanetScope
                              satellite) to automatically map the coastal area. Moreover, Vos et al. [26] explored a
                              machine learning approach to extend the approach used by Liu et al. to detect the coastline
                              in the satellite imagery data. The authors then compared their enhanced coastline method
                              to five coastline datasets. They reported a cross-shore root mean square error (RMSE) value
                              of 8.2 m; at the Narabeen-Collaroy between in situ (Emery method [27] with RTK-GPS
                              data) and satellite-derived data. The authors showed that by utilizing a machine learning
                              approach they were able to capture storm-scale variations and shoreline behaviour. Satellite
                              monitoring offers a long-term source of the coastal dataset and such monitoring is vital in
                              defining monthly and seasonal variability. However, it is a delayed response and therefore,
                              not suited for real-time monitoring of the site.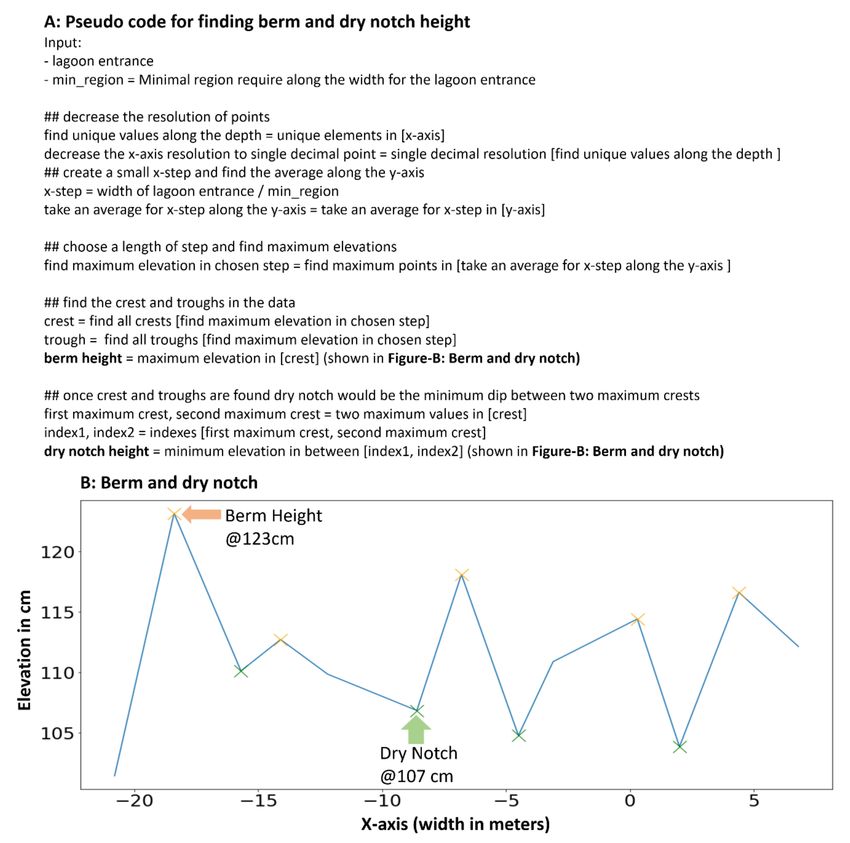
Remote Sens. 2021, 13, 1320                                                                                                5 of 19

                                 2.3. Unmanned Aerial Vehicle Remote Sensing Approach
                                      Unmanned Aerial Vehicles (UAVs) have been increasingly used in different fields of
                                 geoscience such as beach dune evolution [28], rocky cliff erosion [29], gully erosion [30],
                                 tidal inlet evolution [31] and coastal monitoring [32]. UAV extends the use of aerial pho-
                                 togrammetry for coastal surveying by utilizing autonomous flight capabilities, advance-
                                 ments in Lidar technologies and state of the art computer vision technologies. Ian et al. [33]
                                 suggested that coastal monitoring can be carried out accurately by using photogramme-
                                 try techniques. Structure from Motion (SfM) [28] is a photogrammetric approach which
                                 produces a 3D-point cloud data by stitching together a series of 2-dimensional (2D) overlap-
                                 ping images. However, this generated point cloud data are dependent on ground control
                                 points. Ian et al. [33] compared the survey accuracy conducted by UAV (using SfM tech-
                                 nique) and RTK-GPS ATV at Narrabeen—Collaroy in Australia. The authors mentioned
                                 that the difference between these two methods has a mean difference of 0.026 m and a
                                 standard deviation of 0.068 m. Furthermore, authors reported from 1:1 comparison that
                                 both survey data are highly correlated to each other (i.e., linear slope = 0.996 and R2 = 0.998).
                                 In addition, authors mentioned that in complex environment the elevation variability of
                                 UAV approach is comparable to expected vertical accuracy of RTK-GPS. However, UAV
                                 does not provide a permanent monitoring solution and such monitoring is dependent on
                                 the presence of a trained UAV operator.

                                 2.4. Lidar-Based Remote Sensing Approach
                                       Lidar sensors operate on the principle of time of flight (TOF) by computing a distance
                                 between the target and sensor [34]. The basic functioning of Lidar sensor is shown in
                                 Figure 2, and the distance calculation between the target object and the lidar sensor is
                                 shown in Equation (1). Hydrodynamic, beach profile, and morphodynamic features can be
                                 obtained by using high-frequency laser pulses. In recent years, due to advancements in
                                 Lidar technology, Lidar data have been extensively used to obtain subaerial beach profiles,
                                 transformation in the surf zone, and near-shore breaking waves [35,36]. The accuracy
                                 of laser scanners is comparable to in situ RTK-GNSS surveying methods. For instance,
                                 Philip et al. [37] investigated post-storm effects on the beach face and studied different
                                 modes of berms via utilizing Lidar. The authors reported a root-mean-square error (RMSE)
                                 of 4 cm when compared with 11 monthly RTK-GPS ground control in situ surveys. The
                                 authors also provided useful insights into tide-by-tide building of the berm and beach face.
                                 Moreover, Brodie et al. [38] reported a RMSE in between 3 cm to 7 cm when compared with
                                 the Lidar data and pressure-based measurements for the range of hydrodynamic surf zone
                                 properties. The approach of using static Lidar for remote sensing applications provides an
                                 efficient way to acquire data with centimetre level accuracy.
                                                                         Pulse travel time
                    Distance between the target object and Lidar sensor =                  × speed o f light             (1)
                                                                                 2
                                       Equation (1): Lidar distance measurement is based on the pulse travel time and speed
                                 of light.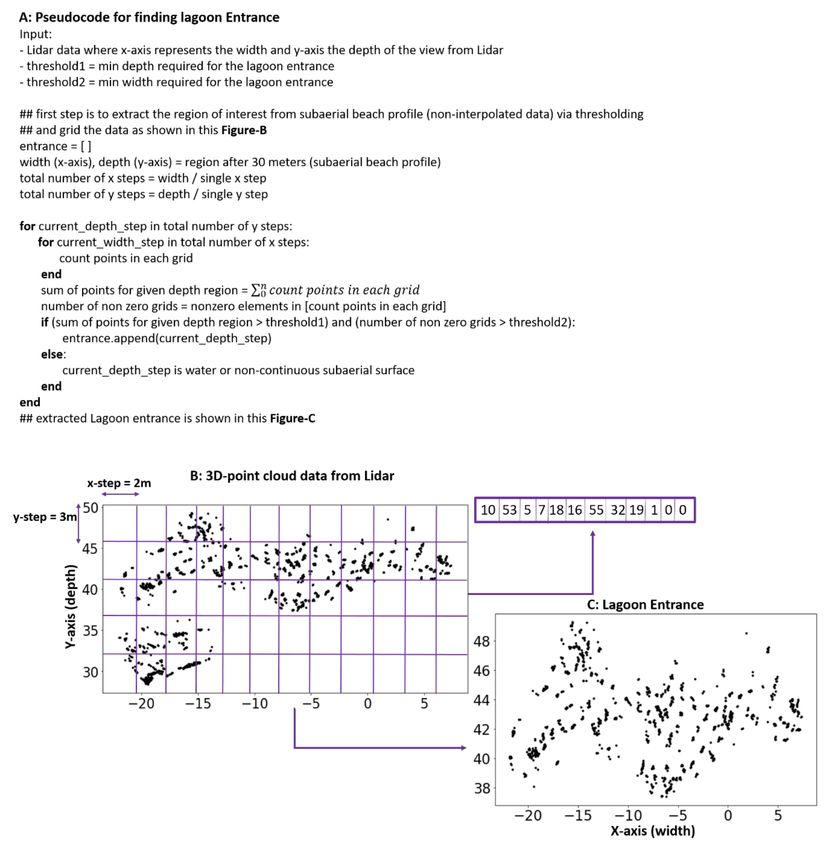
Remote Sens. 2021, 13, 1320                                                                                            6 of 19

                                     Figure 2. Lidar and time of flight (TOF) principle.

                              3. Methodology
                                   This section provides details for the procedure involved regarding study site, and
                              the monitoring setup. This section also lists pre-processing steps undertaken to minimize
                              the noise in the 3D-point cloud data acquired from the Lidar. Moreover, lagoon entrance
                              extraction from the subaerial beach profile, and parametric information estimation of the
                              berm and dry notch is also discussed in this section.

                              3.1. Study Site
                                   Fairy Lagoon is located at the southern end of Fairy Meadow beach, within the
                              northern part of the Wollongong, New South Wales, Australia (refer to Figure 3). The
                              behaviour of Fairy Lagoon immensely impacts on water quality, water levels and the
                              ecology of the coastal area. Fairy Lagoon can be characterized as follows:
                              •    A popular recreational and tourist area; open access to tourists and the general public
                                   due to urbanization around the lagoon entrance.
                              •    Intermittently open and close to the ocean due to formation of a sand bar. After
                                   breaching the entrance, it stays open for a few weeks or months, and sand is deposited
                                   due to the longshore drift and wave action.
                              •    Entrance is subject to periodic flooding; receives a large quantity of water due to runoff
                                   from an urbanized area, and a recent flood study has indicated that main component
                                   of the flood risk is associated with the elevated water level in the lagoon concerning
                                   the ocean.
                                   The greater Fairy Creek catchment (also includes Cabbage Tree Creek) has an area of
                              about 20.76 km2 , which further extends from Illawarra escarpment to the coast and includes
                              Fairy Meadow, North Wollongong, Balgownie, and Mount Ousley residential areas. Rapid
                              urbanization around catchment has caused a negative impact on the conditions of Fairy
                              Lagoon. During an extended period of heavy rainfall and closed entrance, the lagoon would
                              naturally breakout, and that can result in flooding of neighbouring urban development. To
                              manage this risk effectively, real-time monitoring is required.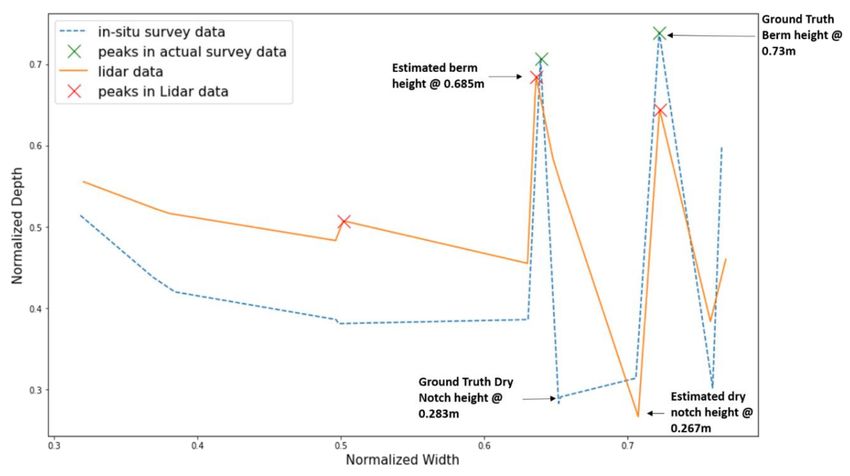
Remote Sens. 2021, 13, 1320 7 of 19
Figure 3. Fairy Lagoon Entrance situated at the Southern end of Fairy Meadow beach, within the northern part of the
Wollongong, New South Wales, Australia (Google Maps, 2020).
3.2. Monitoring Setup
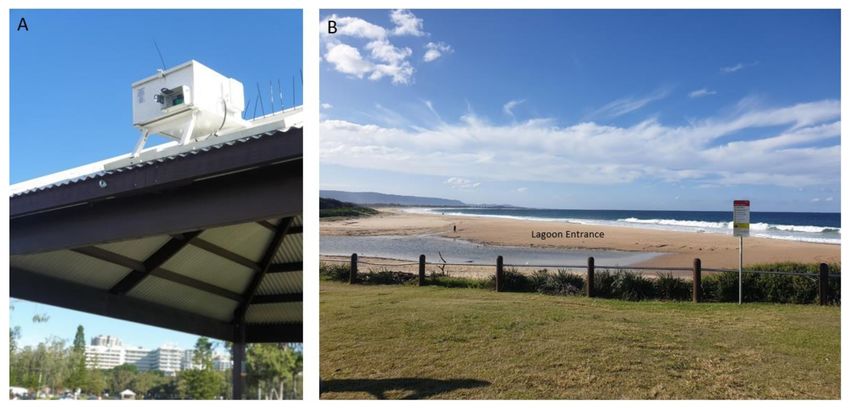
The static monitoring station developed for this study can be seen in Figure 4. The
monitoring station is equipped with a Lidar (Cepton Vista—P60), along with an edge
computer (Nvidia Jetson Nano), 4G universal serial bus (USB) modem (Huawei e83272)
and an inertial measurement unit (IMU) sensor (Phidget Precision 3/3/3). This remote
sensing station is solar-powered, making it fully autonomous.
Figure 4. (A) Remote monitoring station; (B) Field of View from Lidar Sensor.
The monitoring station is deployed at the Fairy Lagoon entrance and located approxi-
mately 7.8 m above the mean sea level (MSL). The Lidar is used to extract the 3D-point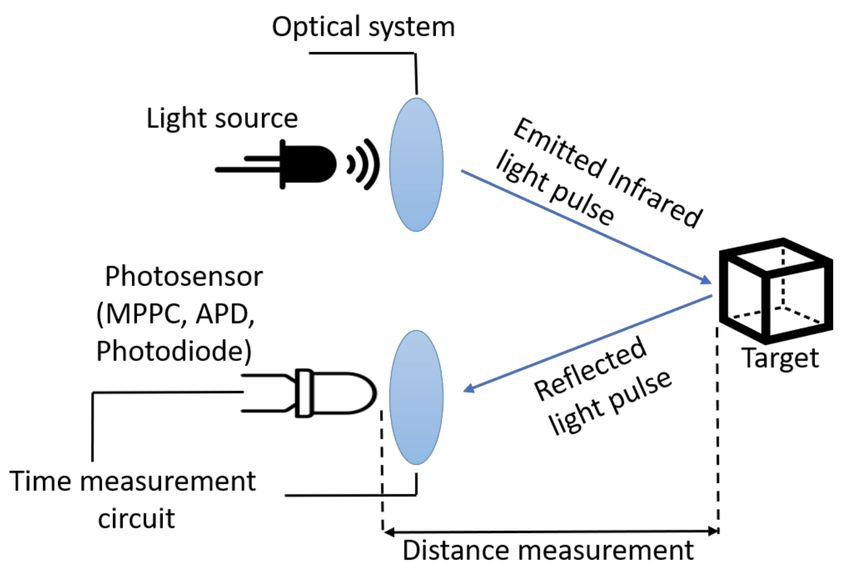
Remote Sens. 2021, 13, 1320                                                                                             8 of 19

                              cloud data of the lagoon entrance. The Field of View from Lidar to the entrance is about
                              60◦ × 22◦ (H × V) with an angular resolution of approximately 0.25◦ both horizontally
                              and vertically. The Lidar provides information for each ground point: x, y, z coordinates
                              and intensity of the reflected light pulse. The intensity corresponds to the strength of
                              the reflected pulse and reflectance of a target object. For instance, in coastal environment
                              reflectance of dry sand is about 35 to 45 percent whereas, for wet sand, it varies from 20 to
                              30 percent [39]. The Lidar used for this research can detect an object with the minimum
                              reflectivity coefficient of 30 percent at 200 m. Additionally, as that object moves closer to the
                              Lidar sensor, that object can be detected with even less reflectivity score. However, as that
                              object moves further away from the Lidar sensor, that object needs to be more reflective to
                              be able to get detected by the Lidar sensor. The reason for using a long-range Lidar sensor
                              for this application is due to the lagoon entrance being far from the nearest infrastructure,
                              where the monitoring station is mounted.
                                    For monitoring the entrance, NVIDIA’s Jetson Nano platform acquires Lidar data
                              via Ethernet. The Jetson unit is an edge computing [40] device meaning that it locally
                              performs all computations to extract the topographic profile from raw data. The IMU
                              sensor is connected to the edge computer via USB and outputs the orientation of the Lidar
                              sensor in x, y and z directions. The 4G provides the IoT connectivity for the monitoring
                              setup and automatic data transmission to an external database via MQ Telemetry Transport
                              (MQTT) [41]. The block diagram of a Lidar-based monitoring setup is shown in Figure 5.
                              As part of this monitoring setup, an IoT-based [42] water level sensor is also deployed in
                              the field to obtain water level data of the lagoon. This water level sensor is located next
                              to the static Lidar station. The sensor provides the water level data in the local units of
                              Australian Height Datum (AHD) (m, equivalent to Mean Sea Level (MSL). Moreover, these
                              data also provide the minimum elevation point, for which the subaerial beach profile needs
                              to be calibrated.

                                   Figure 5. Block Diagram of Remote Monitoring Station.

                              3.3. Subaerial Lagoon Entrance Data Extraction and Preprocessing
                                   The beach profile is extracted and analysed with a frequency of about every 3 h.
                              The data acquired from the Lidar contain noise such as people, birds, and high-intensity
                              reflections from objects being too close to the Lidar sensor (as shown in Figure 6A). To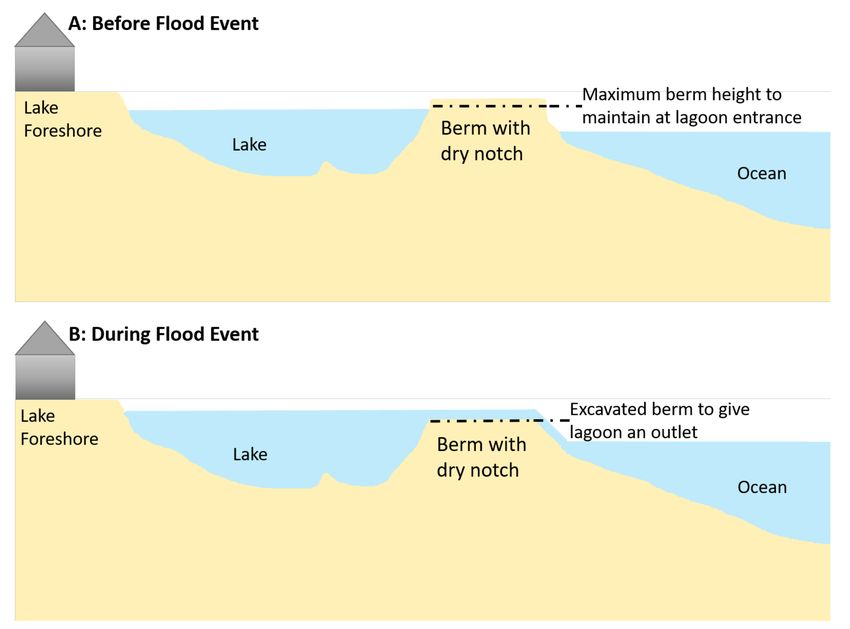
Remote Sens. 2021, 13, 1320                                                                                                   9 of 19

                                 alleviate such noise, several pre-processing steps are required to obtain the subaerial lagoon
                                 profile from the raw 3D-point cloud data. The pre-processing steps are listed as below.

      Figure 6. (A) Raw point cloud data acquired from the LiDAR; (B) Removal of high-intensity noise via thresholding on
      reflectivity values; (C) Output of rotation, translation and down-sampling of the point cloud data; (D) Removing outliers
      and isolated points from resultant point cloud data.

                                 3.3.1. Thresholding on Reflectivity Score
                                      The main source of noise in the data is due to the high-intensity reflections from
                                 objects being too close to the Lidar sensor, which causes the saturation of the returned
                                 signal. Saturated and high-intensity points are then filtered out, based on their reflectivity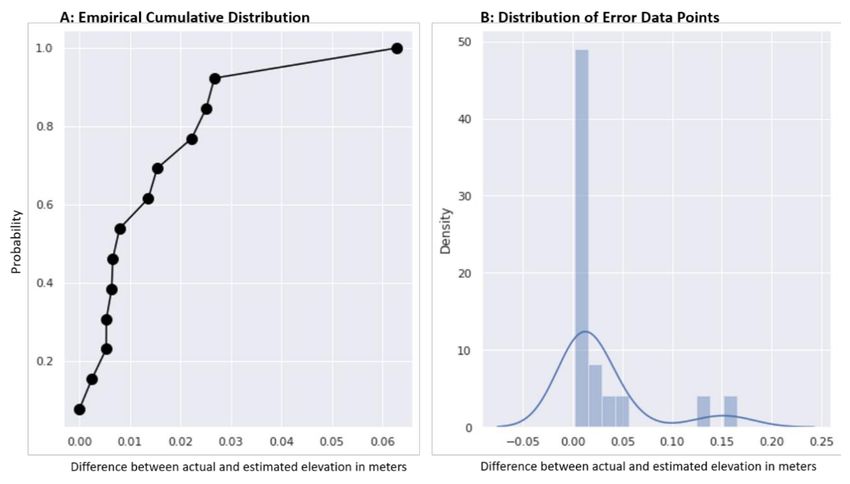
Remote Sens. 2021, 13, 1320                                                                                           10 of 19

                              score. The only points with a reflectivity coefficient value between 5 to 95 percent are stored
                              for further analysis as shown in Figure 6B.

                              3.3.2. Rotation of the Point Cloud Data
                                   Following the thresholding, the 3D-point cloud data are then rotated about the z-axis
                              to represent the coastal elevations in metres. The IMU sensor automates the task of rotation
                              and calibration of the Lidar data. It provides the rotation matrix information, including axis
                              and the angle by which the 3D-point cloud data need to be rotated and this information is
                              also used to counter the vibrations of the Lidar sensor during data acquisition.

                              3.3.3. Translation of Z-Axis
                                   The z-axis (elevation) is then translated to find the correct elevations concerning for
                              the sea level. The mean sea level (MSL) is used as a minimum elevation reference point to
                              translate the elevation data along the z-axis.

                              3.3.4. Down-Sampling of Point Cloud Data
                                   Following the rotation and translation, the next pre-processing step is down-sampling
                              of the point cloud data. As the acquired point cloud data are highly dense; voxel down-
                              sampling [43] is used to uniformly reduce the density of the point cloud data. The algorithm
                              works by bucketing the points into voxels and then extract one point by averaging all the
                              points in that voxel. The size of the voxel is determined by the user and usually depends
                              on the number of points and application. In this case, after data analysis, a voxel size of
                              0.8 cm was selected. This voxel size was selected due to the high-density point cloud data.
                              The reason for choosing a larger voxel size is to reduce the number of points for further
                              processing. The down-sampled point cloud data are shown in Figure 6C.

                              3.3.5. Removing Outliers
                                   The objects and people are then removed via thresholding on the elevation data. To
                              remove birds and other small objects, a radius outlier removal technique [44] is employed
                              to remove isolated points from the subaerial lagoon profile. This filter removes the points
                              that have few neighbouring points around them in each sphere. The parameter which
                              defines the minimum number of points in a given sphere is tuned based on the point cloud
                              density and noise in the acquired data. In this application, the sphere radius is set to 3 m
                              and the minimum number of points is 70. The final 3D-point cloud data are shown in
                              Figure 6D.
                                   It should be noted that, the radius outlier removal technique worked best when
                              compared to other filters such as the statistical outlier removal [45] method due to the
                              continuity of the natural landscape and interesting points being clustered together.

                              3.3.6. Interpolation and Visualization
                                   The interpolation [46] is then performed on spatially unstructured data to uniformly
                              distribute it on the plane. The elevation data are then projected on a plane to form a contour
                              plot [47]. This step is only performed for visualization purposes. The contour plot shown
                              in Figure 7 represents the subaerial beach profile and provides an information about the
                              elevation of the sand berm.
Remote Sens. 2021, 13, 1320 11 of 19
Figure 7. Subaerial Beach Profile; where x-axis represents the width and y-axis represents the depth concern to sensing
station. The elevation data are also shown on the contour plot.
3.4. Extracting the Berm and Dry Notch Heights
Following the subaerial beach profile generation is the estimation of the dry notch loca-
tion and its elevation. The first step to find the location of the dry notch is the identification
of the lagoon entrance in the data (obtained after removing outliers in Section 3.3.5).
As mentioned earlier, the 3D-point cloud data represent the width (x-axis), depth (y-
axis) and elevation (z-axis) of the entrance, and the surrounding area. The Lagoon entrance
can be extracted by finding the continuous stream of points along the x-axis of the Lidar
data divided in a grid of squared windows of size 2 × 3 m2 . For a closed entrance, there
will be no empty windows (refer to Figure 8B). The pseudo-code for extracting the lagoon
entrance is detailed in Figure 8A and extracted lagoon entrance is shown in Figure 8C.Remote Sens. 2021, 13, 1320 12 of 19
Figure 8. (A) Pseudocode to extract the Lagoon Entrance; (B) Gridding of the point cloud data and number of points in
each grid is also shown for the given y-step; (C) Lagoon entrance extracted by following steps shown in (A).
3.5. Berm and Dry Notch
The dry notch height can be determined after the lagoon entrance has been identified.
Estimating the dry notch height requires first determining the berm height. The berm
height is typically classified as the highest point between the two highest elevations points,
whereas the dry notch is normally defined as the lowest elevation point between the two
highest crest points.
For this process, firstly, elevation data (z-axis) are extracted from the 3D-point cloud
data which belongs to the entrance. The acquired elevation data are still dense and noisy.
To alleviate such noise, data are then down-sampled to single decimal point resolution,
i.e., decreasing resolution of points taken for analysis (as shown in Figure 9B). After down-
sampling, maximum elevation points are filtered out in each window. Crests (peaks) and
troughs (minimum dips) are then calculated based on the neighbouring elevation points.
The dry notch is then located, and its elevation can be estimated (as shown in Figure 9B)
and the pseudo-code of this process is shown in Figure 9.Remote Sens. 2021, 13, 1320 13 of 19
Figure 9. (A) Pseudo code for estimating the dry notch height from lagoon entrance; (B) Down-sampled elevation data
versus width. Berm and dry notch estimation from the elevation data by following steps shown in (A).
4. Results
This section compares the proposed approach with the in situ survey conducted on the
29 September 2020. This section is subdivided into two sections, i.e., accuracy comparison
with the in situ survey and berm/dry notch height comparison with the ground truth.
4.1. Accuracy Comparison with In Situ Survey
For comparison purposes, the processed Lidar 3D-point cloud data are compared with
an in situ survey. Root mean square error (RMSE) is used to calculate the error between
Lidar data and the ground truth. RMSE of 12.4 cm was reported during such comparison.
The overlapping points were estimated by using a minimum distance threshold of 4 cm
between both Lidar and survey data. This error can be minimized by using a lower
overlapping distance threshold such as for 1 cm difference the RMSE was reported to be
6.2 cm. A visual comparison of the ground truth and the Lidar data can be seen in Figure 10.
Moreover, the empirical cumulative distribution function shows that 92.3% of the squaredRemote Sens. 2021, 13, 1320 14 of 19
error difference is less than 2.7 between the actual and processed Lidar point as shown in
Figure 11.
Figure 10. Difference between Lidar and in situ survey data in meters.
Figure 11. (A) Empirical Cumulative Distribution of the error; (B) Distribution of the resultant error.
4.2. Berm and Dry Notch Height Comparison between Lidar and In Situ Survey
Berm and dry notch height are then estimated via the algorithm detailed in Figure 9.
These parameters are then compared with the ground truth values acquired from the in
situ survey data. The results are shown in Table 1 and the visual comparison can be seen
in Figure 12. The difference of 4.5 cm was then found between actual berm height andRemote Sens. 2021, 13, 1320 15 of 19
the estimated height from the point cloud data, whereas for dry notch the difference of
1.6 cm was obtained between ground truth and the Lidar data. These small deviations
demonstrate the proposed approach’s potential for lagoon monitoring applications.
Table 1. Comparison of difference between Lidar 3D-point cloud data and ground truth.
Berm Height (m) Dry Notch Height (m)
Lidar 3D-point cloud data 0.685 0.267
Ground Truth from survey data 0.730 0.283
Difference between Lidar data and
0.045 0.016
ground truth
Figure 12. Sand berm height comparison between ground truth and Lidar point cloud data.
5. Discussion
In this paper, a remote sensing-based approach for regular monitoring of estuaries is
presented to counter the flood threat that they pose to the local communities. In addition,
the literature is examined to gain a better understanding of the emerging technologies for
monitoring estuaries. In delivering an early warning and real-time monitoring system,
the literature review has identified a great potential in camera-based remote sensing
approaches such as the ARGUS coastal imaging system [10], surfcams [18], and citizen
scientist project coastsnap [21]. However, for such approaches, requirement of ground
control points for calibration and achieving centimetre level accuracy from computer
vision algorithms are major shortcomings. In addition, both UAV and satellite-based
coastal remote sensing approaches come with the limitations of continuous and real-time
monitoring, respectively. Static Lidar has been used in literature for coastal applications
such as understanding the behaviour of near-shore breaking waves [35], cross-shore 2d
scanning of the dune and for general coastal behaviour applications [10]. However, to the
best of authors’ knowledge, Lidar technology has not been used as early warning system
for managing lagoon entrances.
An initial objective of the project was to estimate the berm height and it was hypothe-
sized that Lidar can be used to extract the topographic information of the lagoon entrance.
The Lidar-based remote-sensor architecture described in this paper is an alternative to anRemote Sens. 2021, 13, 1320 16 of 19
in situ survey and works on the functionality of extracting the elevation data along with
the estimation of parameters related to berm and dry notch. The most important aspect
of this work is that proposed system aims to alert the operator about the conditions of
the entrance based on the calculated information. Another interesting finding was that
the breaching of an entrance is also dependent on the water level in the lagoon and ocean
level. To counter this, an IoT-based water level sensor is also deployed in the lagoon
to monitor the water level. This information along with the topographic profile of the
entrance is also transmitted to a remote database for facilitating local authorities in decision
making process.
The elevation data acquired from static monitoring station are compared with the
in situ survey data in Section 4.1. Comparison reported that 92.3% of the squared error
difference is less than 2.7 cm2 between point cloud data and actual ground truth. For
the presented comparison, overlapping ground truth points and 3D point cloud data are
acquired by using a window size of 1 cm, due to unavailability of exactly overlapping data
points. This error can be reduced if the ground truth points exactly align with the Lidar
3D point cloud data. Moreover, Section 4.2 shows that the error difference for berm and
dry notch height is 4.5 cm and 1.6 cm, respectively. From the presented investigations,
and encouraging results, it is highlighted that Lidar based approach performance was
admissible and has the potential for lagoon monitoring applications.
This research work is unique in-essence of providing a near-real-time monitoring
application of the lagoon entrance. The presented results are notable in terms of the
scalability of the proposed approach and autonomous efficient site monitoring. This paper
further contributes towards the development of a generic framework and algorithm that can
be implemented to other flood prone lagoon entrances. Furthermore, the proposed solution
has the potential to be embedded in an early warning system for providing entrance
parametric information (i.e., berm height, dry notch height) to the human operator and
recommending an optimal time to breach the entrance. Knowing when to dredge the
berm is crucial for effective flood management at lagoon entrances, therefore, the proposed
solution will help protecting local communities residing next to flood-prone areas.
6. Conclusions and Future Work
The effective sand management of closed and open lakes or lagoons (ICOLLs) is
critical to mitigate the impact of future flood events in their neighbourhood. In particular,
if the height of the sand berm of a lagoon entrance is above a threshold determined by
flood engineers, then the local authorities must mechanically break the entrance to allow
the water to flow during extreme weather events. Currently, the height is determined via
infrequent and time-consuming manual surveys. In addition, when there is a high risk of
flood and due to unavailability of data, local authorities may rush towards opening the
entrance while it is unnecessary. This sub-optimal policy increases the number opening
and closing of the entrance which negatively impact on the local biodiversity. Hence,
determining the optimal opening schedule to lower the number of human interventions to
open the entrance will lower the environmental impact.
The monitoring station presented in this paper addresses the issue of autonomous
and on-demand monitoring of the entrance while providing actionable information to
local authorities. The autonomous monitoring station relies on a Lidar facing the coast to
obtain an accurate topographic profile of the lagoon entrance. The Lidar is paired with
an edge computer running a novel algorithm to provide an efficient and flexible way to
continuously monitor the dynamics of berm formations and extract the heights of the berm
and its dry notch from the 3D-point cloud data generated by the Lidar. Thanks to the
inertial measurement unit the solution is self-calibrating. In addition, being solar-powered
and using 4G connectivity for data transmission, the device is fully autonomous and can
be easily deployed to other estuaries.
Moreover, the acquired data from the Lidar are stored in a database and therefore
accessible for future research. These include the development of models to better under-Remote Sens. 2021, 13, 1320 17 of 19
stand coastal erosion, as well as the berm behaviour and evolution during the opening and
closing phases of the entrance. Finally, the device will be paired with other sensors such as
water levels, disdrometers, and automated rain-gauges as well as data sources about the
weather forecast to design complete early flood warning system for the city of Wollongong
(NSW, Australia).
Author Contributions: Conceptualization, B.A. and J.B.; Formal analysis, B.A. and J.B.; Funding
acquisition, P.P.; Investigation, B.A. and J.B.; Methodology, B.A. and J.B.; Software, B.A. and J.B.;
Supervision, J.B. and P.P.; Writing—original draft, B.A.; Writing—review and editing, B.A., J.B. and
P.P. All authors have read and agreed to the published version of the manuscript.
Funding: This work received funding from the Australian Government under the Smart Cities and
Suburbs Program Round 2 Grant number SCS69244.
Data Availability Statement: No new data were created or analyzed in this study. Data sharing is
not applicable to this article.
Acknowledgments: This work was supported by Wollongong City Council in partnership with
Shellharbour, Kiama and Shoalhaven Councils, Lendlease and the University of Wollongong’s
SMART Infrastructure Facility. The authors also gratefully acknowledge the support of NVIDIA
Corporation with the donation of the Titan V used for this research.
Conflicts of Interest: The authors declare no conflict of interest.
References
1. Salameh, E.; Frappart, F.; Marieu, V.; Spodar, A.; Parisot, J.-P.; Hanquiez, V.; Turki, I.; Laignel, B. Monitoring sea level and
topography of coastal lagoons using satellite radar altimetry: The example of the Arcachon Bay in the Bay of Biscay. Remote Sens.
2018, 10, 297. [CrossRef]
2. Roy, P.; Williams, R.; Jones, A.; Yassini, I.; Gibbs, P.; Coates, B.; West, R.; Scanes, P.; Hudson, J.; Nichol, S. Structure and function of
south-east Australian estuaries. Estuar. Coast. Shelf Sci. 2001, 53, 351–384. [CrossRef]
3. Hanslow, D.; Davis, G.; You, B.; Zastawny, J. Berm height at coastal lagoon entrances in NSW. In Proceedings of the Proc. 10th
ann. NSW coast. conf., Yamba, NSW, Australia, 3–5 November 2000.
4. Weir, F.M.; Hughes, M.G.; Baldock, T.E. Beach face and berm morphodynamics fronting a coastal lagoon. Geomorphology 2006, 82,
331–346. [CrossRef]
5. Booysen, Z.; Theron, A.K. Methods for predicting berm height at Temporarily Open/Closed Estuaries. Estuar. Coast. Shelf Sci.
2020, 245, 106906. [CrossRef]
6. Gordon, A.D. Coastal acclimatisation to intermittently open river entrances (IORE). In Proceedings of the Coasts and Ports 2013:
21st Australasian Coastal and Ocean Engineering Conference and the 14th Australasian Port and Harbour Conference, Sydney,
NSW, Australia, 11–13 September 2013; p. 313.
7. Arshad, B.; Ogie, R.; Barthelemy, J.; Pradhan, B.; Verstaevel, N.; Perez, P. Computer Vision and IoT-Based Sensors in Flood
Monitoring and Mapping: A Systematic Review. Sensors 2019, 19, 5012. [CrossRef] [PubMed]
8. Barthelemy, J.; Amirghasemi, M.; Arshad, B.; Fay, C.; Forehead, H.; Hutchison, N.; Iqbal, U.; Li, Y.; Qian, Y.; Perez, P. Problem-
Driven and Technology-Enabled Solutions for Safer Communities: The case of stormwater management in the Illawarra-
Shoalhaven region (NSW, Australia). Handb. Smart Cities 2020, 1–28. [CrossRef]
9. Iqbal, U.; Perez, P.; Li, W.; Barthelemy, J. How Computer Vision can Facilitate Flood Management: A Systematic Review. Int. J.
Disaster Risk Reduct. 2021, 53, 102030. [CrossRef]
10. Splinter, K.D.; Harley, M.D.; Turner, I.L. Remote sensing is changing our view of the coast: Insights from 40 years of monitoring
at Narrabeen-Collaroy, Australia. Remote Sens. 2018, 10, 1744. [CrossRef]
11. Splinter, K.D.; Turner, I.L.; Reinhardt, M.; Ruessink, G. Rapid adjustment of shoreline behavior to changing seasonality of storms:
Observations and modelling at an open-coast beach. Earth Surf. Process. Landf. 2017, 42, 1186–1194. [CrossRef]
12. Splinter, K.D.; Holman, R.A.; Plant, N.G. A behavior-oriented dynamic model for sandbar migration and 2DH evolution. J.
Geophys. Res. Ocean. 2011, 116. [CrossRef]
13. Lippmann, T.C.; Holman, R.A. Quantification of sand bar morphology: A video technique based on wave dissipation. J. Geophys.
Res. Ocean. 1989, 94, 995–1011. [CrossRef]
14. Harley, M.D.; Turner, I.L.; Short, A.D.; Ranasinghe, R. An empirical model of beach response to storms-SE Australia. In
Proceedings of the Coasts Ports: In a Dynamic Environment, Wellington, New Zealand, 16–18 September 2009; pp. 600–606.
15. Beuzen, T.; Splinter, K.; Marshall, L.; Turner, I.; Harley, M.; Palmsten, M. Bayesian Networks in coastal engineering: Distinguishing
descriptive and predictive applications. Coast. Eng. 2018, 135, 16–30. [CrossRef]Remote Sens. 2021, 13, 1320 18 of 19
16. Mole, M.A.; Mortlock, T.R.; Turner, I.L.; Goodwin, I.D.; Splinter, K.D.; Short, A.D. Capitalizing on the surfcam phenomenon: A
pilot study in regional-scale shoreline and inshore wave monitoring utilizing existing camera infrastructure. J. Coast. Res. 2013,
65, 1433–1438. [CrossRef]
17. Bracs, M.A.; Turner, I.L.; Splinter, K.D.; Short, A.D.; Lane, C.; Davidson, M.A.; Goodwin, I.D.; Pritchard, T.; Cameron, D.
Evaluation of opportunistic shoreline monitoring capability utilizing existing “surfcam” infrastructure. J. Coast. Res. 2016, 32,
542–554. [CrossRef]
18. Andriolo, U.; Sánchez-García, E.; Taborda, R. Operational use of surfcam online streaming images for coastal morphodynamic
studies. Remote Sens. 2019, 11, 78. [CrossRef]
19. Sánchez-García, E.; Balaguer-Beser, A.; Pardo-Pascual, J.E. C-Pro: A coastal projector monitoring system using terrestrial
photogrammetry with a geometric horizon constraint. Isprs J. Photogramm. Remote Sens. 2017, 128, 255–273. [CrossRef]
20. Jaud, M.; Kervot, M.; Delacourt, C.; Bertin, S. Potential of smartphone SfM photogrammetry to measure coastal morphodynamics.
Remote Sens. 2019, 11, 2242. [CrossRef]
21. Roger, E.; Tegart, P.; Dowsett, R.; Kinsela, M.A.; Harley, M.D.; Ortac, G. Maximising the potential for citizen science in New South
Wales. Aust. Zool. 2020, 40, 449–461. [CrossRef]
22. Hart, J.; Blenkinsopp, C. Using Citizen Science to Collect Coastal Monitoring Data. J. Coast. Res. 2020, 95, 824–828. [CrossRef]
23. Harley, M.D.; Kinsela, M.A.; Sanchez-Garcia, E.; Vos, K. Shoreline change mapping using crowd-sourced smartphone images.
Coast. Eng. 2019, 150, 175–189. [CrossRef]
24. Liu, Q.; Trinder, J.C.; Turner, I.L. Automatic super-resolution shoreline change monitoring using Landsat archival data: A case
study at Narrabeen–Collaroy Beach, Australia. J. Appl. Remote Sens. 2017, 11, 016036. [CrossRef]
25. Park, S.J.; Achmad, A.R.; Syifa, M.; Lee, C.-W. Machine learning application for coastal area change detection in gangwon
province, South Korea using high-resolution satellite imagery. J. Coast. Res. 2019, 90, 228–235. [CrossRef]
26. Vos, K.; Harley, M.D.; Splinter, K.D.; Simmons, J.A.; Turner, I.L. Sub-annual to multi-decadal shoreline variability from publicly
available satellite imagery. Coast. Eng. 2019, 150, 160–174. [CrossRef]
27. Krause, G. The “Emery-method” revisited—performance of an inexpensive method of measuring beach profiles and modifications.
J. Coast. Res. 2004, 20, 340–346. [CrossRef]
28. Mancini, F.; Dubbini, M.; Gattelli, M.; Stecchi, F.; Fabbri, S.; Gabbianelli, G. Using unmanned aerial vehicles (UAV) for high-
resolution reconstruction of topography: The structure from motion approach on coastal environments. Remote Sens. 2013, 5,
6880–6898. [CrossRef]
29. Mancini, F.; Castagnetti, C.; Rossi, P.; Dubbini, M.; Fazio, N.L.; Perrotti, M.; Lollino, P. An integrated procedure to assess the
stability of coastal rocky cliffs: From UAV close-range photogrammetry to geomechanical finite element modeling. Remote Sens.
2017, 9, 1235. [CrossRef]
30. Marzolff, I.; Poesen, J. The potential of 3D gully monitoring with GIS using high-resolution aerial photography and a digital
photogrammetry system. Geomorphology 2009, 111, 48–60. [CrossRef]
31. Long, N.; Millescamps, B.; Guillot, B.; Pouget, F.; Bertin, X. Monitoring the topography of a dynamic tidal inlet using UAV
imagery. Remote Sens. 2016, 8, 387. [CrossRef]
32. Laporte-Fauret, Q.; Marieu, V.; Castelle, B.; Michalet, R.; Bujan, S.; Rosebery, D. Low-Cost UAV for high-resolution and large-scale
coastal dune change monitoring using photogrammetry. J. Mar. Sci. Eng. 2019, 7, 63. [CrossRef]
33. Turner, I.L.; Harley, M.D.; Drummond, C.D. UAVs for coastal surveying. Coast. Eng. 2016, 114, 19–24. [CrossRef]
34. Liu, J.; Sun, Q.; Fan, Z.; Jia, Y. TOF lidar development in autonomous vehicle. In Proceedings of the 2018 IEEE 3rd Optoelectronics
Global Conference (OGC), Shenzhen, China, 4–7 September 2018; pp. 185–190.
35. Brodie, K.L.; Slocum, R.K.; McNinch, J.E. New insights into the physical drivers of wave runup from a continuously operating
terrestrial laser scanner. In 2012 Oceans; IEEE: Hampton Roads, VA, USA, 2012.
36. Martins, K.; Blenkinsopp, C.E.; Power, H.E.; Bruder, B.; Puleo, J.A.; Bergsma, E.W. High-resolution monitoring of wave
transformation in the surf zone using a LiDAR scanner array. Coast. Eng. 2017, 128, 37–43. [CrossRef]
37. Phillips, M.; Blenkinsopp, C.; Splinter, K.; Harley, M.; Turner, I. Modes of berm and beachface recovery following storm reset:
Observations using a continuously scanning lidar. J. Geophys. Res. Earth Surf. 2019, 124, 720–736. [CrossRef]
38. Brodie, K.L.; Raubenheimer, B.; Elgar, S.; Slocum, R.K.; McNinch, J.E. Lidar and pressure measurements of inner-surfzone waves
and setup. J. Atmos. Ocean. Technol. 2015, 32, 1945–1959. [CrossRef]
39. Allaby, M. A Change in the Weather; Facts on File: New York, NY, USA, 2004; p. 200.
40. Verstaevel, N.; Barthélemy, J.; Forehead, H.; Arshad, B.; Perez, P. Assessing the effects of mobility on air quality: The Liverpool
Smart Pedestrian project. In Proceedings of the Transportation Research Procedia, Mumbai, India, 26–30 May 2019; pp. 2197–2206.
[CrossRef]
41. Standard, O. MQTT Version 5.0. Retrieved June 2019, 22, 2020.
42. Forehead, H.; Barthelemy, J.; Arshad, B.; Verstaevel, N.; Price, O.; Perez, P. Traffic exhaust to wildfires: PM2. 5 measurements with
fixed and portable, low-cost LoRaWAN-connected sensors. PLoS ONE 2020, 15, e0231778. [CrossRef]
43. Miknis, M.; Davies, R.; Plassmann, P.; Ware, A. Near real-time point cloud processing using the PCL. In Proceedings of the 2015
International Conference on Systems, Signals and Image Processing (IWSSIP), London, UK, 10–12 September 2015; pp. 153–156.
44. Zhou, Q.-Y.; Park, J.; Koltun, V. Open3D: A modern library for 3D data processing. arXiv preprint 2018, arXiv:09847.Remote Sens. 2021, 13, 1320 19 of 19
45. Balta, H.; Velagic, J.; Bosschaerts, W.; De Cubber, G.; Siciliano, B. Fast statistical outlier removal based method for large 3D point
clouds of outdoor environments. Ifac-Pap 2018, 51, 348–353. [CrossRef]
46. Ashraf, I.; Hur, S.; Park, Y. An investigation of interpolation techniques to generate 2D intensity image from LIDAR data. IEEE
Access 2017, 5, 8250–8260. [CrossRef]
47. Nelli, F. Python Data Analytics: With Pandas, Numpy, and Matplotlib; Apress: New York, NY, USA, 2018.You can also read