Geo-mapping of COVID-19 Risk Correlates Across Districts and Parliamentary Constituencies in India
←
→
Page content transcription
If your browser does not render page correctly, please read the page content below
Harvard Data Science Review

Geo-mapping of COVID-19
Risk Correlates Across
Districts and
Parliamentary
Constituencies in India
S. V. Subramanian, Omar Karlsson, Weixing Zhang, Rockli Kim

Published on: Sep 21, 2020
License: Creative Commons Attribution 4.0 International License (CC-BY 4.0)
Harvard Data Science Review       Geo-mapping of COVID-19 Risk Correlates Across Districts and Parliamentary Constituencies in India

ABSTRAC T
In the current stage of the COVID-19 pandemic, as countries open up after an extended period of
lockdown, it is important to assure the population that their health is not being sacrificed. In this
article, we develop a geomapping approach to identify high-risk areas by considering four nonclinical
risk correlates for COVID-19. These are population density, percentage of the population that is
exposed to crowding in a household, percentage of the population without access to handwashing
facilities, and percentage of the population over 65 years of age. We provide an empirical proof-of-
concept demonstration for this approach for India at two critical geographic units: districts and
parliamentary constituencies, collectively responsible for policy administration and governance. Our
findings suggest that the geographies of the four nonclinical risk correlates are largely independent of
one another (i.e., at most, there is a small correlation between measures). We avoid applying
differential weights to the four measures or combining these measures into a single index, as there is
an intrinsic rationale for viewing them separately since they represent mostly independent
dimensions of risks that require different responses. Our primary objective was to leverage currently
available data to provide decision makers detailed information and geovisualization, identifying areas
with potentially differential susceptibilities to COVID-19. The information provided here can be used as
a means for further ground verification and, when appropriate, for impact planning and intervention,
as well as providing a rationale for eventual efficacy assessment of different nonpharmaceutical
interventions. While this exercise is primarily descriptive at this stage, the estimates generated are
new, rigorous, and have high relevance for timely policy discussions. We use data from the
Demographic and Health Surveys, which have extensive geographic coverage and high level of
standardizations, making our highly accessible approach easy to extend to other low- and middle-
income countries. We share this conceptualization of geomapping, and all the data and codes used for
this exercise, to encourage wider applications and advancements.

Keywords: Demographic and Health Surveys, public policy, risk correlates, districts, parliamentary
constituencies

1. Introduction
As of September 5, 2020, more than 27 million cases and over 800,000 COVID-19 deaths have been
reported, spanning over 200 countries and territories (Worldometer, 2020). The virus was identified
first in China in December 2019. By February and March 2020, Southern Europe and the Northeastern
United States had emerged respectively as hotspots in what was declared a global pandemic by the
World Health Organization (WHO) on March 11, 2020 (Cucinotta & Vanelli, 2020).

                                                           2
Harvard Data Science Review       Geo-mapping of COVID-19 Risk Correlates Across Districts and Parliamentary Constituencies in India

The high death toll in Europe and the United States may soon be eclipsed if the virus takes hold in low-
and middle-income countries (LMICs) that are far worse equipped to contain the spread of the virus
and treat the seriously ill. Cases and deaths have started to grow rapidly in countries such as Brazil,
Mexico, and India. For instance, India, as of September 5, 2020, has the second-highest number of
confirmed cases (over 4 million cases) and ranks third for the greatest number of deaths (over 70,000)
(Worldometer, 2020). Low capacity to perform large-scale testing is a major problem in India (Zhang et
al., 2020). Since only about 34,000 tests per million inhabitants have been made (which puts India at
number 120 in terms of most testing), most cases in India are likely to be undetected (Worldometer,
2020). Indeed, recent antibody testing has shown that in some places in India, the actual infection rate
could have been 100 to 200 times higher than indicated by the reported cases (Dutta, 2020). A recent
sero-prevalence survey in Delhi found that 23% tested positive for the presence of antibodies to COVID-
19 (Ministry of Health and Family Welfare, 2020a) while to date (September 5, 2020), about 188,000
cases have been identified in Delhi, which has a population of close to 20 million (Ministry of Health
and Family Welfare, 2020b).

Most countries have implemented some version of a national lockdown, where economic and civil life
is severely restricted, to contain and mitigate the morbidity and mortality from COVID-19. India
imposed a 21-day lockdown on March 25, 2020, when nearly all services were suspended and factories
closed (Singh et al., 2020). Empirical support exists, showing that lockdowns in India slowed the
transmission of COVID-19 (Ray et al., 2020). However, as a direct consequence of lockdowns, adding to
the COVID-19 health crisis are a myriad of social ills: a major economic crisis being the most apparent.
Economies around the world are scrambling to ensure the wellbeing of citizens, with the United
States, for example, launching a several-trillion-dollar stimulus package to deal with the economic
hardship that accompanies the pandemic. It has been estimated that up to 70–100 million more people
may be pushed into extreme poverty, globally, during the current crisis—almost half of whom are in
South Asia (World Bank, 2020a). Easing the pain caused by the plummeting economy is even more
urgent in India, where many people are already living in and close to absolute poverty.

These lockdowns have started to be eased in a phased manner in India, as well as elsewhere, and this
calls for various interventions on hygienic practices, health, and social distancing to be designed and
implemented, possibly prioritizing areas that are at relatively elevated risk. In this context, one
approach to provide decision makers with the necessary epidemiologic intelligence to develop a
targeted, evidence-based response is to identify high-risk areas through the geomapping of risk
correlates of COVID-19. The geographic distribution of preexisting clinical conditions (e.g.,
cardiovascular disease, diabetes, chronic respiratory disease, hypertension, and cancer) that are
believed to cause complications from COVID-19 has been mapped in, for example, Sweden (Gémes et
al., 2020) and the United States (Popovich et al., 2020).

                                                           3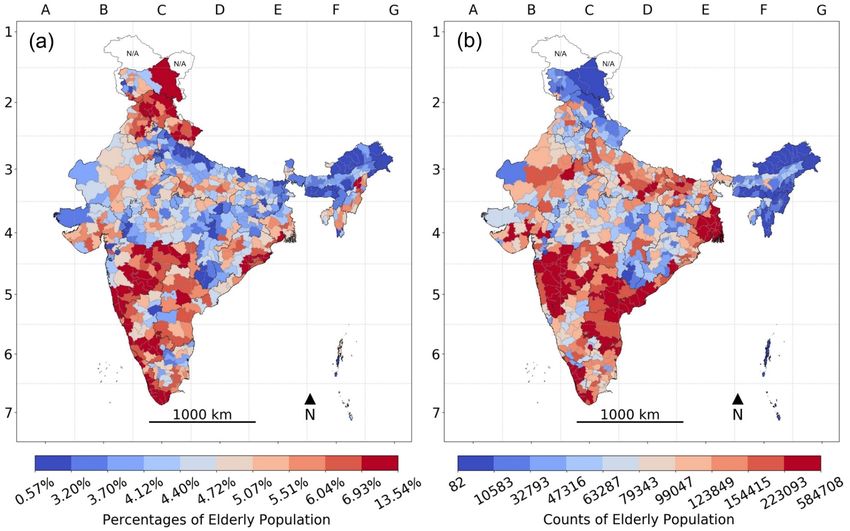
Harvard Data Science Review       Geo-mapping of COVID-19 Risk Correlates Across Districts and Parliamentary Constituencies in India

The need for such an approach is particularly relevant for LMICs, such as India. In addition to mapping
clinical-risk correlates for complications from COVID-19, identifying and preemptively intervening in
areas with high risk for extensive spread of infections may also help avoid some of the pains from the
pandemic. Aiding and intervening in areas with high risk for uncontrolled spread may reduce
mortality and morbidity from COVID-19 itself, especially where health systems cannot be substantially
enhanced in the necessary time frame. This strategy can also reduce the likelihood of another
economic lockdown, which is especially important where economic hardship from strict lockdown can
be particularly devastating in terms of mortality and morbidity, such as in many places in India.

Representative and granular data on the established risk factors for COVID-19 mortality is severely
lacking in India. However, recent large-scale household survey data can be leveraged to map
nonclinical risk correlates for both the spread and severity of COVID-19 infections. The most well-
established, overarching preventive action is the practice of frequent and proper handwashing, both
for protecting individuals and preventing the spread of the virus in the community (Bedford et al.,
2020). Notably, practicing frequent and proper handwashing in many LMICs is not simply a matter of
an individual’s behavior; it is contingent on having the necessary infrastructure in place.

India also has some of the most densely populated places on the planet. Population density
undoubtedly plays a role in the spread of COVID-19, especially in compact areas where many people
come in contact, such as in crowded markets or public transportation (Rocklöv & Sjödin, 2020).
However, since being in the vicinity of an infected person increases the risk of infection, doing so for
extended periods makes an infection closer to guaranteed. Therefore, household crowding, where
many people share a small living space, has emerged as an important risk factor (Pokharel & Roy,
2020). The WHO has deemed with high certainty, that crowding within homes increases the risk for
spreading respiratory infections (WHO, 2018). Crowding may be particularly relevant as a risk factor
in multigenerational households, where old and young share a living space, which is common in India
(International Longevity Centre Global Alliance, 2012). Indeed, centralized quarantine measures in
Wuhan, China, where confirmed and presumptive cases and close contacts were allocated to
centralized facilities, appear to have reduced transmissions within households and communities (Pan
et al., 2020).

The primary goal of this article is to demonstrate the precision geomapping approach by considering
the three nonclinical risk correlates for COVID-19 infection discussed above, density, crowding, and
lack of access to handwashing, in addition to age as a risk factor for COVID-19 mortality, in the context
of India. While this exercise is primarily descriptive and a proof-of-concept at this stage, the estimates
generated are new, rigorous, and have high relevance for timely policy discussions. We share this
conceptualization of geomapping, and all the data and codes used for this exercise, to encourage wider

                                                           4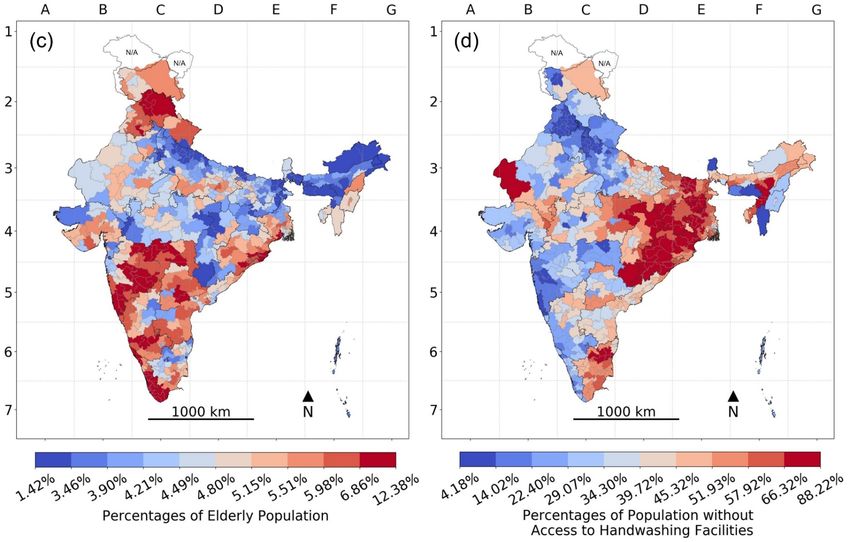
Harvard Data Science Review       Geo-mapping of COVID-19 Risk Correlates Across Districts and Parliamentary Constituencies in India

applications and advancements. Due to the highly standardized nature of the Demographic and Health
Surveys (DHS) data, this exercise can be repeated for over 50 LMICs.

1.1. Geographical Policy Units: Districts and Parliamentary
Constituencies
We considered two separate and independent policy-relevant subnational geographical units of India:
the 640 Districts and the 543 Parliamentary Constituencies (PCs). We calculate population density, the
percentage living in crowded households, the percentage elderly, and the percentage living in
households without basic handwashing facilities, in each district and PC.

Districts represent a critical decentralized unit for administering national and state-based government
programs, including coordinating for program implementation, providing service delivery in primary
and community health centers, collating data, and making plans for budgetary allocation. Inadequacy
in hospital preparedness and infrastructure and shortage of testing facilities are identified as key
challenges in the current pandemic that require urgent responses from district collectors and Indian
Administrative Service officers. The PCs are geographically delineated electoral areas that are distinct
from districts. The constituents (voters) of each PC elect a Member who is expected to represent their
interests in the Parliament of India. Any effective response to COVID-19 would need to be accompanied
by a strong political commitment, and presenting data at this level can empower both the elected
representatives as well as their constituents (Kim et al., 2019).

We hope districts and PCs identified as being ‘high risk’ in this study will be considered for
interventions such as the provision of hand sanitizers or de-densification to help contain the spread of
the virus and spare citizens from suffering severe consequences of COVID-19 as well as COVID-19-
related disruptions.

2. Methods
2.1. Data and Survey Design
We leverage the most recent and reliable data from the fourth National Family Health Survey (NFHS),
conducted in 2015–16. The NFHS is part of the larger DHS (Corsi et al., 2012; International Institute for
Population Sciences [IIPS] & ICF International, 2017), conducted roughly every five years across LMICs,
with a focus on the health of children and women, freely accessible at https://dhsprogram.com after a
simple registration. The DHS is the primary source of data for some of the most important health
indicators, such as child stunting, infant mortality, and maternal health care usage.

The fourth NFHS was implemented by the International Institute for Population Sciences in India,
between January 20, 2015, and December 2, 2016. The NFHS 2015–16 is a national-, state-, and district-
representative household survey (IIPS & ICF International, 2017). The sampling and sample size were

                                                           5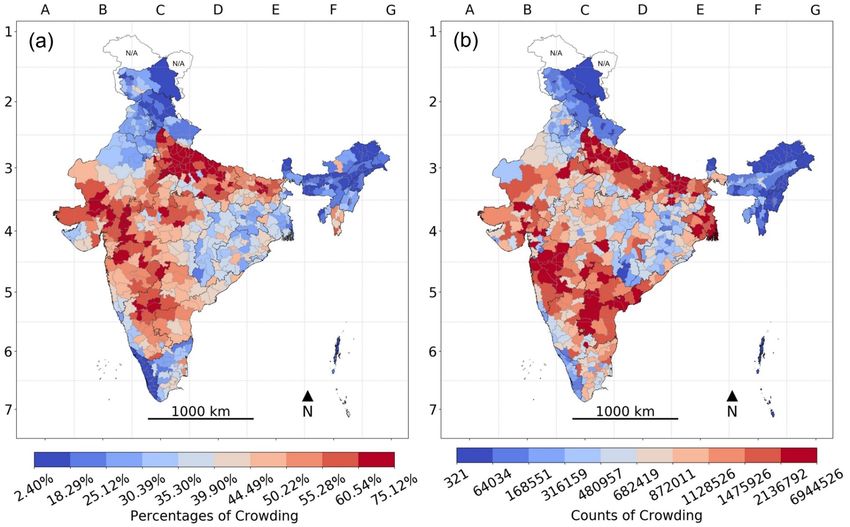
Harvard Data Science Review       Geo-mapping of COVID-19 Risk Correlates Across Districts and Parliamentary Constituencies in India

guided by the need to produce indicators that were representative at the district level (and further by
urban and rural areas within districts where 30–70% of the population is urban, and slum and non-
slum areas in eight cities) (IIPS & ICF International, 2017). The NFHS used a two-stage stratified
sampling design, first stratified by district, divided into urban and rural areas (as well as by social
characteristics in some cases). A sampling frame based on the 2011 census was then used to select
Primary Sampling Units (PSUs), consisting of villages in rural areas and Census Enumeration Blocks
(CEBs) in urban areas. PSUs were selected with a probability proportional to size (PPS). In each PSU,
22 households were randomly selected using systematic sampling (IIPS & ICF International, 2017).

A household questionnaire was used to list all usual members of the household and visitors who stayed
in the household the night before the interview, and to collect basic demographic characteristics,
including age and sex. In addition, the household questionnaire recorded information on
characteristics of the household, including the number of rooms used for sleeping and characteristics
of handwashing facilities. A biomarker questionnaire collected measures of, for example, blood
pressure, random blood glucose level, height, and weight of all women 15–49 years old. Biomarker data
were also collected for all children under 5 years old and a subsample of men, age 15–54. We do not
present health outcomes for neither children, since our focus was on adults, nor men, since data on
men is only representative at the state level, and our focus was on district-level estimates (IIPS & ICF
International, 2017).

2.2. Primary Variables
Population Density. Population Density (hereafter, density) was defined as persons per square
kilometer in each district. Density is likely to play a role, especially in compact areas where many
people come in contact, such as in crowded markets or public transportation (Rocklöv & Sjödin, 2020).

Density was constructed from two district-level variables: total population and total area in square
kilometers. The DHS Program provides georeferenced survey boundaries
(http://spatialdata.dhsprogram.com/), consisting of districts in the case of the NFHS 2015–16 in the
GCS_WGS_1984 coordinate system, that were used to calculate the total area of each district in square
kilometers. The total population of each district was estimated by multiplying the proportion of the
whole sample that was in each district (i.e., the number of individuals in a district as a proportion of
the whole NFHS sample) by the United Nation’s (UN) population estimate (called World Population
Prospects 2019) for midyear 2015 (1,310,152,000). Supplementary Table S1 includes the estimated
proportion of the whole sample in each district, as well as the estimates for population.

Household Crowding. Household Crowding (hereafter, crowding) was defined as the percentage of the
population of a district that lives in households that had more than three people per room for sleeping.
There is no official or universal definition of crowding. However, the WHO suggests defining crowding

                                                           6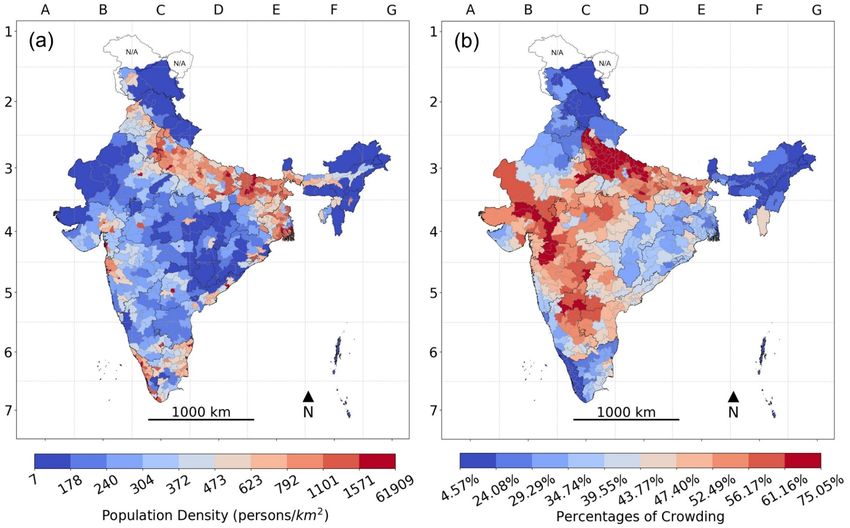
Harvard Data Science Review       Geo-mapping of COVID-19 Risk Correlates Across Districts and Parliamentary Constituencies in India

as more than three people per habitable room, which is similar to our measure (WHO, 2018). Spending
extended periods in close vicinity of an infected person dramatically increases the risk of infection.
Therefore, crowding has emerged as an important risk factor (Pokharel & Roy, 2020). The WHO has
deemed with high certainty that crowding increases the risk for the spread of respiratory infectious
diseases (WHO, 2018). Measures to limit COVID-19 transmission within households appear to have
been effective in Wuhan, China (Pan et al., 2020).

Percentage crowding was estimated using a binary indicator for whether an individual lived in a
crowded household, that was created using two variables from the household questionnaire: the
number of usual household members and visitors and the number of rooms used for sleeping. No
observations were missing for these variables.

Population over 65 Years Old. We used the percentage of the population of a district that was over 65
years old (hereafter, elderly) to measure the concentration of elderly in a district. Being elderly is the
most consistent and highest risk factor for complications from COVID-19. In India, 51.6% of deaths by
May 20, 2020, have been connected to people above the age of 60 (Joe et al., 2020).

The percentage of the population that was elderly was estimated from a binary variable indicating
whether an individual was older than 65 years old, constructed from a question on age from the basic
demographic information in the household questionnaire. Individuals for whom age was unknown
(0.02% of individuals) were excluded.

No Handwashing Facilities. We defined lack of access to handwashing facilities (hereafter, no
handwashing) as the percentage of the population of a district with no access to basic handwashing
facilities at home, including soap and water, based on the WHO definition (https://washdata.org/).
According to the U.S. Centers for Disease Control and Prevention (CDC), “[k]eeping hands clean is one
of the most important steps we can take to avoid getting sick and spreading germs to others” (CDC,
2018). The coronavirus has been shown to linger on surfaces for hours or even days (CDC, 2020).
Respiratory droplets can also get on hands, for example, after coughing. Handwashing prevents germ
from entering the body when people touch their eyes, nose, and mouth, as well as food and drinks
(CDC, 2018).

The percentage of the population without basic handwashing facilities was estimated using three
questions from the household questionnaire: (i) whether a handwashing facility was observed in the
dwelling, (ii) whether water was present at the handwashing facility, and (iii) whether soap or
detergent was present at the handwashing facility. A binary variable was constructed from these
variables, coded as 1 if the handwashing facility was not observed (2.63% of individuals) or if there was
either no water (14.6% of individuals in households with observed handwashing facilities) or no soap
(36.1% of individuals in households with observed handwashing facility) present, and 0 otherwise.

                                                           7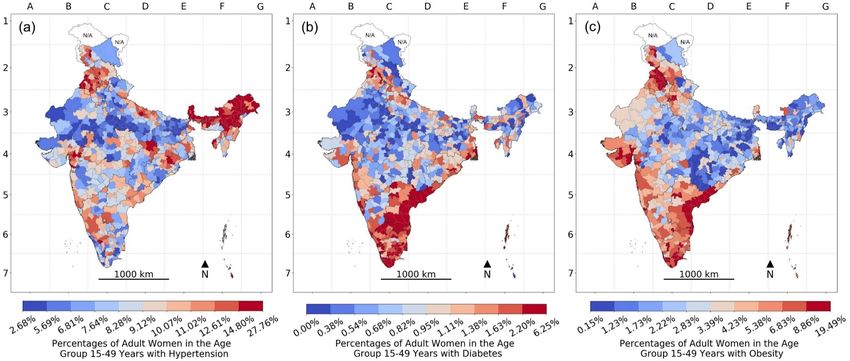
Harvard Data Science Review       Geo-mapping of COVID-19 Risk Correlates Across Districts and Parliamentary Constituencies in India

Observations for whom handwashing was not observed because interviewers did not get permission to
see (0.36% of individuals) or for some other unspecified reason (0.24% of individuals) were excluded
from the analysis.

2.3. Illustrative Variables Measuring Preexisting Health Conditions
The biomarker questionnaire collected measures of blood pressure (using an Omron Blood Pressure
Monitor), random blood glucose level (from a finger-stick blood specimen using the FreeStyle Optium
H glucometer with glucose test strips), height (in mm using a Seca 213 stadiometer), and weight (in
grams using a Seca 874 digital scale) (IIPS & ICF International, 2017).

Hypertension was defined as the percentage of women in a district that had systolic blood pressure
>140 mm Hg or diastolic blood pressure >90 mm Hg. Implausible values for blood pressure were
excluded (i.e., systolic blood pressure above 250 or below 60, or diastolic blood pressure above 140 or
below 40) (Cheng et al., 2016).

Diabetes was defined as the percentage of women in a district that had opportunistic fasting (8 hours)
glucose level ≥126 mg/dL or random glucose level ≥200 mg/dL (CDC, 2019).

Obesity was defined as the percentage of women in a district with ≥30 Body Mass Index (BMI,
measured as weight in kilograms divided by the square of her height in meters) (WHO, 2020).
Observations with implausible height or height-for-weight were excluded (i.e., beyond six standard
deviations below or above a normative median) (Pullum, 2008). Women who were pregnant or did not
know whether they were pregnant were excluded (4.42% of women 15–49 years old) for all measures
of preexisting health conditions. Missing values were more common for hypertension, diabetes, and
obesity than our four main measures (Supplementary Table S2).

2.4. Sample Coverage and Size
Data collection was completed in 28,522 out of 28,586 selected PSUs, and the response rate was 97.6%
for households (IIPS & ICF International, 2017). Response rates typically exceed 90% in the DHS (Coris
et al., 2012). In total, information was collected from 601,509 households. The household questionnaire
recorded 2,801,958 usual members and 67,085 visitors, including 749,344 women 15–49 years old who
were eligible for a biomarker questionnaire. Supplementary Table S2 shows the total number of
observations in each district as well as missingness for all our measures. The DHS does not impute
missing values, except variables related to dates and ages for key individuals (women and children)
(Croft et al., 2018). The NFHS 2015–16 was conducted under multiple levels of supervision, and
monitoring and use of computer-assisted personal interviewing allowed IIPS to run extensive daily
data-quality checks (IIPS & ICF International, 2017).

                                                           8
Harvard Data Science Review Geo-mapping of COVID-19 Risk Correlates Across Districts and Parliamentary Constituencies in India
2.5. Data Analysis
Our four primary measures (i.e., density, crowding, elderly, and no handwashing) are estimated using
individuals (i.e., usual household members and visitors) as the unit of analysis. They, therefore, refer
to the entire population (that resides in a household) in each district. All percentage measures were
defined as the percentage of the total population of a district experiencing each outcome: for example,
the number of people that are elderly as a percentage of the total number of people in the district. All
variables are negatively coded, so a higher value, in terms of percentages or density, means higher
risk. We do, however, mostly discuss our results in terms of deciles for each of the risk correlate,
whereby the 640 districts of India were divided into 10 equally sized groups of 64 districts each,
according to the magnitude of each variable (i.e., higher decile means worse outcomes or higher risk).
Finally, we ascertained which districts rank in the highest 10%, 20%, 30%, 40%, or 50% on all four
nonclinical risk correlates.
We also estimate the absolute counts, in terms of the number of people that the risk percentages
translate to, in each district: that is, the absolute number of elderly people, people without access to
handwashing facilities, and number of people staying in crowded households in each district. In order
to estimate the counts, we first create a categorical variable for each measure, where each category
indicates being in a specific district AND experiencing the risk factor. An additional category contains
all individuals who do not experience the risk factor. This gives 641 categories, 640 for individuals in
each district that experience the outcome, and one category for individuals that do not experience the
outcome (in any district). The proportion of the whole NFHS sample in each category was then
estimated. The proportions estimated for the 640 categories representing each district are then
multiplied by the UN midyear 2015 population estimate to obtain the number of people experiencing
each risk factor in each district. Supplementary Table S1 includes estimated proportions of all
individuals experiencing the respective primary (nonclinical) risk factors that are in each district,
which was used to construct our count measures. This approach provides a straightforward way to
obtain standard errors and limits the use of external data.
Missingness was rare for our main variables (0–0.60%), and therefore we did not impute missing
values. All estimates are weighted using sampling weights and cluster–robust standard errors were
adjusted for intragroup correlation within households (i.e., Eicker-Huber-White standard errors). All
analysis was done using Stata 14.
We also estimated the percentage of nonpregnant women 15–49 years old in each district that were
found to have hypertension, diabetes, and obesity, respectively, using the above procedures.
9Harvard Data Science Review Geo-mapping of COVID-19 Risk Correlates Across Districts and Parliamentary Constituencies in India
2.6. Developing Estimates for Parliamentary Constituencies
To transform district-level data to generate PC-level estimates of the percentage measures for
crowding, elderly, and no handwashing, we applied a methodology previously developed to build a
crosswalk between districts and PCs in India (Blossom et al., 2019; Kim et al., 2019; Swaminathan et al.,
2019). Detailed methodology and validation of this crosswalk have been published elsewhere (Blossom
et al., 2019; Swaminathan et al., 2019). The shapefiles for 640 districts as per the census 2011 and 543
PCs as per the year 2014 were obtained from the Community Created Maps of India (CCMA) project:
https://github.com/datameet/maps/tree/master/Districts and
https://github.com/datameet/maps/tree/master/parliamentary-constituencies, respectively.
The GIS Intersect command was used to identify the segments of districts that fall in each PC. For each
intersected polygon, the population size was calculated by performing an ArcGIS Zonal Statistics
overlay with the intersected shapefile and the AsiaPop 2015 population raster. The calculated
population size for each intersected polygon was divided by the total population of the district to
determine the percentage of district population in each intersected polygon. Each district-level
variable of interest (for example, percentage without access to handwashing facilities) was multiplied
by the total district population to produce an estimated number of individuals in each district without
access to handwashing facilities. Estimates of individuals in each intersected segment without access
to handwashing facilities were then produced by further multiplying the percentage of the district
population contained in each intersected segment. Aggregating data on the intersected segments
nested within each PC, total individuals without access to handwashing facilities were divided by the
total population in each PC to produce PC-level estimates of percent without access to handwashing
facilities. Similar procedures were applied to all the nonclinical risk-correlates. Population density for
PCs was estimated by using the area of a PC and its population from the 2011 India census.
2.7. Compliance With Ethical Standards
The NFHS data were not collected specifically for this study, and no one on the study team has access to
identifiers linked to the data. These activities do not meet the regulatory definition of human subject
research. As such, an institutional review board (IRB) review is not required. The Harvard Longwood
Campus IRB allows researchers to self-determine when their research does not meet the requirements
for IRB oversight via guidance online regarding when an IRB application is required using an IRB
Decision Tool. The ICF International IRB and IIPS IRB approved data collection procedures, and
questionnaires and the U.S. CDC reviewed protocols (IIPS & ICF International, 2017).
2.8. Data Sharing
The data produced in the study will be available on the Harvard Dataverse repository (also in
Supplementary Table S1 for all estimates with standard errors and Supplementary Tables S3–S6 for
point estimates) as part of our commitment to the open science community and society. We do not have
10Harvard Data Science Review Geo-mapping of COVID-19 Risk Correlates Across Districts and Parliamentary Constituencies in India
permission to share the NFHS 2015–16 household survey on which our data is based—the survey is,
however, freely available after a simple registration at https://dhsprogram.com/. The shapefile used
for calculating the area for population density as well as to make the maps is freely available at
https://spatialdata.dhsprogram.com/.
3. Results
3.1. Distribution of Nonclinical Risk Correlates
In India overall, the mean population density was 416 people per square kilometer. Five percent
(standard error [SE] 0.02) of India’s population were elderly, 44% (SE 0.1) lived in crowded households,
and 40% (SE 0.1) did not have a handwashing facility at home.
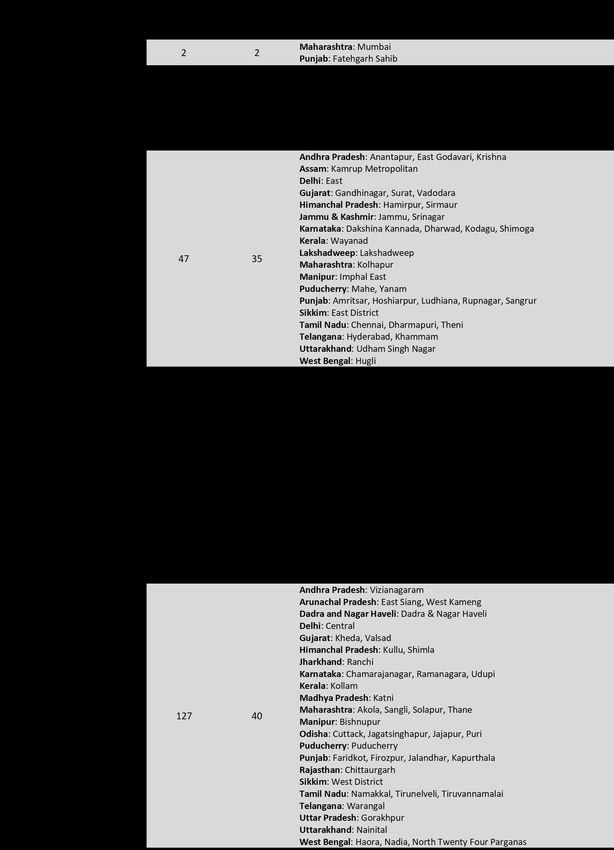
Across districts, density per square kilometer ranged from 0.4 to 52598 (Figure 1). Population density
was highly right-skewed; while 608 (95%) of districts had around 1,800 people per square kilometer or
less, 10 districts (1.6%) had between around 10,000–52,000 people per square kilometer. Crowding,
across districts, ranged between 2% and 75% (Figure 2). A wide variation across districts was observed
for the prevalence of individuals who did not have access to a handwashing facility (range 2%-88%,
Figure 3), while elderly concentration ranged from 1% to 14% (Figure 4).
11Harvard Data Science Review Geo-mapping of COVID-19 Risk Correlates Across Districts and Parliamentary Constituencies in India
Figure 1. Histogram for population density across 640 districts in India, 2016. In Figure 1, the histogram for population
density across 640 districts in India, 2016, the distribution of population density is highly skewed and therefore plotted here on a
log 10 scale. For ease of interpretation, the height of each bar indicates the number of districts in each bin. (The histograms in this
article use different ranges and different bin widths for best individual visual effect. Their total areas are, therefore, not the same,
and they should not be used for comparative purposes.)
12Harvard Data Science Review Geo-mapping of COVID-19 Risk Correlates Across Districts and Parliamentary Constituencies in India
Figure 2. Histogram for percentage crowding across 640 districts in India, 2016.
13Harvard Data Science Review Geo-mapping of COVID-19 Risk Correlates Across Districts and Parliamentary Constituencies in India
Figure 3. Histogram for percentage with no handwashing across 640 districts in India, 2016.
14Harvard Data Science Review Geo-mapping of COVID-19 Risk Correlates Across Districts and Parliamentary Constituencies in India
Figure 4. Histogram for percent elderly across 640 districts in India, 2016.
District-level correlations among these non-clinical risk factors were weak and mostly negative; for
instance, the strongest observed correlation was negative and between percentage elderly and no
handwashing (r = -0.2; 95% CI: -0.273 to -0.124), and the weakest were between percentage crowding
and population density (r = 0.06; 95% CI: -0.014 to 0.141). For our percentage measures, districts varied
the least on percent elderly and varied the most with regards to no handwashing facilities. Smaller
inter-district differences for percentage elderly suggest that for this critical indicator, it is harder to
discriminate one district from another than for no handwashing, crowding, and density.
15Harvard Data Science Review Geo-mapping of COVID-19 Risk Correlates Across Districts and Parliamentary Constituencies in India
3.2. District Geographies of Nonclinical Risk Correlates
All nine districts comprising the state of Delhi were among those ranked in the top 10% (i.e., top 64
districts) according to the highest population density in India (Figure 5). All four districts comprising
the state of Puducherry were among the 10% most densely populated districts. The two single districts
making up the states Chandigarh and Lakshadweep, respectively, were also among the top 10%
according to population density. Bihar had 15 out of its 38 districts among the top 10% according to
population density. The state of West Bengal had 7 out of its 19 districts among the top 10%.
16Harvard Data Science Review Geo-mapping of COVID-19 Risk Correlates Across Districts and Parliamentary Constituencies in India
Figure 5. Population density (persons/square kilometer) across Districts in India, 2016.
Note: The color gradient of darkest blue to darkest red represents the decile distribution from the lowest to the highest on the
risk correlate; areas with unavailable data are marked N/A on the map.
Districts with a high percentage of people living in crowded households tended to be more spread
across the country, except for the Himalayan north and northeastern India, as compared to the
geography of density (Figure 6). Over half of the 64 districts comprising the top 10% of districts
17Harvard Data Science Review Geo-mapping of COVID-19 Risk Correlates Across Districts and Parliamentary Constituencies in India
according to the percentage of people living in crowded households were in the state of Uttar Pradesh:
that is, 34 out of the 71 districts comprising the state. Thirteen of those 34 districts also ranked in the
top 10% according to the number of people living in crowded households (and 20 districts in total). In
Bihar, four out of its 38 districts ranked in the top 10% according to the percentage living in crowded
households, while 13 of the state’s districts ranked in the top 10% according to the number of people
living in crowded households. None of the 13 districts in Andhra Pradesh and none of the 19 districts in
West Bengal ranked in the top 10% according to percentage living in crowded households, while five
districts in both states in total ranked in the top 10% according to how many people lived in crowded
households. Maharashtra had six of its 35 districts in the top 10% according to percentage living in
crowded households and four of those (and 11 in total) were in the top 10% according to the number of
people living in crowded households.
Figure 6. Household Crowding across Districts in India, 2016: (a) Percentage population exposed to crowding and (b) their
absolute counts.
Note: The color gradient of darkest blue to darkest red represents the decile distribution from the lowest to the highest on the risk
correlate; areas with unavailable data are marked N/A on the map.
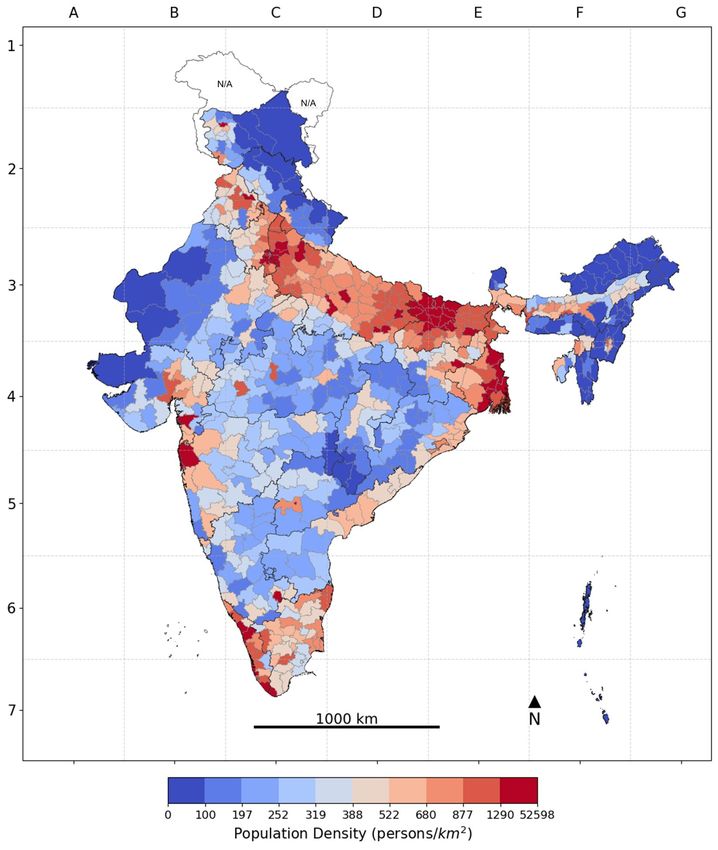
In Odisha, 19 out of the state’s 30 districts were in the top 10% according to the percentage of people
living in households without a basic handwashing facility, although only one of those districts (and one
in total) was also in the top 10% according to the number of people living in households without basic
handwashing facilities (Figure 7). Similarly, in Jharkhand, 15 out of the 24 districts in the state were in
the top 10% according to the percentage living in households without handwashing facilities, although
only one of those (and one in total) was in the top 10% according to the number of people without
18Harvard Data Science Review Geo-mapping of COVID-19 Risk Correlates Across Districts and Parliamentary Constituencies in India
handwashing facilities. Tripura had two out of its four districts in the top 10% according to percentage
without handwashing facilities, while none were in the top 10% according to the number of people
without handwashing facilities. Six out of the 38 districts in Bihar were in the top 10% according to
percentage without handwashing facilities, while two of those (and 18 in total) ranked in the top 10%
according to the number of people living in households without basic handwashing facilities. In West
Bengal, three out of the 19 districts comprising the state were in the top 10% according to percentage
without handwashing facilities, and all three districts (and 15 in total) were in the top 10% according to
the number of people without handwashing facilities. None of the 13 districts in Andhra Pradesh were
in the top 10% according to percentage without handwashing facilities, while eight of the state’s
districts were in the top 10% according to the number of people without handwashing facilities.
Figure 7. Access to Handwashing Facilities across Districts in India, 2016: (a) Percentage with no handwashing facilities
and (b) their absolute counts.
Note: The color gradient of darkest blue to darkest red represents the decile distribution from the lowest to the highest on the risk
correlate; areas with unavailable data are marked N/A on the map.
In Kerala, 9 out of 14 districts were in the top 10% according to percentage elderly, and six of those
districts (and eight in total) were in the top 10% according to the number of elderly people (Figure 8).
Maharashtra had 15 out of its 35 districts in the top 10% according to percentage elderly, while seven of
those districts (and 15 in total) were in the top 10% according to the number of elderly people. Goa had
one of its two districts in the top 10% according to percentage elderly, while neither district was in the
top 10% according to the number of elderly people. None of the 13 districts in Andhra Pradesh were in
the top 10% according to percentage elderly, while the number of elderly people was in the top 10% in
19Harvard Data Science Review Geo-mapping of COVID-19 Risk Correlates Across Districts and Parliamentary Constituencies in India
eight districts in the state. Similarly, only one out of the 19 districts comprising West Bengal were in the
top 10% according to percentage elderly, while it had 11 districts in total in the top 10% according to the
number of elderly people.
Figure 8. Elderly across Districts in India, 2016: (a) Percentage elderly population and (b) their absolute counts.
Note: The color gradient of darkest blue to darkest red represents the decile distribution from the lowest to the highest on the risk
correlate; areas with unavailable data are marked N/A on the map.
The geographical patterns of the prevalence of nonclinical risk correlates observed for the PCs were
similar to those observed for districts in India (Figures 9a–9d). We did not estimate the absolute counts
of the population exposed to each risk correlate for the PCs due to data-related assumptions. We
present this mainly as an additional data resource for policymakers and elected officials (also see
Supplementary Table S5).
20Harvard Data Science Review Geo-mapping of COVID-19 Risk Correlates Across Districts and Parliamentary Constituencies in India
Figure 9. Parliamentary Constituencies in India, 2016: (a) Population density (persons/square kilometer) and (b) percent
crowding. (c) percent elderly population and (d) percent population without access to handwashing facilities.
Note: The color gradient of darkest blue to darkest red represents the decile distribution from the lowest to the highest on the risk
correlate; areas with unavailable data are marked N/A on the map.
21Harvard Data Science Review Geo-mapping of COVID-19 Risk Correlates Across Districts and Parliamentary Constituencies in India
3.3. Identifying Districts With Multiple Nonclinical Risk Correlates
We ascertained which districts rank in the highest 10%, 20%, 30%, 40%, or 50% on all 4 nonclinical risk
correlates (Table 1). There were no districts whereby all four nonclinical risk correlates were in the top
two deciles (top 20%) of the risk-correlate distribution for all measures. Thiruvarur in Tamil Nadu had
all four risk correlates in the top 30% of the decile distribution. There were additionally seven and 33
districts, mainly from the states of Bihar, Uttar Pradesh, Odisha, and Andhra Pradesh, whereby all
four nonclinical risk correlates were in the top 40% and 50%, respectively (Table 1). Note that we
observe fewer districts in the respective quantiles on all measures than would be expected by chance,
since there is a small negative correlation in four out of six pairwise correlations between our four
measures.
Table 1. Districts Where the Nonclinical Risk Correlates Were All in the Top Half of the
Specif ic Decile Distribution of Each Variable (Based on Percentages Except for the Population
Density Risk Correlate)
3.4. Geographic Distribution of Clinical Risk Correlates for Adult
Women 15–49y Across Districts: An Empirical Illustration
As described earlier, due to data limitations, it was not possible to estimate district-specific data on the
percentage for clinical risk correlates of COVID-19. However, to illustrate the value of our geomapping
approach, we provide a brief illustration by geomapping available clinical risk correlates related to
hypertension, diabetes, and obesity across districts. It should be noted that the estimates presented here
only apply to adult women between ages 15–49 years in the district, and not the entire district population.
22Harvard Data Science Review Geo-mapping of COVID-19 Risk Correlates Across Districts and Parliamentary Constituencies in India
Nationally, 9% (SE 0.05) of adult women in India had hypertension, 1% (SE 0.02) had diabetes, and 5%
(SE 0.05) were obese.
The estimates for clinical risk correlates of COVID-19 for this sample varied across districts but to a
different extent: for women suffering from hypertension, districts varied the most, followed by
obesity and diabetes (Figures 10–12). Differences in variability across measures are not an indication of
the importance of these measures for the spread and seriousness of COVID-19. Rather, it suggests that
for certain measures with low variability, it is harder to prioritize one area over another (or prioritize
vulnerable areas).
Figure 10. Histogram for percentage hypertension across 640 districts in India, 2016.
23Harvard Data Science Review Geo-mapping of COVID-19 Risk Correlates Across Districts and Parliamentary Constituencies in India
Figure 11. Histogram for percentage diabetes across 640 districts in India, 2016.
24Harvard Data Science Review Geo-mapping of COVID-19 Risk Correlates Across Districts and Parliamentary Constituencies in India
Figure 12. Histogram for percentage obesity across 640 districts in India, 2016.
Districts with high prevalence (i.e., percentage) of hypertension among women were concentrated in
the northeastern region of India and the state of Punjab (Figure 13a). Meanwhile, the prevalence of
diabetes and obesity were mainly concentrated across the districts in the states of Andhra Pradesh and
Tamil Nadu (Figures 13b, 13c). Indeed, this pattern was also observed in the high correlation between
diabetes and obesity (r = 0.68; 95% CI: 0.64 to 0.72), and low correlation between both obesity and
hypertension (r = 0.1; 95% CI: 0.03 to 0.18) as well as hypertension and diabetes (r = 0.1; 95% CI: 0.02 to
0.17), at the district-level.
25Harvard Data Science Review Geo-mapping of COVID-19 Risk Correlates Across Districts and Parliamentary Constituencies in India
Figure 13. Clinical Risk Correlates for Adult Women 15–49y Across
Districts in India, 2016: Percent adult women in the age group 15–49
years with (a) hypertension, (b) diabetes, and (c) obesity.
Note: The color gradient of darkest blue to darkest red represents the
decile distribution from the lowest to the highest on the risk correlate;
areas with unavailable data are marked N/A on the map.
Examining districts that are high-risk areas across all three clinical risk correlates, we observed that
Mumbai (Maharashtra) and Fatehgarh Sahib (Punjab) are the only two districts in the top 10% of
decile distribution on hypertension, diabetes, and obesity (Table 2). Additionally, there were 12
districts in the top 20% from the states of Gujarat, Himachal Pradesh, Jammu and Kashmir, Karnataka,
Maharashtra, Punjab, Tamil Nadu, and West Bengal (Table 2). In total, there were 127 districts in the
top 50% of hypertension, diabetes, and obesity.
Table 2. Districts Where the Clinical Risk Correlates Were All in the Top Half of the Specif ic
Decile (Based on Percentages) Distribution of Adult Women in the Age Group 15–49 Years
26Harvard Data Science Review Geo-mapping of COVID-19 Risk Correlates Across Districts and Parliamentary Constituencies in India
27Harvard Data Science Review Geo-mapping of COVID-19 Risk Correlates Across Districts and Parliamentary Constituencies in India
4. Discussion
Our goal was to utilize readily available survey data and leverage the cross-sectional geographic
patterning and variation in known COVID-19 risk correlates. We identify Indian districts that are
vulnerable to the spread of coronavirus due to high population density, the percentage of people living
in crowded households, and the percentage of people without access to basic handwashing facilities in
their homes. We also identify districts that further risk a high burden of deaths from COVID-19,
indicated by the percentage of elderly in a district. We note in which districts the number of people
living in crowded households, number of people without handwashing facilities, and number of
elderly people was relatively high, although naturally that is a function of district’s population size to a
large extent.
4.1. Data Quality Considerations
We will now discuss the data limitations from the perspectives of the data source, the measure of
variables, and variable selection.
First, it is worth noting that a source of bias is related to the time elapsed between the current crisis
and the collection of our data. However, the NFHS 2015–16, the main data source in this study, is the
most recent and reliable data on demographic characteristics of the Indian population. Further,
comparisons are being made between districts within India using deciles, and major changes in the
relative distribution of these measures are unlikely. The response rates of the NFHS 2015–16 data are
high at 97%. The rate of nonresponse for our four primary variables is low (0–0.6%).
Second, the following are the data limitations in the measure of variables (i.e., population density,
crowding, elderly, and no handwashing). (1) Population density is calculated using population
estimates and area of a district, using a shapefile supplied by the DHS, and is not likely to be a major
source of bias. We validate our population data using gridded (three arcs) total population data from
the WorldPop (https://www.worldpop.org/), summed up for districts using the district shapefile
provided by the DHS, and the 2011 Indian census. We find that the correlation between the population
numbers we estimated using NFHS and the WorldPop data was 0.98, and 0.99 for the 2011 census
(https://censusindia.gov.in/). The ratio of our district population estimates to the WorldPop population
estimates and the 2011 census was 0.98 and 1.05, respectively, on average. This ratio did, however,
range from 0.27 to 2.70 between districts for the WorldPop population estimates, and 0.32 and 2.76 for
the 2011 census. Our population estimates being based on a household survey may explain some of
these differences. However, accurate population numbers are hard to obtain for India in general: we
also observe discrepancies between 2011 WorldPop population estimates and the 2011 census. These
differences should be kept in mind when viewing population density as well as our count measures,
and therefore we mostly discuss results in terms of relative numbers (i.e., deciles). (2) Variables from
household surveys are known to have certain biases, such as recall bias. However, our measure of
28Harvard Data Science Review Geo-mapping of COVID-19 Risk Correlates Across Districts and Parliamentary Constituencies in India
household crowding is not subject to recall bias; (3) because it is measured using a listing of all usual
household members and visitors that spent the night before the interview in the household, and the
interviewer asks the respondent how many rooms in the household are used for sleeping. Our
measure for the elderly population is constructed from the age reporting of usual household members
and visitors. In some contexts, age heaping and digit preference for ages ending in 0 or 5 is a problem
in the DHS surveys. This problem was, for example, apparent in the household questionnaire for the
NFHS 2005–06 survey while, paradoxically, not a problem in the individual female, male, or child
questionnaires (Pullum & Staveteig, 2017). This suggests the source of bias was on the interviewer’s
behalf, who may have paid more attention to age reporting during individual interviews. In our data,
the NFHS 2015–16, the problem of age heaping was addressed frequently during fieldwork, using a
standard set of field-checks (IIPS & ICF International, 2017). (4) Our measure for no handwashing is
observed by the interviewer at the time of the survey, rather than being reported by the respondent,
so systemic bias is unlikely and recall bias is absent.
Third, it is hard to validate the choice of our variables as risk correlates of COVID-19 even though they
were based on their overall public health significance for the spread of many infectious diseases. We
should note that it is possible for the districts identified as being high risk based on our chosen
variables while not being exactly the same as districts where COVID-19 case statistics appear to be
high. The latter was largely a function of who is being tested and, until recently, there was a clear
eligibility criterion for who is being tested, that is, at-risk population and population with known
exposure (Indian Council of Medical Research, 2020; Sudan & Bhargava, 2020). Indeed, it is the
absence of a random-sample based population-level surveillance of COVID-19 that motivated us to do
this study (Subramanian & James, 2020). These limitations do not diminish the value of our work,
which identifies geographic patterns in well-established nonclinical risk factors of COVID-19. Similar
efforts were made for Sweden (Gémes et al., 2020) and the United States (Popovich et al., 2020).
4.2. Interpreting Districts—Parliamentary Constituencies Estimates
We should note that the geographic patterning of all the measures across districts is not entirely
distinct from the geographic patterning seen across PCs. This overlap is an expected result as the
districts and PCs are not identical but also not entirely different. For instance, 28 PCs have identical
district and PC boundaries: Araria, Gopalganj, Begusarai, Arrah (Bhojpur), and Nalanda in the state of
Bihar; Surguja in the state of Chhattisgarh; Jamnagar, Sabar Kantha, and Anand in the state of Gujarat;
Jamshedpur (Purbi Singhbhum) in Jharkhand, Bijapur, and Davanagere in the state of Karnataka;
Chhindwara in Madhya Pradesh; Jajapur and Sundargarh in the state of Odisha; Jalandhar in Punjab;
Kanniyakumari, Krishnagiri, and Thoothukkudi in state of Tamil Nadu; Rampur, Shahjahanpur,
Mathura, Domriaganj (Siddarth Nagar), Firozabad, Maharajganj, Mirzapur, Fatehpur, and Unnao in
the state of Uttar Pradesh.
29Harvard Data Science Review Geo-mapping of COVID-19 Risk Correlates Across Districts and Parliamentary Constituencies in India
Despite the similarity in geographic patterning for districts and PCs, providing separate estimates for
PCs is important because they are geographically delineated areas whose population democratically
elect a Member who represents that population in the Parliament of India. Any effective response to
COVID-19 would need to be accompanied by a political commitment, and presenting data at this level
can empower both the elected representatives as well as their constituents. For sanitation-related
practices, for example, the role of the key electoral and political unit of PCs can be more important as
discussed in a recent study assessing the performance of India’s Swachh Bharat Mission, which
prioritized the coverage of household toilets and the supply of potable water (Chatterjee et al., 2019).
Similarly, communication messages around handwashing behaviors can be delivered more effectively
by political workers as opposed to administrators.
4.3. Comment
We suggest viewing each of the four main measures separately and for its own intrinsic relevance.
First, the four measures have at most weak and usually negative correlations with each other and,
therefore, may represent four unique dimensions of risks related to COVID-19. Second, the differences
in the relative importance of these as risk factors for COVID-19 is still unknown. Third, these four
measures are likely to operate differently and require different responses and interventions: density
puts many strangers in contact for a relatively short duration and spreads the infections mostly among
strangers, which can be reduced by limiting the use of public spaces, by the use of masks, and by strict
hygiene; household crowding spreads infections between family members who are in contact for a
long duration of time, which can be reduced by offering centralized quarantines to infected household
members; lack of access to handwashing facilities increases the risk of catching the virus from
infected surfaces, which can be improved by distributing hand sanitizers; and being elderly is the
biggest risk factor for mortality from COVID-19, which can be reduced by sheltering the elderly
population.
The health care system in India is ill-prepared to treat the seriously sick: the pressure on the health
care system spiked well beyond normal capacity in rich countries that spend almost 20 to 40 times
more on health care and have 3 to 6 times more hospital beds than India (World Bank, 2020b). Most
deaths from COVID-19 are among the elderly. While the Indian population is young, many are
undernourished and unhealthy (World Bank, 2020b), and it is still unknown whether such deprivation
exacerbates complications from COVID-19 in younger people. While the percentage elderly is low in
India relative to Europe and the United States, age is an important risk factor for death from COVID-19
in India as well (Joe et al., 2020). Although only around 6% of India is 65 years or older, this translates
to over 84 million individuals, compared to just under 52 million (16%) in the United States and 90
million (20%) in the European Union (World Bank, 2020b).
30Harvard Data Science Review Geo-mapping of COVID-19 Risk Correlates Across Districts and Parliamentary Constituencies in India
Empirical evidence shows large variations in state-level developments of the COVID-19 pandemic (Basu
et al., 2020). As efforts to contain the pandemic continue, from expanding testing to developing
vaccines, the epidemiologic knowledge on differential susceptibilities to COVID-19 can be immediately
leveraged to develop a geographic-based precision policy strategy for an impact planning for COVID-19.
The current article demonstrates the importance of geomapping of nonclinical risk factors of COVID-19
in India to identify areas with potentially differential susceptibilities. This exercise is performed
under various time and data constraints, as discussed above, and is not meant to be considered as the
only evidence for impact planning and intervention. Rather, we share this as a proof-of-concept and
both data and code to invite further improvements and updates and potential applications to other
contexts, which is facilitated by the extensive geographic coverage and high level of standardization of
the DHS surveys. Further, as data from serological surveys and more accurate estimates for COVID-19
deaths start giving a clearer picture of the spread of the diseases in LMICs, this exercise provides a
basis for testing the importance of different nonclinical risk factors.
Disclosure Statement
This research was funded by Bill & Melinda Gates Foundation, INV-002992.
Acknowledgments
The authors would like to thank the Demographic and Health Surveys program for making the fourth
National Family Health Survey data freely accessible.
References
Basu, D., Salvatore, M., Ray, D., Kleinsasser, M., Purkayastha, S., Bhattacharyya, R., & Mukherjee, B.
(2020). A comprehensive public health evaluation of lockdown as a non-pharmaceutical intervention
on COVID-19 spread in India: National trends masking state level variations. medRxiv.
https://doi.org/10.1101/2020.05.25.20113043
Bedford, J., Enria, D., Giesecke, J., Heymann, D. L., Ihekweazu, C., Kobinger, G., Lane, H. C., Memish,
Z., Oh, M.D., Sal, A.A., Schuchat, A., Ungchusak, K., & Wieler, L. H. (2020). COVID-19: towards
controlling of a pandemic. The Lancet, 395(10229), 1015–1018. https://doi.org/10.1016/S0140-
6736(20)30673-5
31You can also read