Regional inequality in the Janani Suraksha Yojana coverage in India: a geo-spatial analysis
←
→
Page content transcription
If your browser does not render page correctly, please read the page content below
Mishra et al. International Journal for Equity in Health           (2021) 20:24
https://doi.org/10.1186/s12939-020-01366-2

 RESEARCH                                                                                                                                           Open Access

Regional inequality in the Janani Suraksha
Yojana coverage in India: a geo-spatial
analysis
Prem Shankar Mishra1 , Pradeep Kumar2                          and Shobhit Srivastava2*

  Abstract
  Introduction: Although India has made significant progress in institutional delivery after the implementation of the
  National Rural Health Mission under which the Janani Suraksha Yojana (JSY) is a sub-programme which played a
  vital role in the increase of institutional delivery in public facilities. Therefore, this paper aims to provide an
  understanding of the JSY coverage at the district level in India. Further, it tries to carve out the factors responsible
  for the regional disparity of JSY coverage at district levels.
  Methods: The study used the National Family Health Survey data, which is a cross-sectional survey conducted in
  2015–16, India. The sample size of this study was 148,145 women aged 15–49 years who gave last birth in the
  institution during 5 years preceding the survey. Bivariate and multivariate regression analysis was used to fulfill the
  study objectives. Additionally, Moran’s I statistics and bivariate Local Indicator for Spatial Association (LISA) maps
  were used to understand spatial dependence and clustering of JSY coverage. Ordinary least square, spatial lag and
  spatial error models were used to examine the correlates of JSY utilization.
  Results: The value of spatial-autocorrelation for JSY was 0.71 which depicts the high dependence of the JSY
  coverage over districts of India. The overall coverage of JSY in India is 36.4% and it highly varied across different
  regions, districts, and even socioeconomic groups. The spatial error model depicts that if in a district the women
  with no schooling status increase by 10% then the benefits of JSY get increased by 2.3%. Similarly, if in a district the
  women from poor wealth quintile, it increases by 10% the benefits of JSY also increased by 4.6%. However, the
  coverage of JSY made greater imperative to understand it due to its clustering among districts of specific states
  only.
  Conclusion: It is well reflected in the EAGs states in terms of spatial-inequality in service coverage. There is a need
  to universalize the JSY programme at a very individual level. And, it is required to revisit the policy strategy and the
  implementation plans at regional or district levels.
  Keywords: Janani Suraksha Yojana, Spatial analysis, LISA, India

* Correspondence: shobhitsrivastava889@gmail.com
2
 International Institute for Population Sciences, Mumbai, Maharashtra 400088,
India
Full list of author information is available at the end of the article

                                        © The Author(s). 2021 Open Access This article is licensed under a Creative Commons Attribution 4.0 International License,
                                        which permits use, sharing, adaptation, distribution and reproduction in any medium or format, as long as you give
                                        appropriate credit to the original author(s) and the source, provide a link to the Creative Commons licence, and indicate if
                                        changes were made. The images or other third party material in this article are included in the article's Creative Commons
                                        licence, unless indicated otherwise in a credit line to the material. If material is not included in the article's Creative Commons
                                        licence and your intended use is not permitted by statutory regulation or exceeds the permitted use, you will need to obtain
                                        permission directly from the copyright holder. To view a copy of this licence, visit http://creativecommons.org/licenses/by/4.0/.
                                        The Creative Commons Public Domain Dedication waiver (http://creativecommons.org/publicdomain/zero/1.0/) applies to the
                                        data made available in this article, unless otherwise stated in a credit line to the data.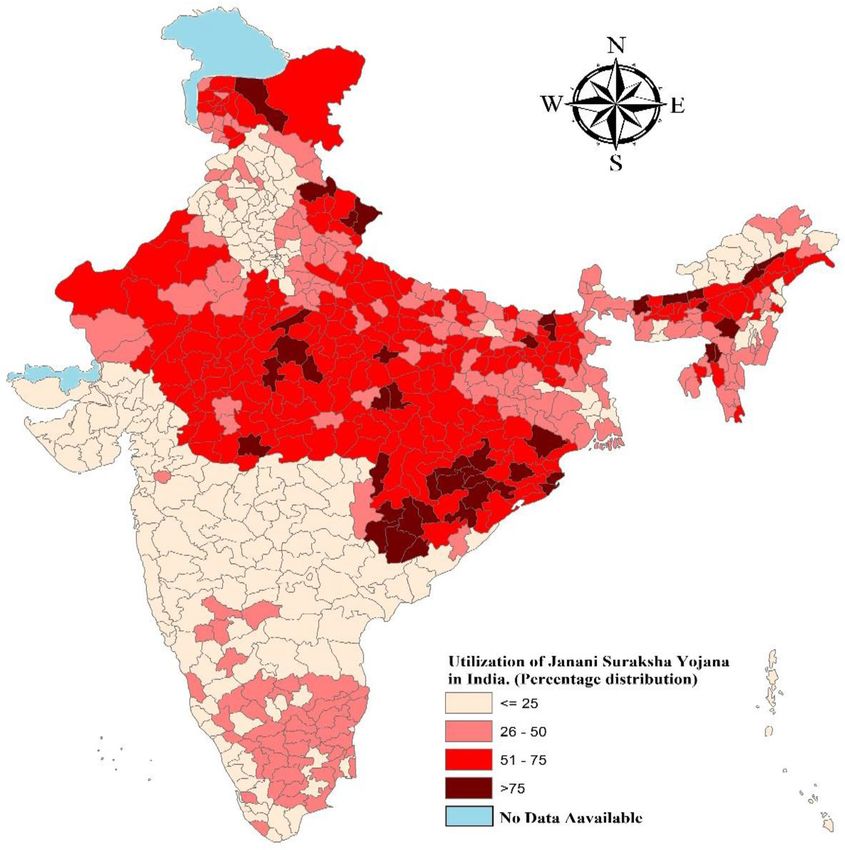
Mishra et al. International Journal for Equity in Health   (2021) 20:24                                                     Page 2 of 14

Introduction                                                              inequity and fostering health equality development by
Despite given efforts by international, national, and local               promoting institutional delivery, the Janani Suraksha
governments and agencies, the utilization status of ma-                   Yojana (JSY) or ‘Safe Motherhood scheme’ was intro-
ternal and child health (MCH) care services is still low                  duced in 2005, under the National Rural Health Mission
in many developing countries, including India [1–6]. Al-                  (NRHM), in which the poor and marginalized women
though India has made considerable progress in redu-                      are provided with an incentive for delivering their child
cing maternal mortality through the interventions of                      in public health facilities. It is a conditional cash transfer
different health policies and programs, the national rural                scheme to promote institutional delivery in order to re-
health mission (NRHM) is one of them and act as man-                      duce mother and child deaths [22, 28].
dating multi-strategic programme interventions to pro-                       The economic burden is one of the most important
mote health care accessibility while reducing health                      factors that restrict poor pregnant women from deliver-
inequity across the groups [7, 8], however, kinds of lit-                 ing their childbirth at health institutions [28–32]. Fur-
erature show that the effectiveness and efficiency of the                 ther, socio-economically vulnerable and marginalized
programs are not the same across socio-economic                           women also suffer from multiple deprivations/vulner-
groups and regions that led to slow, uneven and unequal                   abilities in seeking maternal health care services, such as
distribution of health and health care practices [9–13].                  prenatal, natal, post-natal care, and child immunization
Further, a large proportion of women and children in                      [25–27, 32–34]. The JSY scheme is one of the most far-
low-and middle-income countries are still, not covered                    reaching demand-side financing programs in the world
under the essential health care services [13–18] and par-                 [12, 21, 35]. And, it is associated with increasing institu-
ticularly those who are from the poor and marginalized                    tional delivery among the most deprived groups of
groups of the communities [10, 19, 20]. India is also fa-                 people. Further, it has significantly improved institu-
cing the same issue of health inequality, and even worse                  tional delivery in the low performing states (EAGs
in the case of MCH care services [8, 20, 21].                             states) in the last one decade 2005–2015, however, the
   Furthermore, in India, huge health disparities exist                   state and regional level variations still continue to persist
across different socio-economic groups, regions, states,                  [20, 21, 23, 24, 35–38].
and districts level among women and children. And it is                      The provision of conditioning JSY cash payment scheme
due to low accessing and under-utilizing of maternal                      to all pregnant women is marked as an irregularity to the
and child health care services [22]. States like Uttar Pra-               beneficiaries and it has been found that after a decade of
desh, Bihar, Madhya Pradesh, Rajasthan, Jharkhand,                        implementation of the JSY scheme, a huge gap persists in
Chhattisgarh, Uttarakhand, and Odisha are going                           terms of coverage and utilization [5, 7, 38], not only across
through tremendous inequality in accessing equitable                      socio-economic groups but also at regional and district-
health care services [11, 22, 23]. These states are also to-              levels [7, 20, 35]. Several studies found that the increasing
gether named as EAGs (Empowered Action Group)                             trend of inequity and inequality in access to JSY services
states, with low performing in socio-economic and                         and its coverage has created policy concerns [7, 8, 20, 29];
health indicators, and that eventually lead to high ma-                   therefore, it requires putting forth many questions against
ternal and child mortality compared to other states                       the policies and programme for its overall coverage [4, 7].
[17, 22–27].                                                              Further, there is also supply-side barriers women face in
   Further, higher maternal mortality rates and its varia-                accessing JSY services [6]. Women belong to a marginal-
tions across socio-geographical regions show that there                   ized and disadvantaged community are unable to meet the
is inaccessibility, unavailability, and unaffordability of es-            required MCH services available in the public domains in
sential maternity services that lead to under-utilization                 India [29, 32, 34, 39], although the community health
of MCH services among the poor and marginalized                           workers (CHWs) are the key to improve the service cover-
women [17, 19]. For example, institutional delivery is an                 age in the community, however, there are evidences show
important maternity care service that prevents maternal                   that CHWs are biased in providing healthcare services in
and neonatal mortality. In India, still, 21% of childbirth                the community across the social groups [27, 39, 40]. The
delivery occurs at home [23]. Although, institutional de-                 literature also shows that there is a significant variation in
livery in India has increased to 79% in 2015 from 39% in                  coverage of health policy and programs interventions
2005; however, still, the gap has remained wide and per-                  across the communities due to unawareness and lack of
sistent across socio-economic groups, regions, and states                 knowledge [5, 20, 34, 41]. Due to the policy coverage gap
[23]. For example, women belong to a higher wealth                        and lack of programme effectiveness across the groups, re-
quintile have gone to 95% of institutional delivery as                    gions, and states have made substantial increments in the
compared to 60% of a lower wealth quintile mothers.                       health disparity. It is evident in the study conducted by
Similar differences can also be found in mother’s educa-                  Vellakkal et al., that the use of JSY conditioning cash
tion levels [23]. Therefore, for plummeting health                        transfer during pregnancy is varied considerably across
Mishra et al. International Journal for Equity in Health   (2021) 20:24                                                     Page 3 of 14

socio-economic groups, and not all eligible women get ac-                 Government of India. The survey provides detailed in-
cess to it [34]. Moreover, it also varies across geographic               formation on population, fertility, family planning, re-
regions and states in India [6, 20, 22]. Spatial disparity                productive right and health issue, HIV/AIDS, gender
matters in the MCH services coverage and its utilization                  issues, women empowerment, and domestic violence.
[23, 42–45]. Studies show that there is a strong correlation              NFHS used a two-stage stratified sampling design in
between the proximate determinants of spatial clustering                  both rural and urban areas to give the estimates at state
and service coverage [43–45].                                             [46] as well as district level (640). In rural areas, villages
  As it was found that a huge gap persists in the JSY                     were selected in the first stage using a Probability Pro-
coverage across various socio-economic groups, states,                    portional to Size (PPS) scheme. In the second stage, 22
and regions of India. Therefore, this paper aims to pro-                  HHs were selected using systematic sampling. In urban
vide an understanding of the JSY coverage at the district                 areas, census enumeration blocks (CEBs) were selected
level. Moreover, it tries to carve out the factors respon-                in the first stage using the PPS scheme, and in the sec-
sible for regional disparity for JSY coverage at the dis-                 ond stage, 22 HHs were selected using systematic sam-
trict level. The study hypothesized that there was no                     pling. The detailed methodology and complete
spatial auto-correlation between JSY coverage and dis-                    information on the survey design and data collection
tricts of India.                                                          published elsewhere [23]. The survey collected informa-
                                                                          tion from 601,509 households, 699,686 women, and 112,
Janani Suraksha Yojana (Safe Motherhood Programme)                        122 men for the response rate of 98%, 97%, and 92% re-
India has launched several health policies and programs                   spectively. The study restricts sample size (n=148,145) to
to protect mother and child health and to improve their                   the women aged 15–49 years who gave last birth in the
survival. India’s flagship scheme of JSY launched in 2005                 institution during 5 years preceding the survey.
under the auspicious program of the National Rural
Health Mission (NRHM) with a particular focus on re-                      Outcome variable
ducing maternal and infant mortality through promoting                    The outcome variable for the analysis is the coverage
antenatal, natal, and postnatal care. JSY is a safe mother-               (percentage) of the JSY scheme. The question was asked
hood intervention under the NRHM being implemented                        to the women ‘did you receive any financial assistance
with the objective to reduce maternal and neonatal mor-                   for delivery care? Further, the question was asked ‘from
tality by promoting institutional delivery among poor                     where did you get assistance? The responses were (a).
pregnant women. It is a 100% centrally sponsored                          Janani Suraksha Yojana (JSY), (b). Other Government
scheme and it integrates cash assistance with delivery                    Schemes, (c). Other. For the analysis purpose, the study
and post-delivery care [22]. It is a conditioning cash-                   made a dichotomous variable and which was coded as 1
incentive scheme that promotes pregnant women to de-                      ‘Yes (received JSY assistance)’ and 0 ‘No (did not re-
liver their children at public health institutions. Since, in             ceived JSY assistance)’.
India, one-fifth of childbirths still take place at home de-
livery [23]. It ensures safe delivery to all women who be-                Independent variable
long to Scheduled Castes, Scheduled Tribes, and those                     The predictor variables for this study were women’s age,
women who are living below the poverty line (BPL) with                    meeting with community health worker (CHW), educa-
the age of 19 years and above during delivery. The                        tion of the women, the wealth of the households, caste,
ASHA as a community health worker (Accredited Social                      religion, mass media exposure and place of residence.
Health Activist) acts as an intermediate person to track                  Age of the women was divided into two categories: less
from pregnancy to childbirth and postnatal care in the                    than 25 years and 25 years or more. Meeting with com-
community in this scheme. In this way, ASHA is en-                        munity health worker (CHW) was coded as ‘yes’ and
gaged with the JSY scheme to set up a linkage between                     ‘no’. Women’s educational level was categorized as no
the government health system and the beneficiary                          education and educated. A household wealth index was
woman [22]. Each beneficiary registered under this                        calculated in the survey by combining household amen-
scheme must have a JSY card along with an MCH card.                       ities, assets and durables and characterizing households
                                                                          in a range varying from the poorest to the richest, corre-
Methods                                                                   sponding to wealth quintiles ranging from the lowest to
The data from the National Family Health Survey round                     the highest. Further, the study grouped wealth of the
four (NFHS-4) was used to understand the spatial pat-                     household into two categories such as poor (included
tern and correlates affecting the JSY service utilization in              poorest and poorer) and non-poor (included middle,
India. NFHS is a cross-sectional national representative                  richer, and richest). Place of residence was given as rural
survey, conducted in 2015–16 under the stewardship of                     and urban in the survey. Caste was divided into two cat-
the Ministry of Health and Family Welfare (MoHFW),                        egories: Scheduled Caste/Scheduled Tribe and other
Mishra et al. International Journal for Equity in Health (2021) 20:24 Page 4 of 14
(included other backward class caste group). Religion Value of Moran’s- I ranges from − 1 (indicating perfect
was categorized as Hindu and non-Hindu (including dispersion) to + 1 (perfect correlation). A zero value in-
Christian, Sikh, Buddhist/Neo-Buddhist, Jain, Jewish, dicates a random spatial pattern. Negative (positive)
Parsi/Zoroastrian, no religion, and other). Women’s ex- values indicate a negative (positive) spatial autocorrel-
posure to mass media: how often they read newspapers, ation. Positive autocorrelation indicates that points with
listened to the radio and watched television; responses similar attribute values are closely distributed in space,
on the frequencies were: almost every day, at least once whereas negative spatial autocorrelation indicates that
a week, less than once a week, or not at all; women were closely associated points are more dissimilar [45, 48, 50,
considered to have any exposure to mass media if they 51].
had exposure to any of these sources and as having no Univariate LISA calculates the spatial-correlation of
exposure if they responded with ‘not at all’ for all three neighborhood values around the specific spatial location
sources of media [44, 47]. [51]. It determines the extent of spatial randomness and
clustering present in the data. The measure [Ii] is given
Statistical analysis by the following:
Bivariate and multivariate logistic regression analysis was
used to analyze the data. Additionally, for spatial analysis n: xi − X
Univariate LISA : I i ¼ 2 Σ j wij x j − X
in terms of coverage of JSY among women in India uni- Σi xi − X
variate and bivariate Moran’s I index measurements
were used along with the usage of spatial regression Bivariate Local Indicator of Spatial Association (LISA)
models [48]. Spatial auto-correlation is being measured measures were estimated to analyze the association of
by using Moran’s I statistics. Spatial autocorrelation rep- certain characteristics of regions with JSY coverage. The
resents the extent to which data points are similar or bivariate LISA presented as below:
dissimilar to their spatial neighbours [49–51].
n: xi − X
Univariate Moran’s I measure the spatial auto- Bivariate LISA : I i ¼ 2 Σ j wij yi − Y
correlation of neighborhood values around a specific Σi yi − Y
spatial location. It determines the extent of spatial non-
stationary and clustering present in the data. Bivariate Four types of spatial auto-correlation were generated
based on the four quadrants of Moran’s I scatter plots
Moran’s I examine the local correlation between an out-
come variable and certain characteristics of the region. which are defined as follows:
While both univariate and bivariate Moran’s I aim to
Hot Spots: districts with high values, with similar
measure similarities and dissimilarities of spatial data,
they are found to be less useful in case of uneven spatial neighbors (High-High).
Cold Spots: districts with low values, with similar
clustering [48, 51]. The formula to calculate the Moran’s
neighbors (Low-Low).
I statistic is as follows:
Spatial Outliers: districts with high values, but with
low-value neighbors (High-Low) and districts with
n Σi Σ j W ij xi − X x j − X
Univariate Moran’s I ¼ 2 low values, but with higher values of neighbors
SO Σi xi − X (Low-High).
Where x is the variable of interest and X is the mean The spatial weights Wij are non-zero when i and j are
of x; n is the number of spatial units; Wij is the standard- neighbors, else it remains zero [49, 50]. The weight used
ized weight matrix between observation i and j with zer- in the analysis is Queen Contiguity weights which repre-
oes on the diagonal; and SO is the aggregate of all spatial sents whether spatial units share the boundary or not. If
weights, i.e. SO = ΣiΣjWij the set of boundary points of unit I is denoted by the
band (i), then the Queen Contiguity Weight is defined
by:
n Σi Σ j W ij xi − X Y j − Y
Bivariate Moran’s I ¼ 2 1; bnd ðiÞ∩bnd ð jÞ≠∅
SO Σi y − Y Wij ¼
i 0; bnd ðiÞ∩bnd ð jÞ≠∅
Where x and y are the variables of interest; X is the However, this allows the possibility that spatial units
mean of x; Y is the mean of y; n is the number of spatial share only a single boundary point (such as a shared cor-
units; Wij is the standardized weight matrix between ob- ner point on a grid of spatial units). Hence a stronger
servation i and j with zeroes on the diagonal; and SO is condition is to require that some positive portion of their
the aggregate of all spatial weights, i.e. SO = ΣiΣjWij. boundary be shared.Mishra et al. International Journal for Equity in Health (2021) 20:24 Page 5 of 14
In order to determine the significant correlates of Table 1 Socio-demographic profile of the study population in
coverage of Janani Suraksha Yojana (JSY) in India, a set India, 2015–16
of regression models had been used. The spatial ordinary Variables N=148,185
least square (OLS) regression model was used to see the (n(weighted %))
extent of autocorrelation in the error term. Since the Received Janani Suraksha Yojana
OLS confirmed spatial autocorrelation in its error term No 84,520 (63.6)
for the dependent variable, we further estimated the
Yes 63,665 (36.4)
spatial lag model (SLM) and spatial error model (SEM)
[48, 50]. The underlying assumption of a spatial lag Age (in years)
model is that the observations of the outcome variable Less than 25 50,485 (36.1)
are affected in the neighborhood areas whereas the 25 or more 97,700 (63.9)
spatial error model is used to consider the effect of those Met with CHW
variables which are absent in the regression model but No 70,723 (48.1)
had an effect on the outcome variable. The basic differ-
Yes 77,462 (51.9)
ence between the two models is that the spatial lag
model unlike the spatial error model does not consider Educational level
the spatial dependence of the error term. No schooling 33,814 (21.6)
The basic equation for OLS is as follows: Educated 114,371 (78.4)
Caste
Y ¼ α þ ΒX þ Ɛ
Scheduled Caste/Scheduled Tribe 51,896 (31.0)
Where Y is the outcome variable, X is the vector of Non-Scheduled Caste/Scheduled Tribe 90,060 (69.0)
predictor variables and α is the model intercept and β is Religion
the corresponding coefficient vector.
Hindu 111,810 (80.6)
The spatial lag model suggests that the units are
spatially dependent on each other and lagging to each in Non-Hindu 36,375 (19.4)
the nearby spatial locations [48, 51]. A typical spatial lag Wealth quintile
model can be written as follows: Poor 59,298 (37.6)
X Non-poor 88,887 (62.4)
Yi ¼ δ W ij Y j þ βX j þ ε j
j≠1
Mass media exposure
No exposure 29,725 (19.0)
Here Yi denotes the JSY coverage for the ith district, δ Some exposure 118,460 (81.0)
is the spatial autoregressive coefficient, Wij denotes the
Place of residence
spatial weight of proximity between district i and j, Yj is
the JSY coverage in the jth district, βj denotes the coeffi- Urban 42,215 (33.1)
cient, Xj is the predictor variable and εj is the residual. Rural 105,970 (66.9)
The spatial error model, on the other hand, considers % percentage, N Sample, CHW Community health worker
the contribution of omitted variables that are not in-
cluded in the model but can have a significant effect in 36.4% of women in India got benefited from Janani Sur-
the analysis [51]. A Spatial Error Model (SEM) is aksha Yojana (JSY). About 68.9% of women were aged
expressed as follows: 25 years and more. Nearly, 51.9% of women met com-
X munity health worker (CHW). Of the total women se-
Y i ¼ βX j þ λ Wij Y j ε j þ εi
j≠1
lected, 21.6% were having no schooling. Every 3 in 10
women were from the Scheduled Caste/Scheduled Tribe
Here, Yi denotes the JSY coverage for the ith district, λ caste category. About 8 in 10 women were from the
is the spatial autoregressive coefficient, Wij denotes the Hindu religion. About 37.6% of women belonged to the
spatial weight of proximity between district i and j, Yj is poor wealth quintile and 19% of women had no media
JSY coverage in the jth district, βj denotes the coefficient, exposure. Further, about 67% of women belonged to
Xj is the predictor variable and εi is the residual. rural areas in India.
Table 2 depicts bivariate and logistic regression ana-
Results lysis to find an association between JSY and background
Background analysis factors in India, 2015–16. Women aged 25 years and
Table 1 represents the socio-economic profile of the more were 6% significantly more likely to receive the
study population in India. As per 2015–16 estimates, benefit of JSY (OR: 1.06; p< 0.01) than women aged 24Mishra et al. International Journal for Equity in Health (2021) 20:24 Page 6 of 14
Table 2 Results from bivariate and logistic regression analysis years or less. Women who met CHW were 71% signifi-
for JSY utilization by background factors in India, 2015–16 cantly more likely to receive the benefit of JSY (OR:
Variables JSY (%) OR (95% C.I.) 1.71; p< 0.01) than women who did not met CHW.
Age (in years) Women who were educated, they were having signifi-
Less than 25 36.6 Ref. cantly lower odds for receiving JSY benefits in reference
to women who had no schooling (OR: 0.80, p< 0.01).
25 or more 36.3 1.06***(1.03–1.08)
Odds for JSY benefits were higher among women from
Met with CHW
the Scheduled Caste/Scheduled Tribe category than
No 29.7 Ref. women from non-Scheduled Caste/ Scheduled Tribe
Yes 42.6 1.71***(1.67–1.75) (OR: 0.80, p< 0.01). Women from the non-Hindu reli-
Educational level gion were 25% significantly less likely to receive benefits
No schooling 51.4 Ref. from JSY in comparison to women from the Hindu reli-
gion (OR: 0.75, p< 0.01). Women from non-poor wealth
Educated 32.3 0.78***(0.76–0.81)
quintiles were 52% significantly less likely to receive JSY
Caste
benefits in comparison to women from the poor wealth
Scheduled Caste/Scheduled Tribe 44.3 Ref. quintile (OR: 0.48, p< 0.01). Women who had some
Non-Scheduled Caste/Scheduled Tribe 33.0 0.82***(0.80–0.84) media exposure had lower odds of receiving JSY benefits
Religion than women who had no media exposure (OR: 0.90, p<
Hindu 37.9 Ref. 0.01). Odds for receiving JSY benefits were higher for
women from a rural place of residence than women
Non-Hindu 29.9 0.76***(0.74–0.79)
from urban areas (OR:1.56, p< 0.01).
Wealth quintile
Table 3 presents the values of univariate and bivariate
Poor 53.2 Ref. Moran’s I statistics. Univariate Moran’s I statistics repre-
Non-poor 26.2 0.48***(0.47–0.49) sent the spatial auto-correlation of outcome and pre-
Mass media exposure dictor variables. The value of spatial-autocorrelation for
No exposure 54.4 Ref. JSY was 0.71 which depicts high dependence of the out-
come variable over districts of India. Additionally, the
Some exposure 32.12 0.85***(0.83–0.88)
highest Moran’s I value among predictor variables was
Place of residence
witnessed by women from the poor wealth quintile
Urban 21.4 Ref. (0.75) followed by women from the Hindu religion
Rural 43.8 1.46***(1.42–1.50) (0.74) and women who had no mass media exposure
JSY: Janani Suraksha Yojana, OR: Odds Ratio, CI: Confidence Interval, ***if p< (0.72). It was found that the spatial auto-correlation of
0.01, Ref: Reference category, %: percentage, CHW: Community health worker JSY and women with no schooling was 0.35 and that
with women from poor wealth quintile was 0.52. Add-
itionally, the spatial auto-correlation of JSY and women
from rural areas was 0.31, and women who had no
media exposure were 0.42.
Table 3 Univariate and Bivariate Moron’s I Values for outcome and predictors in India, 2015–16
Variables Univariate Bivariate
Janani Suraksha Yojana
Janani Suraksha Yojana (%) 0.71 (0.001) –
Age (Less than 25 years) (%) 0.61 (0.001) 0.07 (0.001)
Met with CHW (%) 0.55 (0.001) 0.13 (0.001)
No schooling (%) 0.71 (0.001) 0.35 (0.001)
Poor wealth quintile (%) 0.75 (0.001) 0.52 (0.001)
Rural place of residence (%) 0.41 (0.001) 0.31 (0.001)
Scheduled Caste/Scheduled Tribe (%) 0.60 (0.001) 0.06 (0.001)
Hindu (%) 0.74 (0.001) 0.11 (0.001)
No mass media exposure (%) 0.72 (0.001) 0.42 (0.001)
%: Percentage, CHW: Community Health WorkerMishra et al. International Journal for Equity in Health (2021) 20:24 Page 7 of 14 Table 4 Spatial regression model for estimating spatial association between Janani Suraksha Yojana and background factors in India, 2015–16 Variables OLS (p-value) SLM (p-value) SEM (p-value) Age (Less than 25 years) (%) −0.614 (0.000) −0.317 (0.000) −0.293 (0.000) Met with CHW (%) 0.341 (0.000) 0.248 (0.000) 0.290 (0.000) No schooling (%) 0.206 (0.004) 0.156 (0.000) 0.216 (0.000) Poor wealth quintile (%) 0.637 (0.000) 0.245 (0.000) 0.439 (0.000) Rural place of residence (%) 0.035 (0.350) 0.034 (0.165) −0.017 (0.601) Scheduled Caste/Scheduled Tribe (%) 0.008 (0.809) 0.024 (0.306) 0.028 (0.367) Hindu (%) 0.044 (0.134) 0.027 (0.187) 0.069 (0.032) No mass media exposure (%) −0.094 (0.274) −0.025 (0.670) − 0.037 (0.607) N(Sample) 640 640 640 Rho 0.67 (0.000) Lambda 0.80 (0.000) AIC 5394.5 5004.2 4996.4 Adjusted R 0.54 0.78 0.79 AIC: Akaike information criterion, OLS: Ordinary least square, SLM: Spatial lag model, SEM: Spatial error model Table 4 provides estimates for spatial regression esti- The model depicts that if in a district the women aged mates for JSY and its predictors for 640 districts of India. less than 25 years increases by 10% then benefit of JSY From the OLS estimates, it was confirmed that women get significantly declined by about 2.9%. Similarly, in a aged less than 25 years (β: − 0.614, p< 0.05), met CHW particular district those women who met CHW get sig- (β: 0.341, p< 0.05), no schooling status (β: 0.206, p< nificantly increased by 10% then the benefit of JSY gets 0.05), poor wealth quintile (β: 0.637, p< 0.05) and rural significantly increased by almost 2.9%. If in a district the place of residence (β: 0.035, p< 0.05) were found to be women with no schooling status increases by 10% then significant spatial predictors of JSY in India. The value the benefits of JSY get significantly increased by 2.2%. of adjusted R-square was 0.54 and the value for AIC was Similarly, if in a district the women from the poor found to be 5394. wealth quintile increase by 10% the benefits of JSY also The value of the lag coefficient was 0.67 (p< 0.01) from significantly increased by 4.4%. However, if in a district the SLM which signifies that a change in the JSY cover- there is a 10% increase of women who had no mass age in a particular district may statistically lag the rate of media exposure then the JSY benefits get declined by JSY coverage by 67% in the neighboring districts. In the 0.4%. Moreover, rural place of residence (β: 0.017, p> spatial lag model, it was found that women aged 15–24 0.05), Scheduled caste/Scheduled tribe status residence years (β:-0.317, p< 0.05), met CHW (β: 0.248, p< 0.05), (β: 0.028, p> 0.05) and Hindu religion status residence no schooling status (β: 0.56, p< 0.05) and poor wealth (β: 0.069, p< 0.05) were positively associated with JSY es- quintile (β: 0.245, p< 0.05) were significantly associated timates, but the results were not significant except for with JSY coverage in India. The respective model splits Hindu religion status. The results simply imply that dis- the value of adjusted R-square as 0.78 and the value for tricts with a higher percentage of women having no AIC was found as 5004. schooling status and belong to the poor wealth quintile However, as per the theory of spatial regression had higher chances to get benefited from the JSY models, the model with the lowest AIC value and high- programme. est R-square value is considered to be the best fit model. Figure 1 shows the coverage and spatial distribu- Therefore, as per our model estimates the lowest AIC tion of the JSY scheme across the districts of India. and highest adjusted R-square value was found to be of The colour pattern shows the spatial differences in spatial error model (SEM) which makes it the best fit the service utilization of the JSY scheme. Moreover, model among all the three models. The spatial error deeper colour indicates a higher proportion of JSY model was having an AIC value of 4996 and an adjusted coverage and light colour indicates lower coverage. R-square value of 0.79. Interestingly the value of Lambda More than 50% of the women utilizing JSY services (spatial autoregressive coefficient)/error lag value was in the districts of Odisha, Chhattisgarh, Madhya 0.80 (p< 0.01) which signifies that spatial influence on Pradesh, Uttar Pradesh, Uttarakhand, Assam, and JSY coverage through the omitted variables not present few districts of Rajasthan, Bihar, Jharkhand, and in the SEM. Meghalaya.
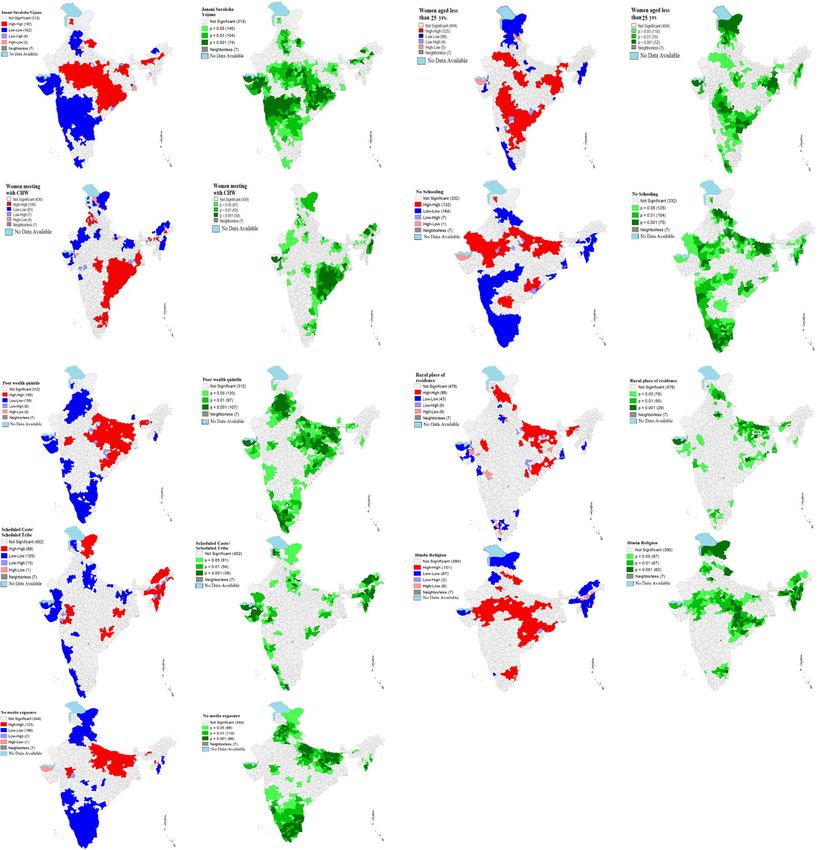
Mishra et al. International Journal for Equity in Health   (2021) 20:24                                                 Page 8 of 14

 Fig. 1 Percentage distribution of Janani Suraksha Yojana coverage among women in India

  Figure 2 represents univariate LISA (cluster and sig-                   Maharashtra, Andhra Pradesh, Odisha and Karnataka.
nificance) maps for outcome and independent variables                     The high-high clustering (106 districts) for women who
for districts of India, 2015–16. A significant high-high                  met CHW was found in West-Bengal, Odisha, Madhya
clustering of JSY service utilizing found in 162 districts,               Pradesh, Madhya Pradesh, Andhra Pradesh, Karnataka
which belonged to the above-mentioned states. There                       and Tamil Nadu. On the other hand, no schooling hot-
were 162 cold spots in Gujarat, Maharashtra, Telangana                    spots (132 districts) were found in Rajasthan, Bihar, and
Andhra Pradesh, Punjab, Chandigarh, and Haryana                           few districts of Madhya Pradesh, Uttar Pradesh, and
showed lower service utilization of the JSY scheme.                       Odisha. While the clustering of poor women were more
  The high-high clustering (125 districts) for women                      in the districts (160 districts) of Uttar Pradesh, Bihar,
aged less than 25 years was found in West Bengal, Jhar-                   Jharkhand, Chhattisgarh, Odisha, and few parts of
khand, Chhattisgarh, Rajasthan, Madhya Pradesh,                           Assam. Furthermore, the hotspots (151 districts out of
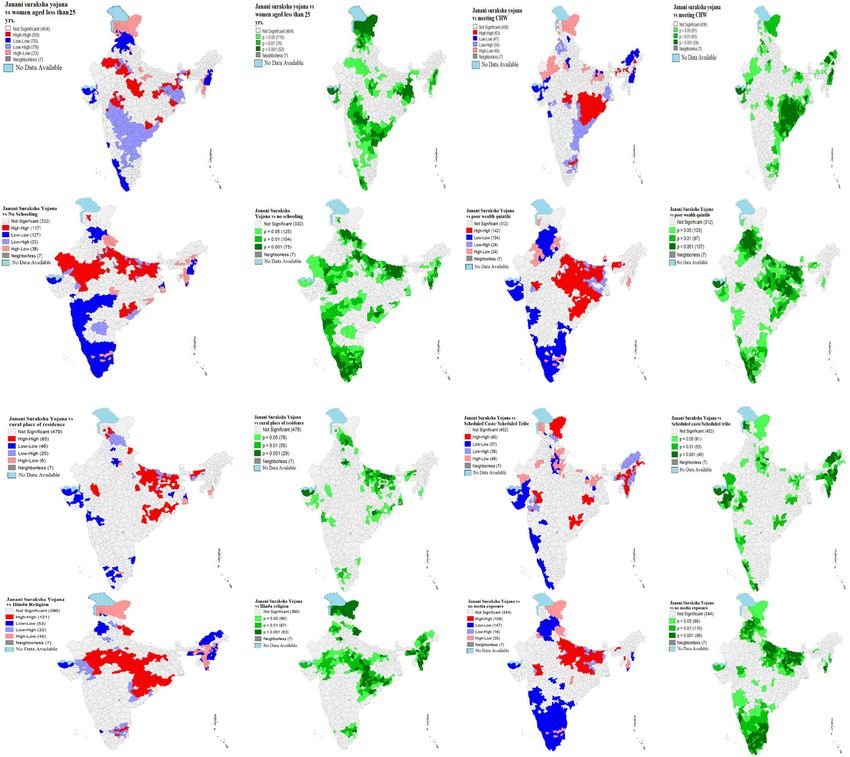
Mishra et al. International Journal for Equity in Health     (2021) 20:24                                                                 Page 9 of 14

 Fig. 2 Univariate Local Indicator of Spatial Association (LISA) (cluster and significance) maps for dependent and outcome variables for districts of
 India, 2015–16. CHW: Community health worker; Yrs.: Years

640) of the Hindu religion were found in empowering                          (high-high) clustering for JSY and women who met
action group states and the clustering of no mass media                      CHW were observed in 63 districts which were from
was high (123 districts) Uttar Pradesh, Bihar, Jharkhand,                    Madhya Pradesh, Odisha, Andhra Pradesh, West Bengal
and few districts of Maharashtra.                                            and Tamil Nadu.About117 of 640 districts had the high-
  Figure 3 displays the bivariate LISA cluster map which                     est JSY service utilization and no schooling among
indicated the high-high clustering for JSY and women                         women. These districts mostly were from Rajasthan,
aged less than 25 years were observed in 50 districts                        Madhya Pradesh, and some parts of Uttar Pradesh,
which were from Rajasthan, Madhya Pradesh, Odisha,                           Bihar, and Odisha. However, cold spots (127 districts) of
West Bengal, Jharkhand and Chhattisgarh. The hotspots                        JSY utilization and no education were found in the
Mishra et al. International Journal for Equity in Health     (2021) 20:24                                                                  Page 10 of 14

 Fig. 3 Bivariate Local Indicator of Spatial Association (BiLISA) (cluster and significance) maps for dependent vs outcome variables for districts of
 India, 2015–16. CHW: Community health worker; Yrs.: Years

southern part of India. Bivariate LISA map suggested                          were identified as hot spots (high JSY coverage and high
that around 142 districts constitute the hot spots of high                    no mass media exposure) and 147 districts as cold spots
JSY utilization and high poverty. Majority of these dis-                      (low JSY coverage and low no mass media coverage).
tricts were from Uttar Pradesh, Bihar, Jharkhand, Chhat-                      These hot spots district from Uttar Pradesh, Bihar, Jhar-
tisgarh, Odisha, West Bengal, and Assam. Only 85                              khand, and few districts from Madhya Pradesh whereas
districts constitute the hot spots of high JSY coverage                       cold spots were found in the southern part of India and
and rural areas. These districts were from Uttar Pradesh,                     the states of Punjab Chandigarh, Haryana, and Himachal
Bihar, and few districts from Chhattisgarh, Odisha, and                       Pradesh.
Assam. About 20% of districts (121 districts) of India
were observed as hot spots (high JSY utilization and high                     Discussion
Hindu religion population) while 53 districts were found                      The study found that 36.4% of women in India got bene-
as cold spots (low JSY coverage and low Hindu popula-                         fited from Janani Suraksha Yojana (JSY). The value of
tion). Mostly hot spots districts were from Madhya Pra-                       Moran’s I was 0.71 which depicts a high spatial auto-
desh, Chhattisgarh, Odisha, and some part of Uttar                            correlation i.e., the high dependence of the JSY variable
Pradesh and Uttarakhand. Similarly, around 109 districts                      over districts of India. Additionally, more than 50% of
Mishra et al. International Journal for Equity in Health   (2021) 20:24                                                    Page 11 of 14

the women were utilizing JSY services in the districts of                 in availing healthcare services [10, 28, 34]. In our analysis,
Odisha, Chhattisgarh, Madhya Pradesh, Uttar Pradesh,                      it is shown that there are regions and districts which are
Uttarakhand, Assam, and few districts of Rajasthan,                       socio-economically poor, and the proportionality with a
Bihar, Jharkhand, and Meghalaya. Lastly, it was revealed                  high SCs and STs population are shown under-coverage
that women aged 25 years or less, women who met with                      of JSY services. For example, in the states like Jharkhand,
CHW, women from poor wealth quintile and women                            Chhattisgarh, Bihar, and Madhya Pradesh, and Uttar Pra-
with no schooling status were positively associated with                  desh, the coverage of JSY across socio-economic groups
JSY coverage among districts of India. Further, our bi-                   are not up to that mark and it varied significantly across
variate findings also support the logistic regression ana-                districts and regions too. The factors like governance,
lysis in the association with utilizing JSY services with                 CHWs and associated determinants often played a role in
the background factors. The confounder variables in-                      the implementation of the programme and the commu-
cluded in the logistic regression analysis were found                     nity health workers that are key to make it a success. Pre-
significant.                                                              vious studies have also supported our findings regarding
   Though this spatial analysis of the JSY coverage is an                 the under-coverage of JSY scheme in some of the districts
attempt to find the clustering of exposure to the                         is due to unavailability of CHWs, lack of governance, and
programme at the district level in India, and the paper is                the interaction between stakeholders and CHWs [27, 39–
acknowledged with several interesting findings. Firstly,                  41, 46, 54, 55]. Further, the major finding of this study is
there is a need to improve the policy coverage at the                     that the regions which were already facing high inequity
very household level so that, it can make thrive the con-                 in health service coverage yet again spotted with socio-
cept of universal access and enhance the socio-spatial                    spatial inequality in the JSY coverage. Overall, the high
coverage too. Secondly, in receiving the JSY services by                  concentration region of JSY coverage is shown in the cen-
the beneficiary groups of people, there are multiple so-                  tral region (states included as Madhya Pradesh, Uttar Pra-
cial determinants of health that affect accessing it and                  desh, and Chhattisgarh), the eastern region (Bihar,
therefore need to be prioritized at the individual, house-                Jharkhand, and Orissa) and the northern region (Uttarak-
hold, and community levels. Thirdly, a high health in-                    hand and Rajasthan and Jammu & Kashmir). These re-
equity is seen across the spatial-regional distributional                 gions or states are having huge health disparities that can
patterns of JSY service and it concentrated at one par-                   be also seen in the distribution of JSY services [6, 36, 38,
ticular geographical region and it also extremely varied                  56]. Contrary to that, the southern and western part of
within and between regions.                                               India is partially covering the programme, although there
   In the present study, it was found that regional dispar-               are some patches in Tamil Nadu (South Indian state)
ity was visible in the case of JSY coverage across districts              showed the coverage of the JSY. However, southern states
of India. For instance, the concentration of JSY coverage                 are falling back with the programme coverage. Even
among illiterate women was visible in states of Rajas-                    though in the southern states, the private institutional de-
than, Madhya Pradesh, Uttar Pradesh, Bihar and Orissa                     liveries have increased irrespective of the socio-economic
which are considered as the empowered action group                        conditions in the last decade [23], moreover, some house-
(EAG) [38] states. Moreover, the spatial auto-correlation                 holds are eligible to get the JSY services, are still lacking
of JSY and women from poor wealth status was concen-                      access to the services. The regional inequality in the JSY
trated in the entire central and eastern part of India                    coverage has also put women’s health at risk and therefore
which has lower socio-economic development in com-                        the regional planning and policy concern is highly re-
parison to other parts of India [5, 20, 35, 52]. The re-                  quired in India. The lower the coverage lesser the inequal-
gional disparity also remained the same in the coverage                   ity, and higher the coverage the highest inequality is seen
of the programme, although the financial incentives have                  in the JSY utilization across India.
led to the poor women in more service utilization under                      Regional inequality and high severity in social policies
the NRHM policy [5, 21, 22, 29], but, there is evidence                   have made profound effects on MCH outcomes in many
that shows the targeted groups are lacking in availing                    developing countries, including India [17–19, 27, 29, 52].
the services [11, 12] which need to be enhanced with the                  Historically, a lack of policy consistency and programme
universalization of the programme to every individual.                    intervention on evidence-based maternal healthcare in
   There is evidence shown in previous studies that acces-                India has made a lesser imperative in the development
sing maternal and child health-related information in the                 of mother and child health. Further, there has also been
community as a whole and household particularly depend                    little intervention on socio-behavioral change in the
on several factors. Socially and economically marginalized                community that paved to rural women to deliver their
communities receive fewer services as compared to their                   child at health institutions except for JSY that helps fi-
counterparts [13, 15, 38, 53]. At the same time, women                    nancially after the child born at public health institutions
belonging to these communities have faced discrimination                  [4–6]. Although the programme was to support rural
Mishra et al. International Journal for Equity in Health   (2021) 20:24                                                                   Page 12 of 14

pregnant women to deliver their babies in public health                   districts, and even socioeconomic groups. It was
institutions, however, the results show that there is still               reflected that the high coverage of JSY was concentrated
inequality in the distributional patterns of service                      in EAG states and among poor and illiterate women.
utilization among the population who are eligible to ad-                  Yet, rural and remote areas with geographical barriers
here to it [57]. The findings of this study clearly show                  across Indian states and districts are shown under-
that the service utilization among the poor and disad-                    coverage. There is a need to mobilize the resources and
vantaged groups of women is higher compared to their                      implement JSY in every corner of the districts of the
counterparts, even though the programme was for the                       country so that every woman should get benefit from
targeted groups, however, the results showed that it is                   JSY and to reduce inequality across districts. Because it
still lacking the full coverage of service utilization among              has huge implications for mothers and child survival. No
them [35, 37, 38, 57, 58]. As the previous studies have                   doubt, the JSY scheme in India has led to an increase in
also provided the evidence and supported the analysis in                  MCH services among pregnant women but due to un-
the context of service coverage where the women de-                       equal utilization of JSY service coverage across the
prived of multiple grounds face inequity in the use of                    groups made unequal distribution in the districts and
JSY service [38, 57]. Moreover, previous literature argued                states. Though the JSY programme has been less known
that after JSY in 2005–07, the benefit was more weighted                  among families, for example, those who had have no
towards rural, illiterate and women from lower socio-                     mass media exposure, no education, lower-caste groups,
economic strata [34, 41, 55]. Additionally, it was too ar-                and poorer households. However, the JSY coverage is
gued that the concentration of JSY coverage was high                      fair enough comparatively and it needs more attention
among women from lower socio-economic strata be-                          from the government in response to implementation
cause of cash incentive system of JSY [5, 11, 21]. The                    and governance. Also, to counter social determinants of
use of public institutional delivery has increased many                   women’s health a need-based policy intervention like
folds among the poor socio-economic women after the                       this is required to enhance the MCH coverage among
launch of the National Rural Health Mission (NRHM) in                     the poor and marginalized women. To make an effective
2005 and it turned up as a pro-poor programme [9, 12,                     such programme like JSY, the CHWs (community health
20, 27]. However, the gap remained the same in acces-                     workers) need to be trained and engaged for diffusing
sing the JSY service (Under the NRHM) by marginalized                     the information at the individual and household levels.
and disadvantaged women which are shown in this study
as well. The findings are also consistent with previous                   Abbreviations
                                                                          JSY: Janani Suraksha Yojana; MCH: Mother and Child Health; NRHM: National
evidence that the probability of service utilization is                   Rural Health Mission; EAG: Empowered Action Group; CHW: Community
more among those who are not deprived of multiple                         Health Worker; BPL: Below Poverty Line; ASHA: Accredited Social Health
socio-economic and political grounds [7, 17, 34, 54].                     Activist; NFHS: National Family Health Survey; MoHFW: Ministry of Health and
                                                                          Family Welfare; PPS: Probability Proportional to Size; HH: Household;
  Although the study had some limitations too, firstly,                   CEBs: Census enumeration block; LISA: Local indicators of spatial association;
recent advancements and implementations under the                         OLS: Ordinary Least Square; SLM: Spatial Lag Model; SEM: Spatial Error Model;
JSY could not be analyzed as the data source used for                     AIC: Akaike information criterion

2015–16. Secondly, socio-economic inequality within
                                                                          Acknowledgments
districts was not assessed which would be interesting to                  Not applicable.
evaluate in further analysis. Thirdly, the reasons why
women cannot assess JSY benefits were not covered in                      Authors’ contributions
the study which can be further investigated through                       The concept was drafted by PSM; PK and SS contributed to the analysis
                                                                          design; PSM and SS advised on the paper and assisted in paper conceptualization;
qualitative research. Lastly, more magnification of the                   PSM, PK and SS contributed to the comprehensive writing of the article. All
districts was not possible due to sample size issues at                   authors read and approved the final manuscript.
primary sampling unit’s (PSU’s) that would be of utmost
importance for block level policy implementation.                         Funding
                                                                          Authors did not receive any funding to carry out this research.
  However apart from the above limitations, the analysis
provided a broad perspective regarding inequality in JSY                  Availability of data and materials
coverage across districts of India which can be very im-                  The study utilizes a secondary source of data that is freely available in the
portant for policymakers to evaluate the scheme at dis-                   public domain through http://iipsindia.org.
trict level.
                                                                          Ethics approval and consent to participate
                                                                          The data is freely available in the public domain and survey agencies that
Conclusion                                                                conducted the field survey for the data collection have collected prior
The overall utilization of JSY services in India after the                consent from the respondent. The local ethics committee of the
                                                                          International Institute for Population Sciences [IIPS], Mumbai, ruled that no
launch of the programme in 2005 is still 36% only. The                    formal ethics approval was required to carry out research from this data
coverage of JSY highly varied across different regions,                   source.
Mishra et al. International Journal for Equity in Health (2021) 20:24 Page 13 of 14
Consent for publication 17. Panda BK, Mohanty SK. Progress and prospects of health - related
Not applicable. sustainable development goals in India. J Biosoc Sci. 2019;51(3):335–52.
https://doi.org/10.1017/S0021932018000202.
18. Nair H, Panda R. Quality of maternal healthcare in India: Has the National
Competing interests Rural Health Mission made a difference? J Glob Health. 2011;1(1):79–86
The authors declare that they have no competing interests. Available from: http://www.ncbi.nlm.nih.gov/pubmed/23198105%0A. http://
www.pubmedcentral.nih.gov/articlerender.fcgi?artid=PMC3484741.
Author details 19. Pathak PK, Singh A, Subramanian SV. Economic inequalities in maternal
1
Institute for Social and Economic Change, Bengaluru, Karnataka 560072, health care: Prenatal care and skilled birth attendance in India, 1992–2006.
India. 2International Institute for Population Sciences, Mumbai, Maharashtra PLoS One. 2010;5(10):1992–2006.
400088, India. 20. Powell-jackson T, Mazumdar S, Mills A. Financial incentives in health : New
evidence from India ’ s Janani Suraksha Yojana. J Health Econ. 2015;43:154–
Received: 22 June 2020 Accepted: 22 December 2020 69. Available from. https://doi.org/10.1016/j.jhealeco.2015.07.001.
21. Randive B, Diwan V, De Costa A. India’s conditional cash transfer
programme (the JSY) to promote institutional birth: is there an association
between institutional birth proportion and maternal mortality? PloS one.
References
2013;8(6):e67452:1–8.
1. Blas E, Gilson L, Kelly MP, Labonté R, Lapitan J, Östlin P, et al. Addressing
22. United Nations Population Fund-India. Concurrent assessment of Janani
social determinants of health inequities : what can the state and civil
Suraksha Yojana ( JSY ) in selected states, vol. 39; 2009. Available from:
society do ? Lancet. 2008;372(11):1684–9.
www.india.unfpa.org.
2. Victora CG, Barros AJD, Axelson H, Bhutta ZA, Chopra M, França GVA, et al.
23. IIPS ICF. India National Family Health Survey NFHS-4 2015–16. Mumbai: IIPS
How changes in coverage affect equity in maternal and child health
and ICF; 2017.
interventions in 35 Countdown to 2015 countries: an analysis of national
24. Office of the Registrar General Government of India. Special Bulletin on
surveys. Lancet. 2012;380(9848):1149–56.
Maternal Mortality in India 2015–17 Sample Registration SysteM. 2019.
3. Heidkamp R, NEP Working Group. The National Evaluation Platform for
Maternal, Newborn, and Child Health, and Nutrition: From idea to 25. Arokiasamy P, Gautam A. Neonatal mortality in the empowered action
implementation. Johns Hopkins Bloom Sch Public Heal. 2017;7(2):1–5. group states of India: trends and determinants. J Biosoc Sci. 2008;40(2):183–
4. Paul S, Paul S, James KS. SSM - Population Health Universalisation versus 201.
targeting in maternal and child health care provisioning : Evidence from 26. Rasul G, Sharma E. Understanding the poor economic performance of Bihar
India. SSM - Popul Heal. 2019;9:100502. Available from. https://doi.org/10. and Uttar Pradesh, India: a macro-perspective. Reg Stud Reg Sci. 2014;1(1):
1016/j.ssmph.2019.100502. 221–39.
5. Lim SS, Dandona L, Hoisington JA, James SL, Hogan MC, Gakidou E. India’s 27. Kumari R, Panicker A, Garg S, Sharma A. Underlying causes of poor socio-
Janani Suraksha Yojana, a conditional cash transfer programme to increase economic performance of Uttar Pradesh and Bihar-India. Man in India. 2017;
births in health facilities: an impact evaluation. Lancet. 2010;375(9730):2009– 97(10):137–52.
23. Available from. https://doi.org/10.1016/S0140-6736(10)60744-1. 28. Mohanty SK, Kastor A. Out-of-pocket expenditure and catastrophic health
6. Gupta A, Fledderjohann J, Reddy H, Raman VR, Stuckler D, Vellakkal S. spending on maternal care in public and private health centres in India : a
Barriers and prospects of India’s conditional cash transfer program to comparative study of pre and post national health mission period. Health
promote institutional delivery care: a qualitative analysis of the supply-side Econ Rev. 2017;7(31):1–15.
perspectives. BMC Health Serv Res. 2018;18(1):1–2. 29. Jeffery P, Jeffery R. Only when the boat has started sinking: a maternal
7. Vellakkal S, Gupta A, Khan Z, Stuckler D, Reeves A, Ebrahim S, Bowling A, death in rural north India. Soc Sci Med. 2010;71(10):1711–8.
Doyle P. Has India’s national rural health mission reduced inequities in 30. Houweling TAJ, Ronsmans C, Campbell OM, Kunst AE. Huge poor – rich
maternal health services? A pre-post repeated cross-sectional study. Health inequalities in maternity care : an international comparative study of
Policy Plan. 2017;32(1):79–90. maternity and child care in developing countries. Bull World Health Organ.
8. Borooah VK. Social identity and educational attainment: the role of caste 2007;85(10):745–54.
and religion in explaining differences between children in India. J Dev Stud. 31. Mohanty SK. Multiple deprivations and maternal care in India. Int Perspect
2012;48(7):887–903. sextual Reprod Heal. 2012;38(1):6–14.
9. Joe W, Perkins JM, Kumar S, Rajpal S, Subramanian SV. Institutional delivery 32. Mishra PS, Syamala T. Multiple vulnerabilities in utilising maternal and child
in India , 2004–14 : unravelling the equity-enhancing contributions of the health services in Uttar Pradesh, India. Econ Pol Wkly. 2020;lV(43):45–52.
public sector. Health Policy Plan. 2018;33(April):645–53. 33. Purnell BTS, Calhoun EA, Golden SH, Halladay JR, Krok-schoen JL, Appelhans
10. Baru R, Arnab Acharya SA, Aks K, Nagaraj K. Inequities in access to health BM, et al. Achieving health equity: closing the gaps in health care
services in India : caste , class and region. Econ Pol Wkly. 2010;45(38):49–58. disparities, interventions, and research. Health Aff. 2016;35(8):1410–5.
11. Hunter BM, Bisht R, Chakravarthi I, Murray SF. Demand-side financing what 34. Vellakkal S, Reddy H, Gupta A, Chandran A, Fledderjohann J, Stuckler D.
has India learnt ? Econ Pol Wkly. 2014;xlix(2):66–73. A qualitative study of factors impacting accessing of institutional
12. Murray SF, Hunter BM, Bisht R, Ensor T, Bick D. Effects of demand-side delivery care in the context of India’s cash incentive program. Soc Sci
financing on utilisation , experiences and outcomes of maternity care in Med. 2017;178:55–65. Available from. https://doi.org/10.1016/j.socscimed.
low- and middle-income countries : a systematic review. BMC Pregnancy 2017.01.059.
Childbirth. 2014;14(30):1–15. 35. Carvalho N, Thacker N, Gupta SS, Salomon JA. More evidence on the impact
13. Navarro V, Muntaner C, Borrell C, Benach J, Quiroga Á, Rodríguez-Sanz M, of India’s conditional cash transfer program, Janani Suraksha Yojana: Quasi-
et al. Politics and health outcomes. Lancet. 2006;368(9540):1033–7. experimental evaluation of the effects on childhood immunization and
14. Kassebaum NJ, Barber RM, Bhutta ZA, Dandona L, Gething PW, Hay SI, et al. other reproductive and child health outcomes. PLoS One. 2014;9(10):
Global, regional, and national levels of maternal mortality, 1990–2015: a e109311:1–13.
systematic analysis for the Global Burden of Disease Study 2015. Lancet. 36. Chaturvedi S, Randive B, Raven J, Diwan V, De CA. Assessment of the quality
2016;388(10053):1775–812. of clinical documentation in India ’ s JSY cash transfer program for facility
15. WHO Commission on Social Determinants of Health, World Health births in Madhya Pradesh. Int J Gynecol Obstet. 2016;132(2):179–83.
Organization. Closing the gap in a generation: health equity through action Available from. https://doi.org/10.1016/j.ijgo.2015.07.016.
on the social determinants of health: Commission on Social Determinants 37. Gopalan SS, Varatharajan D. Addressing maternal healthcare through
of Health final report. World Health Organization; 2008. demand side financial incentives : experience of Janani Suraksha Yojana
16. Barros AJ, Ronsmans C, Axelson H, Loaiza E, Bertoldi AD, Frana GV, et al. program in India. BMC Health Serv Res. 2012;12(319):1–10.
Equity in maternal, newborn, and child health interventions in Countdown 38. Randive B, San Sebastian M, De Costa A, Lindholm L. Inequalities in
to 2015: A retrospective review of survey data from 54 countries. Lancet. institutional delivery uptake and maternal mortality reduction in the context
2012;379(9822):1225–33. Available from. https://doi.org/10.1016/S0140- of cash incentive program, Janani Suraksha Yojana: Results from nine states
6736(12)60113-5. in India. Soc Sci Med. 2014;123:1–6.You can also read


