Potential and limits of OSL, TT-OSL, IRSL and pIRIR290 dating methods applied on a Middle Pleistocene sediment record of Lake El'gygytgyn, Russia
←
→
Page content transcription
If your browser does not render page correctly, please read the page content below
cess
                                                                                                                     Open Access
Clim. Past, 9, 719–733, 2013
www.clim-past.net/9/719/2013/                                                                         Climate
doi:10.5194/cp-9-719-2013
© Author(s) 2013. CC Attribution 3.0 License.
                                                                                                  of the Past

                                                                                                                     Open Access
                                                                                              Earth System
                                                                                                 Dynamics

Potential and limits of OSL, TT-OSL, IRSL and pIRIR290 dating
                                                 Geoscientific

                                                                                                                     Open Access
methods applied on a Middle Pleistocene sediment record of Lake
                                              Instrumentation
El’gygytgyn, Russia                              Methods and
                                                                                               Data Systems
A. Zander and A. Hilgers
University of Cologne, Institute of Geography, Cologne, Germany

                                                                                                                     Open Access
                                                                                         Geoscientific
Correspondence to: A. Zander (anja.zander@uni-koeln.de)                                                                                M
                                                                                   Model Development
Received: 18 September 2012 – Published in Clim. Past Discuss.: 28 September 2012
Revised: 15 February 2013 – Accepted: 20 February 2013 – Published: 14 March 2013

                                                                                         Hydrology and

                                                                                                                     Open Access
Abstract. This study tests the paleomagnetic and proxy-data        1   Introduction        Earth System
based Mid- to Upper Pleistocene sediment deposition his-
tory of Lake El’gygytgyn by applying different approaches                                         Sciences
                                                                   Luminescence dating is long established as a reliable tool to
of luminescence dating techniques on sediment cores taken          provide numerical chronologies for Upper Pleistocene sedi-
from the centre of the 175 m deep lake. For dating polymin-        ments from numerous depositional environments. The event

                                                                                                                     Open Access
eral and quartz fine grains (4–11 µm grain size range) were        being dated by luminescence is the exposure of the mineral
extracted from nine different levels from the upper 28 m of        grains to sunlight prior Ocean       Science
                                                                                               to deposition  and coverage. Most
sediment cores 5011-1A and 5011-1B. According to the in-           dating studies are based on quartz optically stimulated lu-
dependent age model, the lowest sample from 27.8–27.9 m            minescence (OSL) applied on sediment archives of aeolian,
below lake bottom level correlates to the Brunhes-Matuyama         fluvial or lacustrine origin. However, the use of quartz for
(B/M) reversal. Polymineral sub-samples were analysed by           OSL dating is typically limited to the last 100–150 ka be-

                                                                                                                     Open Access
infra-red stimulated luminescence (IRSL) and post-IR IRSL          cause of saturation effects of the quartz luminescence signal
measured at 290 ◦ C (pIRIR290 ) using single aliquot regen-        with increasing dose. Thermally Solid    EarthOSL (TT-OSL)
                                                                                                       transferred
erative dose (SAR) sequences. SAR protocols were further           was proposed by Wang et al. (2006) to extend the age range
applied to measure the blue light optically stimulated lumi-       of quartz and to provide quartz OSL dates for Middle Pleis-
nescence (OSL) and thermally-transferred OSL (TT-OSL)              tocene sediments. The TT-OSL signal is measured after the
of fine-grained quartz supplemented by a multiple aliquot          depletion of the conventional OSL signal and a subsequent
                                                                                                                     Open Access

approach. Neither low temperature IRSL measurements at             pre-heat, which is applied to induce the thermal transfer of
50 ◦ C nor any OSL dating approach on quartz yielded re-           charge. The TT-OSL The  signal Cryosphere
                                                                                                  has a saturation limit at least an
liable results. Deconvolution of their dose response curves        order of magnitude higher than the fast component of the
revealed a pseudo-increase of the dose response curves and         conventional OSL signal (Wang et al., 2007) but, in contrast
explains the observed underestimation. The pIRIR protocol          to initial suggestions by Wang et al. (2006), it is consider-
applied to polymineral fine grains was the only luminescence       ably less light sensitive than the fast bleaching OSL compo-
technique able to provide dating results of acceptable accu-       nent (Tsukamoto et al., 2008; Jacobs et al., 2011). Infrared
racy up to ca. 700 ka when correlated to the existing proxy-       stimulated luminescence (IRSL) of potassium-rich feldspars
data and paleomagnetic based age record. We present the po-        has the potential to extend the datable age range because
tential and limits of the different dating techniques and a cor-   dose-response curves of K-rich feldspars or feldspar dom-
relation of pIRIR290 results with the proxy-data based age         inated luminescence emissions of polymineral fine grains
model.                                                             show a much higher saturation dose compared to quartz. But
                                                                   it has been known for several decades now that the IRSL
                                                                   signal can show anomalous fading (Wintle, 1973). This sig-
                                                                   nal loss over burial time often gives rise to significant age

Published by Copernicus Publications on behalf of the European Geosciences Union.
720 A. Zander and A. Hilgers: Potential and limits of OSL, TT-OSL, IRSL and pIRIR290
underestimation. Fading correction procedures have been de- the sediment record from 6–31 m below lake floor, i.e. 145–
veloped (Lamothe and Auclair, 1999; Huntley and Lamothe, 757 ka (Melles et al., 2012; Nowaczyk et al., 2013).
2001) to correct for these underestimations but they are in-
applicable at samples, in which dose response curves ad-
vance the saturation level. Recent studies (Thomsen et al., 2 Site information
2008; Buylaert et al., 2009; Li and Li, 2011) have presented
a measuring protocol, in which a high temperature IRSL Lake El’gygytgyn is located in Central Chukotka, NE Russia
signal is measured at an increased temperature after a first (67◦ 300 N, 172◦ 05300 E, 492 m a.s.l., Fig. 1), ∼ 100 km north
IR shine down at low temperature. This pIRIR signal ap- of the Arctic Circle. It was formed about 3.58 Ma ago by
pears to be less prone to fading and is more stable than the a meteorite impact in Upper Cretaceous volcanic rocks of
low-temperature IRSL measured at 50 ◦ C (IRSL50 ) but has the Okhotsk-Chukchi Volcanic Belt (OCVB) (Gurov et al.,
the same high saturation dose limits as the low temperature 2007).
IRSL. These characteristics make this a method of great im- The climate in Chukotka can be characterized as cold, dry
portance for dating Middle and Upper Pleistocene deposits and windy with mean winter temperatures between −32 ◦ C
and it has become the preferred protocol for feldspar dating and −36 ◦ C in January and mean summer temperatures be-
if fading corrections are unreliable or not valid (Buylaert et tween +4 ◦ C and +8 ◦ C in July/August (Treshnikov, 1985).
al., 2012). Today the surface of the roughly circular lake with a diame-
Just a few studies have focussed on luminescence dating ter of ∼ 12 km and a maximum water depth of 175 m (Nolan
of lake sediments from the Upper and Middle Pleistocene so and Brigham-Grette, 2007; Melles et al., 2007) is frozen and
far (e.g. Forman et al., 2007; Juschus et al., 2007; Lowick covered with ice for about 9 months of the year from mid Oc-
and Preusser, 2011; Lukas et al., 2012). This is probably due tober until early to mid July (Nolan et al., 2002; Melles et al.,
to the fact that such environments are afflicted with several 2012). Fluvial and aeolian input is hence limited to the few
complications. One important complication is the accurate summer months when the lake surface is open water and the
estimation of the paleo-water content. This variable is the light conditions most likely allow a reasonable bleaching of
most crucial, because water attenuates external radiation and the sediment grains. During the ice covered season, the water
causes a lowering of the dose rate received by the dosime- column is thermally stratified but by late summer after the
ters, i.e. the sediment grains. The dose rate is a substantial ice break up, it becomes fully mixed (Nolan and Brigham-
part of the age equation and faulty dose rate calculations lead Grette, 2007). The fluvial input to the lake is low and much
to inaccurate ages. A second problem that can affect the dose of the sediment is deposited at the mouth of the inflows in
rate determination in lacustrine environments is the presence shallow lagoons, which are dammed by gravel bars formed
of radioactive disequilibria in the uranium decay chain (Kr- by wave and lake ice action (Melles et al., 2011). Temporary
betschek et al., 1994). Similar to changes in water content, deposition in these lagoons and further transport through the
this imparts a non-constant dose rate on the sampled mate- clear surface waters, giving a Secchi transparency depth of
rial through time. A third question that has to be considered 19 m in summer (Melles et al., 2012), are thought to enable a
comprises the potential sediment transport processes and re- reasonable bleaching of the suspended matters.
mobilisation processes by turbidites or landslides. The bedrock of the Lake El’gygytgyn catchment consists
An independent age model for a 3.6 Ma core composite of ignimbrites, tuffs and andesite-basaltes associated with the
of Lake El’gygytgyn is provided by magnetostratigraphy and Pykarvaam, Voron’in, Koekvun’ and Ergyvaam formations
tuning of proxy-data to the regional insolation and global ma- (Nowaczyk et al., 2002). The sediments in the central part of
rine isotope stratigraphy (Melles et al., 2012; Nowaczyk et the lake consist mainly of clay and silt with some very small
al., 2013). The objective of our study was to provide com- quantities of fine sand and the mineral composition is domi-
plemental information on the core stratigraphy by applying nated by a mixture of quartz, feldspars (K-feldspar and pla-
luminescence dating techniques and to analyse the potential gioclase) and clay minerals. Although the bedrock samples
and limits of four different dating techniques, applied on an of the catchment contain fairly scattered amounts of quartz
– in terms of the dating range of luminescence techniques – between 3 % and 27 %, surface samples of the southern and
exceptionally old sediment record. south-eastern shore show a fairly homogenous enrichment of
Two comprehensive luminescence dating studies on up to 34 % quartz (Wennrich et al., 2013). The enrichment
drilling cores from Lake El’gygytgyn were already published of quartz is associated with the silt fraction and is explained
by Juschus et al. (2007) and Forman et al. (2007). They by cryogenic weathering processes within the active layer
applied a SAR-IRSL protocol and a multiple aliquot addi- of the permafrost in the lake surroundings (Schwamborn et
tive dose IRSL protocol, respectively, on polymineral fine al., 2008, 2012). The sediments of the central basin contain
grain samples from the upper ∼ 12 m, i.e. 200 ka, of the sed- 26 % quartz, 21 % plagioclase, 6 % K-feldspar, 2 % calcite,
iment record and report good agreement with the age model 10 % illites, mica and other phyllosilicates and heavy miner-
down to about 160 ka. In our study, the focus is placed on als (Wennrich et al., 2013). Most of the mineral concentration
values fit within the concentration range of the inlet stream
Clim. Past, 9, 719–733, 2013 www.clim-past.net/9/719/2013/A. Zander and A. Hilgers: Potential and limits of OSL, TT-OSL, IRSL and pIRIR290 721
during cutting and preparing of the liner pieces. The small
block was then treated with hydrochloric acid, hydrogen per-
oxide and sodium oxalate to remove carbonate, organics and
dissolve coagulations. The samples showed no chemical re-
action to hydrochloric acid but some of the samples showed
a medium reaction to hydrogene peroxide, indicating an at
least perceivable organic content. Due to the lack of sufficient
sand-sized minerals, the 4–11 µm fine grain fraction was pre-
pared following Frechen et al. (1996). Quartz was separated
by etching the polymineral fine grains with hexafluorosilicic
acid for seven days.
The remaining sediments from the liner were dried, ho-
mogenised and prepared for gamma-ray spectrometry. The
effective water content was determined by weight loss after
drying the bulk samples and is given in relation of weight
water to dry mass. Comparing the results with the original
water content, measured at a second correlative core soon af-
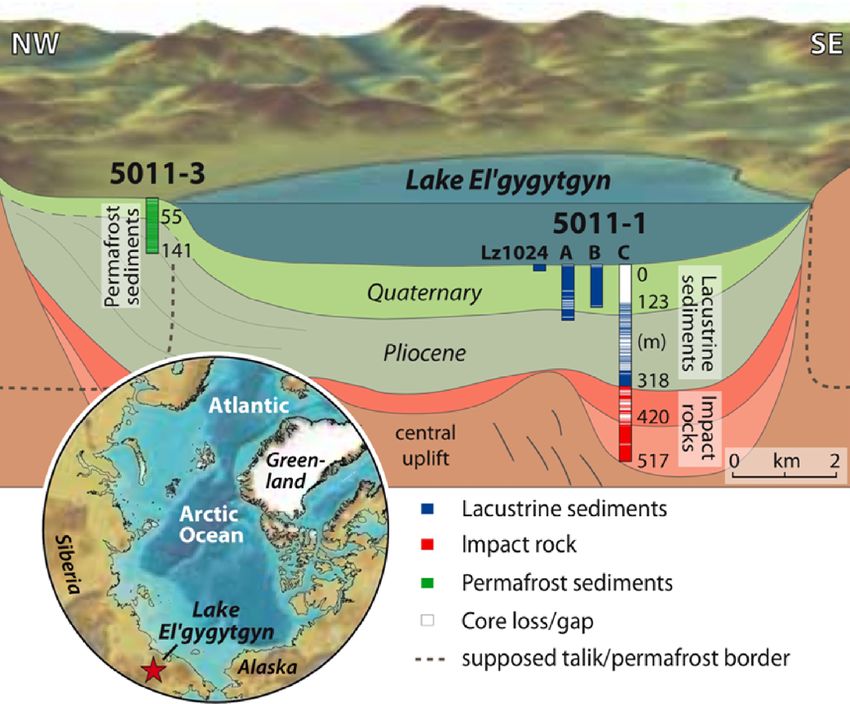
Fig. 1. Location of Lake El’gygytgyn in northeastern Russia (in- ter drilling, most of the values are in fairly good agreement
serted map) and schematic cross-section of the El’gygytgyn basin (Table 1), indicating that no significant water loss has hap-
stratigraphy showing the location of ICDP Sites 5011-1 and 5011-3. pened between coring and sample preparation. Only sample
Lz1024 is a 16 m long percussion piston core taken in 2003 that fills 1A1H3, taken from a turbidite layer, shows a significant dis-
the stratigraphic gap between the lake sediment surface and the top crepancy.
of drill cores 1A and 1B (from Melles et al., 2012).
4 Dosimetry
sample composition and the bedrock composition. A local
component consisting of weathering products of the source Radionuclide analyses (uranium, thorium, potassium) were
rocks transported as suspended load, mass movements or de- carried out by low-level gamma-ray spectrometry in the
bris flows from the shelf to the central basin is thus very Cologne laboratory and at the VKTA Rossendorf e.V.
likely (Juschus et al., 2009; Niessen et al., 2007). Though, a (D. Degering, Dresden), respectively (Table 1). Between 70 g
certain long distance aeolian transport component in the sed- and 157 g of dry sample material was packed in polystyrol
iments is also likely with regard to the prevailing northern containers and stored for at least four weeks to compensate
and southern wind directions (Nolan and Brigham-Grette, for radon loss induced by sample preparation.
2007). In consequence, the feldspar and quartz minerals used In water-lain sediments disequilibria in the uranium decay
for analyses in this study most likely represent a mixture of series are common (Krbetschek et al., 1994), though they
local fluvial and lacustrine, re-deposited and long distance are often related to the presence of carbonates or organic
transport minerals. A comprehensive study about the climatic matter. Weathering and alteration processes are also capable
and environmental history of Lake El’gygytgyn is given in to withdraw nuclides of the uranium decay chain from the
Melles et al. (2007). sedimentary system and enable a selective accumulation or
The samples of this study originate from cores A and B degradation under suitable conditions (Kemski et al., 1996).
of ICDP site 5011, which was drilled from February until Changes of the sediment dose rate over burial times have
April 2009 employing a 100 tons drilling platform on the ar- an impact on age estimates but they are hardly quantifiable
tificially thickened ice cover in 170 m water depth in the cen- over large time scales. The Cologne gamma-ray spectrom-
tral part of Lake El’gygytgyn (Melles et al., 2011; Fig. 1). eter has a good sensitivity in the higher energy part of the
spectrum and 238 U is hence quantified by peaks of 226 Ra,
214 Pb and 214 Bi, emitting gamma radiation beyond 100 keV.
3 Sample preparation The high resolution gamma-spectrometer in Dresden is in ad-
dition sensitive in the lower energy spectrum and can quan-
The cores from ICDP site 5011 were taken in transparent tify 234 Th, which directly follows the mother isotope 238 U
plastic liners of 6.6 cm diameter. For luminescence dating, and has its main emissions at 63 and 93 keV. Comparing
10 cm thick pieces were taken from replicate core parts and 238 U/234 Th with 226 Ra provides information about disequi-
wrapped with black tape to prevent further light exposure. libria in the early decay chain and can reveal uranium loss
These liner pieces were opened under subdued red-light con- or uptake since uranium is mobile in oxidising aqueous so-
ditions and a small block of 3 × 3 × 6 cm was cut out of the lutions. The samples analysed in Dresden show no signifi-
inner core to exclude any grains that were exposed to light cant differences between 238 U/234 Th and 226 Ra but two of the
www.clim-past.net/9/719/2013/ Clim. Past, 9, 719–733, 2013722 A. Zander and A. Hilgers: Potential and limits of OSL, TT-OSL, IRSL and pIRIR290
Table 1. Results of dose-rate determination using high-resolution gamma-ray spectrometry. Samples marked with an asterisk were measured
at the VKTA Rossendorf e.V. The other 5 samples were measured at the luminescence laboratory in Cologne. Water content 1 was measured
by drying the bulk sediment finally used for dose rate measurements and water content 2 was measured at a second correlative core soon
after drilling. Water content 2 was later used for age calculations. All water content values are quoted as weight water/weight dry sediment.
All values are presented with their 1-sigma error.
Lab. Sample Composite Field depth Water content Water content U Th K
Code ID depth (m) (m) (weight-%) 1 (weight-%) 2 (ppm) (ppm) (%)
C-L3111 1A1H2 6.487–6.587 3.76–3.86 90.3 94.7 3.36 ± 0.18 12.40 ± 0.72 2.42 ± 0.09
C-L3112 1A1H3 7.469–7.569 4.77–4.87 30.9 79.0 3.33 ± 0.17 12.13 ± 0.70 2.34 ± 0.09
C-L2843 1B2H2∗ 11.09–11.19 8.32–8.42 72.5 52.9 4.30 ± 0.30 11.80 ± 0.40 2.39 ± 0.08
C-L3113 1A3H1 11.694–11.794 8.88–8.98 45.0 42.8 2.47 ± 0.13 10.46 ± 0.60 1.94 ± 0.08
C-L3114 1A3H2 12.596–12.696 9.815–9.915 69.3 74.8 3.08 ± 0.16 12.32 ± 0.71 2.42 ± 0.09
C-L3115 1B3H2 14.169–14.269 11.319–11.419 66.0 67.4 2.85 ± 0.15 11.75 ± 0.68 2.24 ± 0.09
C-L3116 1A4H2 15.626–15.726 12.79–12.89 73.8 70.5 6.17 ± 0.32 13.21 ± 0.77 2.53 ± 0.10
C-L2844 1A6H1B* 20.869–20.969 17.88–17.98 59.2 61.0 4.20 ± 0.30 12.40 ± 0.40 2.45 ± 0.08
C-L2845 1A9H2* 31.05–31.15 27.817–27.917 67.2 61.5 3.90 ± 0.40 12.70 ± 0.40 2.49 ± 0.08
three samples show slightly lower values for 210 Pb compared of the sediment water content. Attenuation of ionising ra-
to 226 Ra (Fig. S1 in the Supplement). This gives evidence for diation is more effective in sediments with water-filled in-
the uranium series not being completely in the state of equi- terstices and has strong effects on resulting age estimates.
librium, but with regard to the decay rates of the short life The “as found” water contents are hardly representative for
nuclides behind 226 Ra, the difference can be attributed to mo- the moisture conditions during the time span of burial, espe-
bilisation processes within the last about 100 yr and thus can cially not for such a long period of time as considered in this
be neglected in dose rate calculation for luminescence dating. study. Mechanical compaction by overlying sediments and
For all the three samples analysed here, the activities of the mass movements may have reduced or increased the water
daughters 226 Ra and 210 Pb still agree within 2-sigma errors content during burial times and are difficult to quantify. Low-
with the activity of the mother (Fig. S1 in the Supplement). ick and Preusser (2009) have presented a complex method to
Hence, the impact on age calculation is marginal. Regarding quantify full water saturation of sediments, though a simple
the dose rates calculated for this study, an underestimation experiment was carried out in our study to get a rough es-
of about 1 ppm Uran would result in age overestimations of timate about the maximum water capacity. Sample material
about 6 to 8 % which is covered by the uncertainty range of extracted from the core liner and with no further mechanical
the dating result. Several studies have dealt with compara- treatment was dried at 105 ◦ C for 1 day and filled in beakers
bly more significant Uranium disequilibria in marine coastal with a perforated bottom. The beakers were placed in a 1 cm
sediments, cave sediments and peat sediments (Zander et al., water column for 1 day allowing a total soaking of the sample
2007; Guibert et al., 2009; Preusser and Degering, 2007). material. Maximum water contents measured immediately
They calculated ages for different modelled Uranium uptake after removing the samples from the water were between
scenarios in open and closed systems and found good agree- 118 % and 131 % in relation to dry mass. The “natural” wa-
ment with independent age control and only little effect on ter contents measured at the core are slightly lower, ranging
the resulting age estimate. between 95 % for the upper sample and 43 % as a minimum
Dose rates (Tables 3 and 6) and ages were calculated us- value. The difference can probably be attributed to sediment
ing the “age” software (version 1999) by R. Grün, Can- compaction and drainage by sediment upload under natural
berra, which includes the dose conversion factors published conditions. There is a small trend visible down the record
by Adamiec and Aitken (1998). Alpha efficiency was set to as observed by Juschus et al. (2007). They presented similar
0.035±0.02 for quartz samples and 0.07±0.02 for polymin- water contents between 90 % and 50 % for the upper 17 m
eral fine grain samples (Rees-Jones, 1995; Mauz et al., 2006; of core LT1024 and calculated three different dose rates for
Frechen and Schirmer, 2011). each sample with different water content scenarios. Only the
upper few dm of the core were over-saturated showing wa-
Attenuation factors and water content ter contents of up to 190 %. Water contents of core PG 1351
presented by Forman et al. (2007) decrease from about 70–
The cosmic contribution to the dose rate is usually calcu- 80 % down to 30–40 at 800–900 m depth. They added 5 %
lated according to the sampling depth. It can be neglected to the moisture content for age calculation to reflect an ear-
for the given samples, because the influence of cosmic radi- lier history of wetter conditions. It is fact that a retrospective
ation on the minerals is completely attenuated by overlying determination of water content changes through time is far
sediment and water column. More important is the impact from being straightforward. We therefore took the measured
Clim. Past, 9, 719–733, 2013 www.clim-past.net/9/719/2013/A. Zander and A. Hilgers: Potential and limits of OSL, TT-OSL, IRSL and pIRIR290 723
water content for age calculation and added three more age
estimates calculated with fictive water contents in the tables
to illustrate the impact of water content variation on age cal-
culation (Tables 3 and 6).
5 Luminescence measurements
Luminescence measurements were carried out on an auto-
mated Risø TL/OSL Reader (TL-DA 12) with a calibrated
90 Sr/90 Y beta source delivering 4.08 Gy min−1 . An U340 fil-
ter was used for quartz measurements and an interference
410 nm filter for IRSL measurements on polymineral sam-
ples. Several different dating techniques were applied in this
study to evaluate the most appropriate protocol for achiev-
ing reliable luminescence age estimates for such old, i.e.
> 300 ka, sediments (Table 2). This expanded dating pro- Fig. 2. Saturation dose curve of sample Elgy1B2H2 fitted to a single
gramme evolved from the fact that the sediments analysed exponential plus linear function. The standard SAR protocol was
here are comparably old and cover a time span which is not applied with 12 dose steps up to a maximum beta dose of 1237 Gy.
often securely dated by luminescence techniques. Up to about 400 Gy the dose response signal is best fitted to an expo-
nential function and then beyond to a linear function up to 1237 Gy.
5.1 SAR-OSL on fine grain quartz The inset shows the deconvoluted Lx /Tx . The background sub-
tracted OSL regenerative curve is in saturation but a decreasing test
The standard SAR protocol (Murray and Wintle, 2000) was dose signal results in a linear increase of the dose response curve.
applied on three samples, using blue stimulation for 50 s at
125 ◦ C, a pre-heat of 240 ◦ C and a cut heat of 220 ◦ C. Equiv-
alent dose (De ) values were determined using the first 0.6 s validation criteria; the average measured dose overestimated
of the OSL decay curve, and subtracting the background of the given dose by more than 25 % and resulted in a ratio of
the last 5 s. Another approach using the early background 1.32. The recycling ratio was poor (more than the acceptable
(EBG) subtraction method (Ballarini et al., 2007) with an in- 10 % deviation) and the recuperation of 10–20 % was signif-
tegral of 0–0.4 s for OSL-signal determination and a back- icantly exceeding the acceptance level of 5 % (Murray and
ground integral of 1.0–1.4 s, as described by Lowick and Wintle, 2000). An additional hot bleach (OSL shine down
Preusser (2011), did not improve the dataset and was there- at 300 ◦ C for 100 s), as proposed by Stevens et al. (2009),
fore rejected. The EBG subtraction did not change De -values was then added after the TT-OSL measurement to remove
compared to those using a late background (LBG) subtrac- the residual charge carried over from the regenerated dose
tion but only reduced the signal intensity and increased un- measurements to the test dose measurement cycle. This lead
certainties. This suggests that the OSL signal is dominated by to a perfectly linear dose response curve (Fig. 4), however,
the fast component for which the SAR protocol was designed the overestimation was hardly reduced, the recycling ratio
(Wintle and Murray, 2006). Dose response curves were fitted remained poor, and the recuperation still varied between 4 %
with a single exponential plus linear function (SEPL). An ex- and 10 %. To avoid the problem of charge transfer, a multi-
perimental dose-response curve measured for sample 1B2H2 ple aliquot regenerative dose (MAR) TT-OSL approach was
with 12 dose steps up to a 1237 Gy fitted well to a SEPL designed and tested. Twelve and 16 discs, respectively, were
function and did not show any saturation effects (Fig. 2). prepared from two samples (Table 3). The natural OSL and
Validation of the protocol parameters was verified by pre- the natural TT-OSL (step 2–5 from the given SAR protocol,
heat plateau tests and dose recovery tests at different tem- Table 2) were recorded and followed by a hot bleach (300 s
peratures. The validation tests both confirmed an appropriate blue stimulation at 280 ◦ C). The same discs were then irra-
pre-heat temperature between 220 ◦ C and 240 ◦ C and a per- diated with 4 dose steps up to 814 Gy and step 2–5 from the
fect dose recovery at 240 ◦ C with a measured to given dose SAR protocol were repeated. The first 0.4 s of the natural
ratio of 1.00 (Fig. 3a and b). IR tests for feldspar contamina- TT-OSL signal were used for short shine normalisation and
tion were made standard practice. the residual level was determined by repeating step 2–5 on
the first three discs. De -values were determined by integrat-
5.2 Thermally transferred OSL (TT-OSL) ing the first 1.2 s and the average signal of the last 10 s was
subtracted for background.
The simplified SAR protocol for TT-OSL developed by Po-
rat et al. (2009) (Table 2) was tested on 3 different samples.
A dose recovery test carried out on 1A3H1 failed to meet the
www.clim-past.net/9/719/2013/ Clim. Past, 9, 719–733, 2013724 A. Zander and A. Hilgers: Potential and limits of OSL, TT-OSL, IRSL and pIRIR290
Table 2. Compilation of measurement protocols used in this study.
OSLa TT-OSLb TT-OSL modifiedc IRSL50 d pIRIR290 e
1 Dose Dose Dose Dose Dose
2 Pre-heat (240 ◦ C, 10 s) Pre-heat (200 ◦ C, 10 s) Pre-heat (200 ◦ C, 10 s) Pre-heat (270 ◦ C, 10 s) Pre-heat (320 ◦ C, 60 s)
3 OSL (125 ◦ C, 50 s) → Lx OSL (125 ◦ C, 300s) → Lx OSL (125 ◦ C, 300 s) → Lx IRSL (50 ◦ C, 350 s) → Lx IRSL (50 ◦ C, 200 s) → LxIRSL50
4 Test dose Pre-heat (260 ◦ C, 10 s) Pre-heat (260 ◦ C, 10 s) Test dose IRSL (290 ◦ C, 200 s) → LxpIRIR290
5 Pre-heat (220 ◦ C, 0 s) OSL (125 ◦ C, 100s) → LxTT OSL (125 ◦ C, 100 s) → LxTT Pre-heat (270 ◦ C, 10 s) Test dose
6 OSL (125 ◦ C, 50 s) → Tx Test dose Heat (300 ◦ C, 100 s) IRSL (50 ◦ C, 350 s) → Tx Pre-heat (320 ◦ C, 60 s)
7 Return to 1 Pre-heat (220 ◦ C, 10 s) Test dose Return to 1 IRSL (50 ◦ C, 200 s) → TxIRSL50
8 OSL (125 ◦ C, 100 s) → Tx Pre-heat (220 ◦ C, 10 s) IRSL (290 ◦ C, 200 s) → TxpIRIR290
9 Heat (300 ◦ C, 100 s) OSL (125 ◦ C, 100 s) → Tx IRSL (325 ◦ C, 100 s)
10 Return to 1 Heat (300 ◦ C, 100 s) Return to 1
11 Return to 1
a after Murray and Wintle (2000), b after Porat et al. (2009), c after Stevens et al. (2009), d after Wallinga et al. (2000), e after Thiel et al. (2011).
Fig. 3a. Validation of protocol parameters. A pre-heat plateau test at Fig. 3b. A dose recovery test combined with a pre-heat plateau for
sample 1B2H2, carried out to define the appropriate pre-heat tem- fine grain quartz. Samples were first bleached by a 100 s shine down
perature. Three sub-samples of fine grain quartz were measured per at 125 ◦ C to reset the natural luminescence signal and then irradi-
temperature step and the resulting De plotted against the tempera- ated with a 274 Gy beta dose. Three sub-samples each were mea-
ture. A 240/220 ◦ C pre-heat/cut heat was chosen for further experi- sured at three different temperatures and yielded a perfect match at
ments with the SAR protocol. 240 ◦ C with the given dose (ratio is 1.00, see inset), if the exponen-
tial plus linear function is fitted for De determination.
5.3 SAR-IRSL50 on polymineral fine grain
discs each were measured at different pre-heat temperatures
The SAR-IRSL50 protocol proposed by Wallinga et using the same thermal treatments for the regenerative dose
al. (2000) for coarse grain feldspars was applied on the and the test dose. The average De ’s obtained for the different
polymineral fine grain fraction (Table 2). This fraction con- pre-heat temperatures show a De plateau between 210 and
tains the natural fine silt mineral composition including 290 ◦ C and “measured to given dose” ratios between 1.04
quartz, though the IR stimulated luminescence emitted in the and 1.01 (Fig. 5), confirming the applicability of the proto-
410 nm range is dominated by potassium-rich feldspar. IRSL col. A pre-heat temperature of 270 ◦ C was finally chosen for
measurements were carried out for 350 s at 50 ◦ C (IRSL50 ) the SAR-IRSL dating protocol.
through an Oriel interference filter (410 nm, 5 mm thickness,
4.5 cm diameter). The first 18 s were used for De determina- 5.4 Post-IR IRSL (pIRIR290 ) on polymineral fine grain
tion and the last 30 s subtracted as background. Dose recov-
ery pre-heat plateau tests were conducted to determine the The pIRIR290 protocol (Table 2) proposed by Thiel et
appropriate pre-heat temperature and to verify the protocol al. (2011) for middle and upper Pleistocene loess from Aus-
parameters. A set of 20 sub-samples of sample 1A1H2 re- tria was applied on eight polymineral fine grain samples.
ceived a hot bleach, i.e. a 100 s IRSL stimulation at 280 ◦ C All sub-samples were prepared on aluminium discs and all
in the reader and a subsequent beta dose of 206 Gy. Four measurements were made on a Risø TL-DA-12 with a Oriel
Clim. Past, 9, 719–733, 2013 www.clim-past.net/9/719/2013/A. Zander and A. Hilgers: Potential and limits of OSL, TT-OSL, IRSL and pIRIR290 725
Fig. 4. Result of the modified SAR TT-OSL (applied to fine grain Fig. 5. Dose recovery pre-heat plot on sample 1A1H2 with the
quartz) protocol after Porat et al. (2009) before (triangles) and after SAR-IRSL50 protocol. Samples were first bleached by a 300 s shine
(circles) adding an additional hot bleach before the test dose mea- down at 50 ◦ C to reset the natural luminescence signal and then ir-
surement. radiated with a 206 Gy beta dose. Four sub-samples each were mea-
sured at five different temperatures and yielded a perfect match at
270 ◦ C with the given dose (ratio is 1.01, see inset), if a single ex-
interference filter (410 nm, 5 mm thickness, 4.5 cm diame- ponential plus linear function is fitted for De determination.
ter). The first 2.4 s of the signal were used for De determi-
nation and the last 20 s were subtracted as background. With
regard to the small number of sub-samples measured (Ta-
ble 5), the median of the individual measurements was finally there are several studies reporting age underestimations for
used as best representative for the average equivalent dose. quartz beyond the Eemian or even as young as 70 ka (Mur-
In reference to the bleaching experiments, the signal left af- ray et al., 2008). Similar observations were made by Low-
ter bleaching for 3 h under natural sunlight (20 Gy) was sub- ick and Preusser (2011), Lowick et al. (2010), Lai (2010),
tracted from the pIRIR290 De ’s (for discussion see also Thiel Timar et al. (2010), who all reported on underestimations
et al., 2011; Buylaert et al., 2012). with fine grain quartz. The majority of these studies show that
the samples meet the standard validation criteria for the SAR
protocol, which usually allows the assumption to obtain reli-
6 Results able OSL ages. They all observed well-shaped dose response
curves, which are best fitted to a SEPL function. While the
6.1 SAR-OSL characteristics of the dose response curve suggested that de-
termination of De -values up to 400 Gy should be possible,
The results obtained for the standard SAR-OSL protocol on Lai (2010) showed that age determination was only reliable
quartz underestimate the expected age range significantly. up to 230 Gy. Lowick and Preusser (2011) and Lowick et
Maximum De -values remained below 410 Gy and none of al. (2010) reported on sedimentary quartz from northeast-
the three samples reached the saturation level. The maximum ern Italy. Their OSL ages agree well with biochronological
De was obtained for sample 1A6H1B. With regard to the constraints up to 140 Gy (70 ka) but increasingly underesti-
age model provided by Melles et al. (2012) and Nowaczyk mate the age beyond this point. They assume that the un-
et al. (2013) sample 1A6H1B from 17.88–17.93 m b.l.f. (be- derestimations are caused by the presence of different com-
low lake floor) is supposed to be deposited about 465 ka ago. ponents of luminescence signals with different luminescence
Sample 1A9H2 was taken between 27.817–27.917 m b.l.f. characteristics but have no real explanation for them. They
and is supposed to be 757 ka yr old. The SAR-OSL results also report on the slow growing dose response curve beyond
of 137 ± 20 ka and 129 ± 13 ka for these two samples are 400 Gy, which is represented by a linear component. Chapot
far below the expected age range and show no increase in et al. (2012) have analysed this problem by comparing a natu-
age with depth (Table 3 and Fig. 6). Although the dose re- ral dose response curve, which was constructed from the test
sponse curves show no saturation effects with increasing dose normalized natural OSL signals of seven samples from
dose, 400 Gy appears to be the maximum De for fine grain a Chinese loess record, and the laboratory generated dose re-
quartz. Thus, a quartz age beyond 200 ka is not attainable. sponse curves (DRC). They observed a continuous increase
Although the SAR-OSL protocol is the most accepted pro- of the laboratory generated normalized OSL signal above
tocol and has proved very successful when dating quartz, 500 Gy but no growth in the equivalent natural DRC at these
www.clim-past.net/9/719/2013/ Clim. Past, 9, 719–733, 2013726 A. Zander and A. Hilgers: Potential and limits of OSL, TT-OSL, IRSL and pIRIR290
Table 3. SAR-OSL dating results and multiple aliquot regenerative dose (MAR) TT-OSL dating results obtained on fine grain quartz (4–
11 µm). Ages and dose rates are given for different assumed and the measured water content (weight-%) to point out the significance of the
water content on the age estimates. All analytical results are presented with their 1-sigma error.
Mean Mean
Sample Composite Number of recycling recuperation De
ID depth (m) Protocol sub-samples RSD ratio (%) (Gy)
1B2H2 11.09–11.19 SAR-OSL 6 5.0 1.01 0.9 380 ± 23
1A6H1B 20.869–20.969 SAR-OSL 8 25.1 0.99 1.4 404 ± 47
1A9H2 31.05–31.15 SAR-OSL 7 5.8 1.00 2.9 376 ± 22
1A1H3 7.469–7.569 TT-OSL 16 – – – 408 ± 35
1A4H2 15.626–15.726 TT-OSL 12 – – – 485 ± 34
OSL age (ka) Dose rate (Gy ka−1 )
Water content assumed for age calculation Water content assumed for age calculation
Sample Expected
ID age∗ (ka) Protocol measured 50 % 70 % 90 % measured 50 % 70 % 90 %
1B2H2 ∼ 218 SAR-OSL 123 ± 13 121 ± 12 139 ± 15 158 ± 17 3.1 ± 0.3 3.1 ± 0.3 2.7 ± 0.2 2.4 ± 0.2
1A6H1B ∼ 465 SAR-OSL 137 ± 20 126 ± 18 146 ± 21 165 ± 24 2.9 ± 0.3 3.2 ± 0.3 2.8 ± 0.2 2.4 ± 0.2
1A9H2 ∼ 757 SAR-OSL 129 ± 13 118 ± 12 136 ± 14 155 ± 16 2.9 ± 0.3 3.2 ± 0.3 2.8 ± 0.2 2.4 ± 0.2
1A1H3 ∼ 168 TT-OSL 170 ± 21 139 ± 16 161 ± 19 182 ± 22 2.3 ± 0.2 2.9 ± 0.2 2.5 ± 0.2 2.2 ± 0.2
1A4H2 ∼ 320 TT-OSL 151 ± 18 131 ± 15 151 ± 17 171 ± 20 3.2 ± 0.3 3.7 ± 0.3 3.2 ± 0.3 2.8 ± 0.3
∗ Inferred from Melles et al. (2012) and Nowaczyk et al. (2013).
doses. The divergence appears at about 150 Gy and defines
the maximum limit of quartz OSL dating. They conclude
that that De estimates above this value are likely to be un-
derestimated. The available dataset of three SAR-OSL mea-
surements of this study does not allow to construct a reliable
natural DRC but the Ln /Tn values range between 3.6 ± 0.14
(1A9H2), 4.0±0.37 (1A6H2B) and 4.0±0.12 (1B2H2), indi-
cating no increase with increasing natural dose, whereas the
laboratory-generated dose response curve shows a constant
increase up to 1240 Gy, as observed by Chapot et al. (2012)
(see also Sect. 7).
A deconvolution of the Lx /Tx quotient from our study
revealed an obvious answer to the question, why the dose
response curve shows a linear response to high doses. Plot-
ting the background-subtracted regenerated signals (Lx ) and
the background-subtracted test dose signals (Tx ) against the
administered beta dose shows a saturation of the Lx -curve Fig. 6. Comparison of the expected ages from an independent age
above 400–500 Gy. The corresponding test dose signal (Tx ) model (Melles et al., 2012; Nowaczyk et al., 2013) and lumines-
shows a small rise up to the 500 Gy regenerative dose and cence ages determined with different luminescence dating proto-
a decrease beyond, although the test dose was always kept cols on fine grain quartz and on polymineral fine grain. The graph
constant (see inset Fig. 2). The ratio then seems to indicate a shows the luminescence ages which were calculated with the mea-
rising Lx /Tx with dose but the uncorrected OSL signal is in sured water content. The extended triangle in the lower right corner
saturation. Hence, signal growth of the sensitivity-corrected correlates with the sample from the B/M boundary and is a symbol
OSL signals is an artefact of the response to the test dose for the pIRIR290 age of > 700 ka.
that is commonly well below the saturation level. Here, sen-
sitivity correction as conducted as part of the SAR protocol 6.2 TT-OSL
results in erroneous equivalent dose estimates in dose ranges
beyond the saturation level of the uncorrected regenerated The SAR protocol for TT-OSL developed by Porat et
OSL. al. (2009) (Table 2) was not suited for the quartz from Lake
El’gygytgyn because significant sensitivity changes and a
Clim. Past, 9, 719–733, 2013 www.clim-past.net/9/719/2013/A. Zander and A. Hilgers: Potential and limits of OSL, TT-OSL, IRSL and pIRIR290 727
non-linear dose response prevented the fitting of a dose re- 6.4 Post-IR IRSL at 290 ◦ C
sponse curve to the data. Independent tests of the modified
TT-OSL protocol (Table 2) with additional hot bleaches ap- The results obtained by pIRIR290 show increasing De -values
plied on a laboratory test quartz with an artificial beta dose from 449 ± 30 Gy up to more than 2400 Gy and a non-
of 206 Gy yielded a perfect linear growth curve, a very small uniform increase of consequential age estimates. The mean
underestimation of about 5 %, and a given to measured dose recycling ratio is between 0.94 and 0.98 and recuperation is
ratio of 1.05. The average recycling ratio was within 10 % generally below 1 %. The random standard deviation (RSD)
deviation and the recuperation was negligible. This result un- is small but 1A4H2 and 1A3H2 have RSDs of more than
derlines the general validity of the modified TT-OSL proto- 30 %. Deconvolution of a dose response curve from sample
col, which obviously is not suitable for the samples of this 1A6H1B shows a constant growth of the regenerated signal
study. up to 2440 Gy and a continuous increase of the correspond-
The results obtained by the multiple aliquot approach ing test dose signal with measuring cycle (Fig. S3 in the Sup-
show linear growth curves and a good response to the short plement).
shine normalisation. Sample 1A1H3 delivers an age of 170± Thomsen et al. (2008) and Buylaert et al. (2009) have
21 ka and perfectly matches the expected age range that is in- demonstrated that the pIRIR signal is easy to bleach down
ferred from the independent age model. The result of sample to a certain residual level of 10–20 Gy, but that it is neces-
1A4H2, however, underestimates the expected age range sig- sary to verify this assumption, since bleaching characteristics
nificantly (Table 3). Hence, with respect to the independent are strongly dependent on the sediment type and mineralogy
age control TT-OSL protocols were considered not to yield of the feldspars. A sample set of 1A1H2 was prepared and
the required reliability for dating the samples under study bleached for 3.3 h and 7.5 h under natural sunlight on a bright
here. cloudless day in June. Another sample set was bleached in a
Höhnle solar simulator for 4.5 h, 6.5 h and 36 h. The results
6.3 SAR-IRSL at 50 ◦ C (Table 4) confirm that the pIRIR290 signal is generally easy to
bleach. After 3.3 h under natural sunlight, the pIRIR290 De of
The De -values obtained for the standard SAR-IRSL50 pro- sample 1A1H2 is already reduced to about 20 Gy and it keeps
tocol (Table 2) show a constant increase with depth and the decreasing with further exposure time. Artificial bleaching of
age estimates range from 98 ± 10 ka to a maximum age of different samples in a Höhnle solar simulator for 4.5, 6.5 h
191 ± 20 ka for the sample attributed to the B/M boundary. and 36 h gives a residual below 20 Gy. After 36 h in a solar
The mean recycling ratio of all samples is between 0.97 and simulator there is still a residual of 12 Gy, but the bleach-
0.98 and the reproducibility is excellent (Table 5) but the ing level is sample dependent and not only dependent on the
expected age range is not matched (Table 6). Deconvolu- bleaching time. However, this experiment illustrates that the
tion of a dose response curve from sample 1A6H1B shows pIRIR signal of the lake sediments can be bleached to a rea-
a similar trend as observed for fine grain quartz. The dose sonable level in a reasonable time.
response curve is best fitted to a SEPL function but the sen- The impact of these residuals on the calculated ages can be
sitivity corrected IRSL signal (Lx ) is in saturation (Fig. S2 considered to be quite low. For example, the residual of about
in the Supplement). The corresponding sensitivity corrected 20 Gy measured after 3.3 h of sunlight bleaching for sample
test dose signal (Tx ) is decreasing with each regeneration 1A1H2 (Table 4), corresponds to 7.7 ka using the dose rate
cycle. The quotient results in an apparent increase of the based on the measured water content. The pIRIR290 age of
dose response curve, but this is a laboratory artefact. Fading this sample is 173 ± 19 ka after subtraction of the residual.
tests were carried out on 2 samples using the protocol based Thus, the residual correlates to only 4 % of the age and within
on the fading correction model of Lamothe et al. (2003) the range of the 1-sigma error in age.
and described by Auclair et al. (2003). They revealed small Dose recovery tests at 1A1H2 after a natural sunlight ex-
fading rates between of 1.2 ± 0.4 % decade−1 (1B3H2) and posure for 7.5 h and a given dose of ∼ 470 Gy failed to pass
0.6 ± 0.4 % decade−1 (1A3H1) and suggest age underesti- the criteria. After subtracting the residual of 14 Gy the mea-
mations of about 7–10 % for the standard SAR protocol. sured to given dose ratio was still 1.55±0.09, but a valid pro-
Juschus et al. (2007) and Forman et al. (2007) also described tocol should be able to deliver a ratio within 10 % deviation
very small fading ratios for their polymineral fine grain from from unity. Another dose recovery test was carried out on five
younger Lake El’gygytgyn sediments and they forebear from discs of sample 1A3H2 after 390 min light exposure in the
doing fading corrections. They obtained a good agreement solar simulator and an artificial beta dose of ∼ 300 Gy. The
with the expected age range up to ∼ 160 ka, but underesti- measured to given dose ratio was still 1.47 ± 0.08, showing
mate the expected age range beyond 160 ka (Forman et al., a massive overestimation, too. A further dose recovery test
2007). on sample 1A3H1 was carried out after 36 h bleaching in the
solar simulator. The sub-samples were stored for 6 months
after bleaching, then received a beta dose of ∼ 300 Gy and
the average measured to given dose ratio was 1.10 ± 0.02,
www.clim-past.net/9/719/2013/ Clim. Past, 9, 719–733, 2013728 A. Zander and A. Hilgers: Potential and limits of OSL, TT-OSL, IRSL and pIRIR290
Table 4. Results of the pIRIR290 bleaching experiments. there is no real increase of De for the samples between 200
and 300 ka. The upper two samples of this time slice (1A3H1
Sample Composite Bleaching Time pIRIR290 and 1A3H2) overestimate the expected age range by about
ID depth (m) source (h) residual (Gy) 30 % (Fig. 6), whereas 1B3H2 and 1A4H2 are in good agree-
1A1H2 6.487–6.587 Sunlight 7.5 13.5 ± 1.4 ment with age estimates. Many reasons are conceivable for
1A1H2 6.487–6.587 Sunlight 3.3 20.3 ± 1.3 overestimations, such as saturation effects as visible for sam-
1A3H1 11.694–11.794 Solar simulator 36.0 12.4 ± 0.7
ple 1A3H2, erroneous water contents or dose rate calcula-
1A3H2 12.596–12.696 Solar simulator 6.5 17.3 ± 1.2
1A9H2 31.05–31.15 Solar simulator 4.5 12.7 ± 2.4 tions. Partial bleaching is also a potential source for overes-
timations in luminescence dating but regarding the sedimen-
tation conditions of the lake (Melles et al., 2007) and former
dating studies (Juschus et al., 2007; Lukas et al., 2012) in-
which is within the acceptable 10 % range. Five other discs
complete bleaching is not characteristic for lacustrine sedi-
of sample 1A3H1 and 1A3H2 received a hot bleach in the
ments. Circulation during the summer months and low sus-
reader (step 7–10 of the protocol, Table 2) instead of an opti-
pension loads should enable a reasonable reset of the signal.
cal bleach, a beta dose of ∼ 300 Gy and were then measured.
Rapid mass movements from the lake shore to the lake centre
The measured to given dose ratio was 0.99±0.01 for 1A3H1
might prevent sufficient bleaching during the sedimentation
and 0.96 ± 0.02 for 1A3H2, thus passing the validity test.
process since time is short between erosion and re-deposition
The other two routine tests, which are commonly checked
and the water column is large and loaded with suspended
by default, gave excellent results, illustrating that the sensi-
matter. Such turbidite layers can be identified in the sedi-
tivity correction of the protocol is working well. The aver-
ment core but it is uncertain if the time between initial de-
age recycling ratio was 1.03 ± 0.02 and the recuperation was
position and the turbidity event can be resolved by lumines-
low, ranging between 1.0 and 1.5 % of the sensitivity cor-
cence dating since the turbidits mainly consist of near sur-
rected natural signal. The results obtained for the dose recov-
face material from the shelf and the sediments are probably
ery tests using optical bleaching immediately followed by a
only a few thousand years older than the final mass moving
beta dose seem to indicate some kind of charge transfer after
event (Juschus et al., 2007). However, there was no sedimen-
irradiation and during the first pre-heat. Although the natural
tological evidence that 1A3H1 or 1A3H2 were taken from a
signal is thoroughly bleached after a few hours under natural
turbidite but 1A1H3 represents a mass movement event and
or artificial sunlight (Table 4), it is not possible to recover a
is in good agreement with the expected age.
given dose if measured immediately after bleaching. The re-
The samples from the lower part of the profile are in good
sulting De overestimates the given dose significantly. If the
agreement with the expected age and even sample 1A9H2
sample is stored for some months after bleaching, the over-
from the B/M boundary with an expected natural dose of
estimation is reduced and the given dose can be recovered
> 2700 Gy gave a De of more than 2400 Gy (Figs. 7 and 8a)
within 10 % deviation. Cleaning out the samples with a hot
and an age of > 700 ka (Fig. 6). The dose response curves
bleach before the first beta dose yields acceptable dose recov-
are best fitted to an exponential plus linear function and the
ery ratios, suggesting no significant charge transfer or recu-
natural sensitivity corrected signals exceed the highest regen-
peration processes. At this stage, we do not have satisfactory
erated dose point of 2430 Gy. The De obtained for 1A9H2
explanation for the different behaviours with and without
lies in the extrapolated part of the dose response curve and
delay between bleaching and irradiation. We interpret this
the true saturation level was not reached. De and age are
charge transfer observed after optical bleaching and imme-
hence just given as minimum values. In this part of the core
diate radiation as a laboratory artefact, which is not relevant
section, the natural pIRIR290 signal is slowly approaching
for natural samples because under natural conditions bleach-
the saturation level, but the dose response curve is rather
ing and dosing will happen much slower. However, further
steep compared to sample 1A6H1B (Fig. 7) and the relative
experiments with varying pause times between bleaching, ar-
standard deviation (RSD) of 8 % is low. Saturation dose ex-
tificial irradiation and first pre-heat are necessary to analyse
periments carried out on sample 1A6H1B and 1A4H2 with
these observations in more detail.
up to 7 regeneration dose points and a maximum dose of
2500 Gy still allow fitting an exponential plus linear func-
7 Discussion of SAR-IRSL50 and pIRIR290 results tion to the data but the natural pIRIR290 signal lies in the
upper slow rising linear part of the dose response curve and
From the comparison of the luminescence dates with the is close to saturation. This slow rise considerably limits the
independent age model it becomes evident that only the reliability of the pIRIR results and is taken as one of the
pIRIR290 protocol yielded reliable dating results significantly reasons for the comparably large relative standard deviation
beyond 200 ka (Table 6). Six of the samples are in very good (Table 5), though it is not observed in all samples. Sample
agreement with the expected age range, if the measured water 1B3H2 and 1A9H2 have comparably steep rising curves and
content is used for age calculation. The pIRIR290 De -values a small RSD. Polymineral fine grain samples usually do not
(Table 5) show an apparent increase with depth, although show a significant scatter because a large number of grains
Clim. Past, 9, 719–733, 2013 www.clim-past.net/9/719/2013/A. Zander and A. Hilgers: Potential and limits of OSL, TT-OSL, IRSL and pIRIR290 729
Table 5. Equivalent doses obtained for the standard SAR-IRSL50 protocol and the pIRIR290 protocol.
Composite Number of RSD IRSL50 Number of RSD pIRIR290
Sample ID depth (m) discsa (%) De (Gy) discsa (%) De (Gy)b
1A1H2 6.487–6.587 5/6 4 254 ± 14 4/5 6 449 ± 30
1A1H3 7.469–7.569 6/6 2 343 ± 19 11/13 9 581 ± 34
1A3H1 11.694–11.794 7/7 5 351 ± 19 4/5 5 911 ± 58
1A3H2 12.596–12.696 5/5 3 412 ± 25 5/8 34 958 ± 116
1B3H2 14.169–14.269 7/7 4 414 ± 23 5/5 11 883 ± 56
1A4H2 15.626–15.726 6/6 2 428 ± 24 8/9 32 1158 ± 200
1A6H1B 20.869–20.969 5/6 5 539 ± 33 6/6 16 1605 ± 168
1A9H2 31.05–31.15 6/6 4 645 ± 38 5/5 8 > 2400
a Number of discs taken for D determination and total number of discs measured. b Relating to the bleaching experiments, the
e
residual signal equivalent to 20 Gy was subtracted from the De .
Table 6. Results of the standard SAR-IRSL50 protocol and the pIRIR290 protocol. Ages and dose rates are given for various assumed and
the measured water contents. All analytical results are presented with their 1-sigma error.
IRSL50 age (ka) pIRIR290 age (ka) Dose rate (Gy ka−1 )
Water content assumed for age calculation Water content assumed for age calculation Water content assumed for age calculation
Sample Composite Expected
ID depth (m) age (ka)∗ measured 50 % 70 % 90 % measured 50 % 70 % 90 % measured 50 % 70 % 90 %
1A1H2 6.487–6.587 ∼ 145 98 ± 10 74 ± 7 85 ± 8 95 ± 10 173 ± 19 130 ± 13 149 ± 16 169 ± 18 2.6 ± 0.2 3.5 ± 0.3 3.0 ± 0.2 2.7 ± 0.2
1A1H3 7.469–7.569 ∼ 168 124 ± 12 102 ± 10 117 ± 12 132 ± 14 209 ± 21 172 ± 17 198 ± 20 223 ± 23 2.8 ± 0.2 3.4 ± 0.3 2.9 ± 0.2 2.6 ± 0.2
1A3H1 11.694–11.794 ∼ 227 121 ± 11 128 ± 12 147 ± 14 166 ± 17 314 ± 31 332 ± 34 381 ± 40 430 ± 46 2.9 ± 0.2 2.7 ± 0.2 2.4 ± 0.2 2.1 ± 0.2
1A3H2 12.596–12.696 ∼ 247 145 ± 15 122 ± 12 141 ± 14 159 ± 17 337 ± 65 284 ± 54 327 ± 63 369 ± 71 2.8 ± 0.2 3.4 ± 0.3 2.9 ± 0.2 2.6 ± 0.2
1B3H2 14.169–14.269 ∼ 295 149 ± 15 132 ± 13 151 ± 15 171 ± 17 317 ± 33 281 ± 28 323 ± 33 364 ± 39 2.8 ± 0.2 3.1 ± 0.2 2.7 ± 0.2 2.4 ± 0.2
1A4H2 15.626–15.726 ∼ 320 113 ± 12 98 ± 10 112 ± 12 127 ± 14 305 ± 60 265 ± 51 304 ± 59 343 ± 67 3.8 ± 0.3 4.4 ± 0.4 3.8 ± 0.3 3.4 ± 0.3
1A6H1B 20.869–20.969 ∼ 465 157 ± 16 145 ± 15 167 ± 18 188 ± 20 468 ± 63 433 ± 57 497 ± 67 561 ± 77 3.4 ± 0.3 3.7 ± 0.3 3.2 ± 0.3 2.9 ± 0.3
1A9H2 31.05–31.15 ∼ 757 191 ± 20 176 ± 18 202 ± 21 228 ± 24 > 700 > 650 > 750 > 850 3.4 ± 0.3 3.7 ± 0.3 3.2 ± 0.3 2.8 ± 0.2
∗ Inferred from Melles et al. (2012) and Nowaczyk et al. (2013).
on the sample disc are emitting luminescence signals. Even IRSL50 shows a good curve fit to a SEPL function with a
if the number of aliquots is small and the validity is lim- R 2 = 0.99 but compared to the laboratory-generated dose re-
ited, this scatter is most likely ascribed to the shape of the sponse curves, the linear part is less steep and the discrep-
dose response curves, indicating a natural dose close to sat- ancy between expected and measured De -values is signif-
uration level. The scatter for IRSL measurements at 50 ◦ C icant (Fig. S4 in the Supplement). The comparison of the
is much smaller. However, analyses of the natural dose re- natural DRC and the laboratory-generated DRC’s indicate a
sponse curve (Ln /Tn ) compared to the laboratory-generated large divergence in shape and growth (Fig. S5 in the Supple-
dose response curve, as proposed by Chapot et al. (2012), re- ment), similar to the observations of Chapot at al. (2012) and
sulted in good accordance (Fig. 8a) and the average DRC of explains the large underestimations of the IRSL50 results, al-
all individual measurements shows the same trend as the nat- though the fading rates are extremely low.
ural dose response curve (Fig. 8b). Chapot et al. (2012) have A similar dating approach by Thiel et al. (2011) on
observed different shapes of the dose response curves and a polymineral fine grains extracted from Austrian loess from
ceasing growth in equivalent natural Ln /Tn doses compared below the B/M boundary was not successful because the nat-
to Ln /Tn values induced by laboratory doses and took this ural of the pIRIR290 signal was in the saturating part of the
divergence to determine their maximum dating limit. There dose response curve, which they defined as > 1600 Gy. In
are no such differences in shape and growth of the dose re- our study the pIRIR290 saturation dose was not reached up to
sponse curves for the pIRIR measurements of this study but 2400 Gy for sample 1A9H2, which is correlated to the B/M
for IRSL measurements at 50 ◦ C and for quartz OSL mea- boundary. De -values derived for the low temperature IRSL
surements. The data obtained for pIRIR290 measurements signal (Table 2) do not exceed a maximum value of 645 Gy
from Lake El’gygytgyn are best fitted to a SEPL function (Table 5) and a maximum age of 191 ± 20 ka for the low-
with a R 2 -value of 0.99 which is in accordance with the typ- ermost sample. A similar trend was described by Forman et
ical laboratory dose response curves (Fig. 8b). The relation al. (2007), who reported on significant underestimations be-
between the measured and expected De -values also gives a yond 160 ka for multiple aliquot low temperature IRSL mea-
hint to the maximum limit of reliable De determination but surements on polymineral fine grains. Finally, we deduce that
as shown in Fig. 8a, this limit is not reached yet for the sam- the predominant agreement with the age model, the shape of
ples from Lake El’gygytgyn. The data set obtained for the the natural dose response curve and the age increase with
www.clim-past.net/9/719/2013/ Clim. Past, 9, 719–733, 2013You can also read