RED LED LIGHT ACTS ON THE MITOCHONDRIAL ELECTRON CHAIN OF DONKEY SPERM AND ITS EFFECTS DEPEND ON THE TIME OF EXPOSURE TO LIGHT - UDG
←
→
Page content transcription
If your browser does not render page correctly, please read the page content below
ORIGINAL RESEARCH
                                                                                                                                         published: 07 December 2020
                                                                                                                                        doi: 10.3389/fcell.2020.588621

                                            Red LED Light Acts on the
                                            Mitochondrial Electron Chain of
                                            Donkey Sperm and Its Effects
                                            Depend on the Time of Exposure to
                                            Light
                                            Jaime Catalán 1,2,3 , Marion Papas 1 , Lina Trujillo-Rojas 1 , Olga Blanco-Prieto 1 ,
                                            Sebastián Bonilla-Correal 1 , Joan E. Rodríguez-Gil 1 , Jordi Miró 1† and Marc Yeste 2,3* †
                           Edited by:
                                            1
                  Tomer Avidor-Reiss,        Unit of Animal Reproduction, Department of Animal Medicine and Surgery, Faculty of Veterinary Medicine, Autonomous
   University of Toledo, United States      University of Barcelona, Bellaterra, Spain, 2 Biotechnology of Animal and Human Reproduction (TechnoSperm), Institute
                                            of Food and Agricultural Technology, University of Girona, Girona, Spain, 3 Unit of Cell Biology, Department of Biology,
                        Reviewed by:
                                            Faculty of Sciences, University of Girona, Girona, Spain
                       Jorge G. Farias,
      University of La Frontera, Chile
                      Alberto Darszon,      This work aimed to investigate how stimulation of donkey sperm with red LED light
     National Autonomous University
                    of Mexico, Mexico
                                            affects mitochondrial function. For this purpose, freshly diluted donkey semen was
                     Ana Josefa Soler,      stimulated with red light for 1, 5, and 10 min, in the presence or absence of oligomycin A
     University of Castilla La Mancha,
                                            (Omy A), a specific inhibitor of mitochondrial ATP synthase, or FCCP, a specific disruptor
                                 Spain
               Felipe Martínez-Pastor,      of mitochondrial electron chain. The results obtained in the present study indicated that
         Universidad de León, Spain         the effects of red LED light on fresh donkey sperm function are related to changes in
                  *Correspondence:          mitochondria function. In effect, irradiation of donkey sperm resulted in an increase in
                          Marc Yeste
                 marc.yeste@udg.edu
                                            mitochondrial membrane potential (MMP), the activity of cytochrome C oxidase and the
         † These   authors share senior     rate of oxygen consumption. In addition, in the absence of oligomycin A and FCCP,
                            authorship      light-stimulation augmented the average path velocity (VAP) and modified the structure
                                            of motile sperm subpopulations, increasing the fastest and most linear subpopulation. In
                    Specialty section:
         This article was submitted to      contrast, the presence of either Omy A or FCCP abolished the aforementioned effects.
             Cell Growth and Division,      Interestingly, our results also showed that the effects of red light depend on the exposure
                a section of the journal
  Frontiers in Cell and Developmental
                                            time applied, as indicated by the observed differences between irradiation protocols. In
                                Biology     conclusion, our results suggest that exposing fresh donkey sperm to red light modulates
            Received: 29 July 2020          the function of their mitochondria through affecting the activity of the electron chain.
      Accepted: 17 November 2020            However, the extent of this effect depends on the irradiation pattern and does not
      Published: 07 December 2020
                                            exclude the existence of other mechanisms, such as those related to thermotaxis.
                              Citation:
                   Catalán J, Papas M,      Keywords: sperm, red light stimulation, mitochondrial function, donkey, oligomycin A, FCCP
     Trujillo-Rojas L, Blanco-Prieto O,
  Bonilla-Correal S, Rodríguez-Gil JE,
  Miró J and Yeste M (2020) Red LED
      Light Acts on the Mitochondrial
                                           INTRODUCTION
     Electron Chain of Donkey Sperm
  and Its Effects Depend on the Time
                                           In recent years, the use and development of artificial insemination (AI) in equine species has
                  of Exposure to Light.    grown considerably (Canisso et al., 2008; Crowe et al., 2008; Squires, 2009), and is currently
      Front. Cell Dev. Biol. 8:588621.     being considered as the basis of modern equine reproduction worldwide (Pagl et al., 2006;
      doi: 10.3389/fcell.2020.588621       Kowalczyk et al., 2019). However, while a significant number of previous studies have described

Frontiers in Cell and Developmental Biology | www.frontiersin.org                  1                                        December 2020 | Volume 8 | Article 588621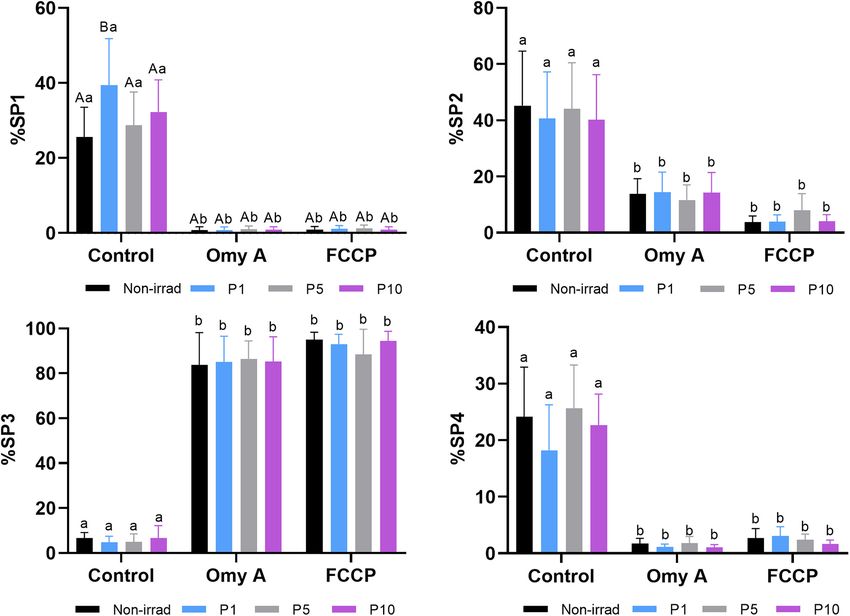
Catalán et al.                                                                                                   Mitochondria and Donkey Sperm Irradiation

and characterized the semen of domestic horses, studies on                      and neuropsin) appear to work as thermosensitizers rather
donkey sperm are scarce (Miró and Papas, 2018; Catalán et al.,                  than light-sensitive intracellular proteins (photosensitizers), via
2020a). In addition to this, at present, the most of European                   canonical phospholipase C (PLC) and cyclic nucleotide pathways
donkey breeds are in danger of extinction, which added to a                     (cAMP/cGMP; Pérez-Cerezales et al., 2015). In effect, opsins,
mounting world demand for new donkey uses (milk, cosmetics                      especially melanopsin and rhodopsin, are involved, along with
or skin production, oncotherapy, silviculture, rural tourism. . .).             the aforementioned TRPV proteins, in the sperm response to
For these reasons, the interest in developing studies to improve                thermotaxis (Zheng, 2013; Pérez-Cerezales et al., 2015; Roy
the reproductive performance in this species has increased (Miró                et al., 2020). Interestingly, a recent study has demonstrated that
et al., 2020). At this respect, it is worth noting that while both              rhodopsin and melanopsin trigger a different signaling pathway
horses and donkeys are phylogenetically close species, they show                but, unlike vision, both types of opsin coexist in the same sperm
important reproductive differences, and not only do their sperm                 cells (Roy et al., 2020). The third hypothesis considers the role of
vary in motility and morphology but also on how they interact                   endogenous photosensitizers, particularly cytochromes residing
with the female endometrium (Miró and Papas, 2018). Be that                     in the mitochondria (Yeste et al., 2018). It is widely known that
as it may, the fact that AI has been largely developed in the horse             cytochromes are an essential component of the mitochondrial
over the last years has fostered the application of those techniques            electron chain and control oxidative phosphorylation, generation
in the donkey, which necessarily entails the need of developing                 of reactive oxygen species and apoptosis (Ortega-Ferrusola et al.,
methods, protocols or procedures aimed at optimizing sperm                      2009). Cytochromes have a heme group, which not only accepts
survival and fertilizing capacity, as in the horse (Loomis, 2006;               and donates electrons (Kessel, 1982; Pottier and Truscott, 1986),
Varner, 2016).                                                                  but is sensitive to light. However, not all cytochromes react
    Irradiation of sperm with red light (laser and LED) has                     against the same wavelengths (Lynch and Copeland, 1992).
been demonstrated to jointly increase sperm motility and                        Thus, whereas cytochrome P450, which is also present in the
mitochondrial activity in sheep, cattle, pigs, donkeys and horses               endoplasmic reticulum of somatic cells, has its highest absorption
(Iaffaldano et al., 2016; Siqueira et al., 2016; Yeste et al., 2016;            peak at 450 nm, cytochrome C, which forms the complex
Catalán et al., 2020a,b,c). These effects seem, however, to rely                IV of the mitochondrial electron chain, has two peaks at
upon the light-stimulation pattern, species and other factors,                  610–630 nm and 660–680 nm (Lynch and Copeland, 1992).
since while it has also been found to increase the in vivo fertilizing          However, and despite unpublished data supporting the relevance
ability in pigs (Yeste et al., 2016; Blanco-Prieto et al., 2019), its use       of mitochondria in pig sperm (Blanco-Prieto et al., personal
in separate farms around the world brings significant differences               communication), one should not rule out that more than one of
(Blanco-Prieto et al., 2019). In addition, the literature remains               these hypothetical mechanisms could be involved in the sperm
inconsistent on how irradiation affects sperm function and, at                  response to red light, as well as that the potential influence of light
present, the mechanisms underlying that impact on mammalian                     on the conformation of other proteins might also be implied in
spermatozoa remain largely unknown (reviewed in Yeste et al.,                   that response (Yeste et al., 2018).
2018). Hence, further studies aimed at addressing the machinery                     Against this background, the objective of this study was to
that potentially guides the response of sperm to red light in                   determine if the previously reported effects of light stimulation in
separate species are warranted. In this context, the donkey could               donkey sperm (Catalán et al., 2020a) are related to changes caused
be an interesting model since previous studies have demonstrated                by the action of light on mitochondrial function, since this is one
that irradiation affects some sperm parameters in this species                  of the hypothetical mechanisms of action. Our hypothesis is that
(Catalán et al., 2020a).                                                        the effects of irradiating donkey sperm with red-light are driven
    At present, three mechanisms have been suggested as being                   by changes in mitochondrial function. For this reason, freshly
related to the response of sperm to red light (Yeste et al.,                    diluted donkey semen was irradiated with red light for 1, 5, and
2018). The first hypothesizes that irradiation is linked to                     10 min, in the presence/absence of Omy A, a specific inhibitor
thermotaxis, via its interaction with specific members of the                   of the mitochondrial ATP synthase activity, or FCCP, which acts
Transient Receptor Potential (TRP) family. While the TRP                        as a disruptor of the electron chain function. If mitochondria are
family is a highly heterogeneous class of plasma membrane                       involved in the sperm response to irradiation, utilizing these two
receptors, only those belonging to vanilloid TRP (TRPV), ankyrin                effectors should affect the impact from red light. In addition, the
TRP (TRPA), and melastanin TRP (TRPM) subfamilies have                          use of both oligomycin A and FCCP should allow elucidating the
been reported to be involved in the control of thermotaxis                      exact part of the mitochondrial electron chain that is involved in
(Vriens et al., 2014). Remarkably, ion channels are crucial                     the sperm response to light, and should also contribute to shed
during sperm capacitation (Lishko et al., 2012; Singh and                       light onto the different effects between species.
Rajender, 2014; Sun et al., 2017; Mundt et al., 2018), and
TRPV4 has been linked to the thermotactic response both in
mouse (Hamano et al., 2016) and human sperm (Mundt et al.,                      MATERIALS AND METHODS
2018). A second potential mechanism envisages the participation
of opsins, which are coupled to a G-protein (transducin)                        Animals, Semen Samples, and Ethics
and also reside in the plasma membrane of mammalian                             Eight ejaculates, each coming from a separate jackass, were used.
sperm (Pérez-Cerezales et al., 2015). The different members of                  Animals were allocated to individual paddocks at the Equine
this family of proteins (melanopsin, encephalopsin, rhodopsin,                  Reproduction Service, Autonomous University of Barcelona

Frontiers in Cell and Developmental Biology | www.frontiersin.org           2                                    December 2020 | Volume 8 | Article 588621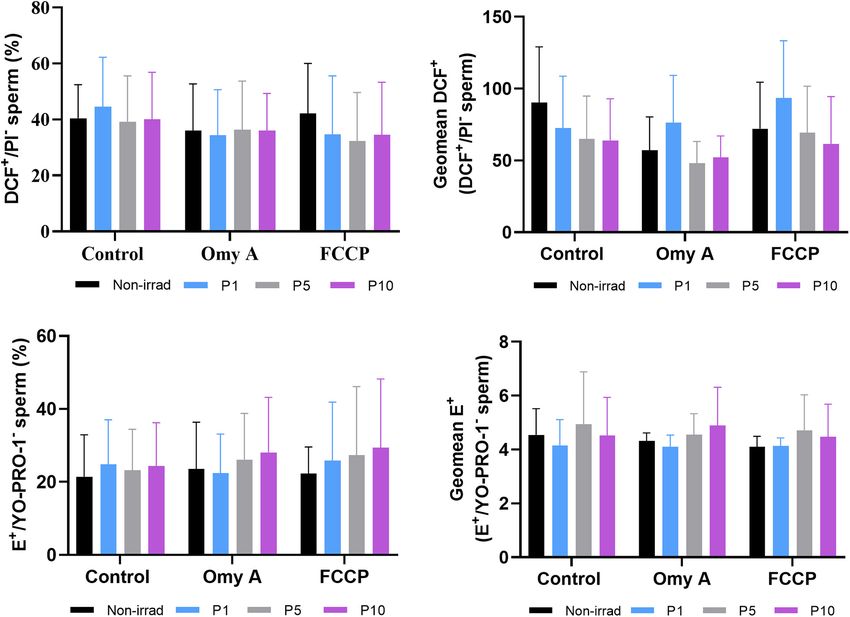
Catalán et al.                                                                                              Mitochondria and Donkey Sperm Irradiation

(Bellaterra, Cerdanyola del Vallès, Spain). This is an EU-approved          Sperm Motility
semen collection center (Authorization code: ES09RS01E) that                As indicated above, sperm motility was evaluated using a CASA
operates under strict protocols of animal welfare and health                system (Integrated Sperm Analysis System V1.0; Proiser S.L.;
control. Jackasses were adult, healthy and of proven fertility, and         Valencia, Spain). For this purpose, samples were incubated in a
were fed grain forage, straw and hay, with water being provided             water bath at 38◦ C for 5 min prior to analysis. Five microliter
ad libitum.                                                                 of each sperm sample was placed onto a Makler chamber (Sefi
   Ejaculates were collected through a Hannover artificial vagina           Medical Instruments; Haifa, Israel) previously warmed at 38◦ C.
(Minitüb GmbH, Tiefenbach, Germany) and an in-line nylon                    Samples were observed under a 10 × negative phase-contrast
mesh filter to remove the gel fraction. Upon collection, gel-free           objective (Olympus BX41 microscope; Olympus Corporation,
semen was diluted 1:5 (v:v) with Kenney extender (Kenney et al.,            Tokyo, Japan), and at least 1,000 sperm cells were counted per
1975), previously preheated to 37◦ C. Thereafter, a conventional            analysis. In each evaluation, percentages of total (TMOT) and
spermiogram, based on total ejaculate volume, sperm                         progressively motile spermatozoa (PMOT) were recorded along
concentration (Neubauer chamber, Paul Marienfeld GmbH, and                  with the following kinetic parameters: curvilinear velocity (VCL,
Co. KG; Lauda-Königshofen, Germany), motility (Computer                     µm/s), which is the mean path velocity of the sperm head along
Assisted Semen Analysis, CASA), morphology (eosin-nigrosin                  its actual trajectory; straight-line velocity (VSL, µm/s), which
staining) and plasma membrane integrity (SYBR14/PI), was                    is the mean path velocity of the sperm head along a straight
performed. All samples were confirmed to be above the standard              line from its first to its last position; average path velocity (VAP,
thresholds (≥70% of total motility and SYBR14+ /PI− sperm                   µm/s), which is the mean velocity of the sperm head along its
and ≥ 70% morphologically normal sperm).                                    average trajectory; percentage of linearity (LIN,%), which is the
   All jackasses used in this study were semen donors and no                quotient between VSL and VCL multiplied by 100; percentage
manipulation to animals, apart from semen collection in the                 of straightness (STR,%), which is the quotient between VSL and
authorized center, was made. The animal study was reviewed                  VAP multiplied by 100; percentage of oscillation (WOB,%), which
and approved by the Ethics Committee for Animal and Human                   is the quotient between VAP and VCL multiplied by 100; mean
Experimentation (CEEAH) of our institution (Autonomous                      amplitude of lateral head displacement (ALH, µm), which is the
University of Barcelona; authorization code: CEEAH 1424).                   mean value of the extreme side-to-side movement of the sperm
                                                                            head in each beat cycle; and frequency of head displacement
Experimental Design                                                         (BCF, Hz), which is the frequency at which the actual sperm
Prior to light-stimulation, sperm concentration was adjusted                trajectory crosses the average path trajectory (Hz).
to 30 × 106 spermatozoa/mL with Kenney extender using                           Settings of the CASA system were those recommended by
a Neubauer chamber (Paul Marienfeld GmbH & Co. KG;                          the manufacturer: frames/s: 25 images captured per second;
Lauda-Königshofen, Germany). Following this, each semen                     particle area > 4 and < 75 µm2 ; connectivity: 6; minimum
sample was split into separate aliquots of 1.5 mL that were                 number of images to calculate the ALH: 10. Cut-off values
subjected to three red light irradiation protocols with an                  were VAP ≥ 10 µm/s for TMOT, and STR ≥ 75% for
air-refrigerated red LED light system (PhastBlue , IUL, S.L.;       R
                                                                            PMOT. In addition, individual kinematic parameters (VSL, VCL,
Barcelona, Spain; wavelength range: 620–630 nm; intensity                   VAP, LIN, STR, and BCF) were used to determine motile
per sample: 35.05 W/m2 ). These three protocols consisted of                sperm subpopulations. Three replicates were evaluated before
exposing sperm to red light for 1 min (P1), 5 min (P5)                      calculating the corresponding mean ± SD.
or 10 min (P10). In all cases, the temperature within the
PhastBlue system was maintained at 20◦ C ± 0.1◦ C. The
             R
                                                                            Flow Cytometry
control consisted of 1.5 mL tubes kept at 20◦ C in the dark                 Flow cytometry was used to determine plasma membrane
for 10 min. In addition to the aforementioned, semen samples                integrity, MMP, and intracellular levels of superoxides, peroxides
were also exposed to the same three protocols (i.e., P1, P5,                and calcium, following the recommendations set by the
and P10) or non-exposed (control), in the presence of either                International Society for Advancement of Cytometry (ISAC;
5 µM oligomycin A or 5 µM FCCP. In order to achieve a                       Lee et al., 2008). In all analyses, sperm concentration was
maximal effect of both Omy A and FCCP, these two molecules                  previously adjusted to 1 × 10⁶ spermatozoa/mL in a final
were added to semen samples 10 min prior to exposure to                     volume of 500 µL, and three technical replicates were evaluated.
red light. Following exposure to red light, sperm motility was              Samples were examined using a Cell Laboratory QuantaSC
evaluated through a computer-assisted sperm analysis system                 cytometer (Beckman Coulter, Fullerton, CA, United States),
(CASA); sperm membrane integrity, mitochondrial membrane                    and the sheath flow rate was set at 4.17 µL/min. Electronic
potential (MMP), and intracellular ROS and calcium levels                   volume (EV) and side scatter (SS) were recorded in a log-
were determined through flow cytometry; O2 consumption rate;                linear mode (EV/SS dot plots) for 10,000 events per replicate.
intracellular ATP levels and total cytochrome C oxidase (CCO)               The analyzer threshold was adjusted on the EV channel to
activity were also assessed. In the case of intracellular ATP               exclude subcellular debris (particle diameter < 7 µm) and
levels and total CCO activity, samples were first centrifuged               cell aggregates (particle diameter > 12 µm). When required,
at 2,000 × g and 20◦ C for 30 s; the resulting pellets were                 compensation was used to minimize fluorescence spill-over into
immediately frozen by plunging them into liquid N2 . Samples                a different channel. Information on all events was collected in
were stored at −80◦ C until use.                                            List-mode Data files (EV, SS, FL1, FL2, and FL3) and processed

Frontiers in Cell and Developmental Biology | www.frontiersin.org       3                                   December 2020 | Volume 8 | Article 588621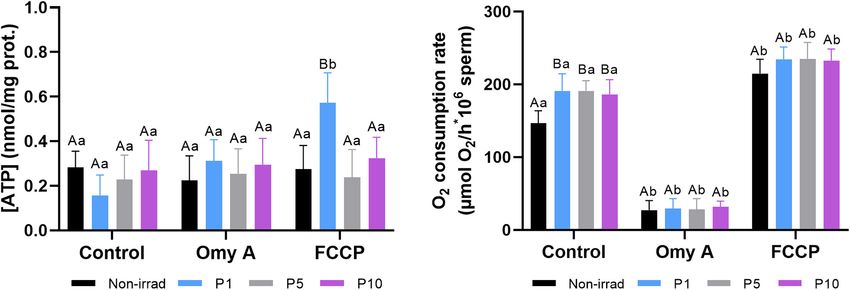
Catalán et al.                                                                                            Mitochondria and Donkey Sperm Irradiation

using the Cell Lab QuantaSC MPL Analysis Software (version                  diacetate (H2 DCFDA) and hydroethidine (HE), which detect
1.0; Beckman Coulter). In all assessments, data were corrected              hydrogen peroxide (H2 O2 ) and superoxide anion (·O2 − ),
using the procedure described by Petrunkina et al. (2010),                  respectively (Murillo et al., 2007). Sperm were counterstained
based on the percentage of debris particles (SYBR14− /PI− )                 with PI (H2 DCFDA) or YO-PRO-1 (HE), following a protocol
determined through SYBR14/PI staining. Fluorochromes were                   modified from Guthrie and Welch (2006).
purchased from Molecular Probes (Invitrogen , Thermo Fisher
                                           R                R
                                                                                With regard to peroxides, spermatozoa were incubated
Scientific, Waltham, MA, United States) and diluted with                    with H2 DCFDA (final concentration: 200 µM) and PI (final
dimethyl sulfoxide (DMSO).                                                  concentration: 12 µM) at room temperature for 30 min in
                                                                            the dark. H2 DCFDA is a stable, cell-permeable, non-fluorescent
Plasma Membrane Integrity                                                   probe that, in the presence of H2 O2 , is deesterified and
Sperm membrane integrity was assessed using the LIVE/DEAD                   converted into 20 ,70 -dichlorofluorescein (DCF). Fluorescence of
Sperm Viability Kit (SYBR14/PI; Molecular Probes, Thermo                    DCF and PI were measured through FL1 and FL3 detectors,
Fisher Scientific), according to the protocol described by Garner           respectively. Four sperm populations were distinguished: (i)
and Johnson (1995) and adapted to donkey spermatozoa.                       viable spermatozoa with low levels of peroxides (DCF− /PI− ); (ii)
In brief, samples were first incubated with SYBR14 (final                   viable spermatozoa with high levels of peroxides (DCF+ /PI− );
concentration: 100 nM) at 38◦ C for 10 min, and then with                   (iii) non-viable spermatozoa with low levels of peroxides
PI (final concentration: 12 µM) at 38◦ C for 5 min. Three                   (DCF− /PI+ ); and (iv) non-viable spermatozoa with high levels
sperm populations were distinguished: (i) viable spermatozoa                of peroxides (DCF+ /PI+ ). Percentages of debris particles found
emitting green fluorescence (SYBR14+ /PI− ), which appeared on              in SYBR14/PI staining (SYBR14− /PI− ) were subtracted from
the right side of the lower half of FL1/FL3 dot plots; (ii) non-            those of viable spermatozoa with low levels of peroxides
viable spermatozoa emitting red fluorescence (SYBR14− /PI+ ),               (DCF− /PI− ), and percentages of all sperm populations were
which appeared on the left side of the upper half of FL1/FL3                recalculated. Spill-over of FL1- into the FL3-channel was
dot plots; and (iii) non-viable spermatozoa emitting both green             compensated (2.45%). Data are shown as corrected percentages
and red fluorescence (SYBR14+ /PI+ ), which appeared on the                 of viable spermatozoa with high levels of peroxides (DCF+ /PI− ),
right side of the upper half of FL1/FL3 dot plots. Non-stained              and geometric mean of DCF+ -fluorescence intensity in the
particles (SYBR14− /PI− ), which appeared on the left side of the           DCF+ /PI− sperm population.
lower half of FL1/FL3 dot plots, had similar EV/SS distributions                As far as superoxides are concerned, samples were incubated
than spermatozoa and were considered as non-DNA, debris                     with HE (final concentration: 4 µM) and YO-PRO-1 (final
particles. Percentages of non-stained particles were used to                concentration: 25 nM) at room temperature for 30 min in
correct the percentages of double-negative sperm populations in             the dark (Guthrie and Welch, 2006). Hydroethidine diffuses
the other assessments. Spill-over of FL1- into FL3-channel was              freely through plasma membrane and converts into ethidium
compensated (2.45%).                                                        (E+ ) in the presence of superoxide anions (·O2 − ) (Zhao et al.,
                                                                            2003). Fluorescence of ethidium (E) was detected through FL3
Mitochondrial Membrane Potential                                            and that of YO-PRO-1 was detected through FL1. Four sperm
Mitochondrial         membrane    potential    was        determined        populations were distinguished: (i) viable spermatozoa with low
through         incubation   with    JC1    (5,50 ,6,60 -tetrachloro-       levels of superoxides (E− /YO-PRO-1− ); (ii) viable spermatozoa
1,10 ,3,30 tetraethyl−benzimidazolylcarbocyanine iodide; final              with high levels of superoxides (E+ /YO-PRO-1− ); (iii) non-
concentration: 0.5 µM) at 38◦ C for 30 min in the dark. At low              viable spermatozoa with low levels of superoxides (E− /YO-
MMP, JC1 remains as a monomer (JC1mon ) emitting green                      PRO-1+ ); and (iv) non-viable spermatozoa with high levels of
fluorescence, which is detected through FL1. At high MMP,                   superoxides (E+ /YO-PRO-1+ ). Percentages of debris particles
JC1 forms aggregates (JC1agg ) emitting orange fluorescence,                found in SYBR14/PI staining (SYBR14− /PI− ) were subtracted
which is collected through FL2. Three sperm populations were                from those of viable spermatozoa with low levels of superoxides
distinguished: (i) spermatozoa with green-stained mitochondria              (E− /YO-PRO-1− ), and percentages of all sperm populations
(low MMP); (ii) spermatozoa with heterogeneous mitochondria                 were recalculated. Spill-over of FL3-into the FL1-channel was
stained both green and orange in the same cell (intermediate                compensated (5.06%). Data are shown as corrected percentages
MMP); and (iii) spermatozoa with orange-stained mitochondria                of viable spermatozoa with high levels of superoxides (E+ /YO-
(high MMP). Ratios between JC1agg (FL2) and JC1mon (FL1)                    PRO-1− ), and geometric mean of E+ -fluorescence intensity in
fluorescence for each of these sperm populations were also                  the E+ /YO-PRO-1− sperm population.
evaluated. Spill-over of FL1- into FL2-channel was compensated
(68.50%). Percentages of debris particles found in SYBR14/PI                Intracellular Calcium Levels
staining (SYBR14− /PI− ) were subtracted from those of                      Previous studies found that Fluo3 mainly stains mitochondrial
spermatozoa with low MMP, and percentages of all sperm                      calcium in pig sperm (Yeste et al., 2015). For this reason, we
populations were recalculated.                                              combined this fluorochrome with PI (Fluo3/PI), as described by
                                                                            Kadirvel et al. (2009). Four sperm populations were identified:
Analysis of Intracellular ROS Levels: H2 O2 and ·O2 −                       (i) viable spermatozoa with low levels of intracellular calcium
Intracellular ROS levels were determined through two oxidation              (Fluo3− /PI− ); (ii) viable spermatozoa with high levels of
sensitive fluorescent probes: 20 ,70 -dichlorodihydrofluorescein            intracellular calcium (Fluo3+ /PI− ); (iii) non-viable spermatozoa

Frontiers in Cell and Developmental Biology | www.frontiersin.org       4                                 December 2020 | Volume 8 | Article 588621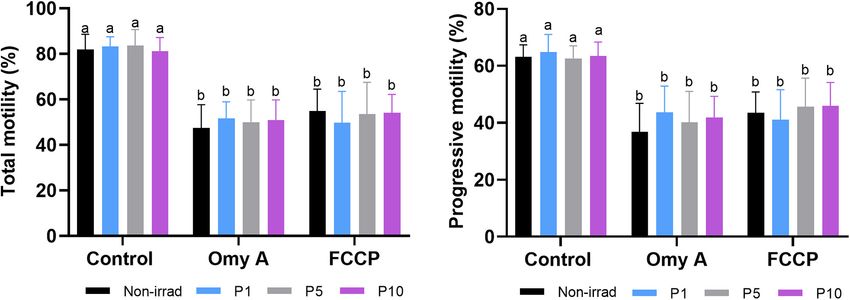
Catalán et al.                                                                                                Mitochondria and Donkey Sperm Irradiation

with low levels of intracellular calcium (Fluo3− /PI+ ); and                  centrifuged at 1,000 × g and 17◦ C for 30 s. The resulting
(iv) non-viable spermatozoa with high levels of intracellular                 pellets were immediately plunged into liquid N2 and stored for
calcium (Fluo3+ /PI+ ). FL3 spill-over into the FL1-channel                   3 weeks. Pellets were resuspended in 500 µL ice-cold PBS and
(28.72%) and FL1 spill-over into the FL3-channel (2.45%)                      sonicated (10 kHz, 20 pulses; Bandelin Sonopuls HD 2070).
were compensated.                                                             Thereafter, 500 µL Percoll (concentration: 1.055 mg/mL in
                                                                                                          R

                                                                              PBS) at 4◦ C was placed onto each sperm homogenate. Samples
Determination of Intracellular ATP Levels                                     were centrifuged at 3,000 × g and 10◦ C for 45 min and the
Intracellular ATP levels were determined following the protocol               mitochondria-enriched fraction was carefully harvested with a
set by Chida et al. (2012). Immediately after light-stimulation,              micropipette and transferred into a new 1.5 mL tube. Samples
1-mL semen aliquots were centrifuged at 17◦ C for 30 s;                       were again centrifuged at 12,000 × g and 20◦ C for 2 min and
pellets were plunged into liquid N2 , and frozen pellets were                 the resulting pellets were resuspended in 100 µL PBS at 20◦ C.
subsequently stored at −80◦ C for a maximum of 3 weeks.                       These mitochondria-enriched suspensions were split into two
Pellets were then resuspended in 300 µL ice-cold 10 mM 2-                     separate aliquots. The first one was used to determine CCO
[4-(2-hydroxyethyl)piperazin-1-yl]ethanesulfonic acid (HEPES)                 activity using a commercial kit (Cytochrome C Oxidase Assay Kit;
buffer containing 250 mM sucrose (pH was adjusted to 7.4),                    Sigma-Aldrich; catalog number CYTOCOX1). Enzyme activity
and subsequently sonicated (10 kHz, 20 pulses; Bandelin                       was normalized against the total protein content. Therefore, the
Sonopuls HD 2070; Bandelin Electronic GmbH and Co., Berlin,                   other aliquot (10 µL) was used to determine total protein content
Germany). During this process, tubes were kept on ice to                      through a commercial kit (Bio-Rad laboratories) based on the
avoid specimen heating. Next, samples were centrifuged at                     Bradford method (Bradford, 1976).
1,000× g and 4◦ C for 10 min, supernatants were harvested
for further use and pellets were discarded. Twenty µL of                      Statistical Analysis
supernatant was used to determine total protein content, and                  Statistical analyses were conducted using a statistical package
the remaining volume was mixed with 300 µL ice-cold 10%                       (SPSS Ver. 25.0 for Windows; IBM Corp., Armonk, NY,
                                                                                    R

(v:v) trichloroacetic acid and held at 4◦ C for 20 s. Samples                 United States). Data were first tested for normal distribution
were subsequently centrifuged at 1,000 × g and 4◦ C for                       (Shapiro-Wilk test) and homogeneity of variances (Levene
30 s, and supernatants were carefully separated from the pellet               test) and, if required, they were transformed with arcsin
                                                                              √
and again centrifuged at 1,000 × g and 4◦ C for 10 min.                         x. The effects of irradiating donkey with red light and
Supernatants were mixed with two volumes of 1 M Tris-                         the presence of oligomycin A/FCCP were tested on sperm
acetate buffer (pH = 7.75), and the resulting suspension was                  motility parameters, percentages of spermatozoa with an
used to determine the ATP content using the Invitrogen                R
                                                                              intact plasma membrane (SYBR14+ /PI− ), spermatozoa with
ATP Determination Kit (Thermo Fisher Scientific, Waltham,                     high and intermediate MMP, viable spermatozoa with high
United States; catalog number: A22066). Determinations of ATP                 intracellular calcium levels (Fluo3+ /PI− ), viable spermatozoa
content were carried out with an Infinite F200 fluorimeter                    with high superoxide levels (E+ /YO-PRO-1− ), and viable
(TECAN ), using 96-wells microplates for fluorescence-based
            R
                                                                              spermatozoa with high peroxide levels (DCF+ /PI− ); geometric
assays (Invitrogen ). Data were normalized against the total
                         R
                                                                              mean fluorescence intensities (GMFI) of JC1agg , Fluo3+ , E+
protein content determined with the Bradford method (Bradford,                and DCF+ ; JC1agg /JC1mon GMFI-ratios; intracellular levels of
1976) using a commercial kit (Bio-Rad laboratories; Hercules,                 ATP; O2 consumption rate; and cytochrome C oxidase activity
CA, United States).                                                           were evaluated through two-way analysis of variance (ANOVA;
                                                                              factor 1: irradiation protocol; factor 2: presence/absence of
Determination of O2 Consumption Rate                                          Omy A or FCCP) followed by post hoc Sidak test for pair-
Determination of O2 consumption rate was performed through                    wise comparisons.
the SensorDish Reader (SDR) system (PreSens Gmbh;
                     R
                                                                                 Motile sperm subpopulations were determined through the
Regensburg, Germany). After light-stimulation, 1 mL of each                   protocol described in Luna et al. (2017). In brief, individual
sperm sample was transferred onto an Oxodish OD24 plate           R
                                                                              kinematic parameters (VCL, VSL, VAP, LIN, STR, WOB, ALH,
(24 wells/plate). Plates were sealed with Parafilm , placed within
                                                              R
                                                                              and BCF) recorded for each sperm cell were used as independent
the SDR system, and incubated at 37◦ C (controlled atmosphere)                variables in a Principal Component Analysis (PCA). Kinematic
for 2 h. During that time, O2 concentration was recorded in                   parameters were sorted into PCA components and the obtained
each well at a rate of one reading/min. Data were exported to                 matrix was subsequently rotated using the Varimax method
an Excel file and final O2 consumption rate was normalized                    with Kaiser normalization. As a result, each spermatozoon
against the total number of viable spermatozoa per sample,                    was assigned a regression score for each of the new PCA
which was determined through flow cytometry (SYBR14+ /PI−                     components and these values were subsequently used to run a
spermatozoa) as described above.                                              two-step cluster analysis based on the log-likelihood distance
                                                                              and the Schwarz Bayesian Criterion. Four sperm subpopulations
Determination of Cytochrome C Oxidase Activity                                were identified and each individual spermatozoon was assigned
The CCO activity was determined in mitochondria-enriched                      to one of these subpopulations (SP1, SP2, SP3, or SP4).
sperm fractions, as described in Mclean et al. (1993). Briefly, 1-            Following this, percentages of spermatozoa belonging to each
mL sperm aliquots, previously irradiated with red light, were                 subpopulation were calculated per sample and used to determine

Frontiers in Cell and Developmental Biology | www.frontiersin.org         5                                   December 2020 | Volume 8 | Article 588621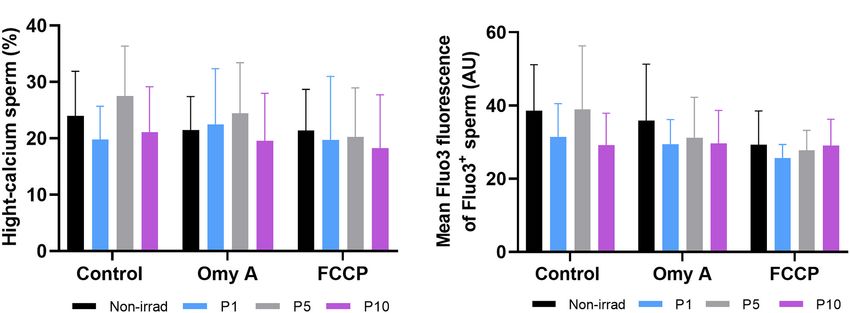
Catalán et al. Mitochondria and Donkey Sperm Irradiation
the effects of irradiation and Omy A/FCCP on the distribution Regarding the effects of light-stimulation on sperm kinetic
of motile sperm subpopulations through two-way ANOVA parameters (Table 1), irradiation for 5 min and 10 min
followed by Sidak test. significantly (P < 0.05) increased VAP, when Omy A and FCCP
In all analyses, the level of significance was set at P ≤ 0.05. were absent. In contrast, the presence of Omy A or FCCP in non-
Data are shown as mean ± standard deviation (SD), median and irradiated samples led to a significant (P < 0.05) decrease in VCL,
interquartile range (i.e., Q1 and Q3). VSL, VAP, LIN, and WOB (Tables 1A,B). Moreover, treatments
with Omy A and FCCP showed significantly (P < 0.05) higher
values of BCF (Table 1C) and STR in non-irradiated and
RESULTS irradiated samples.
Finally, as shown in Table 2, four different motile sperm
subpopulations were identified in all treatments (SP1, SP2, SP3,
Effects of Red Light Stimulation on
and SP4). Interestingly, irradiation was found to affect the
Plasma Membrane Integrity in the proportions of sperm belonging to each motile subpopulation.
Presence or Absence of Either Omy A or Light-stimulation of spermatozoa with red light for 1 min
FCCP significantly increased (P < 0.05) the proportions of sperm
Irradiating donkey sperm with red light did not affect sperm belonging to SP1 (Figure 3A), which was the subpopulation that
membrane integrity, as no significant differences between the exhibited the highest kinematic parameters (Table 2). Regardless
control and light-stimulation protocols were observed with of whether samples were or not irradiated, the presence of Omy
regard to the percentages of membrane-intact spermatozoa A or FCCP significantly (P < 0.05) decreased the proportions
(SYBR14+ /PI− ; Figure 1), neither did the presence of Omy A or of sperm belonging to SP1, SP2, and SP4 (Figures 3A,B,D) and
FCCP alter that parameter. increased those of sperm belonging to SP3 (Figure 3C), which
was the motile subpopulation that exhibited the lowest values in
most kinematic parameters (Table 2).
Effects of Red Light Stimulation on
Sperm Motility in the Presence or
Effects of Red Light Stimulation on
Absence of Either Omy A or FCCP
As shown in Figure 2, percentages of TMOT (Figure 2A) and
Mitochondrial Membrane Potential in the
PMOT (Figure 2B) did not differ between non-irradiated and Presence or Absence of Either Omy A or
irradiated sperm samples, in the presence/absence of either FCCP
Omy A or FCCP. Moreover, the presence of Omy A or FCCP, As shown in Figure 4A, irradiation for 1, 5, and 10 min
irrespective of irradiation/non-irradiation, led to a significant significantly (P < 0.05) increased the percentages of spermatozoa
(P < 0.05) decrease in total (Figure 2A) and progressive with high MMP in samples without Omy A or FCCP.
(Figure 2B) sperm motility. In treatments containing Omy A, irradiation for 1 min or
5 min significantly (P < 0.05) augmented the percentages
of spermatozoa with high MMP compared to non-irradiated
samples. Furthermore, percentages of spermatozoa with high
MMP in samples containing FCCP were significantly (P < 0.05)
higher in samples irradiated for 10 min than in their non-
irradiated counterparts. In addition to this, percentages of
spermatozoa with high MMP in non-irradiated samples and
samples irradiated for 1, 5, or 10 min were significantly lower
(P < 0.05) when FCCP was present than in the absence of this
disruptor (Supplementary Figure 1).
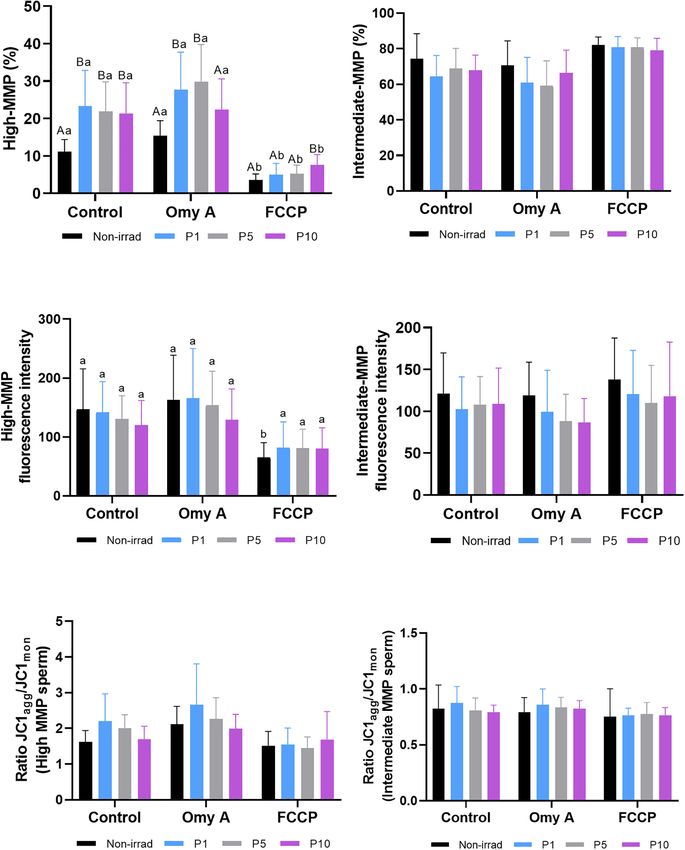
As shown in Figure 4B, no significant differences in
the percentages of sperm with intermediate MMP were
observed between non-irradiated and irradiated samples,
either in the presence or absence of Omy A and FCCP. In
addition, no significant differences in the geometric mean
of JC1agg intensity (orange, FL2) of sperm populations
with high (Figure 4C) and intermediate MMP (Figure 4D)
FIGURE 1 | Effects of light-stimulation on the percentages of
membrane-intact sperm (SYBR14+ /PI− ) in the presence/absence of Omy A
were observed between irradiated and non-irradiated
or FCCP. No significant differences between non-irradiated and irradiated samples, either in the presence or absence of Omy A
sperm in the presence/absence of oligomycin A or FCCP were observed, nor or FCCP. However, geometric mean of the intensity of
between samples in the presence of Omy A or FCCP and the treatment JC1agg (orange, FL2) in the sperm population with high
without the two disruptors for a given light-stimulation protocol (i.e., control,
MMP was significantly (P < 0.05) lower in the non-
P1, P5, or P10). Data are shown as mean ± SD from eight separate
experiments.
irradiated sample containing FCCP than in that without
any inhibitor/disruptor (Figure 4C).
Frontiers in Cell and Developmental Biology | www.frontiersin.org 6 December 2020 | Volume 8 | Article 588621Catalán et al. Mitochondria and Donkey Sperm Irradiation
FIGURE 2 | Effects of light-stimulation on the percentages of total (A) and progressive (B) sperm motility in the presence/absence of oligomycin A (Omy A) or FCCP.
Different letters (a b) indicate significant differences (P < 0.05) between oligomycin A or FCCP with respect to the treatment without the two for a given protocol (i.e.,
control, P1, P5, or P10). No significant differences were found between the samples exposed to the different irradiation times with respect to non-irradiated sperm.
Data are shown as mean ± SD from eight separate experiments.
TABLE 1A | Kinetic parameters (VSL, VCL, and VAP) of donkey sperm in the control and the different light-stimulation patterns in the presence or absence of oligomycin
A (Omy A) and FCCP.
Treatments Kinetic parameters
VCL (µm/s) VSL (µm/s) VAP (µm/s)
Mean ± SD Q1, median, Q3 Mean ± SD Q1, median, Q3 Mean ± SD Q1, median, Q3
Control Control 130.7 ± 13.5Aa 110.0, 133.0, 147.5 102.1 ± 10.9Aa 89.0, 105.3, 111.6 117.6 ± 6, 9Aa 101.3, 121.0, 131.1
Omy A 66.0 ± 8.7Ab 55.6, 64.7, 77.1 42.4 ± 8.7Ab 30.8, 44.2, 47.6 46.5 ± 6.0Ab 36.0, 49.1, 53.7
FCCP 75.8 ± 9.8Ab 69.5, 75.9, 87.8 44.0 ± 9.5Ab 35.1, 46.4, 49.9 49.2 ± 6.9Ab 40.7, 52.2, 57.4
P1 Control 135.2 ± 15.6Aa 110.6, 137.4, 156.4 105.1 ± 13.3Aa 88.6, 107.3, 120.5 126.3 ± 9.9Aa 103.2, 129.0, 138.8
Omy A 68.4 ± 8.1Ab 59.4, 66.6, 77.1 43.2 ± 7.4Ab 35.2, 46.9, 50.7 47.7 ± 5.5Ab 39.2, 50.4, 55.0
FCCP 73.4 ± 11.8Ab 63.5, 70.1, 91.5 41.2 ± 10.6Ab 31.9, 45.7, 51.8 46.5 ± 8.9Ab 34.1, 50.8, 58.3
P5 Control 139.6 ± 11.6Aa 123.7, 141.5, 153.4 109.2 ± 8.9Aa 94.9, 108.2, 117.4 130.7 ± 6.2Ba 115.3, 131.8, 142.5
Omy A 69.2 ± 10.8Ab 55.8, 65.9, 82.6 44.5 ± 10.6Ab 35.1, 46.0, 54.4 49.5 ± 5.5Ab 38.9, 51.1, 60.7
FCCP 80.4 ± 12.3Ab 69.2, 81.8, 92.2 48.6 ± 11.5Ab 39.4, 49.6, 54.2 53.0 ± 6.4Ab 43.7, 54.8, 59.2
P10 Control 141.2 ± 10.7Aa 132.6, 142.2, 158.7 110.0 ± 11.6Aa 99.5.0, 111.2, 119.5 132.1 ± 6.4Aa 122.4, 133.9, 142.3
Omy A 66.9 ± 8.1Ab 57.4, 66.2, 76.8 41.9 ± 7.5Ab 34.5, 42.8, 49.8 46.1 ± 5.5Ab 38.4, 47.3, 54.0
FCCP 78.2 ± 11.7Ab 68.4, 76.9, 90.5 47.1 ± 10.6Ab 37.1, 49.1, 53.7 54.2 ± 6.2Ab 41.4, 53.7, 59.3
Different letters (A,B) indicate significant differences (P < 0.05) between the control and the different light stimulation patterns used in the presence or absence of
oligomycin A (Omy A) or FCCP. Different letters (a,b) indicate significant differences (P < 0.05) between Omy A or FCCP with respect to treatment without the two
inhibitors for a given protocol (i.e., control, P1, P5, or P10). Data are shown as mean ± SD, median and interquartile range from eight separate experiments.
Finally, we also evaluated JC1agg /JC1mon ratios of sperm high levels of peroxides (DCF+ /PI− ). No significant differences
populations with high (Figure 4E) and intermediate MMP between irradiated and non-irradiated samples were observed,
(Figure 4F). No significant differences between non- either in the presence or absence of Omy A or FCCP. In addition,
irradiated and irradiated samples were observed, either in the no significant differences were found within each irradiation
presence/absence of Omy A/FCCP, or within the same irradiation pattern when samples with and without disruptors (Omy A and
pattern comparing samples with and without disruptors. FCCP) were compared.
Percentages of viable sperm with high levels of superoxides
Effects of Red Light Stimulation on (% E+ /YO-PRO-1− spermatozoa; Figure 5C) and GMFI of E+
Intracellular ROS Levels in the Presence in the viable sperm population with high levels of superoxides
or Absence of Either Omy A or FCCP (E+ /YO-PRO-1− ; Figure 5D) did not significantly differ between
Figures 5A,B show the proportions of viable spermatozoa with irradiated and non-irradiated samples, or between treatments
high intracellular levels of peroxides (% DCF+ /PI− spermatozoa) with and without disruptors (Omy A and FCCP) within each
and the GMFI of DCF+ in the population of viable sperm with irradiation pattern.
Frontiers in Cell and Developmental Biology | www.frontiersin.org 7 December 2020 | Volume 8 | Article 588621Catalán et al. Mitochondria and Donkey Sperm Irradiation
TABLE 1B | Kinetic parameters (LIN, STR and WOB) of donkey sperm in the control and the different light-stimulation patterns in the presence or absence of oligomycin
A (Omy A) and FCCP.
Treatments Kinetic parameters
LIN (%) STR (%) WOB (%)
Mean ± SD Q1, median, Q3 Mean ± SD Q1, median, Q3 Mean ± SD Q1, median, Q3
Control Control 77.8 ± 3.4Aa 69.6, 79.7, 84.8 85.2 ± 2.1Aa 78.5.6, 87.1, 90.7 91.3 ± 3.6Aa 88.7, 91.1, 96.2
Omy A 63.9 ± 7.7Ab 55.0, 64.6, 72.0 90.3 ± 2.4Ab 87.3, 91.7, 92.8 70.6 ± 8.0Ab 63.1, 70.4, 79.6
FCCP 56.2 ± 7.5Ab 49.3, 59.2, 63.1 88.0 ± 2.9Aa 87.8, 90.4, 90.8 62.9 ± 7.9Ab 56.1, 65.2, 69.6
P1 Control 78.3 ± 2.6Aa 72.9, 77.8, 84.2 84.9 ± 1.8Aa 79.7, 85.2, 90.3 92.1 ± 2.8Aa 91.2, 91.7, 93.3
Omy A 63.2 ± 6.9Ab 56.9, 62.0, 69.1 90.4 ± 1.4Ab 89.2, 90.5, 91.3 69.8 ± 7.9Ab 63.5, 68.9, 76.3
FCCP 56.0 ± 7.8Ab 49.4, 54.7, 61.6 88.3 ± 2.2Aa 87.3, 88.5, 90.1 63.3 ± 8.3Ab 56.7, 61.2, 69.8
P5 Control 78.1 ± 3.2Aa 67.7, 81.1, 86.2 84.2 ± 2.2Aa 78.9, 86.8, 90.7 93.0 ± 3.6Aa 89.1, 91.4, 95.8
Omy A 64.3 ± 6.2Ab 54.6, 67.5, 72.1 89.7 ± 2.4Ab 86.6, 89.8, 92.5 71.5 ± 8.6Ab 63.0, 74.1, 78.5
FCCP 59.5 ± 9.7Ab 50.1, 56.9, 69.9 90.3 ± 1.4Ab 88.6, 91.1, 91.6 65.7 ± 10.3Ab 55.9, 63.0, 75.5
P10 Control 78.3 ± 3.5Aa 71.0, 77.9, 86.4 83.8 ± 2.7Aa 80.3, 84.8, 90.6 93.1 ± 4.8Aa 88.4, 91.9, 96.0
Omy A 62.6 ± 8.3Ab 55.3, 60.1, 70.8 90.8 ± 1.6Ab 89.2, 90.9, 92.5 68.8 ± 8.7Ab 61.9, 65.3, 77.7
FCCP 60.2 ± 10.0Ab 50.9, 58.7, 68.5 90.4 ± 1.1Ab 89.6, 90.3, 90.9 66.5 ± 10.4Ab 57.0, 65.1, 74.3
Different letters (A,B) indicate significant differences (P < 0.05) between the control and the different light stimulation patterns used in the presence or absence of
oligomycin A (Omy A) or FCCP. Different letters (a,b) indicate significant differences (P < 0.05) between Omy A or FCCP with respect to treatment without the two
inhibitors for a given protocol (i.e., control, P1, P5, or P10). Data are shown as mean ± SD, median and interquartile range from eight separate experiments.
Effects of Red Light Stimulation on nor between the presence/absence of disruptors within each
Intracellular Calcium Levels in the irradiation pattern (Figure 6A). Similar results were obtained
in the case for the GMFI of Fluo3+ in the viable sperm
Presence or Absence of Either Omy A or population with high intracellular calcium levels (Fluo3+ /PI− ;
FCCP Figure 6B).
Percentages of viable sperm with high intracellular calcium
levels did not differ between irradiated and non-irradiated
samples in the presence/absence of Omy A and FCCP, Effects of Red Light Stimulation on
Intracellular Levels of ATP and Oxygen
Consumption in the Presence or
TABLE 1C | Kinetic parameters (ALH and BCF) of donkey sperm in the control
and the different light-stimulation patterns in the presence or absence of
Absence of Either Omy A or FCCP
oligomycin A (Omy A) and FCCP. Figure 7A shows the intracellular levels of ATP observed
in non-irradiated and irradiated samples in the presence or
Treatments Kinetic parameters absence of Omy A or FCCP. No significant differences were
ALH (µm) BCF (Hz)
observed between non-irradiated and irradiated samples were
Mean ± SD Q1, median, Q3 Mean ± SD Q1, median, Q3
observed, either in the presence or absence of oligomycin
A. In the presence of FCCP, intracellular ATP levels were
Control Control 2.5 ± 0.7Aa 1.8, 2.6, 3.3 9.2 ± 1.0Aa 8.1, 9.0, 10.3 significantly (P < 0.05) higher in sperm irradiated for
Omy A 2.4 ± 0.3Aa 2.1, 2.4, 2.7 12.9 ± 1.0Ab 10.4, 12.6, 13.5 1 min than in those non-irradiated. In addition, samples
FCCP 2.8 ± 0.3Aa 2.5, 2.9, 3.0 13.3 ± 0.7Ab 12.3, 13.3, 13.8 irradiated for 1 min showed significantly (P < 0.05) higher
P1 Control 2.6 ± 0.4Aa 1.9, 2.5, 3.2 9.1 ± 1.1Aa 7.7, 8.9, 11.0 intracellular levels of ATP in the presence than in the
Omy A 2.5 ± 0.2Aa 2.3, 2.5, 2.7 12.7 ± 0.8Ab 11.0, 12.5, 13.1 absence of FCCP.
FCCP 2.9 ± 0.4Aa 2.5, 2.8, 3.2 12.9 ± 0.9Ab 12.2, 12.7, 13.7 Figure 7B shows that light stimulation (P < 0.05) significantly
P5 Control 2.6 ± 0.6Aa 2.0, 2.5, 3.4 8.9 ± 1.0Aa 7.7, 8.8, 10.4 increased the O2 consumption rate in all three protocols (i.e.,
Omy A 2.5 ± 0.4Aa 2.2, 2.4, 2.8 11.8 ± 0.9Ab 10.6, 12.0, 12.9 P1, P5, and P10) compared to the non-irradiated control.
FCCP 2.9 ± 0.3Aa 2.6, 3.0, 3.1 13.8 ± 1.0Ab 11.8, 13.6, 14.2 In samples containing Omy A, no significant differences
P10 Control 2.7 ± 0.6Aa 2.0, 2.8, 3.5 9.4 ± 0.9Aa 8.2, 9.4, 10.6 between non-irradiated and irradiated samples were observed.
Omy A 2.5 ± 0.3Aa 2.2, 2.4, 2.7 12.3 ± 0.9Ab 11.0, 12.4, 13.3 However, O2 consumption rates in non-irradiated and irradiated
FCCP 2.8 ± 0.4Aa 2.4, 2.8, 3.1 13.8 ± 0.8Ab 12.1, 13.7, 14.0 samples containing Omy A were significantly (P < 0.05)
Different letters (A,B) indicate significant differences (P < 0.05) between the control lower than in the ones that did not contain this inhibitor.
and the different light stimulation patterns used in the presence or absence of On the other hand, no significant differences between
oligomycin A (Omy A) or FCCP. Different letters (a,b) indicate significant differences
irradiated and non-irradiated samples were observed in
(P < 0.05) between oligomycin A or FCCP with respect to treatment without the two
inhibitors for a given protocol (i.e., P1, P5, or P10). Data are shown as mean ± SD, samples containing FCCP. However, samples containing FCCP
median and interquartile range from eight separate experiments. showed significantly (P < 0.05) higher O2 consumption rates
Frontiers in Cell and Developmental Biology | www.frontiersin.org 8 December 2020 | Volume 8 | Article 588621Catalán et al. Mitochondria and Donkey Sperm Irradiation
TABLE 2 | Descriptive parameters (mean ± SD, median and interquartile range) of the four sperm subpopulations (SP1, SP2, SP3, and SP4) identified in donkey fresh
semen, in the presence or absence of oligomycin A (Omy A) or FCCP.
SP1 SP2 SP3 SP4
N 7,611 9,455 16,551 6,694
Parameter Mean ± SD Q1, median, Q3 Mean ± SD Q1, median, Q3 Mean ± SD Q1, median, Q3 Mean ± SD Q1, median, Q3
VCL µm/s) 168.4 ± 13.6 153.1, 168.1, 182.0 114.2 ± 16.1 98.0, 116.4, 132.8 70.2 ± 14.9 54.5, 68.7, 86.3 151.4 ± 19.5 132.3, 155.7, 173.9
VSL µm/s) 132.9 ± 18.0 113.5, 132.9, 150.9 101.7 ± 15.6 84.6, 102.3, 119.7 41.8 ± 9.3 30.5, 43.1, 53.8 54.5 ± 17.8 35.7, 56.0, 74.2
VAP µm/s) 152.4 ± 14.9 137.0, 151.8, 166.8 109.2 ± 16.1 92.1, 111.0, 128.2 47.4 ± 7.6 36.2, 47.8, 58.4 115.0 ± 19.1 98.9, 117.8, 134.2
LIN (%) 78.9 ± 9.2 69.8, 80.7, 88.7 89.1 ± 5.7 85.4, 91.3, 94.7 59.4 ± 13.2 49.8, 61.3, 71.2 35.9 ± 12.1 24.3, 37.4, 48.2
STR (%) 87.1 ± 7.2 81.8, 88.7, 94.4 93.3 ± 4.2 90.5, 95.5, 97.9 86.5 ± 12.2 84.9, 92.6, 95.5 47.3 ± 16.5 33.3, 49.2, 61.8
WOB (%) 90.3 ± 4.3 84.6, 91.1, 95.0 95.1 ± 3.6 92.4, 96.4, 98.8 68.1 ± 10.5 59.5, 68.5, 73.3 75.9 ± 9.1 69.3, 77.9, 84.2
ALH (µm) 3.7 ± 0.6 3.1, 3.6, 4.2 2.1 ± 0.5 1.6, 2.0, 2.5 2.6 ± 0.5 2.1, 2.5, 3.0 4.6 ± 1.1 3.7, 4.6, 5.5
BCF (Hz) 10.9 ± 2.5 9.0, 11.0, 13.0 8.2 ± 2.0 6.8, 8.0, 10.0 11.6 ± 3.1 9.0, 12.0, 14.0 8.0 ± 2.4 6.0, 8.0, 10.0
These data were obtained after classifying sperm cells into motile subpopulations through principal component and cluster analyses.
FIGURE 3 | Effects of light stimulation on the structure of the motile sperm subpopulation in the presence/absence of oligomycin A (Omy A) or FCCP.
(A) Subpopulation 1 (SP1, the fastest and most linear); (B) Subpopulation 2 (SP2 presented intermediate values, lower than SP1 and SP4, but more linear than SP4;
(C) Subpopulation 3 (SP3, the slowest, but more linear than SP4); and (D) Subpopulation 4 (SP4 presented intermediate values, higher than SP2, but was the least
linear). Different letters (A,B) indicate significant differences (P < 0.05) between non-irradiated samples and the different light stimulation patterns used in the
presence or absence of oligomycin A (Omy A) or FCCP. Different letters (a,b) indicate significant differences (P < 0.05) between oligomycin A (Omy A) or FCCP with
respect to the treatment without the two disruptors for a given protocol (i.e., control, P1, P5, or P10). Data are shown as mean ± SD from eight separate
experiments.
Frontiers in Cell and Developmental Biology | www.frontiersin.org 9 December 2020 | Volume 8 | Article 588621Catalán et al. Mitochondria and Donkey Sperm Irradiation FIGURE 4 | Effects of light stimulation on the mitochondrial membrane potential in the presence/absence of oligomycin A (Omy A) or FCCP. The results are presented as percentages of sperm with high mitochondrial membrane potential (MMP; JC1agg ++ ; (A) and with intermediate mitochondrial membrane potential (MMP; JC1agg + ; (B); geometric mean of the JC1agg fluorescence intensity (GMFI, FL2) in the sperm populations with high (C) and intermediate (D) MMP; and the JC1agg /JC1mon (GMFI FL2/GMFI FL1) ratios in sperm populations with high (E) and intermediate (F) MMP in control and irradiation patterns (P1, P5, or P10), in the presence/absence of Omy A. Different letters (A, B) indicate significant differences (P < 0.05) between non-irradiated samples and the different light-stimulation patterns used in the presence or absence of Omy A or FCCP. Different letters (a, b) indicate significant differences (P < 0.05) between Omy A or FCCP with respect to the treatment without the two disruptors for a given protocol (i.e., control, P1, P5, or P10). Data are shown as mean ± SD from eight separate experiments. Frontiers in Cell and Developmental Biology | www.frontiersin.org 10 December 2020 | Volume 8 | Article 588621
Catalán et al.                                                                                                              Mitochondria and Donkey Sperm Irradiation

  FIGURE 5 | Effects of light-stimulation on the percentages of viable spermatozoa with high peroxide levels (DCF+ /PI- ; (A) geometric mean of DCF+ -intensity (GMFI,
  FL1 channel) in the population of viable spermatozoa with high peroxide levels (B) and percentages of viable spermatozoa with high superoxide levels
  (E+ /YO-PRO-1- ; (C) and geometric mean of E+ -intensity (GMFI, FL3 channel) in the population of viable spermatozoa with high superoxide levels (D) in the control
  and irradiated samples in the presence or absence of oligomycin A (Omy A) or FCCP. No significant differences were observed between non-irradiated sperm and
  the different light-stimulation patterns used in the presence/absence of oligomycin A or FCCP, nor between the results of the samples in the presence of Omy A or
  FCCP with respect to the treatment without the two disruptors for a given protocol (i.e., control, P1, P5, or P10). Data are shown as mean ± SD from eight separate
  experiments.

than those without this disruptor, regardless of whether they                          (P < 0.05) lower CCO activity than when these two
were irradiated.                                                                       molecules were absent from non-irradiated sperm and
                                                                                       sperm irradiated for 5 min and 10 min. In contrast, CCO
Effects of Red Light Stimulation on                                                    activity in sperm irradiated for 1 min was significantly
Cytochrome C Oxidase Activity in the                                                   (P < 0.05) lower when Omy A was present than when this
                                                                                       inhibitor was absent.
Presence or Absence of Either Omy A or
FCCP
As shown in Figure 8, irradiation for 1, 5, or 10 min induced                          DISCUSSION
a significant increase (P < 0.05) in CCO activity compared to
non-irradiated samples. Although these effects were observed in                        The results obtained in the present study with regard to the
both the presence and absence of Omy A or FCCP, the highest                            potential of mitochondrial membrane, sperm kinetic parameters,
CCO activity was observed in sperm irradiated for 5 min in the                         the structure of motile sperm subpopulations, CCO activity
absence of Omy A/FCCP.                                                                 and oxygen consumption rate support that irradiation with
   While neither Omy A nor FCCP affected the significant                               red LED light affects mitochondrial activity of donkey sperm.
(P < 0.05) increase in CCO activity observed in                                        Furthermore, the impact of red light has been found to rely
irradiated sperm compared to non-irradiated sperm,                                     upon the time of exposure (i.e., 1, 5, or 10 min), regardless of
samples containing Omy A or FCCP showed significantly                                  the presence of Omy A and FCCP, which is in agreement with

Frontiers in Cell and Developmental Biology | www.frontiersin.org                 11                                        December 2020 | Volume 8 | Article 588621
Catalán et al. Mitochondria and Donkey Sperm Irradiation FIGURE 6 | Effects of light-stimulation on percentages of spermatozoa with high intracellular calcium levels (Fluo3+ ); (A) and geometric mean intensity of Fluo3+ (B) in the presence/absence of either oligomycin A or FCCP. No significant differences were observed between non-irradiated sperm and the different light stimulation patterns used in the presence or absence of oligomycin A (Omy A) or FCCP, nor between the results of the samples in the presence of Omy A or FCCP with respect to the treatment without the two inhibitors for a given protocol (i.e., control, P1, P5, or P10). Data are shown as mean ± SD from eight separate experiments. FIGURE 7 | Effects of light-stimulation on intracellular ATP levels (A) and O2 consumption rate (B) in the presence/absence of either oligomycin A (Omy A) or FCCP. Different letters (A, B) indicate significant differences (P < 0.05) between non-irradiated sperm and the different light stimulation patterns used in the presence or absence of Omy A or FCCP. Different letters (a, b) indicate significant differences (P < 0.05) between Omy A or FCCP with respect to the treatment without the two disruptors for a given protocol (i.e., control, P1, P5, or P10). Data are shown as mean ± SD from eight separate experiments. previous studies conducted in other mammalian species, such as related to the time of exposure and intensity. Therefore, the pigs, dogs, buffalos, humans, donkeys and horses (Corral-Baqués exact level of energy provided to sperm through red light et al., 2009; Abdel-Salam et al., 2011; Salman Yazdi et al., 2014; stimulation and the overall sperm function status appear to Yeste et al., 2016; Catalán et al., 2020a,b,c). In this context, be on the basis of the different impact observed between it is worth emphasizing that a high individual variation was treatments and species. observed, which indicates that apart from the relevance of the With regard to the effects of red light on the mitochondrial stimulation pattern, time and intensity (Yeste et al., 2016), the electron chain observed in this work, it is reasonable to surmise sperm response to red light also depend on the functional status that this could be explained by the direct action of red light on of the cell (Catalán et al., 2020a). Although the mechanisms mitochondrial photosensitizers (reviewed in Yeste et al., 2018). underlying this different response have yet to be elucidated, Indeed, we observed that red light affected the activity of CCO, this work suggests that, in donkey sperm, red light acts on which is a crucial component of the mitochondrial electron mitochondrial photosensitizers and that the energy supplied chain and is sensitive to light at a wavelength ranging from to the mitochondrial electron chain following irradiation is 630 to 660 nm (Lynch and Copeland, 1992). These observed Frontiers in Cell and Developmental Biology | www.frontiersin.org 12 December 2020 | Volume 8 | Article 588621
Catalán et al.                                                                                                         Mitochondria and Donkey Sperm Irradiation

                                                                                         irradiation of fresh donkey sperm with red light modifies the
                                                                                         structure of motile sperm subpopulations by increasing the
                                                                                         proportions of faster and more linear sperm cells. In addition,
                                                                                         our results concur with a previous study conducted on dog
                                                                                         semen, in which stimulation with red light (laser) significantly
                                                                                         increased the proportions of the fastest sperm subpopulation
                                                                                         (Corral-Baqués et al., 2009) and another one carried out
                                                                                         with fresh horse sperm where, in a similar fashion to this
                                                                                         work, an increase in the most rapid and linear subpopulation
                                                                                         was observed (Catalán et al., 2020c). These changes in the
                                                                                         characteristics of the motile sperm subpopulations, together with
                                                                                         those observed in sperm kinetic parameters, indicate that not
                                                                                         only does irradiation with red light increase the speed but
                                                                                         also alters the motility pattern of donkey sperm. While there
                                                                                         is not, at present, a clear explanation about how red light
                                                                                         stimulation affects sperm motility, the aforementioned impact
  FIGURE 8 | Effects of light-stimulation on cytochrome C oxidase activity in the
  presence/absence of either oligomycin A (Omy A) or FCCP. Different letters (A,
                                                                                         on mitochondrial function could provide some clues. Related
  B) indicate significant differences (P < 0.05) between non-irradiated sperm            to this, it is worth mentioning that the increase observed in
  and the different light stimulation patterns used in the presence or absence of        VAP and in the proportions of spermatozoa belonging to SP1
  Omy A or FCCP. Different letters (a, b) indicate significant differences               was concomitant with a rise in the percentages of sperm with
  (P < 0.05) between Omy A or FCCP with respect to the treatment without the
                                                                                         high MMP, determined through JC1. These findings agree with
  two inhibitors for a given protocol (i.e., control, P1, P5, or P10). Data are
  shown as mean ± SD from eight separate experiments.
                                                                                         Siqueira et al. (2016), who found that irradiation with a He-
                                                                                         Ne laser at a wavelength of 633 nm augmented the percentage
                                                                                         of sperm with intermediate MMP. Similar results were found
                                                                                         in pig, donkey and horse sperm, since irradiation with red
increases in CCO activity are similar to those reported in                               LED light at a wavelength between 620 and 630 nm increased
ram semen irradiated with He-Ne laser (632.8 nm; Iaffaldano                              the percentages of sperm with high MMP (Yeste et al., 2016;
et al., 2016) and in liquid-stored pig semen irradiated with LED                         Catalán et al., 2020a,b,c). Therefore, the current study suggests
(Blanco-Prieto et al., personal communication), which would also                         that stimulation with red light increases mitochondrial activity
support the hypothesis that mitochondrial photosensitizers play                          through endogenous photosensitizers, such as cytochrome C
a relevant role in the effects of red light upon sperm cells. On                         (Begum et al., 2013; Iaffaldano et al., 2016; Yeste et al.,
the other hand, our results showed that neither irradiation nor                          2016; Catalán et al., 2020a,b,c), which could, in turn, lead
the presence of Omy A or FCCP had any detrimental effect on                              to greater motility of sperm and higher fertilization potential
sperm viability, which was evaluated through the SYBR14+ /PI−                            (Breitbart et al., 1996).
test. These results are in agreement with Yeste et al. (2016)                               Recent studies indicate that oxygen consumption represents
and Pezo et al. (2019), who conducted their studies in liquid-                           an alternative measure of mitochondrial activity, which could
stored pig semen; Catalán et al. (2020a), who evaluated the                              be better than the use MMP markers, such as JC1 (Moscatelli
effects of red light irradiation on fresh and cooled-stored donkey                       et al., 2017; Meyers et al., 2019). Oxygen consumption rate
semen; and Catalán et al. (2020b,c) that used frozen-thawed and                          would also provide an indirect measure of ATP produced
fresh horse sperm.                                                                       by oxidative phosphorylation in mammalian sperm (Meyers
    As far as the effects of red light on sperm motility are                             et al., 2019). The results obtained in this study showed an
concerned, it is worth mentioning that while no significant                              increase in oxygen consumption on all irradiated samples
differences were observed in the percentages of TMOT and                                 (namely, light-stimulated for 1, 5, or 10 min) in the absence
PMOT between non-irradiated and samples irradiated with red                              of Omy A or FCCP compared to the non-irradiated control.
light, light-stimulation for 5 min or 10 min in the absence                              While these results are in agreement with those obtained from
of Omy A/FCCP significantly increased VAP, which is in                                   the evaluation of some motility parameters, the structure of
agreement with previous studies conducted in dogs (Corral-                               motile subpopulations, the percentages of viable sperm with
Baqués et al., 2005, 2009), cattle (Siqueira et al., 2016), buffalos                     high MMP and the activity of cytochrome C oxidase, it is
(Abdel-Salam et al., 2011), pigs (Yeste et al., 2016), donkeys                           surprising that no link to intracellular levels of ATP was
(Catalán et al., 2020a), and horses (Catalán et al., 2020b,c).                           observed, since no differences in this parameter were found
We also evaluated the effects of red light on motile sperm                               when non-irradiated and irradiated samples without oligomycin
subpopulations and we identified four different subpopulations,                          A/FCCP were compared. Moreover, no relationship between
which is in agreement with that previously reported in the                               intracellular ATP levels and other mitochondrial parameters
donkey (Miró et al., 2005). Remarkably, we observed that                                 was observed in samples irradiated for 1 min in the presence
irradiation for 1 min increased the percentages of sperm                                 of FCCP. The increase in the potential of the mitochondrial
belonging to SP1, which was the one that included the fastest                            membrane is associated with changes in the consumption
and most linear motile sperm. Thus, our data suggest that                                of ATP and in the activity of respiratory chain enzymes

Frontiers in Cell and Developmental Biology | www.frontiersin.org                   13                                 December 2020 | Volume 8 | Article 588621
You can also read


