Changes in Leaf-Level Nitrogen Partitioning and Mesophyll Conductance Deliver Increased Photosynthesis for Lolium perenne Leaves Engineered to ...
←
→
Page content transcription
If your browser does not render page correctly, please read the page content below
ORIGINAL RESEARCH
                                                                                                                                        published: 09 March 2021
                                                                                                                                  doi: 10.3389/fpls.2021.641822

                                              Changes in Leaf-Level Nitrogen
                                              Partitioning and Mesophyll
                                              Conductance Deliver Increased
                                              Photosynthesis for Lolium perenne
                                              Leaves Engineered to Accumulate
                              Edited by:
                                              Lipid Carbon Sinks
                    Alistair McCormick,
                University of Edinburgh,      Luke J. Cooney *†, Zac Beechey-Gradwell †, Somrutai Winichayakul , Kim A. Richardson ,
                        United Kingdom        Tracey Crowther , Philip Anderson , Richard W. Scott , Gregory Bryan and
                                              Nicholas J. Roberts
                       Reviewed by:
                       Yunwei Zhang,
                                              Plant Biotechnology Team, AgResearch Ltd, Palmerston North, New Zealand
  China Agricultural University, China
                         Tiina Tosens,
 Estonian University of Life Sciences,        Diacylglycerol acyl-transferase (DGAT) and cysteine oleosin (CO) expression confers a
                               Estonia
                                              novel carbon sink (of encapsulated lipid droplets) in leaves of Lolium perenne and has
                  *Correspondence:
                     Luke J. Cooney           been shown to increase photosynthesis and biomass. However, the physiological
        luke.cooney@agresearch.co.nz          mechanism by which DGAT + CO increases photosynthesis remains unresolved. To
 These authors share first authorship
 †
                                              evaluate the relationship between sink strength and photosynthesis, we examined fatty
                                              acids (FA), water-soluble carbohydrates (WSC), gas exchange parameters and leaf nitrogen
                     Specialty section:
           This article was submitted to      for multiple DGAT + CO lines varying in transgene accumulation. To identify the physiological
                        Plant Physiology,     traits which deliver increased photosynthesis, we assessed two important determinants
                 a section of the journal
                                              of photosynthetic efficiency, CO2 conductance from atmosphere to chloroplast, and
              Frontiers in Plant Science
                                              nitrogen partitioning between different photosynthetic and non-photosynthetic pools.
         Received: 15 December 2020
          Accepted: 11 February 2021          We found that DGAT + CO accumulation increased FA at the expense of WSC in leaves
           Published: 09 March 2021           of L. perenne and for those lines with a significant reduction in WSC, we also observed
                               Citation:      an increase in photosynthesis and photosynthetic nitrogen use efficiency. DGAT + CO L.
       Cooney LJ, Beechey-Gradwell Z,
        Winichayakul S, Richardson KA,        perenne displayed no change in rubisco content or Vcmax but did exhibit a significant
     Crowther T, Anderson P, Scott RW,        increase in specific leaf area (SLA), stomatal and mesophyll conductance, and leaf nitrogen
        Bryan G and Roberts NJ (2021)
                                              allocated to photosynthetic electron transport. Collectively, we showed that increased
        Changes in Leaf-Level Nitrogen
             Partitioning and Mesophyll       carbon demand via DGAT+CO lipid sink accumulation can induce leaf-level changes in
        Conductance Deliver Increased         L. perenne which deliver increased rates of photosynthesis and growth. Carbon sinks
     Photosynthesis for Lolium perenne
      Leaves Engineered to Accumulate         engineered within photosynthetic cells provide a promising new strategy for increasing
                     Lipid Carbon Sinks.      photosynthesis and crop productivity.
           Front. Plant Sci. 12:641822.
        doi: 10.3389/fpls.2021.641822         Keywords: cysteine oleosin, diacylglycerol acyl-transferase, lipid, Lolium perenne, photosynthesis, sink strength

Frontiers in Plant Science | www.frontiersin.org                                  1                                        March 2021 | Volume 12 | Article 641822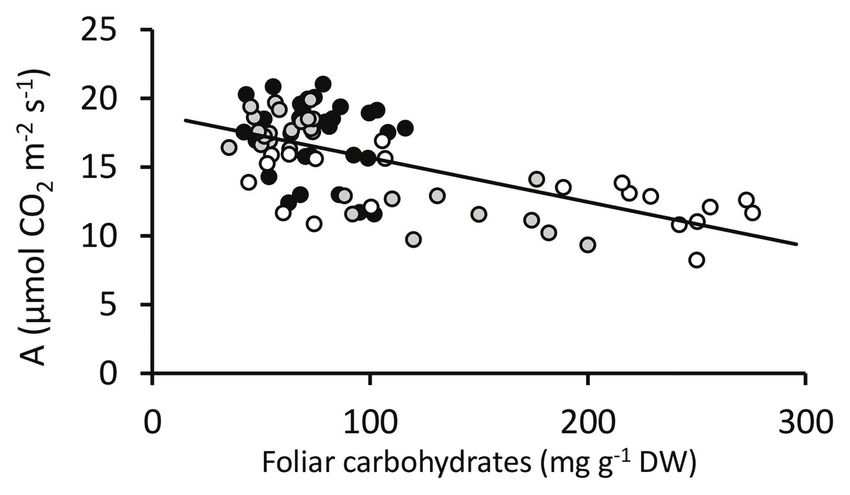
Cooney et al.                                                                                            Engineered Sinks Can Increase Photosynthesis

INTRODUCTION                                                                Finally, the use of global transcription factors to enhance oil
                                                                            accumulation may have unintended pleiotropic effects and could
Global food security remains one of the most pressing issues                impede normal cellular function (Grimberg et al., 2015). Indeed,
of our time. With increasing population and food production                 several gene combinations reported in the literature also coincided
needs, enhancing photosynthesis represents a major target for               with a growth penalty (Fan et al., 2013, 2014, 2015; Kelly
improving crop productivity (Evans and Lawson, 2020). To                    et al., 2013; Yurchenko et al., 2017; Zhai et al., 2017; Yu et al.,
address this, several bioengineering strategies have targeted               2018; Vanhercke et al., 2019a). One notable exception is the
improvements in the efficiency of photosynthetic energy                     combination of diacylglycerol acyltransferase (DGAT) and
conversion and photo-assimilate production, e.g., carbon                    cysteine-oleosin (CO) expression which collectively increased
concentrating mechanisms (Atkinson et al., 2016), C4 rice                   TAG assembly and prevented lipid droplet degradation, and
(Ermakova et al., 2020) and photorespiratory bypasses (Xin                  coincided with an increase in both photosynthesis and shoot
et al., 2015). While promising, the importance of photo-assimilate          biomass in Arabidopsis (Winichayakul et al., 2013). In Lolium
utilization to maintain photosynthetic capacity is also becoming            perenne (perennial ryegrass), DGAT + CO expression increased
increasingly apparent (Ainsworth and Bush, 2011; Jansson et al.,            FA at the expense of leaf carbohydrates, which coincided with
2018; Dingkuhn et al., 2020). Photosynthetic capacity is regulated          enhanced net carbon capture and growth, especially under
by (among other things) the demand for carbon (sink strength;               high N supply and elevated atmospheric CO2 (i.e., high carbon
Paul and Foyer, 2001), with a downregulation of photosynthesis              availability; Beechey-Gradwell et al., 2020). DGAT + CO
commonly reported for plants under diminished sink capacity,                L. perenne displayed a greater SLA (leaf area per unit dry
or under conditions of elevated carbon availability (Ainsworth              weight) than control plants, a trait typically associated with
et al., 2004; Bernacchi et al., 2005; Guo et al., 2006; Ribeiro             low carbon availability (e.g., low light; Poorter et al., 2009; or
et al., 2017; Ruiz-Vera et al., 2017). Carbon sinks are typically           frequent defoliation; Lee et al., 2010), and also reported for
associated with reproductive or heterotrophic organs, or new                high-oil transgenic Nicotiana tabacum during vegetative growth
growth in plants (Demmig-Adams et al., 2017). However, for                  (Mitchell et al., 2020). Increased SLA can provide more leaf
agronomic production mature leaves could also offer some                    area for light interception and gas exchange and partially
utility as carbon sinks, given the proximity to sites of carbon             explains the increased growth rate for DGAT + CO L. perenne
assimilation and ease of harvesting (relative to underground                (Beechey-Gradwell et al., 2020). Moreover, DGAT + CO L.
tissues). Increasing the sink capacity of leaves therefore represents       perenne exhibited greater net photosynthesis per unit leaf area
a promising strategy to maximize the photosynthetic potential               (Aarea), providing the first example of an engineered lipid carbon
of crops.                                                                   sink delivering increased photosynthesis in a commercially
    Oils are the most energy-dense metabolites found in plants              significant crop (Paul and Eastmond, 2020). Despite the potential
and an important carbon storage compound in seeds. By                       to simultaneously increase leaf energy density (Winichayakul
contrast, plant oils and their component fatty acids (FA) are               et al., 2020) and yield, the leaf-level physiological mechanism
found in low concentrations in vegetative tissues, present as               by which DGAT + CO increases Aarea remains unknown.
signaling molecules or structural components of cell membranes                  The photosynthetic apparatus accounts for most (60–80%)
(Xu and Shanklin, 2016). Elevation and stabilization of oils                of crop leaf nitrogen (N), so Aarea often correlates with leaf
in leaves, as occurs in seeds, could therefore increase the sink            N on an area basis (Narea; Evans, 1989). Although leaf N is
capacity of these organs. Fortunately, several bioengineering               untested for DGAT + CO L. perenne, the ratio of Aarea to
strategies have already been developed to increase the oil                  Narea, termed photosynthetic nitrogen use efficiency (PNUE)
content in leaves (Carlsson et al., 2011; Ohlrogge and Chapman,             is typically higher for high SLA species, achieved via (among
2011; Dyer et al., 2012; Winichayakul et al., 2013; Vanhercke               other factors) greater internal conductance to CO2 (gm) and
et al., 2017, 2019a). Although originally designed to increase              within-leaf N allocation to rate-limited photosynthetic functions
oil yields, these technologies may also provide a useful tool               (Poorter and Evans, 1998; Hikosaka, 2004; Onoda et al., 2017).
to examine the relationship between additional leaf sink capacity           Given the increased SLA reported for DGAT + CO L. perenne
and photosynthesis (Paul and Eastmond, 2020).                               (Beechey-Gradwell et al., 2020), changes to PNUE, gm, and
    The main compound in plant oil, triacylglycerol (TAG) and               within-leaf N allocation may similarly explain the reported
FA, represent the primary targets for oil increasing bioengineering         increase in Aarea. To examine the relationships between
strategies. However, of the numerous and varied gene                        DGAT + CO leaf lipid sinks, leaf N, and photosynthesis,
combinations reported in the literature (reviewed in Vanhercke              we carried out three experiments to test three specific hypotheses;
et al., 2014, 2019a), few described changes in photosynthesis               (Hypothesis i) that increased photosynthesis for DGAT + CO
and the reason are not immediately clear. It may simply be that             will depend upon the level of DGAT + CO accumulation (i.e.,
few groups sufficiently examined this trait, especially under               sink strength; experiment 1); (Hypothesis ii) that DGAT + CO
conditions which deliver high carbon availability (Fan et al.,              accumulation increases PNUE (experiments 1 and 2); (Hypothesis
2019). Alternatively, it may be that some technologies impose               iii) that DGAT + CO accumulation increases gm and within-
too small a sink to affect photosynthesis, especially if oils are           leaf N allocation to photosynthetic pools (experiment 3). In
not protected and are rapidly degraded within the leaf. Conversely,         experiment 1, we compared leaf FA, water-soluble carbohydrates
too great a sink could create excessive competition for carbon,             (WSC), leaf N, relative growth rates, and photosynthesis in
which could hinder plant development (Mitchell et al., 2020).               multiple DGAT + CO L. perenne lines, varying in DGAT + CO

Frontiers in Plant Science | www.frontiersin.org                        2                                     March 2021 | Volume 12 | Article 641822
Cooney et al. Engineered Sinks Can Increase Photosynthesis
accumulation. In experiment 2, we examined leaf nitrogen and KNO3. Following the establishment phase, shoot material was
photosynthesis for DGAT + CO L. perenne grown under five harvested 5 cm above the sand and used to rank plants from
levels of external nitrogen supply (1–7.5 mM NO3−). Finally, smallest to largest. The five smallest and five largest plants
in experiment 3, we compared rubisco content, mesophyll per line were discarded and 10 of the remaining 20 plants
conductance and the proportions of N allocated between per line were randomly selected and the remaining shoots
photosynthetic and non-photosynthetic pools for DGAT + CO (0–5 cm above pot surface) and roots were harvested, oven
L. perenne and non-transformed (NT) controls. dried and weighed (post-establishment harvest). The remaining
10 plants per line were grown for another 3 weeks, with 4 mM
NH4NO3 applied as described above, and harvested (final
MATERIALS AND METHODS harvest). Relative growth rate was calculated as per Poorter
(1989); RGR = (ln W2–ln W1)/(t2–t1) where W1 = post-
Plant Transformation establishment dry weight, W2 = final harvest dry weight, t1 = day
The coding sequences for CO and DGAT (S205A mutation; 22 and t2 = day 43.
Winichayakul et al., 2013) were optimized for expression in
rice and placed in a back-to-back orientation under the control
of the rice CAB and RUBISCO small subunit promoters, Experiments 2 and 3 Design
respectively. For Agrobacterium-mediated transformation, the Experiments 2 and 3 provide a detailed analysis of a single
expression cassette was cloned into the pCAMBIA1300 binary transgenic high lipid line, DGAT + CO5, and the corresponding
vector, while for particle bombardment, the cassette was cloned control, NT3. Experiment 2 relates to unreported leaf N and
into a pUC-based vector. gas exchange data from plants grown at ambient CO2 as part
Transformed lines were generated from L. perenne callus of a larger experiment described in Beechey-Gradwell et al.
induced from immature inflorescences and transformed by (2020). Plant growth conditions, preparation and establishment
Agrobacterium-mediated transformation (DGAT + CO1-4) or for experiment 2 was similar to experiment 1 [additional details
particle bombardment (DGAT + CO5). Plants from provided in Beechey-Gradwell et al. (2020)], however, during
Agrobacterium-mediated transformation were generated as per the regrowth phase, different N treatments were introduced,
Bajaj et al. (2006) while plants from microprojectile bombardment and plants were regrown under one of five levels of
were generated as per Altpeter et al. (2000). NO3− (1–7.5 mM).
For experiment 3, in which we examined rubisco contents,
mesophyll conductance and within-leaf N allocation (details
Experiment 1 Design and RGR Analysis below), an additional 12 ramets of DGAT + CO5 and NT3
In experiment 1, we examined multiple DGAT + CO lines,
were prepared and grown as per experiment 1 with two minor
varying in DGAT + CO accumulation. Five DGAT + CO
alterations; regrowth phase N supply was delivered as 5 mM
ryegrass lines were selected from three genetic backgrounds
NO3−, and growth irradiance, provided by the above LEDs,
(i.e., two DGAT + CO lines were generated from an “Alto”
had reduced slightly to ~550 μmol photons m−2 s−1.
cultivar individual and three DGAT + CO lines were generated
from two “Impact” cultivar individuals) and propagated asexually
via the production of clonal ramets as per Beechey-Gradwell SDS-PAGE Immunoblot Analysis of
et al. (2020). Each DGAT + CO line was then designated an DGAT + CO (Experiment 1)
arbitrary label, DGAT + CO1-5 [DGAT + CO5 was previously Protein samples were prepared by collecting four fresh
reported as either “HL” or “6205” by Beechey-Gradwell et al. L. perenne leaf blades (approximately 2 cm long) in a 2-ml
(2020)]. To eliminate growth form or tiller age differences screw cap micro tube containing 150 μl of sterile H2O, 200 μl
between ramets, all DGAT + CO lines, and respective of 2x protein loading buffer [1:2 diluted 4x lithium dodecyl
non-transformed (NT) controls, underwent three rounds of sulphate (LDS) sample buffer (Life Technologies, Carlsbad, CA,
propagation. During each round, five ramets of five tillers each United States)], 8 M urea, 5% (v/v) β-mercaptoethanol, and
were potted and grown for 4 weeks. All plants were grown 0.2 M dithiothreitol and 40 μl of NUPAGE™ sample reducing
in a controlled temperature room with ~600 μmol photons agent (NP0009, ThermoFisher Scientific, Waltham, MA,
m−2 s−1 red/blue light provided by 600W NanaPro LED lights United States). The mixtures were homogenized using the Bead
(LEDgrowlights, Hamilton, New Zealand), 20°C/15°C day/night Ruptor 24 model (Omni International, Kennesaw, GA,
temperature and 12 h photoperiod, with humidity uncontrolled United States). The samples were heated at 70°C for 10 min,
and commonly fluctuating between 65 and 75% during the centrifuged at 20,000 g for 30 s and collected for the soluble
day and 80 and 90% at night. In Jan 2019, 40 × 5-tiller ramets protein suspension. Equal quantities of proteins were determined
were produced for each line, 10 of which were immediately and separated by SDS-PAGE (Mini-PROTEAN® TGX stain-
harvested to confirm comparable starting weights free™ precast gels; Bio-Rad, Hercules, CA, United States) and
(Supplementary Table S1). The remaining 30 ramets per line blotted onto Bio-Rad polyvinylidene difluoride (PVDF)
were transplanted into 1.3 L sand and grown for 3 weeks to membrane for the DGAT1-V5 immunoblotting. Equivalent
establish a root system. During this “establishment phase,” pots amounts of proteins were separated on gradient 4–12% Bis-Tris
were flushed thrice weekly with 100 ml of basal nutrient media gel (NUPAGE; Life Technologies) and blotted onto nitrocellulose
described in Andrews et al. (1989) containing N as 2 mM membrane for the CO immunoblotting. Immunoblotting was
Frontiers in Plant Science | www.frontiersin.org 3 March 2021 | Volume 12 | Article 641822Cooney et al. Engineered Sinks Can Increase Photosynthesis
performed as described previously in Winichayakul et al. (2013). 10 steps with 5 min acclimation at each. Rd was then substituted
Chemiluminescent activity was developed using WesternBright into the regression equation of the initial A-Ci curve to solve
ECL spray (Advansta, Menlo Park, CA, United States) and for Ci*(Brooks and Farquhar, 1985). Γ* was solved simultaneously
visualized by ChemiDoc™ imaging system (Bio-Rad Laboratories with gm by substituting Γ* with Ci* + Rd/gm into equation 1
Inc.). Volume intensity of monomeric forms of the protein (Warren, 2006). This delivered a single converging value for
was quantified using Image Lab™ software for PC version 5.2.1 each gm and Γ*. Vcmax was derived using the A-Ci analysis
(Bio-Rad Laboratories Inc.). excel tool (Sharkey, 2016) with rate-limitation assigned using
chlorophyll fluorescence (Sharkey, 2016; Supplementary
Figure S1), and gm and Rd fixed as determined above. Slow
Photosynthetic Gas Exchange light-response curves were completed for determination of
(Experiments 1–3) Jmax (Sharkey, 2016). Again, the chamber conditions described
Gas exchange measurements for each experiment were completed above were used, however PAR increased from 0 to 1500 μmol
2–3 weeks after the post-establishment defoliation. Three tillers photons m−2 s−1 across 10 steps with 30 min acclimation
were selected per plant and the youngest fully expanded leaves at each. Jmax was then derived from the light response analysis
(determined by the appearance of a leaf collar and selected of the Sharkey excel tool (Sharkey, 2016), with gm and
to minimize the effects of self-shading) of each were Rd fixed.
simultaneously acclimated in the leaf chamber of either a For all gas exchange measurements, bulk flow leaks were
LI-COR 6800 (experiments 1 and 3) or a LI-COR 6400 infrared periodically checked by blowing on the leaf chamber. Diffusion
gas exchange system (LI-COR Biosciences Ltd., Nebraska, leaks through the chamber gaskets were minimized by performing
United States; experiment 2) under the following conditions; all low CO2 measurements with the Licor 6800, which displays
400 ppm CO2, 70% relative humidity, 20°C and PAR of either a lower leak rate coefficient than the 6400XT. After all gas
600, 1500 or 550 μmol photons m−2 s−1 red/blue light (for exchange analyses, leaves were then removed and photographed.
experiments 1, 2, and 3, respectively). After 20 min, net Leaf area was calculated using GIMP 2.8.22 (GNU Image
photosynthesis (Aarea), stomatal conductance (gs) and transpiration Manipulation Program1). Leaves were then dried and weighed,
(E) were measured. and specific leaf area calculated as SLA = LA/DW and
For experiment 3, mesophyll conductance (gm) was calculated photosynthesis per unit leaf mass calculated as Amass = SLA × A.
via the variable J method (Harley et al., 1992) using
A Fatty Acid Analysis (Experiment 1)
gm =
Γ ∗ J + 8 ( A + Rd ) (1) Leaf material was collected on the final day of the experiment,
Ci − freeze dried and ground via bead mill. Ten milligram was
J − 4 ( A + Rd )
sub-sampled per plant and from this, FA were extracted in
where J was derived from chlorophyll fluorescence (quantum hot methanolic HCl (modified after Browse et al., 1986). FA
efficiency of PSII × PAR × PSII absorbance). PSII absorbance were quantified by GC-MS (QP 2010 SE, Shimadzu Corp.,
was assumed to be half of leaf absorbance (Pons et al., 2009), Kyoto, Japan) against an internal standard of 10 mg C15:0
measured as ChlA+B/(ChlA+B + 76) as in Evans and Poorter and total FA were calculated as the sum of palmitic acid (16:0),
(2001) where ChlA+B is total chlorophyll per unit leaf area (the palmitoleic acid (16:1), stearic acid (18:0), oleic acid (18:1),
quantification of which is described below). J was then adjusted linoleic acid (18:2) and linolenic acid (18:3).
according to Pons et al. (2009) using the relationship between
J derived via chlorophyll fluorescence and J derived via gas
exchange (4 x gross assimilation) under non-photorespitory Sugar Quantification (Experiment 1)
conditions. Accordingly, A-Ci curves were performed under Total water-soluble carbohydrates (WSC) were analyzed using
photorespitory and non-photorespitory conditions as follows; the anthrone method (Hedge and Hofreiter, 1962). Leaves were
ambient O2 A-Ci curves were performed first using the chamber sampled at midday and immediately frozen in liquid nitrogen.
conditions described above and the following CO2 concentrations; Using 25 mg freeze-dried, ground leaf material, low molecular
400, 300, 200, 100, 50, 0, 400, 400, 400, 600, 700, 800, 900, weight carbohydrates (LMW; including glucose, fructose, sucrose
1000, and 1200. At each step, leaves were given 3 min to and some LMW fructans; Pollock and Jones, 1979) were twice
acclimate before data logging. The air supply was then extracted in 1 ml, 4:1 EtOH: H2O at 65°C for 30 min, centrifuged
immediately switched to 2% O2 provided by supplementary and supernatant collected and combined at each extraction.
gas (2% O2 in N; BOC Limited, NSW, Australia) via the main High molecular weight carbohydrates (HMW; this fraction
console air inlet with a flow meter used to confirm positive includes HMW fructans, the main storage sugar in L. perenne;
air flow. Leaves were given an additional 30 min to acclimate Pollock and Jones, 1979) were then twice extracted in 1 ml
to low O2 before the A-Ci procedure was repeated. Rapid light H2O at 65°C for 30 min, centrifuged and supernatant collected
response curves were used for determination of Rd via the and combined at each extraction. The soluble carbohydrate
Kok method (Kok, 1948), modified after Yin et al. (2011); the extracts were mixed with anthrone reagent (Sigma-Aldrich, St
same ambient O2 chamber conditions described above were Louis, MO, United States) for 25 min at 65°C, A620 determined
used except leaves were acclimated under saturating PAR,
1500 μmol photons m−2 s−1, before dropping PAR to 0 across http://www.gimp.org
1
Frontiers in Plant Science | www.frontiersin.org 4 March 2021 | Volume 12 | Article 641822Cooney et al. Engineered Sinks Can Increase Photosynthesis using a Versamax tunable plate reader (Molecular Devices (NO) was calculated as Nmass – NS – NP – NE. Approximately Corporation, Sunnyvale, CA, United States) and compared to 1 g fresh subsamples were weighed, oven-dried, and weighed LMW and HMW standards, prepared using sucrose and inulin, again for converting the above FW measurements to DW basis, respectively. and then converted onto a leaf area basis by dividing by SLA. Leaf Nitrogen Biochemistry Including Statistical Analysis Rubisco and Chlorophyll Quantification All statistical analyses as well as normality and variance tests (Experiment 3) were performed using R version 3.3.3 (R Foundation, Vienna, Total soluble protein was quantified according to Bradford (1976). Austria). For experiment 1, two-way factorial ANOVAs were Using 500 mg leaf FW ground in liquid N, soluble protein used to evaluate the relationship between each of the following was twice extracted in 15 ml of 50 mM sodium phosphate dependent variables: FA, WSC, gas exchange parameters, biomass, buffer (pH 7) containing 5 mM DTT, centrifuged (4000 g, RGR, SLA and independent factors: genetic background (3 levels) 15 min, 4°C) and 5 μl of the supernatant combined with and line (8 levels, i.e., 3 NT and 5 DGAT + CO). Tukey tests 200 μl Bio-Rad protein assay dye (Bio-Rad, CA, United States). were used for post-hoc analysis. Kruskall-Wallis tests were used Absorbance was measured at 595 nm using bovine serum to evaluate the effect of DGAT + CO on non-normal variables, albumin (MP biomedical, Auckland, New Zealand) as the projected leaf area, and their values of p were adjusted using protein standard. Rubisco was determined according to Makino a Bonferroni correction. Linear regressions were used to evaluate et al. (1986) with minor modifications. The total soluble protein the relationship between recombinant protein contents and FA. extract (20 μl) was combined (1:1) with 2x Laemmli Buffer One-way ANOVAs were used to compare LMW and HMW (Sigma S3401-10VL, St Louis, MO, United States) and heated carbohydrates of NT1-3 with Tukey tests used for post-hoc at 95°C for 5 min. Protein samples were then separated by analysis. For experiment 2, a forward stepwise regression was SDS-PAGE (Bio-Rad, 4–15% Mini-PROTEAN TGX Stain-free) used to evaluate the relationship between genotype (NT3 and for 30 min at 180 V and the resulting gels stained with 0.25% DGAT + CO5), NO3− supply (treated as continuous) and dependent CBB-R dye in 40% methanol and 10% acetic acid solution variables: Asat, SLA, leaf Nmass, Narea, gs and PNUE. Variables overnight, and then rinsed repeatedly with 40% methanol and and interaction terms with a value of p < 0.05 were retained 10% acetic acid solution until the background was colorless. in the final model. Quadratic terms were tested in each of the Large (52 kDa) and small (15 kDa) Rubisco subunits were models to account for non-linear responses to NO3− supply or excised from the gel and transferred into tubes with 0.75 ml leaf N. The same procedure was used for investigating the of formamide and shaken at 50°C for 6 h. The absorbance relationships between genotype, WSC, and leaf N content on of the formamide extracts was measured at 595 nm using the photosynthesis. For experiment 3, NT3 and DGAT + CO5 were background gel as a blank and bovine serum albumin as the compared using a Student’s t-test or Wilcoxon rank sum test. protein standard. N associated with soluble protein (NS) and rubisco (NR) was calculated assuming protein contains 16% N. Using 200 mg leaf FW, ground in liquid N, chlorophylls RESULTS were twice extracted in 10 ml 95% EtOH, then stored for 6–8 h in the dark with regular vortexing, and then centrifuged Experiment 1: Comparing Multiple (4000 g, 15 min, 4°C). The supernatant was removed, diluted DGAT + CO Lines Varying in DGAT + CO 2-fold and absorbance peaks measured using a Versamax Accumulation tunable plate reader using the pathlength correction formula Five DGAT + CO lines were examined here, two described in Warren (2008). Chlorophyll concentrations were (DGAT + CO1-2) transformed using an “Alto” cultivar individual determined from A648 and A664 using the formula described (NT1), and three transformed using two “Grasslands Impact” in Lichtenthaler (1987). N associated with pigment-protein cultivar individuals (DGAT + CO3-4 background, NT2; complexes (NP) was calculated assuming 37.3 mol N mol−1 DGAT + CO5 background, NT3). For each DGAT + CO line, total Chl (Evans and Clarke, 2019). the presence of transgenic proteins was confirmed via SDS-page Nitrogen associated with electron transport and ATP synthesis immunoblot analysis (Figure 1). All DGAT + CO lines displayed (collectively “bioenergetics”; NE) was calculated indirectly from a significant increase in leaf fatty acids (FA), ranging from electron transport capacity [Jmax; the calculation of which was 118 to 174% of respective non-transformed (NT) controls described above and here adjusted to 25°C as per June et al. (Figure 1). For the DGAT + CO lines, total leaf FA represented (2004)]. A linear correlation between cytochrome f (cyt f) 4.8–5.5% of leaf dry weight (DW), whereas NT controls ranged content per unit leaf area and Jmax at 25°C, of 155 mol electron from 2.9 to 4% of leaf DW (Table 1). The relative increase mol−1 cyt f s−1 was assumed (Evans, 1987). Recently revised in total FA for each line, compared to respective NT control, ratios of cyt f to the other components of electron transport strongly correlated with DGAT accumulation (r2 = 0.82, and ATP synthesis were used to calculate an NE cost of p = 0.03), but was not statistically significant for CO (r2 = 0.67, 10.86 mol N mmol−1 cyt f (Evans and Clarke, 2019). p > 0.05). The composition of FA was significantly altered by Total N concentration (Nmass) was determined on 200 mg of DGAT + CO expression, with all lines exhibiting a significant dried, ground samples using a CN elemental analyzer (Elementar increase in C18:1 and C18:2 and a decrease in C16:0, C16:1, VarioMax CN analyzer, Hanau, Germany). “Remaining” leaf N and C18:3 (Table 1). Frontiers in Plant Science | www.frontiersin.org 5 March 2021 | Volume 12 | Article 641822
Cooney et al.                                                                                                       Engineered Sinks Can Increase Photosynthesis

                                                                                      compared to both NT2 and NT3 and for NT2 compared to
    A                                                                                 NT3 (p < 0.01).
                                                                                         Of the five DGAT + CO lines examined here, two
                                                                                      (DGAT + CO1 and DGAT + CO2) showed no significant
                                                                                      difference in gas exchange or biomass, compared to their
                                                                                      respective NT control (Figure 3; Table 2) In contrast,
                                                                                      DGAT + CO3-5 were between 59 and 82% larger than their
                                                                                      respective NT controls at the final harvest, displaying a significant
                                                                                      increase in shoot, root and total plant DW (Table 2). Differences
                                                                                      in establishment growth (i.e., growth in the 3 weeks following
                                                                                      propagation) explained some of the total growth difference
                                                                                      for these lines (Supplementary Table S1); however, the relative
                                                                                      growth rate (RGR) between the post-establishment harvest
                                                                                      (3 weeks after propagation) and final harvest (6 weeks after
                                                                                      propagation) was also significantly greater for DGAT + CO3-5,
                                                                                      compared to respective controls (Figure 3). SLA was significantly
                                                                                      greater for DGAT + CO5 compared to NT3, but not for
    B                                                                                 DGAT + CO1-4 (Table 2). Regardless, DGAT + CO3-5 all
                                                                                      displayed a significant increase in projected total leaf area (leaf
                                                                                      DW × SLA), compared to respective NT controls (Table 2).
                                                                                         DGAT + CO3-5 all displayed a significant increase in net
                                                                                      photosynthesis (Aarea; Figure 3), transpiration (E) and stomatal
                                                                                      conductance (gs; Table 2), compared to respective NT controls.
                                                                                      Similarly, DGAT + CO3-5 exhibited significantly greater leaf
                                                                                      Nmass than controls (Figure 4), whereas no difference in gas
    C                                                                                 exchange or Nmass was identified between DGAT + CO1-2 and
                                                                                      NT1 (Figure 4). When N was expressed on a leaf area basis
                                                                                      (Narea), there was no significant difference between DGAT + CO1-4
                                                                                      and respective controls, but there was a significant decrease in
                                                                                      Narea for DGAT + CO5 relative to NT3 (Figure 4). A significant
                                                                                      increase in PNUE (Aarea/Narea) was observed for DGAT + CO3-5
    D
                                                                                      (Figure 4), which was not observed for DGAT + CO1-2. Net
                                                                                      photosynthesis correlated negatively with foliar carbohydrates
                                                                                      for those plants derived from NT2 (NT2 and DGAT3-4; r2 = 0.3;
                                                                                      p < 0.001) and NT3 (NT3 and DGAT + CO5; r2 = 0.7; p < 0.001),
                                                                                      but not NT1 (NT1 and DGAT + CO1-2; p = 0.4; Figure 5).

                                                                                      Experiment 2: DGAT + CO5 A-N
                                                                                      Relationships Across NO3− Supply Range
                                                                                      DGAT + CO5 had a greater SLA than NT3 at all levels of
                                                                                      NO3− supply (Genotype effect, p < 0.001). Asat was comparable
                                                                                      between DGAT + CO5 and NT3 at 1-3 mM NO3− supply but
  FIGURE 1 | Percent difference (±SE) in leaf fatty acids compared to
                                                                                      significantly greater for DGAT + CO5 at 5–7.5 mM NO3−
  respective NT (A), recombinant protein contents for diacylglycerol                  supply (Genotype x concentration interaction, p < 0.01;
  acyl-transferase (DGAT; B) and cysteine-oleosin (C), and stain free gel             Figure 6B). Stomatal conductance (gs) was unaffected by NO3−
  showing equal protein loading for each cell (D), for five DGAT + CO lines and       supply and was consistently greater for DGAT + CO5 than
  three respective NT controls. Matching genetic backgrounds are grouped
                                                                                      for NT3 (Genotype effect, p < 0.001; Figure 6E). DGAT + CO5
  together. *p < 0.05.
                                                                                      had a greater leaf Nmass than NT3 and this difference
                                                                                      became progressively larger with increasing NO3− supply
   Leaf low molecular weight carbohydrates and HMW were                               (Genotype × concentration interaction, p < 0.001; Figure 6C).
significantly lower in DGAT + CO3-5, compared to respective                           However, Narea was greater for NT3 than for DGAT + CO5
NT controls (Figure 2), resulting in a reduction in total leaf                        from 1 to 5 mM NO3− supply and was similar for the two
WSC of 57–69% (Figure 2). In contrast, there were no statistical                      genotypes at the 7.5 mM NO3− supply (Genotype × concentration
differences in LMW, HMW, or total WSC between DGAT + CO1,                             interaction, p < 0.05; Figure 6D). DGAT + CO5 exhibited a
DGAT + CO2, and the NT1 control (Figure 2). Both LMW                                  greater PNUE than NT3 across the entire NO3− supply range
and HMW carbohydrates were significantly lower for NT1                                (Genotype effect, p < 0.001; Figure 6F).

Frontiers in Plant Science | www.frontiersin.org                                  6                                      March 2021 | Volume 12 | Article 641822
Cooney et al. Engineered Sinks Can Increase Photosynthesis
TABLE 1 | Fatty acid profile (% total FA) and total fatty acids (% Leaf DW) of five DGAT + CO lines and three non-transformed (NT) controls.
C16:0 C16:1 C18:0 C18:1 C18:2 C18:3 Total FA (%DW)
NT1 11.52 (± 0.1) 2.22 (± 0.04) 1.04 (± 0.01) 1.66 (± 0.04) 12.8 (± 0.1) 70.76 (± 0.2) 4.04 (± 0.1)
DGAT + CO1 10.41 (± 0.1)** 1.96 (± 0.08)** 1.05 (± 0.02) 5.8 (± 0.2)** 19.95 (± 0.2)** 60.83 (± 0.4)** 5.12 (± 0.1)**
DGAT + CO2 10.67 (± 0.02)** 1.99 (± 0.04)** 0.91 (± 0.02)** 5.29 (± 0.1)** 18.56 (± 0.1)** 62.58 (± 0.2)** 4.78 (± 0.03)**
NT2 11.38 (± 0.1) 2.7 (± 0.05) 0.99 (± 0.02) 1.44 (± 0.05) 13.96 (± 0.3) 69.52 (± 0.3) 3.64 (± 0.1)
DGAT + CO3 10.38 (± 0.1)** 2.47 (± 0.05)** 0.96 (± 0.03) 4.28 (± 0.05)** 18.7 (± 0.1)** 63.2 (± 0.1)** 5.25 (± 0.06)**
DGAT + CO4 8.95 (± 1)** 2.07 (± 0.2)** 0.88 (± 0.1) 6.36 (± 0.2)** 22.49 (± 0.1)** 57.97 (± 0.2)** 5.54 (± 0.08)**
NT3 13.03 (± 0.1) 2.2 (± 0.05) 0.93 (± 0.01) 1.05 (± 0.02) 14.62 (± 0.2) 68.17 (± 0.2) 2.92 (± 0.1)
DGAT + CO5 12.29 (± 0.1)** 2.01 (± 0.04)** 0.97 (± 0.02) 3.63 (± 0.1)** 22.47 (± 0.1)** 58.61 (± 0.2)** 5.11 (± 0.1)**
Means ± SE. ** indicates statistically significant difference from respective NT control (p < 0.01). n = 10. Lines with matching genetic backgrounds are grouped together.
FIGURE 2 | Stacked means (±SE) of high molecular weight carbohydrates (shaded grey, ) and low molecular weight carbohydrates (shaded white, ) in the
leaves of five DGAT + CO transformed L. perenne lines and respective non-transformed controls. Matching genetic backgrounds are grouped together.
n = 10. **Statistically differs from NT, p < 0.01.
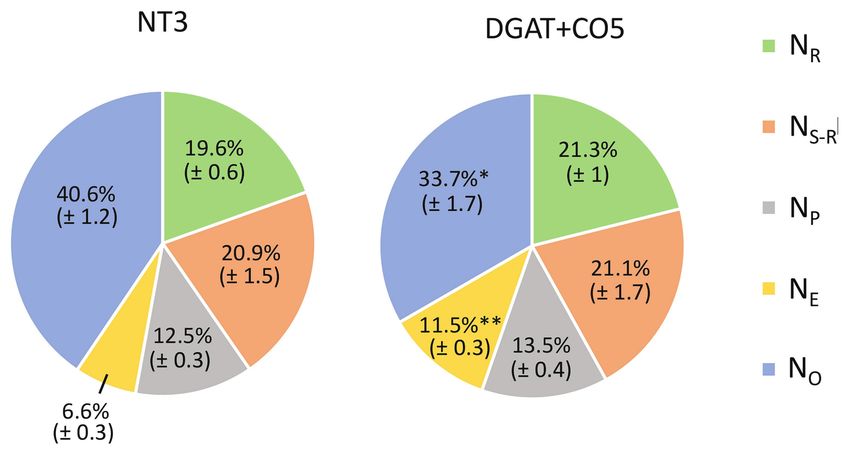
Photosynthesis and leaf N correlated positively for NT3 significantly differ for DGAT + CO5 and NT3 (Table 3).
and DGAT + CO5, regardless of whether measurements were DGAT + CO5 and NT3 invested similar proportions of leaf
expressed on a mass or area basis (Figure 7). The slope of N into rubisco (NR/N) and pigment-protein complexes (NP/N;
the relationship between Amass and leaf Nmass was, however, Figure 8), while DGAT + CO5 invested a significantly greater
steeper for DGAT + CO5 than for NT3 across much of the proportion of leaf N to bioenergetics (NE/N) than NT3 (Figure 8).
leaf Nmass range observed (Genotype × Nmass interaction, p < 0.05; Due primarily to this increase in NE/N, investment in
Figure 7). Amass exhibited a saturating response to high leaf “photosynthetic-N” × [(NR + NP + NE)/N] was significantly
Nmass for DGAT + CO5 (Quadratic Nmass effect, p < 0.01; greater for DGAT + CO5 than for NT3 (Figure 8). The
Figure 7). Aarea (per unit leaf area) exhibited an even stronger proportion of N invested in non-rubisco soluble protein (NS-
saturating response to Narea beyond approximately 1.25 gN.m−2 NR)/N did not differ for DGAT + CO5 and NT3 (Figure 8)
for both DGAT + CO 5 and NT3 (Quadratic Narea effect, while investment in all remaining pools (NO/N) was significantly
p < 0.001; Figure 7). lower for DGAT + CO5 than for NT3 (Figure 8).
There was no significant difference in intercellular CO2
Experiment 3: DGAT + CO5 Within-Leaf N concentrations (Ci) measured between DGAT + CO5 and
Allocation and Rates of CO2 Diffusion NT3. However, DGAT + CO5 exhibited a 39% increase in
DGAT + CO5 displayed a significant decrease in total soluble mesophyll conductance, compared to NT3 (Table 3). As such,
protein and chlorophyll per unit leaf area, compared to NT3 chloroplastic CO2 concentrations (Cc) were 5% greater, and
(Table 3). In contrast, rubisco per unit leaf area did not the CO2 drawdown from substomatal cavities to chloroplasts
Frontiers in Plant Science | www.frontiersin.org 7 March 2021 | Volume 12 | Article 641822Cooney et al. Engineered Sinks Can Increase Photosynthesis
A
B
FIGURE 3 | Net photosynthesis (A) and whole-plant relative growth rate (B) for five DGAT + CO lines and three NT lines. Means ± SE. *Statistically differs from NT,
p < 0.05; n = 10. Matching genetic backgrounds are shaded together.
TABLE 2 | Growth and gas exchange parameters for five DGAT + CO lines and three NT control lines 3 weeks after defoliation.
Leaf DW (g) Root DW (g) Shoot DW (g) Total DW (g) LA (cm2) SLA gS (mol m−2 s−1) E
(cm2 g−1) (mol m−2 s−1)
NT1 1.6 (± 0.1) 0.9 (± 0.06) 2.8 (± 0.1) 3.7 (± 0.1) 444 (± 19) 274 (± 8) 0.27 (± 0.01) 2.1 (± 0.1)
DGAT + CO1 1.6 (± 0.04) 0.7 (± 0.03) * 2.7 (± 0.1) 3.4 (± 0.1) 451 (± 15) 283 (± 9) 0.26 (± 0.02) 2 (± 0.2)
DGAT + CO2 1.6 (± 0.05) 0.9 (± 0.07) 2.7 (± 0.1) 3.6 (± 0.2) 454 (± 11) 284 (± 8) 0.28 (± 0.02) 2.1 (± 0.2)
NT2 0.8 (± 0.03) 0.4 (± 0.03) 1.4 (± 0.1) 1.9 (± 0.1) 206 (± 15) 260 (± 15) 0.15 (± 0.01) 1.2 (± 0.1)
DGAT + CO3 1.2 (± 0.03)** 0.9 (± 0.05)** 2.4 (± 0.1)** 3.3 (± 0.1)** 359 (± 9)** 290 (± 5) 0.34 (± 0.01)** 2.5 (± 0.1)**
DGAT + CO4 1.4 (± 0.1)** 0.9 (± 0.06)** 2.5 (± 0.1)** 3.4 (± 0.1)** 415 (± 19)** 287 (± 8) 0.3 (± 0.01)** 2.2 (± 0.1)**
NT3 0.9 (± 0.1) 0.5 (± 0.04) 2.1 (± 0.1) 2.5 (± 0.2) 197 (± 17) 213 (± 8) 0.0.18 (± 0.02) 1.5 (± 0.2)
DGAT + CO5 1.3 (± 0.1)* 0.8 (± 0.06)** 3.2 (± 0.2)** 4 (± 0.3)** 433 (± 31)** 343 (± 9)** 0.32 (± 0.03)** 2.6 (± 0.2)**
LA, leaf area; SLA, specific leaf area; gs, stomatal conductance; E, transpiration. Means ± SE. * or ** indicates statistically significant difference from respective non-transformed
control (p < 0.05 and 0.01 respectively). n = 10. Lines with matching genetic backgrounds are grouped together.
(Ci-Cc) was 24% lower for DGAT + CO5, compared to NT3 Jmax were all significantly greater for DGAT + CO5, whereas
(Table 3). The carboxylation efficiency (CE; initial slope of Ci*, Γ*, and Vcmax, did not significantly differ between
A-Ci response), the quantum efficiency of PSII (φPSII) and DGAT + CO5 and NT3 (Table 3).
Frontiers in Plant Science | www.frontiersin.org 8 March 2021 | Volume 12 | Article 641822Cooney et al. Engineered Sinks Can Increase Photosynthesis
A
B
C
FIGURE 4 | Leaf N concentration (Nmass; A), N per unit leaf area (Narea; B) and photosynthetic nitrogen use efficiency measured at 600 μmol photons m−2 s−1
(PNUEamb; C) for five independently transformed DGAT + CO L. perenne lines and respective NT controls. Means ± SE. *Statistically differs from NT, p < 0.05;
n = 10. Matching genetic backgrounds are shaded together.
DISCUSSION Across five independently transformed lines, the level of
DGAT accumulation positively correlated with the relative
In this study we described three experiments examining increase in FA, which ranged from 118 to 174% of respective
the relationships between photosynthesis, leaf N, and an controls (Figure 1). For those lines with the largest increases
engineered carbon sink in leaves of L. perenne. In experiment in FA, DGAT + CO3-5, this carbon sink occurred at the
1, we tested whether increasing sink capacity via DGAT + CO expense of leaf sugar (Figure 2), and coincided with leaf-
accumulation corresponded to increased photosynthesis. level changes that increased carbon assimilation, i.e., increased
Frontiers in Plant Science | www.frontiersin.org 9 March 2021 | Volume 12 | Article 641822Cooney et al. Engineered Sinks Can Increase Photosynthesis
FIGURE 5 | Photosynthesis vs. foliar carbohydrates for DGAT + CO and NT Lolium perenne. Lines from each genetic background are shaded together irrespective
of DGAT + CO or NT; NT1 and DGAT + CO1-2 ( ), NT2 and DGAT + CO3-4 ( ) and NT3 and DGAT + CO5 ( ). Trendline represents NT2 and NT3 derived
lines. Photosynthesis measured at 600 μmol photons m-2 s-1.
photosynthesis (DGAT + CO3-5) and SLA (DGAT + CO5). 2011; Ribeiro et al., 2017). Beechey-Gradwell et al. (2020)
In experiment 2, we examined DGAT + CO5 photosynthesis postulated that DGAT + CO lipid sinks may elevate the demand
under five levels of N availability. We found increased Aarea for carbon which could induce physiological and morphological
for DGAT + CO5 compared to NT3 only occurred when changes which promote carbon capture (i.e., increased
NO3− supply exceeded 3 mM (Figure 6) and that DGAT + CO photosynthesis and SLA). Consistent with this hypothesis,
expression made photosynthesis more responsive to variation we identified a significant negative correlation between WSC
in leaf N (Figure 7). For DGAT + CO3-5, Nmass was and photosynthesis in L. perenne leaves (Figure 5) and only
significantly higher compared to respective NT controls those three lines with the largest FA increases and a significant
(Figure 4); however N on a per leaf area basis (Narea) was reduction in leaf WSC (DGAT + CO3-5; Figure 2) displayed
either comparable to, or significantly lower than, respective an increase in net photosynthesis and PNUE (Figure 3). Below,
NT controls (DGAT + CO3,4 and DGAT + CO5 respectively; we discuss those leaf-level physiological changes which delivered
Figure 4). Consequently, PNUE was higher for increased photosynthesis and PNUE following DGAT + CO
DGAT + CO3-5 compared to controls (Figure 4). To identify lipid sink accumulation.
the physiological mechanism by which DGAT + CO delivers Aarea and PNUE are determined by a range of factors including
increased photosynthesis and PNUE, in experiment 3 the amount of light absorbed, the rate of CO2 transfer from
we examined rubisco contents, within-leaf N allocation and the atmosphere to carboxylation sites, the proportion of N
gm for DGAT + CO5 and NT3. We found no difference in invested in photosynthesis, the fraction of photosynthetic-N
rubisco, N allocated to rubisco or Vcmax between DGAT + CO5 devoted to the most rate-limiting photosynthetic processes, the
and NT3 (Figure 8; Table 3). In contrast, DGAT + CO5 specific activity and activation state of rubisco, and differences
displayed significantly greater Jmax, N allocated to in respiration in the light (Poorter and Evans, 1998).
photosynthetic pools, and both stomatal (gs) and mesophyll Photosynthetic rate under growth PAR and CO2 conditions
(gm) conductance. Collectively, our data showed the addition (600 μmol photons m-2 s−1 and 415 ppm CO2, respectively)
of a novel carbon sink in leaves of L. perenne, at the expense appeared at the intersection of “rubisco-limited” and “RuBP-
of leaf WSC, can induce leaf level changes (e.g., increased limited” in L. perenne (Supplementary Figure S1). Interestingly,
gm and N allocated to photosynthetic electron transport) neither rubisco content per unit leaf area nor NR/N significantly
which both increase Aarea and PNUE. Moreover, we believe differed between NT3 and DGAT + CO5 (Table 3) and given
that this study is the first to estimate changes in N allocation the identical genetic backgrounds of these lines, rubisco likely
resulting from manipulation of sink capacity. had identical kinetic properties. However, both stomatal (gs)
and mesophyll (gm) conductance were higher for DGAT + CO5
How Does DGAT + CO Expression compared to NT3 (Tables 2, 3), collectively delivering a 5%
Increase Aarea and PNUE? increase in Cc at ambient CO2 (Table 3). Moreover, when gm
Regulation of photosynthetic capacity is determined by, among values were fixed in an A-Ci model (Sharkey et al., 2007),
other things, the availability of carbon (source strength) relative NT3 and DGAT + CO5 exhibited no significant difference in
to the demand for carbon (sink strength; (Arp, 1991; Paul Vcmax (Table 3), suggesting enhanced gm could account for the
and Foyer, 2001; Ainsworth et al., 2004) and sugar plays a higher DGAT + CO5 carboxylation efficiency (CE; Table 3).
key role in signaling carbon availability (Paul and Driscoll, Changes in gm following sink capacity manipulation have
1997; Roitsch, 1999; Iglesias et al., 2002; Ainsworth and Bush, previously been reported for rice (Detmann et al., 2012) and
Frontiers in Plant Science | www.frontiersin.org 10 March 2021 | Volume 12 | Article 641822Cooney et al. Engineered Sinks Can Increase Photosynthesis
A B
C D
E F
FIGURE 6 | Specific leaf area (SLA; A), photosynthesis at 1500 μmol photons m-2 s-1 (Asat; B), leaf N concentration (Nmass; C), N per unit leaf area (Narea; D), stomatal
conductance (gs; E) and photosynthetic nitrogen use efficiency (PNUEsat; F) for L. perenne DGAT + CO5 (open circles ) and NT control (NT3; closed circles )
grown under 1-7 mM NO3- supply. Means ± SE; n = 3 for 1, 2, and 3 mM treated plants, n = 5 for 5 and 7.5 mM treated plants.
various legumes (Sugiura et al., 2018, 2020). Increased gm may complexes that perform photosynthetic electron transport. In this
explain the reduced rubisco oxygenation to carboxylation ratio study, thylakoid membrane-associated N was divided into two
(Vo/Vc) previously reported for DGAT + CO L. perenne (Beechey- components, light harvesting (NP) and electron transport plus
Gradwell et al., 2020) and contribute to the enhanced Aarea ATP synthesis (collectively “bioenergetics”; NE). We estimated cyt
and PNUE identified here. f and NE indirectly, assuming that NT3 and DGAT + CO5 shared
RuBP-regeneration limited photosynthetic rate is typically the same fixed relationship between Jmax, cyt f and NE (Evans
attributed to insufficient electron transport (J). This can be alleviated and Clarke, 2019). Under this assumption, DGAT + CO5 exhibited
by reducing photorespiration and its associated ATP costs, possibly 73% higher NE/N than did NT3 (Figure 8), which could account
achieved via increased gm. Alternatively, RuBP-regeneration limited for most (64%) of the difference in total photosynthetic N
photosynthesis could be enhanced with increases in the enzyme (NR + NP + NE) between the genotypes. However, available estimates
Frontiers in Plant Science | www.frontiersin.org 11 March 2021 | Volume 12 | Article 641822Cooney et al. Engineered Sinks Can Increase Photosynthesis
A
B
FIGURE 7 | Photosynthesis vs. leaf N, expressed on a mass (A) and area (B) basis for Lolium perenne DGAT + CO5 (open circles; ) and NT control NT3 (closed
circles; ) grown under 1–7.5 mM NO3− supply. Photosynthesis measurements were made at 1500 μmol photons m−2 s−1.
of the N cost of bioenergetics vary and are highly sensitive to reported here (Table 3). For this reason, estimated absorptance
the amount of ATP synthase assumed (Evans and Clarke, 2019). (α) was only 2% lower for DGAT + CO5 than NT3, while
For this reason, we additionally calculated the NE/N difference estimated absorptance per chlorophyll molecule (α/ChlA+B) was
for DGAT + CO5 and NT3 by substituting an older, more 14% higher. Assuming the same pigment-protein stoichiometry
conservative NE cost of 8.85 mol N mmol−1 cyt f (Evans and for NT3 and DGAT + CO5 leaves (37.3 mol N mol−1 ChlA+B,
Seemann, 1989) for DGAT + CO5 (c.f. 10.86 mol N mmol−1 cyt as in Evans and Clarke, 2019), spreading chlorophyll over a
f for NT3). This did not alter the conclusion that DGAT + CO5 greater leaf area would be expected to reduce the N cost of
had a higher NE/N than did NT3 (46%; p < 0.001). light harvesting and increase PNUE. However, pigment-protein
Changes in chlorophyll content also present an opportunity stoichiometry and, therefore, the N cost of light harvesting vary
to improve PNUE (Slattery et al., 2017). Crop plants “overinvest” naturally. For example, an increase in ChlA:B during acclimation
in NP under high light (Evans and Poorter, 2001), and one to high irradiance slightly increases the protein cost (and therefore
proposed strategy to engineer higher Aarea is to reduce chlorophyll N) of complexing pigments (Leong and Anderson, 1984; Evans
in order to “free up” N for more rate-limiting processes (Slattery and Seemann, 1989). DGAT + CO5 also exhibited a 10% higher
et al., 2017). In experiment 3, NP/N did not significantly differ ChlA:B than NT3 (Figures 5, 6), perhaps indicative of a higher
for DGAT + CO5 and NT3 (Figure 8); however, DGAT + CO5 N cost of light harvesting which could partially offset the positive
exhibited 15% lower ChlA+B per unit leaf area than did NT3 ΔPNUE due to higher α/ChlA+B.
(Table 3). Lower ChlA+B penalizes light absorption which can
reduce Aarea at low irradiance but has less effect near saturating Other Factors Which Influence the
irradiance. Additionally, increases in light absorption (α) per DGAT + CO Photosynthetic Response
unit of additional ChlA+B diminish as ChlA+B approaches In experiment 1, only the three lines transformed from
400 μmol m−2 (Evans and Poorter, 2001), values similar to that cultivar “Impact” (DGAT + CO3-5) displayed a reduction in
Frontiers in Plant Science | www.frontiersin.org 12 March 2021 | Volume 12 | Article 641822Cooney et al. Engineered Sinks Can Increase Photosynthesis
FIGURE 8 | Within-leaf N partitioning for L. perenne DGAT + CO5 and NT control NT3 grown under 5 mM NO3− supply. NR (N invested in rubisco), NS-R (N invested
in non-rubisco soluble protein), NP (N invested in pigment protein complexes), NE (N invested in “bioenergetics”) and NO (“other” N) as a proportion of total leaf N.
Means ± SE, *p < 0.05, **p < 0.01, n = 6–8.
TABLE 3 | Biochemical and gas exchange parameters for Lolium perenne DGAT + CO1-2, or the response to DGAT + CO differs
DGAT + CO5 and NT control 3 weeks after defoliation.
depending on the L. perenne cultivar used for transformation.
Parameter NT3 DGAT + CO5 It is worth noting that compared to either “Impact” control
line (NT2-3), the “Alto” conrol line (NT1) displayed a lower
Nmass %DW 3.2 (± 0.09) 4.1 (± 0.17)** leaf WSC content and a greater photosynthesis and growth
Narea gN m−2 1.9 (± 0.05) 1.5 (± 0.05)** rate. It may be that carbon utilization (e.g., translocation)
PNUEsat μmol CO2 gN s−1 8.6 (± 0.32) 15.7 (± 0.37)** was already high in the “Alto” background and there was
Soluble protein g m−2 4.8 (± 0.13) 3.96 (± 0.15)**
little remaining capacity to enhance photosynthesis or growth
Rubisco g m−2 2.3 (± 0.11) 2.02 (± 0.15)
ChlA+B μmol m−2 453 (± 13) 386 (± 9)** via a new sink. This highlights an important consideration
ChlA:B mol mol−1 3.4 (± 0.01) 3.8 (± 0.02)** regarding the utility of engineered carbon sinks to improve
Cytf μmol m−2 0.86 (± 0.06) 1.2 (± 0.02)** photosynthesis. Benefits are likely to depend upon factors
α mol mol−1 PAR 0.85 (± 0.001) 0.82 (± 0.001)** which influence the overall balance of activity between source
α/ChlA+B mol μmol−1 1.9 (± 0.01) 2.2 (± 0.04)**
leaves and various sinks throughout the plant, and thus may
CE Dimensionless 0.08 (± 0.005) 0.1 (± 0.005)**
Vcmax μmol m−2 s−1 54 (± 1.4) 57.5 (± 1.1) depend on environmental conditions, species, cultivar, or
Jmax μmol m−2 s−1 123.5 (± 9.6) 171.9 (± 2.9)** developmental stage. Crop species vary in both the capacity
Rd μmol m−2 s−1 0.71 (± 0.05) 0.81 (± 0.01) to accumulate carbohydrates in leaf cellular compartments
Ci* μmol mol−1 28.5 (± 1.3) 26.8 (± 1.4) (Chu et al., 2020) and in the sensitivity of photosynthesis
Γ* μmol mol−1 31.3 (± 1.5) 28.9 (± 1.5)
gm mol m−2 s−1 0.29 (± 0.04) 0.4 (± 0.02)*
to feedback regulation by carbohydrates (Sugiura et al., 2018).
CC μmol mol−1 226 (± 4) 237 (± 3)* Thus, assessment of DGAT + CO photosynthesis in a range
CI-CC μmol mol−1 59.9 (± 5.8) 45.3 (± 2.6)* of plant backgrounds is needed to understand the broader
applicability of our findings.
Nmass, leaf N concentration; Narea, N per unit leaf area; PNUEsat; photosynthetic
nitrogen use efficiency at 1500 μmol photons m-2 s-1; soluble protein; rubisco
It is well-established that major carbon sinks in the form of
concentration; ChlA+B, total chlorophylls; ChlA:B, the ratio of chlorophyll a to reproductive structures and storage organs can influence the
chlorophyll b; Cytf, cytochrome f contents; α, leaf absorptance; α/ChlA+B, leaf photosynthetic traits of source leaves (Ainsworth et al., 2004;
absorptance per unit chlorophyll; CE, carboxylation efficiency as determined by the
Sugiura et al., 2015), but mature leaves themselves consist of
initial slope of A-Ci regression; Vcmax, maximum rubisco carboxylation rate; Jmax,
maximum electron transport rate; Rd, day respiration, Ci*, intercellular CO2 various metabolic and structural sinks which compete for carbon
compensation point; Γ*, chloroplastic CO2 compensation point; gm, mesophyll (Vanhercke et al., 2019b). Manipulating leaf sink capacity though
conductance; CC, chloroplastic CO2 concentration; CI-CC, CO2 drawdown. metabolic engineering may enhance photosynthesis if carbon-
Means ± SE. n = 6–10.
*
p < 0.05; **p < 0.01.
rich compounds can accumulate without triggering evolved
carbon-sensing mechanisms (Paul and Eastmond, 2020).
leaf WSC content and an increase in photosynthesis and Encapsulated TAG appears to be capable of such an effect and,
growth, whereas the two “Alto” cultivar transformed lines providing this energy-dense sink does not create excessive
(DGAT + CO1-2) did not. The reason for this was competition for carbon (Mitchell et al., 2020), an increase in
unclear; either carbon allocation into lipids was too low in net assimilation can be achieved (Beechey-Gradwell et al., 2020).
Frontiers in Plant Science | www.frontiersin.org 13 March 2021 | Volume 12 | Article 641822Cooney et al. Engineered Sinks Can Increase Photosynthesis
Could other soluble and polymeric compounds (sugar AUTHOR CONTRIBUTIONS
derivatives, polysaccharides, proteins, or entirely novel
bio-products such as vitamins, drugs, or plastics) be LC, ZB-G, RS, GB, and NR designed the experiment. NR
engineered to circumvent feedback inhibition? Creating an designed the DGAT + CO construct. KR transformed the
efficient carbon sink in metabolically active leaves is complex material used in this study. LC and ZB-G conducted the three
(Sweetlove et al., 2017). Introduced pathways must experiments and photosynthetic gas exchange, and wrote the
interfere minimally with desirable endogenous processes, paper. ZB-G conducted the Rubisco quantification and leaf N
and end-products should be metabolically inert or allocation. SW conducted the SDS-page analysis. PA conducted
compartmentalized appropriately (Morandini, 2013). Futile sugar and chlorophyll quantification. TC conducted FAMEs
cycles of synthesis and hydrolysis should be avoided analysis. All authors contributed to the article and approved
(Winichayakul et al., 2013), and synthesis would ideally the submitted version.
be turned on late in development when adequate source
capacity has been established (Morandini, 2013). Despite
this complexity, a growing range of options exists for fine- FUNDING
tuning the spatial and temporal synthesis of novel molecules
in photosynthetic organisms (Sweetlove et al., 2017). A range This work was funded by Dairy NZ, PGG Wrightson Seeds,
of strategies by which leaf sink capacity might be enhanced Grasslanz Technology, The Ministry for Business, Innovation
remain to be explored, which could help to maintain photo- and Employment (contract C10X1603) and AgResearch Strategic
assimilate utilization and therefore maximize the Science Investment Fund.
photosynthetic potential of future crops.
SUPPLEMENTARY MATERIAL
DATA AVAILABILITY STATEMENT
The Supplementary Material for this article can be found online
The raw data supporting the conclusions of this article will at: https://www.frontiersin.org/articles/10.3389/fpls.2021.641822/
be made available by the authors, without undue reservation. full#supplementary-material
REFERENCES Bradford, M. M. (1976). A rapid and sensitive method for the quantitation of
microgram quantities of protein utilizing the principle of protein-dye binding.
Ainsworth, E. A., and Bush, D. R. (2011). Carbohydrate export from the leaf: Anal. Biochem. 72, 248–254. doi: 10.1016/0003-2697(76)90527-3
a highly regulated process and target to enhance photosynthesis and Brooks, A., and Farquhar, G. D. (1985). Effect of temperature on the CO2/
productivity. Plant Physiol. 155, 64–69. doi: 10.1104/pp.110.167684 O2 specificity of ribulose-1, 5-bisphosphate carboxylase/oxygenase and
Ainsworth, E. A., Rogers, A., Nelson, R., and Long, S. P. (2004). Testing the the rate of respiration in the light. Planta 165, 397–406. doi: 10.1007/
“source–sink” hypothesis of down-regulation of photosynthesis in elevated BF00392238
[CO2] in the field with single gene substitutions in Glycine max. Agric. Browse, J., Mccourt, P. J., and Somerville, C. R. (1986). Fatty acid composition
For. Meteorol. 122, 85–94. doi: 10.1016/j.agrformet.2003.09.002 of leaf lipids determined after combined digestion and fatty acid methyl
Altpeter, F., Xu, J., and Ahmed, S. (2000). Generation of large numbers of ester formation from fresh tissue. Anal. Biochem. 152, 141–145. doi:
independently transformed fertile perennial ryegrass (Lolium perenne L.) 10.1016/0003-2697(86)90132-6
plants of forage- and turf-type cultivars. Mol. Breed. 6, 519–528. doi: Carlsson, A. S., Yilmaz, J. L., Green, A. G., Stymne, S., and Hofvander, P.
10.1023/A:1026589804034 (2011). Replacing fossil oil with fresh oil – with what and for what? Eur.
Andrews, M., Love, B. G., and Sprent, J. J. (1989). The effects of different external J. Lipid Sci. Technol. 113, 812–831. doi: 10.1002/ejlt.201100032
nitrate concentrations on growth of Phaseolus vulgaris cv. Seafarer at chilling Chu, K. L., Jenkins, L. M., Bailey, S. R., Kambhampati, S., Koley, S., Foley, K.,
temperatures. Ann. Appl. Biol. 114, 195–204. doi: 10.1111/j.1744-7348.1989.tb06800.x et al. (2020). Shifting carbon flux from non-transient starch to lipid allows
Arp, W. J. (1991). Effects of source-sink relations on photosynthetic acclimation oil accumulation in transgenic tobacco leaves. bioRxiv [Preprint]. doi:
to elevated CO2. Plant Cell Environ. 14, 869–875. doi: 10.1111/j.1365-3040.1991. 10.1101/2020.05.15.098632.
tb01450.x Demmig-Adams, B., Stewart, J. J., and Adams, W. W. (2017). Environmental
Atkinson, N., Feike, D., Mackinder, L. C. M., Meyer, M. T., Griffiths, H., regulation of intrinsic photosynthetic capacity: an integrated view. Curr.
Jonikas, M. C., et al. (2016). Introducing an algal carbon-concentrating Opin. Plant Biol. 37, 34–41. doi: 10.1016/j.pbi.2017.03.008
mechanism into higher plants: location and incorporation of key components. Detmann, K. C., Araújo, W. L., Martins, S. C. V., Sanglard, L. M. V. P., Reis, J. V.,
Plant Biotechnol. J. 14, 1302–1315. doi: 10.1111/pbi.12497 Detmann, E., et al. (2012). Silicon nutrition increases grain yield, which,
Bajaj, S., Ran, Y., Phillips, J., Kularajathevan, G., Pal, S., Cohen, D., et al. in turn, exerts a feed-forward stimulation of photosynthetic rates via enhanced
(2006). A high throughput Agrobacterium tumefaciens-mediated transformation mesophyll conductance and alters primary metabolism in rice. New Phytol.
method for functional genomics of perennial ryegrass (Lolium perenne L.). 196, 752–762. doi: 10.1111/j.1469-8137.2012.04299.x
Plant Cell Rep. 25, 651–659. doi: 10.1007/s00299-005-0099-9 Dingkuhn, M., Luquet, D., Fabre, D., Muller, B., Yin, X., and Paul, M. J.
Beechey-Gradwell, Z., Cooney, L., Winichayakul, S., Andrews, M., Hea, S. Y., (2020). The case for improving crop carbon sink strength or plasticity for
Crowther, T., et al. (2020). Storing carbon in leaf lipid sinks enhances a CO2-rich future. Curr. Opin. Plant Biol. 56, 259–272. doi: 10.1016/j.
perennial ryegrass carbon capture especially under high N and elevated pbi.2020.05.012
CO2. J. Exp. Bot. 71, 2351–2361. doi: 10.1093/jxb/erz494 Dyer, W. J., Mullen, R., and Chapman, K. D. (2012). Oil in biomass: a step-
Bernacchi, C. J., Morgan, P. B., Ort, D. R., and Long, S. P. (2005). The growth change for bioenergy production? Inform 23, 193–272.
of soybean under free air [CO2] enrichment (FACE) stimulates photosynthesis Ermakova, M., Danila, F. R., Furbank, R. T., and Von Caemmerer, S. (2020).
while decreasing in vivo Rubisco capacity. Planta 220, 434–446. doi: 10.1007/ On the road to C4 rice: advances and perspectives. Plant J. 101, 940–950.
s00425-004-1320-8 doi: 10.1111/tpj.14562
Frontiers in Plant Science | www.frontiersin.org 14 March 2021 | Volume 12 | Article 641822You can also read