Partitioning of Environmental and Taxonomic Controls on Brazilian Foliar Content of Carbon and Nitrogen and Stable Isotopes
←
→
Page content transcription
If your browser does not render page correctly, please read the page content below
ORIGINAL RESEARCH
                                                                                                                                                published: 12 July 2021
                                                                                                                                        doi: 10.3389/ffgc.2021.662801

                                           Partitioning of Environmental and
                                           Taxonomic Controls on Brazilian
                                           Foliar Content of Carbon and
                                           Nitrogen and Stable Isotopes
                                           Luiz A. Martinelli 1* , Adibe L. Abdalla-Filho 1 , Taciana F. Gomes 1 , Silvia R. M. Lins 1 ,
                                           Eduardo Mariano 1 , Amin Soltangheisi 1 , Plinio B. de Camargo 1 , Simone A. Vieira 2 ,
                                           Niro Higuchi 3 and Gabriela B. Nardoto 4
                                           1
                                            Isotope Ecology Laboratory, Center for Nuclear Energy in Agriculture, University of São Paulo, Piracicaba, Brazil,
                                           2
                                            Environmental Study and Research Centre, State University of Campinas, Campinas, Brazil, 3 Forest Management
                                           Laboratory, National Institute of Amazonian Research, Manaus, Brazil, 4 Ecology Department, Institute of Biological Sciences,
                                           University of Brasília, Brasília, Brazil

                                           The Neotropics harbor some of the most diversified woody species in the world, and
                                           to understand the nutrient dynamics in these ecosystems, it is crucial to understand
                           Edited by:
                                           the role of plant taxonomy. In addition, biological nitrogen (N) fixation (BNF) in the
                     Michelle Y. Wong,     tropics is one of the key processes affecting the global N cycle. Our objective was
 Cary Institute of Ecosystem Studies,
                                           to (i) investigate the role of taxonomy and sampling site as predictors of foliar carbon (C)
                        United States
                                           and N concentration and its stable isotopes (i.e., δ13 C and δ15 N); (ii) assess differences
                        Reviewed by:
                     Zachary E. Kayler,    in foliar N, C:N ratio, and δ15 N among three functional groups: species of N2 -fixers and
    University of Idaho, United States     non-fixers of the Fabaceae family, as well as non-Fabaceae species; and (iii) examine
                        Erika J. Foster,
     Purdue University, United States
                                           the effect of wood density on tree foliar properties. We hypothesized that Fabaceae
                *Correspondence:
                                           specimens in symbiosis with N2 -fixers would possess a higher foliar N than non-fixing
                     Luiz A. Martinelli    plants, including those of the Fabaceae family, as well as high-density trees would have
               martinelli@cena.usp.br
                                           higher foliar C and C:N ratio relative to low-density trees, where the latter invest in
                   Specialty section:
                                           nutrients instead of structural C. We used a data set composed of 3,668 specimens
         This article was submitted to     sampled in three main biomes of Brazil: Amazon, Atlantic Forest, and Cerrado. The
                          Forest Soils,
                                           partitioning of variance had a higher influence of taxonomy on leaf C, N, and C:N
               a section of the journal
       Frontiers in Forests and Global     ratio. Conversely, foliar δ13 C and δ15 N were environmentally constrained. While family
                              Change       was the most important taxonomy level for C, N, and C:N ratio, species played a
        Received: 01 February 2021         major role for δ13 C and δ15 N. Foliar N followed the pattern fixers > non-fixers > non-
          Accepted: 08 June 2021
           Published: 12 July 2021
                                           Fabaceae, while C:N ratio had an opposite trend. In addition, foliar C was correlated with
                              Citation:
                                           wood density, where high-density > medium-density and low-density woods. The large
        Martinelli LA, Abdalla-Filho AL,   variability of δ15 N was observed among Fabaceae species, demonstrates the complexity
     Gomes TF, Lins SRM, Mariano E,
                                           of using δ15 N as an indicator of BNF. The higher foliar N of Fabaceae non-fixers than
      Soltangheisi A, de Camargo PB,
Vieira SA, Higuchi N and Nardoto GB        non-Fabaceae specimens support the hypothesis that an N-demanding lifestyle is an
  (2021) Partitioning of Environmental     inherent pattern in this family. Lastly, although observed in some studies, the prediction
 and Taxonomic Controls on Brazilian
              Foliar Content of Carbon
                                           of foliar properties using wood density is challenging, and future research on this topic
   and Nitrogen and Stable Isotopes.       is needed.
 Front. For. Glob. Change 4:662801.
       doi: 10.3389/ffgc.2021.662801       Keywords: Neotropics, variance, site, taxonomy, Fabaceae, wood density

Frontiers in Forests and Global Change | www.frontiersin.org                      1                                               July 2021 | Volume 4 | Article 662801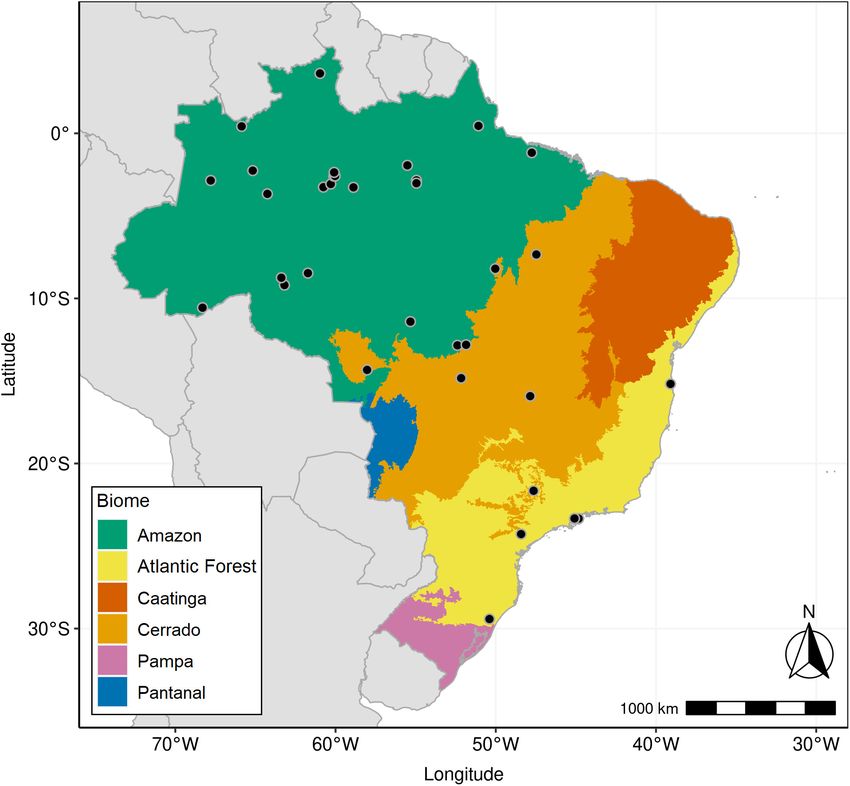
Martinelli et al.                                                                                                     Variance Partitioning of Leaf Traits

INTRODUCTION                                                                 community assembly process responding to biotic and abiotic
                                                                             constraints (Chapin et al., 1993; Vasseur et al., 2012; Oliveras
The Neotropics harbor one of the most diversified plant and                  et al., 2020).
animal species in the world (Hughes et al., 2013; Ulloa et al.,                  In tropical regions, investigation of foliar carbon (C) and
2017; Meseguer et al., 2020). Almost 40% of the global seed plant            N concentrations as well as isotopic ratios seems to be
populations, approximately 100,000 species, are found in this                appealing because there is limited evidence suggesting that N
region (Antonelli and Sanmartín, 2011). Although the reasons for             site availability is an important driver of foliar N isotopic ratio
such richness of life are still debatable, it seems that at regional         (Högberg, 1997; Martinelli et al., 1999; Schuur and Matson,
to continental level, past geological events affecting the elevation         2001; Craine et al., 2009). Current scientific understanding state
of the Earth surface (topography) and climate changes (or lack               that N-site availability controls foliar N isotope composition. In
of them), together with biotic processes, like phylogenetic niche            addition, there is an understanding that the canopy C isotope
conservatism, shape the distribution of species in the Neotropics            ratio (i.e., δ13 C) is mainly controlled by water availability, in
(Rull, 2011; Cheng et al., 2013; Hughes et al., 2013; Ledo and Colli,        which stomata tend to stay open longer in sites with higher
2017; Rangel et al., 2018).                                                  water abundance than in the arid ones (Diefendorf et al., 2010;
    Plant species diversity is also highly controlled by soil                Basu et al., 2019). Consequently, the internal stomatal CO2
nutrients, from the local to the regional level (Hulshof and                 concentration (pi) tends to equilibrate with the atmospheric CO2
Spasojevic, 2020). In recent years, it has been elucidated                   (pa), leading to more negative δ13 C values related to the plants
that biodiversity has a pivotal role in ecosystem functioning                in arid sites (Farquhar et al., 1989). Additionally, it is already
(Cardinale et al., 2012; Tilman et al., 2014), which is strongly             established that slow-growing trees are shade-tolerant species,
regulated by how plants process nutrients, mainly through                    where water is more available, but the light is more limiting,
biomass accumulation and litterfall (Vitousek and Sanford, 1986).            leading to leaves with more negative δ13 C than fast-growing and
Therefore, plant biodiversity can increase nutrient cycling and              light-demanding species (Farquhar and Sharkey, 1982).
its acquisition due to the complement effect among species with                  In order to understand the life history of trees and their
varied functional traits, where different spatial and temporal               mechanical and physiological strategies, wood density can be
niches are accessed, decreasing nutrient loss from the system                an important trait to be considered, since it relates to the
(Hooper et al., 2005; Oelmann et al., 2011). The rate at which               whole-plant performance (Westoby et al., 2002; Swenson and
nutrients will be available to plants also depends on how nitrogen           Enquist, 2007). Low-density species have higher N and lower
(N)-rich the vegetal detritus is, since the more N-rich it is, the           C concentrations in comparison with high-density species,
faster it decomposes, returning this limiting nutrient quicker               following the well-known “leaf economics spectrum” (LES),
to the soil for subsequent plant uptake (Melillo et al., 1982).              where low-density trees, being short-lived, invest more on
That is the case of Fabaceae family, which usually has higher                nutrients and less on structural C, while high-density trees, being
foliar N concentration than other families, being a particularly             long-lived, invest less on nutrients and more on structural C
important botanical family in forests of the tropics (Vitousek               (Wright et al., 2004). Therefore, wood density also appears to be a
et al., 2002). Some species of this family are also able to establish        relevant tree trait to unravel the ecosystem functioning, since this
symbiosis relations with the bacteria of the genus Rhizobium,                trait is key to determine forest biomass and C (Baker et al., 2004).
enabling atmospheric N2 fixation, known as biological N fixation                 As part of the Neotropics, Brazil is the country with the
(BNF), one of the key processes in the global N cycle and of high            largest number of vascular plant species (Ulloa et al., 2017),
importance in the tropics (Hedin et al., 2009; Barron et al., 2011;          comprising six major biomes that can be broadly divided into
Cleveland et al., 2011). There are many other plant families that            two major rainforests: Amazon and the Atlantic Forest. These two
support symbiotic N fixation. However, Fabaceae are considered               rainforests are separated along a northeast–southwest axis by the
the most important species regarding N acquisition due to their              Caatinga and Cerrado, representing two major dry areas (Rangel
symbiotic relationship with rhizobia (Valentine et al., 2018).               et al., 2018). Besides the above biomes, there is the Pantanal, one
Potentially, the foliar N isotope ratio (i.e., δ15 N) could be used to       of the main wetland areas of the Neotropics, and the Pampas, in
estimate BNF in plants, although there are several pitfalls in such          the south tip of Brazil, representing the only truly sub-temperate
use, especially in woody perennial plants (Boddey et al., 2000).             biome of the country. According to a recent cross-taxonomic
    The uniqueness of the Fabaceae family highlights the                     biogeographic analysis, Amazon stands out as the primary source
importance of understanding the taxonomy of plant species                    of diversity in the Neotropics (Antonelli et al., 2018). However, as
and their role on nutrient flow and ecosystem functioning.                   recognized by several authors, drier regions such as the Caatinga
Taxonomy-driven variances have been reported as a strong                     and Cerrado also play a vital role in the biodiversity of the country
source of the variation of photosynthetic and structural traits              (Pennington et al., 2009; Antonelli et al., 2018; Rangel et al., 2018).
(Oliveras et al., 2020). Additionally, taxonomy seems to be                      In a recent study of Martinelli et al. (2020), the foliar δ13 C
more limiting to leaf traits than the environment, showing                   and δ15 N were determined in ∼6,500 tree leaves sampled from
the dominance of taxonomic turnover over the environmental                   57 sites distributed across all major Brazilian biomes. This
variations (Fyllas et al., 2009; Anderegg et al., 2018; Oliveras             analysis showed that there is a large variation in foliar chemical
et al., 2020). Many plant traits and associations between traits             properties among vegetation types, demonstrating that parallel
have been hypothesized to be under the control of a common                   to life diversity, there is also a “biogeochemical diversity,” as
genetic mechanism, reflecting a combination of evolutionary and              postulated by Townsend et al. (2008). It was also speculated that

Frontiers in Forests and Global Change | www.frontiersin.org             2                                         July 2021 | Volume 4 | Article 662801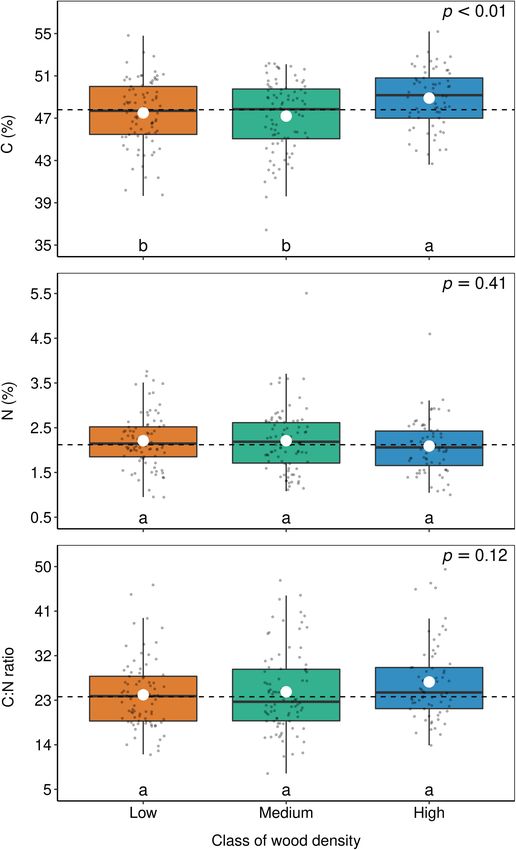
Martinelli et al.                                                                                                     Variance Partitioning of Leaf Traits

precipitation was the main environmental factor responsible for              where X is C or N; n is the mass number of the heavier isotope
such variability. However, the weight of taxonomy in these foliar            (13 C or 15 N); and Rsample and Rstandard are the isotopic ratio of the
properties was not determined and remains poorly understood.                 samples and the standard, respectively. The primary standards
Therefore, our main objective was to determine how much of                   were Pee Dee Belemnite for C and atmospheric air for N.
the variance in canopy foliar traits is explained by taxonomy                    Of a total of ∼6,500 foliar samples, 3,668 had botanical
and site characteristics, considering foliar N and C isotopic                identification. We used a similar procedure described by Chave
ratios, but also on foliar N and C concentrations in a subset                et al. (2006) and by Oliveira et al. (2019). We first compared
of the database provided by Martinelli et al. (2020), containing             species names with the currently accepted names using the R
3,668 foliar samples with complete taxonomy (family, genus,                  package “flora” (Carvalho, 2020), with the purpose of correcting
and species) from three major Brazilian biomes, i.e., Amazon,                spelling errors and checking species names that have changed.
Atlantic Forest, and Cerrado, including 741 species, distributed             We found a high number of spelling errors, which seems
in 298 genera and 81 botanical families. Our special interest in             to be a recurrent problem in large data sets (Chave et al.,
stable isotopes lies in the fact that there is limited information           2006), and a smaller number of invalid species names that
regarding taxonomic control on canopy δ13 C (Fyllas et al., 2009),           were discarded. This process resulted in a subset composed
and to the best of our knowledge, this aspect has not yet been               of tree foliar samples with accurate botanical classification at
evaluated for canopy δ15 N. If our study proves that taxonomy                the species level from three major Brazilian biomes (Figure 1
exerts a major role in determining foliar δ15 N, the importance of           and Supplementary Data Sheet 1). Vegetation types found
N-site availability as a key factor will be challenged. The second           in the data set were those previously described in Martinelli
objective of this study was to investigate foliar N concentration,           et al. (2020) for Amazon, Atlantic Forest, and Cerrado, namely,
C:N ratio, and δ15 N in specimens of the Fabaceae family and also            Dense Ombrophilous Forest (DOF), Open Ombrophilous Forest
compare these parameters among Fabaceae N-fixing, non-fixing,                (OOF), Mixed Ombrophilous Forest (MOF), Campinarana
and non-Fabaceae species of the Brazilian biomes mentioned                   Forest (CAM), Restinga Forest (MV), and Savanna (SAV).
above. Finally, we also assessed whether wood density correlates             DOF had sampling sites located in the Amazon as well as in
or not with foliar C and N concentration, as well as the C:N ratio.          the Atlantic biome.

                                                                             Variance Partitioning of Foliar Properties
MATERIALS AND METHODS                                                        Into Taxonomy and Site
                                                                             To partition the variance between taxonomy and site according
Data Acquisition and Processing                                              to each foliar property, we used a similar statistical procedure
We used a data set compiled by Martinelli et al. (2020) and                  employed by Fyllas et al. (2009) and Asner and Martin (2016),
available in a public repository at Mendeley1 , where C and N                among others. A multilevel generalized linear mixed model
concentration, C:N ratio, and isotopic ratios are available for              (GLMM) was used, and model parameters were estimated by
each species. Due to the large number of publications present in             a residual maximum likelihood method (REML). To perform
this data set (including original data provided by the authors),             this analysis, we first checked normality of residuals using the
the sampling procedure of leaves slightly differed among studies.            R package “fitdistrplus” (Delignette-Muller and Dutang, 2015).
First, while several studies used the abundance criteria, sampling           Only foliar N concentration was log-transformed to ensure
the most common species, others prioritized plant species based              normality. The “lmerTest” R package was used to run the GLMM
on logistic facilities (Martinelli et al., 2020). Second, most of the        (Kuznetsova et al., 2017). To estimate the pseudo-R2 for GLMM
studies followed the protocol of Cornelissen et al. (2003), where            (R2 GLMM ), the R package “MuMIn” was used (Bartón, 2020).
mature, fully expanded, and sunlit leaves found in the middle of             This package estimated the variance explained by the fixed effect
the canopy were sampled. However, in some studies, sampling of               (marginal R2 GLMM ), the variance explained by the whole model,
sunlit leaves was constrained by tree height in tropical forests. In         and the sum of fixed and random variables (conditional R2 GLMM ;
such cases, understory leaves were not included in our subset to             Nakagawa et al., 2017).
reduce bias regarding 13 C composition (Ometto et al., 2006).                   The response variables (foliar properties) were modeled
   Overall, sampled leaves were oven-dried at 60–65◦ C to a                  assuming the following random variables within the GLMM: (i)
constant weight and finely ground in a Wiley mill, and a                     species, nested within genus and family; and (ii) site, to account
subsample was transferred to a tin capsule. Samples were                     for environmental filters. Adopting the same nomenclature as
analyzed for total C and N concentration as well as their isotopic           that found in previous studies (Fyllas et al., 2009; Asner and
composition (13 C and 15 N) in an elemental analyzer interfaced to           Martin, 2016; Oliveras et al., 2020), the total variance of the model
an isotope ratio mass spectrometer. C and N concentrations are               for each response variable was then partitioned as follows:
expressed in percent, while the stable isotopic ratio in the classical
“δ” notation is expressed according to the following equation                                  T = µ + ss + f/g/s + ε(2)
(Craig, 1953):
                                                                             where µ is the overall mean value of each foliar trait (T),
      δn X = (Rsample /Rstandard – 1) × 1,000 (1)                            presenting C and N elemental concentration and stable isotopic
                                                                             ratios; ss is the name of each sampling site; f/g/s represents the
1
    https://doi.org/10.17632/38npddpnts.1                                    nested taxonomic structure of the data, species (s), nested in a

Frontiers in Forests and Global Change | www.frontiersin.org             3                                         July 2021 | Volume 4 | Article 662801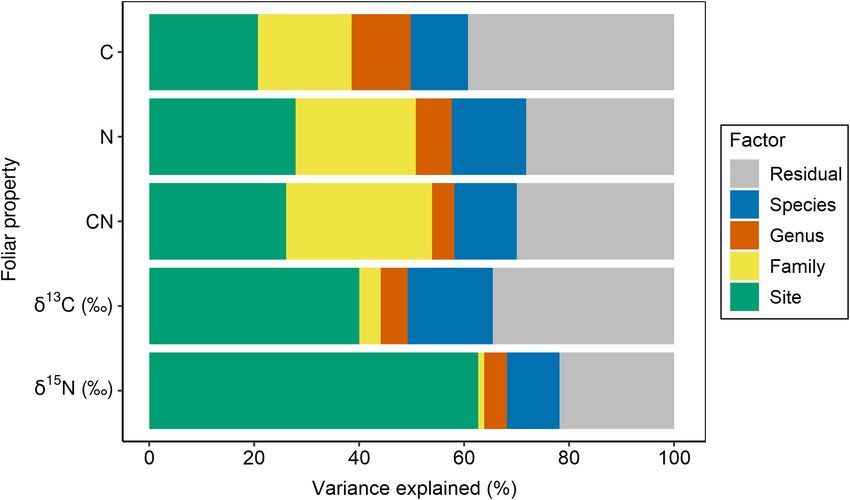
Martinelli et al.                                                                                                                    Variance Partitioning of Leaf Traits

  FIGURE 1 | Map of Brazil with borders of its six major continental biomes: Amazon, Atlantic Forest, Caatinga, Cerrado, Pampa, and Pantanal. Black circles indicate
  sampling plots included in this study.

genus (g) and nested in a family (f ); and ε is the residual term                     effect. In case of significance (p ≤ 0.05), means were separated
that includes any variability not captured by the model.                              by Sidak’s post hoc test through the “emmeans” R package (Lenth
                                                                                      et al., 2021). Given the often high foliar N concentration of
Influence of the Fabaceae Family on                                                   legumes, a GLMM was used to assess the variance partitioning
                                                                                      for foliar N of Fabaceae fixers and non-fixers into each sampling
Foliar Properties                                                                     site, taxonomy (species nested in a genus), and residual, based on
To test the differences in foliar properties of species of Fabaceae,                  the statistical procedure described above (Equation 2).
we first compared this family with each of the other families
through multiple box-plots without conducting any statistical test
since the main purpose here was to check, in descending order,                        Influence of Wood Density on Leaf Foliar
how these traits varied among families. Second, we grouped                            Properties
Fabaceae according to their capability or not of establishing                         Finally, we tested the effects of wood density on foliar properties
associations with N2 -fixing bacteria (“fixers” and “non-fixers,”                     by assigning a wood density (ρ) value to each species found in
respectively), following Tedersoo et al. (2018). We compared                          the data set published by Chave et al. (2006). Unfortunately,
these two groups with the third group consisting of species                           not all species included in our data set were found in the
belonging to other botanical families (“non-Fabaceae”) with                           database provided by Chave et al. (2006). Accordingly, we ended
regard to foliar N, C:N, and δ15 N. With the exception of foliar                      up with 262 species belonging to 235 genera with values of
N, which was log-transformed before analysis, all variables were                      ρ, with ∼35% of the total number of species included in our
normally distributed. Then, we developed a GLMM considering                           data set (Supplementary Data Sheet 2). As Chave et al. (2006)
these three groups as fixed effect and sampling site as a random                      pointed out, most of the variance of ρ was explained at the

Frontiers in Forests and Global Change | www.frontiersin.org                      4                                              July 2021 | Volume 4 | Article 662801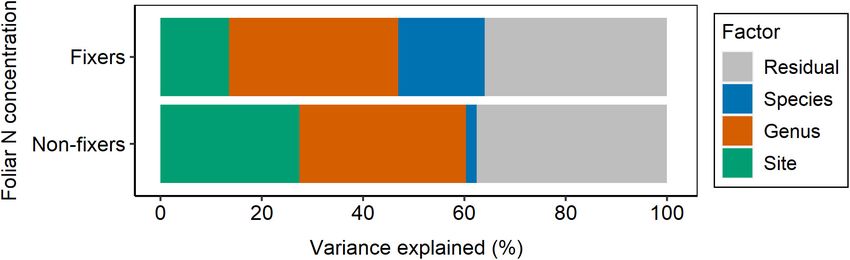
Martinelli et al.                                                                                                            Variance Partitioning of Leaf Traits

genus level; accordingly, we grouped plants by their respective          TABLE 1 | Variance partitioning according to taxonomy (nested design:
                                                                         family/genus/species), site, and residual for foliar C, N, C:N ratio, δ13 C, and δ 15 N.
genera. We also grouped ρ in three classes considering the 33rd
and 66th percentiles in the frequency distribution of ρ from             Factor                                          Variance                           SD
Chave’s data set, as follows: low density (ρ < 0.54 g cm−3 );
medium density (0.54 < ρ < 0.71 g cm−3 ), and high density               C
(ρ > 0.71 g cm−3 ). These values are similar to the ones                 Species:(genus:family)                             1.7                             1.3

used for classifying mechanical wood properties. However, we             Genus:Family                                       1.7                             1.3

acknowledge that these classes of wood density were solely based         Family                                             2.7                             1.7

on the frequency distribution of ρ found in Chave et al. (2006).         Site                                               3.2                             1.8

We tested the effects of ρ on foliar composition through a               Residual                                           6.0                             2.5

simple linear model using the normal distribution, since residuals       Total variance                                    15.4

were normally distributed for all variables (foliar C, N, and            R2 GLMM = 0.61

C:N ratio). A similar procedure used to assess the influence of          N

the Fabaceae family in foliar properties compared with other             Species:(genus:family)                            0.019                           0.137

botanical families was adopted here as related to significances          Genus:family                                      0.009                           0.095
                                                                         Family                                            0.031                           0.175
and post hoc tests. The R code used in this study can be found
                                                                         Site                                              0.037                           0.192
in Supplementary Data Sheet 3.
                                                                         Residual                                          0.038                           0.194
                                                                         Total variance                                    0.133
                                                                         R2 GLMM = 0.72
RESULTS                                                                  C:N ratio
                                                                         Species:(genus:family)                            12.9                             3.6
Site had the lowest effect (∼21%) on the variance partitioning
                                                                         Genus:family                                       4.6                             2.1
of foliar C, while ∼40% of the variance was explained by the
                                                                         Family                                            30.1                             5.5
sum of family, genus, and species, and ∼39% of the variance
                                                                         Site                                              28.3                             5.3
was attributed to the residual, not accounted by the above factors
                                                                         Residual                                          32.5                             5.7
(Figure 2 and Table 1). With regard to foliar N, taxonomy
                                                                         Total variance                                    108.4
explained ∼44% of the variance, while sampling site and residual
                                                                         R2 GLMM = 0.70
represented 28% each (Figure 2 and Table 1). Approximately
                                                                         δ 13 C
26% of the variance of foliar C:N ratio was explained by site,
                                                                         Species:(genus:family)                            0.71                            0.84
but taxonomy still represented ∼44% of the variance, while
                                                                         Genus:family                                      0.22                            0.47
the remaining percentage (∼30%) was not explained by the
                                                                         Family                                            0.18                            0.42
model (Figure 2 and Table 1). The effect of sampling site was
                                                                         Site                                              1.75                            1.32
the highest (∼40%) in explaining the variance of foliar δ13 C,
                                                                         Residual                                          1.51                            1.23
followed by residual (∼35%) and taxonomy (∼25%), with the
                                                                         Total variance                                    4.38
lowest importance (Figure 2 and Table 1). Similar to foliar δ13 C,
                                                                         R2 GLMM = 0.65
most of the variance of δ15 N was explained by site (∼63%),
                                                                         δ 15 N
while taxonomy and residual accounted for ∼16 and ∼22%,
                                                                         Species:(genus:family)                            0.88                            0.94
respectively (Figure 2 and Table 1). Overall, the partitioning
                                                                         Genus:family                                      0.38                            0.62
of leaf trait variance within the taxonomy levels indicated that
                                                                         Family                                            0.10                            0.32
botanical family explained mostly the total variance for C, N,
                                                                         Site                                              5.53                            2.35
and C:N ratio (∼23%, on average), while species was the most
                                                                         Residual                                          1.92                            1.39
important group for δ13 C and δ15 N (∼13%, on average; Figure 2
                                                                         Total variance                                    8.83
and Table 1). The pseudo-R2 for GLMM of foliar properties
                                                                         R2 GLMM = 0.78
ranged from 0.61 to 0.78 (Table 1).
    Although Fabaceae ranked among the N-rich families, it               SD, standard deviation of the variance; R2 GLMM , conditional coefficient of
                                                                         determination for the generalized linear mixed model according to Nakagawa et al.
was not the family with the highest foliar N concentration
                                                                         (2017).
or even the lowest C:N ratio (Figures 3, 4). However, the
family-median values for Fabaceae were higher and lower than
the overall median for foliar N and C:N ratio, respectively.             Supplementary Table 1). On the other hand, foliar δ15 N was
Finally, the family-median δ15 N of Fabaceae was essentially             higher for non-fixers compared with non-Fabaceae and fixers
similar to the overall median (Figure 5). By grouping Fabaceae           (Figure 6 and Supplementary Table 1). The variance partitioning
family according to their N-fixing capacity at genera level, a           across the two groups of Fabaceae indicated that ∼50, ∼14, and
clearer picture emerges. The foliar N concentration of fixers            ∼36% of the variance of foliar N was explained by taxonomy,
was significantly higher than the other two groups (Figure 6             site, and residual, respectively, for fixers, while for non-fixers,
and Supplementary Table 1). The foliar C:N ratio, as expected,           taxonomy and site represented ∼35 and ∼27% of the variance,
followed an inverse trend, with fixers showing the lowest median         respectively, with the remaining percentage (∼38%) attributed
values, followed by non-fixers and non-Fabaceae (Figure 6 and            to residual (Figure 7 and Supplementary Table 2). For both

Frontiers in Forests and Global Change | www.frontiersin.org         5                                                   July 2021 | Volume 4 | Article 662801
Martinelli et al. Variance Partitioning of Leaf Traits
FIGURE 2 | Partitioning of variance for foliar C and N concentration, C:N ratio, δ13 C, δ15 N into taxonomy (nested design: family/genus/species), site, and residual.
Foliar properties are sorted from the less to more site constrained.
groups, genus played a major role relative to species across the South America, suggesting a high variation of values across the
taxonomic levels. In addition, foliar composition varied among Brazilian territory (Sena-Souza et al., 2020), which also helps to
different classes of wood density (Figure 8 and Supplementary explain the dominance of the environmental filter on predicting
Table 3). However, differences were only significant for foliar foliar δ 15 N.
C concentration. Thus, C concentration was the highest in It is important to notice that still ∼16% of the variance of
the high-density class, exhibiting the following trend: high foliar δ15 N was explained by taxonomy (Figure 2). Plant species
density > medium density ≈ low density (Figure 8 and can be important in driving N isotopic ratios in several ways
Supplementary Table 3). (Högberg, 1997), such as “preferential” uptake of a particular
mineral; atmospheric or organic N form (Chalk and Smith, 2020);
and metabolic-induced changes of N isotopic ratios (Robinson,
DISCUSSION 2001; Yoneyama et al., 2001). For instance, Roupala montana
(Proteaceae), a common species found in the Cerrado, is more
Taxonomy and Site Affecting the Canopy effective in acquiring NH4 + related to NO3 − . This species tends
Chemistry to have higher foliar δ15 N than other species of the same biome
We observed that foliar δ15 N was strongly environmentally (Bustamante et al., 2004), as NH4 + tends to be more 15 N-
constrained, therefore presenting a high level of plasticity, with enriched than NO3 − (Högberg, 1997; Houlton et al., 2007).
taxonomy playing a minor role in the respective variation In our data set, there are 44 specimens of R. montana, most
(Figure 2). This finding indicates that local abiotic conditions, of them from savannas of Central Brazil, and a minor part
represented here by the site factor within the variance from savannas encroached on the Amazon region. The median
partitioning model, are tightly associated with δ15 N of leaf δ15 N of R. montana was 5.6h (25th percentile = 4.3h; 75th
trees in comparison with the genetic (i.e., taxonomic levels) percentile = 6.5h), while the overall foliar δ15 N median of plants
component. Despite being unable to identify the specific abiotic found in savannas was −0.6h (25th percentile = −1.6h; 75th
factors contributing to this strong relationship, soil N availability percentile = 0.6h; Supplementary Data Sheet 1).
at the local scale and precipitation at a larger scale have been Another example of taxonomy influencing foliar δ15 N is in
proven to be the key in controlling the δ15 N of plants (Craine the fixers grouping. Taxonomy determines which species of
et al., 2009, 2015). Many studies postulate that foliar δ15 N tends Fabaceae family can establish symbiotic relations with bacteria
to be higher in sites where the N availability (i.e., mineral N of the genus Rhizobium, which fix atmospheric N in exchange
forms) is also high (Högberg, 1997; Martinelli et al., 1999; Craine for carbohydrates (Sprent, 1995). As the atmospheric N has
et al., 2009), in addition to the lower soil available N in wet a δ15 N of 0h, and the fractionation between the Rhizobium
than dryer areas (Amundson et al., 2003; Pardo et al., 2006). and the plant is almost negligible (Högberg, 1997), species
Moreover, a recent study developed an isoscape of soil δ15 N for that rely mainly on BNF potentially have a lower δ15 N in
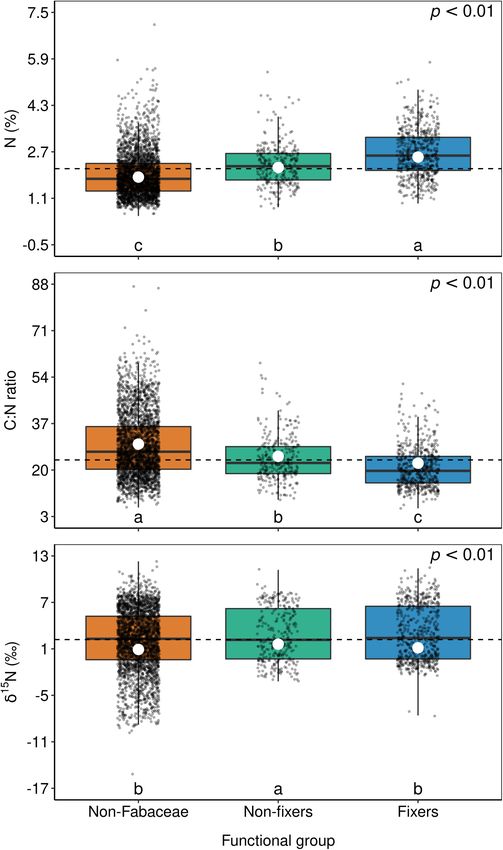
Frontiers in Forests and Global Change | www.frontiersin.org 6 July 2021 | Volume 4 | Article 662801Martinelli et al. Variance Partitioning of Leaf Traits FIGURE 3 | Box-plots of foliar N concentration of botanical families in decreasing order. The vertical lines inside each box represent the median; the box represents the first and third quartiles; and the bars represent the interquartile range. The vertical dashed line represents the mean of the entire population. The orange box is evidencing the Fabaceae family, where a notable part of the species is capable of fixing atmospheric N through symbiotic associations. comparison with plants relying on the soil as the unique N There was a large range of δ15 N values in our data set. source (Virginia and Delwiche, 1982). Although Fabaceae is an However, the median δ15 N in sampling sites with DOF (including important family in tropical biomes, often specimens do not rely forests of the Amazon and Atlantic Forest biome) was equal on BNF as a source of N (Vitousek et al., 2002). to 4.6h (25th percentile = 1.8h; 75th percentile = 7.1h; Frontiers in Forests and Global Change | www.frontiersin.org 7 July 2021 | Volume 4 | Article 662801
Martinelli et al.                                                                                                                         Variance Partitioning of Leaf Traits

  FIGURE 4 | Box-plots of foliar C:N ratio of botanical families in decreasing order. The vertical lines inside each box represent the median; the box represents the first
  and third quartiles; and the bars represent the interquartile range. The vertical dashed line represents the mean of the entire population. The orange box is evidencing
  the Fabaceae family, where a notable part of the species is capable of fixing atmospheric N through symbiotic associations.

Supplementary Data Sheet 1), which is well above the                                     the negative or near-zero δ15 N values were observed in the
overall median for foliar δ15 N, supporting the hypothesis of                            savanna’s sites, with a median equal to = −0.6h (25th
low and facultative BNF in tropical forests (Hedin et al.,                               percentile = −1.2h; 75th percentile = 0.1h; Supplementary
2009; Barron et al., 2011; Nardoto et al., 2014). Most of                                Data Sheet 1). Despite many specimens with negative foliar

Frontiers in Forests and Global Change | www.frontiersin.org                         8                                                July 2021 | Volume 4 | Article 662801
Martinelli et al.                                                                                                                         Variance Partitioning of Leaf Traits

  FIGURE 5 | Box-plots of foliar δ15 N of botanical families in decreasing order. The vertical lines inside each box represent the median; the box represents the first and
  third quartiles; and the bars represent the interquartile range. The vertical dashed line represents the mean of the entire population. The orange box is evidencing the
  Fabaceae family, where a notable part of the species is capable of fixing atmospheric N through symbiotic associations.

δ15 N in sites with savannas vegetation, it is not possible to                           where depleted δ15 N compounds are delivered to the plant
assess the role of BNF since near-zero δ15 N values in the                               (Bustamante et al., 2004).
savannas can be derived from BNF as well as the association                                  Due to the importance of water availability in driving foliar
of legumes with mycorrhizal fungi in N-limited systems,                                  δ13 C values by the photosynthetic discrimination against 13 CO2

Frontiers in Forests and Global Change | www.frontiersin.org                         9                                                July 2021 | Volume 4 | Article 662801
Martinelli et al.                                                                                                                       Variance Partitioning of Leaf Traits

  FIGURE 6 | Box-plots of foliar N (A), C:N ratio (B), and δ15 N (C) of non-Fabaceae species as well as non-fixer and N2 -fixer species of the Fabaceae family. The
  horizontal lines inside each box represent the median; the box represents the first and third quartiles; and the bars represent the interquartile range. The horizontal
  dashed line represents the mean of the entire population. White circles represent estimate means obtained from the generalized linear mixed model. The summary of
  the statistical model can be seen in Supplementary Table 1. Levels followed by a common letter are not different according to the Sidak-test at p ≤ 0.05.

(Lloyd and Farquhar, 1994; Diefendorf et al., 2010; Cornwell                             Cornwell et al., 2018). This hypothesis was confirmed since
et al., 2018), we hypothesized that climatic and soil conditions                         sampling site explained a major share of the variance, with
would be more important than taxonomy (Fyllas et al., 2009;                              taxonomy representing a lower but representative percentage

Frontiers in Forests and Global Change | www.frontiersin.org                        10                                               July 2021 | Volume 4 | Article 662801
Martinelli et al.                                                                                                                       Variance Partitioning of Leaf Traits

  FIGURE 7 | Partitioning of variance for foliar N concentration of N2 -fixing and non-fixing Fabaceae into taxonomy (nested design: genus/species), site, and residual.

(Figure 2). Taxonomy also exerts influence on foliar δ13 C                               (i.e., having an inherent pattern) for this N-rich lifestyle and
by modulating environmental seasonal changes, such as water                              found that in fact Fabaceae are not hardwired, but instead,
availability, mainly through leaf adjustments like stomatal                              this family appears to have a high N plasticity, responding
conductance and photosynthetic rates (Read and Farquhar, 1991;                           to site N availability and rhizobia colonization. Our results
Comstock and Ehleringer, 1992). As explained by Cernusak et al.                          indeed show a large variability in foliar N concentration of
(2013), water availability seems to be a key control of foliar                           Fabaceae specimens (Figure 3), suggesting high plasticity, as
δ13 C; however, the degree of response to this variable depends on                       proposed by Wolf et al. (2017). The ability of specimens in
how each species will counteract the environmental forcing with                          this botanical family in assimilating nitrate efficiently via the
leaf adjustments.                                                                        nitrate reductase enzyme was also postulated (Smirnoff and
    Strictly speaking about the taxonomic levels and their role                          Stewart, 1985). On the other hand, foliar N concentration of non-
on functional leaf traits, our study is in line with Fyllas et al.                       fixers was also higher than that of non-Fabaceae, favoring the
(2009); Asner and Martin (2016), and Oliveras et al. (2020), who                         hypothesis that the Fabaceae family is indeed hardwired to have
found a higher proportion of the C and N variance explained                              an N-demanding lifestyle.
by the botanical family compared with genus and species. For                                 If a higher N concentration is hardwired in Fabaceae, most
δ13 C, while we observed that species was the more constrained                           of the variance of foliar N in this family would be explained
factor, Fyllas et al. (2009) reported that genus was the dominant                        by taxonomy. Therefore, the variance partitioning for foliar
genetic level at a local scale for Amazonian sites. To the best of                       N had a comparable weight for taxonomy and site control,
our knowledge, this is the first study reporting the partitioning                        regardless of the Fabaceae group (fixers and non-fixers), with
of variance for foliar δ15 N, therefore restricting any comparison                       no dominant contribution from either of these factors on the
with previously published studies, especially those under similar                        variance (Figure 7 and Supplementary Table 2). However, it
geographic conditions to ours.                                                           seems that site characteristics are driving potential associations
                                                                                         with root symbionts, which likely increase even more the foliar
                                                                                         N contents of fixers in these species (Figure 6). Further research
The Role of Fabaceae in the Nitrogen                                                     on this topic is needed to mechanistically partition the effects
Cycle                                                                                    of root symbionts.
Taxonomy was the most important factor in explaining foliar                                  Another topic less discussed is the fact that the foliar C:N ratio
N variance (∼50%) for N2 -fixers, while the variance explained                           in fixers was also lower than in non-fixers, which in turn was
by taxonomy and residual was similar for Fabaceae non-                                   lower than in non-Fabaceae (Figure 6). This is an ecologically
fixers. This trend is in line with previous studies conducted in                         key functional trait of Fabaceae in their role to regulate C
tropical regions (Fyllas et al., 2009; Asner and Martin, 2016).                          accumulation mainly in tropical systems (Davidson et al., 2007;
An iconic example of such control is the higher foliar N                                 Siddique et al., 2008; Russell and Raich, 2012; Batterman et al.,
concentration found in the Fabaceae family, especially those able                        2013), besides the fact that the LES links N and C acquisition
to establish an association with N-fixing organisms (Figures 3, 6),                      by photosynthesis (Wright et al., 2004). Lower C:N ratios are
a trend already observed by many authors (McKey, 1994;                                   also important in accelerating litter decomposition, therefore
Vitousek et al., 2002; Townsend et al., 2007; Fyllas et al.,                             enhancing N cycling (Melillo et al., 1982). As expected, foliar
2009; Nasto et al., 2014; Adams et al., 2016; Taylor and                                 δ15 N in fixers was lower than in non-fixers (Figure 6), which
Ostrowsky, 2019). However, the interpretation of this result                             can be attributed to the relatively low isotopic fractionation
is still unknown.                                                                        of BNF (Högberg, 1997). In addition, a large number of
    McKey (1994) proposed that the high foliar N concentration                           non-Fabaceae families presented lower values of foliar δ15 N
in Fabaceae evolved before the association with N-fixing                                 relative to Fabaceae (overall median; Figure 5), which could
organisms, the so-called “N-demanding lifestyle” of Fabaceae.                            explain the similar results between non-Fabaceae and Fabaceae
In this sense, Wolf et al. (2017) defined the term “hardwired”                           fixers (Figure 6).

Frontiers in Forests and Global Change | www.frontiersin.org                        11                                               July 2021 | Volume 4 | Article 662801
Martinelli et al. Variance Partitioning of Leaf Traits FIGURE 8 | Box-plots of foliar C (A), N (B), and C:N ratio (C) according to wood density groups. Each dot represents the mean of a botanical genus. The horizontal lines inside each box represent the median; the box represents the first and third quartiles; and the bars represent the interquartile range. The horizontal dashed line represents the mean of the entire population. White circles represent estimate means obtained from the linear model. The summary of the statistical model can be seen in Supplementary Table 3. Levels followed by a common letter are not different according to the Sidak-test at p ≤ 0.05. Could Wood Density Predict Foliar continuum of tropical forests, fast-growing, low-density trees Properties? would invest more on nutrients and less on structural C, while Based on the LES, we expected that trees with low density would slow-growing, high-density trees would invest less on nutrients have a higher foliar N content than high-density trees (Wright and more on structural C (Poorter et al., 2004; Wright et al., et al., 2004; Chave et al., 2009). Therefore, in the successional 2007). However, only foliar C concentration fully followed the Frontiers in Forests and Global Change | www.frontiersin.org 12 July 2021 | Volume 4 | Article 662801
Martinelli et al.                                                                                                                           Variance Partitioning of Leaf Traits

expected trend, where higher C was found in high-density trees                               (Amazon and Atlantic) and the most iconic savanna of Brazil
(Figure 8). The fact that Wright et al. (2007) could not have found                          (Cerrado). Therefore, we extended variance partitioning of
a correlation between wood density and specific leaf area, one of                            canopy foliar traits beyond the wet vegetation types of the tropics
the pillars of the LES, and neither could we find a correlation                              included across our sampling sites. Overall, we found that the
between wood density and foliar N, reinforces the idea that a                                variance of δ13 C and δ15 N was explained by different proportions
convergence between leaf and wood traits, if it exists, is more                              of random variables rather than the elemental composition of C
complex than we initially thought.                                                           and N. The weight of sampling site in explaining the variance of
    On the other hand, the increase of foliar C with wood density                            C and N stable isotopes was more accentuated compared with
was expected since wood density is defined as the dry mass of                                the elemental composition. On the other hand, taxonomy seems
wood per volume of fresh wood. The wood C concentration in                                   to be more important for foliar C, N, and C:N ratio. This is
tropical forests is larger in relation to other elements, but it is                          especially true for the Fabaceae family, which independently of
not very variable. For example, Elias and Potvin (2003) found                                fixing N2 or not had higher N foliar concentration in comparison
a wood C variability of 45–50% among 32 species of tropical                                  with other families. Even among Fabaceae, those genera capable
trees in Panama. Vieira et al. (2011) found the same range of                                of establishing symbiotic associations with fixing bacteria had
variability in the coastal Atlantic Forest in southeast Brazil. As                           higher N foliar concentration than non-fixing genera. However,
the variability in wood density is much higher than the wood C                               there are still several open questions. For instance, there were a
content, high-density trees tend to have higher C concentration                              dozen families that had higher N foliar concentrations compared
than low-density trees simply because the latter has more mass                               with Fabaceae. Is there also a type of taxonomic control in
packed per unit of volume than the former. This connection                                   these families? The answer to this type of question would be
between wood C and density also explains why most of the                                     important to simulate how families with low trait plasticity
variance of foliar C is explained by taxonomy (Figure 2), since                              would respond to increases in temperature and changes in
most of the variance of wood density is highly connected with                                precipitation patterns in comparison with families with high
taxonomy (Chave et al., 2006, 2009).                                                         trait plasticity. These findings would contribute to model future
    Finally, we also expected that a correlation between wood                                tropical vegetation and its biodiversity under a scenario of global
density and foliar δ13 C would arise, first because foliar δ13 C                             changes, and the feedbacks of those changes on the climate and
is correlated with wood δ13 C (Lins et al., 2016), and second                                nutrient cycling.
because low-density, light-demanding trees have higher growth
rates compared with high-density trees, shade-tolerant trees
(Chave et al., 2009; Wright et al., 2010). Therefore, it is fair to                          DATA AVAILABILITY STATEMENT
suppose that shade-tolerant trees have lower water limitation
related to light-demanding trees, which tend to be taller and more                           The original contributions presented in the study are included
exposed to the sunlight (Bucci et al., 2004; Wright et al., 2010).                           in the article/Supplementary Material, further inquiries can be
Moreover, lower water limitation leads to more negative foliar                               directed to the corresponding author/s.
δ13 C values (Farquhar and Sharkey, 1982). Such light effect was
clearly shown in a subtropical forest of China (Ehleringer et al.,
1986) and forests along an Andes-to-Amazon elevation gradient
                                                                                             AUTHOR CONTRIBUTIONS
(Martin et al., 2020). Although differences were not statistically
significant, we observed an opposite trend, with foliar δ13 C values                         LAM, GBN, and PBC idealized the manuscript. SAV and NH
of high-density trees, on average, less negative than low-density                            worked on trees taxonomy. ALA-F, TFG, SRML, EM, and AS built
trees (data not shown). Therefore, our initial hypothesis was                                the dataset and worked on statistical tests. LAM did the primary
rejected. Perhaps because as concluded by Wright et al. (2003),                              writing with the contribution of all co-authors. All authors
there are few species at both ends of the light-demanding/shade-                             contributed to the article and approved the submitted version.
tolerant spectrum, but instead, most of the trees in a tropical
forest stand have intermediate light requirements.
                                                                                             SUPPLEMENTARY MATERIAL
CONCLUSION
                                                                                             The Supplementary Material for this article can be found
In this paper, we tested how taxonomy and local effects modulate                             online at: https://www.frontiersin.org/articles/10.3389/ffgc.2021.
the variance of canopy foliar traits, including the two rainforests                          662801/full#supplementary-material

REFERENCES                                                                                   Amundson, R., Austin, A. T., Schuur, E. A. G., Yoo, K., Matzek, V., Kendall, C.,
                                                                                               et al. (2003). Global patterns of the isotopic composition of soil and plant
Adams, M. A., Turnbull, T. L., Sprent, J. I., and Buchmann, N. (2016). Legumes                 nitrogen. Glob. Biogeochem. Cy. 17:1031. doi: 10.1029/2002GB001903
  are different: leaf nitrogen, photosynthesis, and water use efficiency. Proc. Natl.        Anderegg, L. D. L., Berner, L. T., Badgley, G., Sethi, M. L., Law, B. E.,
  Acad. Sci. U. S. A. 113, 4098–4103. doi: 10.1073/pnas.1523936113                             and HilleRisLambers, J. (2018). Within-species patterns challenge our

Frontiers in Forests and Global Change | www.frontiersin.org                            13                                              July 2021 | Volume 4 | Article 662801
Martinelli et al. Variance Partitioning of Leaf Traits understanding of the leaf economics spectrum. Ecol. Lett. 21, 734–744. doi: pan-tropical analysis. Ecol. Lett. 14, 939–947. doi: 10.1111/j.1461-0248.2011. 10.1111/ele.12945 01658.x Antonelli, A., and Sanmartín, I. (2011). Why are there so many plant species in the Comstock, J. P., and Ehleringer, J. R. (1992). Correlating genetic variation in carbon Neotropics? Taxon 60, 403–414. doi: 10.1002/tax.602010 isotopic composition with complex climatic gradients. Proc. Natl. Acad. Sci. Antonelli, A., Zizka, A., Carvalho, F. A., Scharn, R., Bacon, C. D., Silvestro, D., et al. U. S. A. 89, 7747–7751. doi: 10.1073/pnas.89.16.7747 (2018). Amazonia is the primary source of neotropical biodiversity. Proc. Natl. Cornelissen, J. H. C., Lavorel, S., Garnier, E., Díaz, S., Buchmann, N., Gurvich, Acad. Sci. U. S. A. 115, 6034–6039. doi: 10.1073/pnas.1713819115 D. E., et al. (2003). A handbook of protocols for standardised and easy Asner, G. P., and Martin, R. E. (2016). Convergent elevation trends in canopy measurement of plant functional traits worldwide. Aust. J. Bot. 51, 335–380. chemical traits of tropical forests. Glob. Change Biol. 22, 2216–2227. doi: 10. doi: 10.1071/BT02124 1111/gcb.13164 Cornwell, W. K., Wright, I. J., Turner, J., Maire, V., Barbour, M. M., Cernusak, L. A., Baker, T. R., Phillips, O. L., Malhi, Y., Almeida, S., Arroyo, L., Di Fiore, A., et al. et al. (2018). Climate and soils together regulate photosynthetic carbon isotope (2004). Variation in wood density determines spatial patterns in Amazonian discrimination within C3 plants worldwide. Glob. Ecol. Biogeogr. 27, 1056–1067. forest biomass. Glob. Change Biol. 10, 545–562. doi: 10.1111/j.1529-8817.2003. doi: 10.1111/geb.12764 00751.x Craig, H. (1953). The geochemistry of the stable carbon isotopes. Geochim. Barron, A. R., Purves, D. W., and Hedin, L. O. (2011). Facultative nitrogen fixation Cosmochim. Acta 3, 53–92. doi: 10.1016/0016-7037(53)90001-5 by canopy legumes in a lowland tropical forest. Oecologia 165, 511–520. doi: Craine, J. M., Brookshire, E. N. J., Cramer, M. D., Hasselquist, N. J., Koba, K., 10.1007/s00442-010-1838-3 Marin-Spiotta, E., et al. (2015). Ecological interpretations of nitrogen isotope Bartón, K. (2020). MuMIn: Multi-Model Inference. R Package Version 1.43.17. ratios of terrestrial plants and soils. Plant Soil 396, 1–26. doi: 10.1007/s11104- Available online at: https://cran.r-project.org/web/packages/MuMIn/index. 015-2542-1 html (accessed May 14, 2021). Craine, J. M., Elmore, A. J., Aidar, M. P. M., Bustamante, M., Dawson, T. E., Basu, S., Ghosh, S., and Sanyal, P. (2019). Spatial heterogeneity in the relationship Hobbie, E. A., et al. (2009). Global patterns of foliar nitrogen isotopes and their between precipitation and carbon isotopic discrimination in C3 plants: relationships with climate, mycorrhizal fungi, foliar nutrient concentrations, inferences from a global compilation. Glob. Planet. Change 176, 121–131. doi: and nitrogen availability. New Phytol. 183, 980–992. doi: 10.1111/j.1469-8137. 10.1016/j.gloplacha.2019.02.002 2009.02917.x Batterman, S. A., Hedin, L. O., van Breugel, M., Ransijn, J., Craven, D. J., and Hall, Davidson, E. A., de Carvalho, C. J. R., Figueira, A. M., Ishida, F. Y., Ometto, J. S. (2013). Key role of symbiotic dinitrogen fixation in tropical forest secondary J. P. H. B., Nardoto, G. B., et al. (2007). Recuperation of nitrogen cycling in succession. Nature 502, 224–227. doi: 10.1038/nature12525 Amazonian forests following agricultural abandonment. Nature 447, 995–998. Boddey, R. M., Peoples, M. B., Palmer, B., and Dart, P. J. (2000). Use of the 15N doi: 10.1038/nature05900 natural abundance technique to quantify biological nitrogen fixation by woody Delignette-Muller, M., and Dutang, C. (2015). fitdistrplus: an R package for fitting perennials. Nutr. Cycl. Agroecosys. 57, 235–270. doi: 10.1023/A:1009890514844 distributions. J. Stat. Softw. 64, 1–34. doi: 10.18637/jss.v064.i04 Bucci, S. J., Goldstein, G., Meinzer, F. C., Scholz, F. G., Franco, A. C., and Diefendorf, A. F., Mueller, K. E., Wing, S. L., Koch, P. L., and Freeman, K. H. Bustamante, M. (2004). Functional convergence in hydraulic architecture and (2010). Global patterns in leaf 13C discrimination and implications for studies water relations of tropical savanna trees: from leaf to whole plant. Tree Physiol. of past and future climate. Proc. Natl. Acad. Sci. U. S. A. 107, 5738–5743. 24, 891–899. doi: 10.1093/treephys/24.8.891 doi: 10.1073/pnas.0910513107 Bustamante, M. M. C., Martinelli, L. A., Silva, D. A., Camargo, P. B., Klink, C. A., Ehleringer, J. R., Field, C. B., Lin, Z., and Kuo, C. (1986). Leaf carbon isotope and Domingues, T. F., et al. (2004). 15N natural abundance in woody plants and mineral composition in subtropical plants along an irradiance cline. Oecologia soils of central Brazilian savannas (Cerrado). Ecol. Appl. 14, 200–213. doi: 70, 520–526. doi: 10.1007/BF00379898 10.1890/01-6013 Elias, M., and Potvin, C. (2003). Assessing inter- and intra-specific variation in Cardinale, B. J., Duffy, J. E., Gonzalez, A., Hooper, D. U., Perrings, C., Venail, P., trunk carbon concentration for 32 neotropical tree species. Can. J. For. Res. 33, et al. (2012). Biodiversity loss and it impact on humanity. Nature 486, 59–67. 1039–1045. doi: 10.1139/X03-018 doi: 10.1038/nature11148 Farquhar, G. D., Ehleringer, J. R., and Hubick, K. T. (1989). Carbon isotope Carvalho, G. (2020). Flora: Tools for Interacting with the Brazilian Flora 2020. discrimination and photosynthesis. Annu. Rev. Plant Physiol. Plant Mol. Biol. R Package Version 0.3.4. Available online at: https://cran.r-project.org/web/ 40, 503–537. doi: 10.1146/annurev.pp.40.060189.002443 packages/flora/index.html (accessed May 7, 2021). Farquhar, G. D., and Sharkey, T. D. (1982). Stomatal conductance and Cernusak, L. A., Ubierna, N., Winter, K., Holtum, J. A. M., Marshall, J. D., photosynthesis. Ann. Rev. Plant. Physiol. 33, 317–345. doi: 10.1146/annurev.pp. and Farquhar, G. D. (2013). Environmental and physiological determinants of 33.060182.001533 carbon isotope discrimination in terrestrial plants. New Phytol. 200, 950–965. Fyllas, N. M., Patiño, S., Baker, T. R., Nardoto, G. B., Martinelli, L. A., Quesada, doi: 10.1111/nph.12423 C. A., et al. (2009). Basin-wide variations in foliar properties of Amazonian Chalk, P., and Smith, C. (2020). On inorganic N uptake by vascular plants: can 15N forest: phylogeny, soils and climate. Biogeosciences 6, 2677–2708. doi: 10.1023/ tracer techniques resolve the NH4+ versus NO3- “preference” conundrum? Eur. A:1015798428743 J. Soil Sci. doi: 10.1111/ejss.13069 Hedin, L. O., Brookshire, E. N. J., Menge, D. N. L., and Barron, A. R. (2009). Chapin, F. S. I. I. I., Autumn, K., and Pugnaire, F. (1993). Evolution of suits of The nitrogen paradox in tropical forest ecosystems. Annu. Rev. Ecol. Syst. 40, traits in response to environmental stress. Am. Nat. 142, S78–S92. doi: 10.1086/ 613–635. doi: 10.1146/annurev.ecolsys.37.091305.110246 285524 Högberg, P. (1997). 15N natural abundance in soil-plant systems. New Phytol. 137, Chave, J., Coomes, D., Jansen, S., Lewis, S. L., Swenson, N. G., and Zanne, 179–203. doi: 10.1046/j.1469-8137.1997.00808.x A. E. (2009). Towards a worldwide wood economics spectrum. Ecol. Lett. 12, Hooper, D. U., Chapin, F. S. I. I. I., Ewel, J. J., Hector, A., Inchaust, P., Lavorel, S., 351–366. doi: 10.1111/j.1461-0248.2009.01285.x et al. (2005). Effects of biodiversity on ecosystem functioning: a consensus of Chave, J., Muller-Landau, H. C., Baker, T. R., Easdale, T. A., Steege, H. T., and current knowledge. Ecol. Monogr. 75, 3–35. doi: 10.1890/04-0922 Webb, C. O. (2006). Regional and phylogenetic variations of wood density Houlton, B. Z., Sigman, D. M., Schuur, E. A. G., and Hedin, L. O. (2007). A climate- across 2456 neotropical tree species. Ecol. Appl. 16, 2356–2367. doi: 10.1890/ driven switch in plant nitrogen acquisition within tropical forest communities. 1051-0761(2006)016[2356:rapvow]2.0.co;2 Proc. Natl. Acad. Sci. U. S. A. 104, 8902–8906. doi: 10.1073/pnas.060 Cheng, H., Sinha, A., Cruz, F. W., Wang, X., Edwards, R. L., d’Horta, F. M., et al. 9935104 (2013). Climate change patterns in Amazonia and biodiversity. Nat. Commun. Hughes, C. E., Pennington, R. T., and Antonelli, A. (2013). Neotropical plant 4:1411. doi: 10.1038/ncomms2415 evolution: assembling the big picture. Bot. J. Linn. Soc. 171, 1–18. doi: 10.1111/ Cleveland, C. C., Townsend, A. R., Taylor, P., Alvarez-Clare, S., Bustamante, boj.12006 M. M. C., Chuyong, G., et al. (2011). Relationships among net Hulshof, C. M., and Spasojevic, M. J. (2020). The edaphic control of plant diversity. primary productivity, nutrients and climate in tropical rain forest: a Global Ecol. Biogeogr. 29, 1634–1650. doi: 10.1111/geb.13151 Frontiers in Forests and Global Change | www.frontiersin.org 14 July 2021 | Volume 4 | Article 662801
Martinelli et al.                                                                                                                                     Variance Partitioning of Leaf Traits

Kuznetsova, A., Brockhoff, P. B., and Christensen, R. H. B. (2017). lmerTest                       Pennington, R. T., Lavin, M., and Oliveira-Filho, A. (2009). Woody plant diversity,
   package: tests in linear mixed effects models. J. Stat. Softw. 82, 1–26. doi: 10.                  Evolution, and ecology in the tropics: perspectives from seasonally dry tropical
   18637/jss.v082.i13                                                                                 forests. Annu. Rev. Ecol. Evol. Syst. 40, 437–457. doi: 10.1146/annurev.ecolsys.
Ledo, R. M. D., and Colli, G. R. (2017). The historical connections between the                       110308.120327
   Amazon and the Atlantic Forest revisited. J. Biogeogr. 44, 2551–2563. doi:                      Poorter, L., van de Plassche, M., Willems, S., and Boot, R. G. A. (2004). Leaf traits
   10.1111/jbi.13049                                                                                  and herbivory rates of tropical tree species differing in successional status. Plant
Lenth, R. V., Buerkner, P., Herve, M., Love, J., Riebl, H., and Singmann,                             Biol. 6, 746–754. doi: 10.1055/s-2004-821269
   H. (2021). Emmeans: Estimated Marginal Means, Aka Least-Squares Means.                          Rangel, T. F., Edwards, N. R., Holden, P. B., Diniz-Filho, J. A., Gosling,
   R Package Version 1.6.0. Available online at: https://cran.r-project.org/web/                      W. D., Coelho, M. T. P., et al. (2018). Modeling the ecology and
   packages/emmeans/index.html (accessed May 17, 2021).                                               evolution of biodiversity: biogeographical cradles, museums, and graves. Science
Lins, S. R. M., Coletta, L. D., Ravagnani, E. C., Gragnani, J. G., Mazzi, E. A.,                      361:eaar5452. doi: 10.1126/science.aar5452
   and Martinelli, L. A. (2016). Stable carbon composition of vegetation and soils                 Read, J., and Farquhar, G. (1991). Comparative studies in Nothofagus (Fagaceae).
   across an altitudinal range in the coastal Atlantic forest of Brazil. Trees 30,                    I. Leaf carbon isotope discrimination. Funct. Ecol. 5, 684–695. doi: 10.2307/
   1315–1329. doi: 10.1007/s00468-016-1368-7                                                          2389489
Lloyd, J., and Farquhar, G. D. (1994). 13C discrimination during CO2 assimilation                  Robinson, D. (2001). δ15N as an integrator of the nitrogen cycle. Trends Ecol. Evol.
   by the terrestrial biosphere. Oecologia 99, 201–215. doi: 10.1007/BF00627732                       16, 153–162. doi: 10.1016/S0169-5347(00)02098-X
Martin, E. R., Asner, G. P., Bentley, L. P., Shenkin, A., Salinas, N., Huaypar, K. Q.,             Rull, V. (2011). Neotropical biodiversity: timing and potential drivers. Trends Ecol.
   et al. (2020). Covariance of sun and shade leaf traits along a tropical forest                     Evol. 26, 508–513. doi: 10.1016/j.tree.2011.05.011
   elevation gradient. Front. Plant Sci. 10:1810. doi: 10.3389/fpls.2019.01810                     Russell, A. E., and Raich, J. W. (2012). Rapidly growing tropical trees mobilize
Martinelli, L. A., Nardoto, G. B., Soltangheisi, A., Reis, C. R. G., Abdalla-Filho,                   remarkable amounts of nitrogen, in ways that differ surprisingly among species.
   A. L., Camargo, P. B., et al. (2020). Determining ecosystem functioning                            Proc. Natl. Acad. Sci. U. S. A. 109, 10398–10402. doi: 10.1073/pnas.1204
   in Brazilian biomes through foliar carbon and nitrogen concentrations and                          157109
   stable isotope ratios. Biogeochemistry 154, 405–423. doi: 10.1007/s10533-020-0                  Schuur, E. A. G., and Matson, P. A. (2001). Net primary productivity and nutrient
   0714-2                                                                                             cycling across a mesic to wet precipitation gradient in Hawaiian montane forest.
Martinelli, L. A., Piccolo, M. C., Townsend, A. R., Vitousek, P. M., Cuevas, E.,                      Oecologia 128, 431–442. doi: 10.1007/s004420100671
   McDowell, W., et al. (1999). Nitrogen stable isotopic composition of leaves and                 Sena-Souza, J. P., Houlton, B. Z., Martinelli, L. A., and Nardoto, G. B. (2020).
   soil: tropical versus temperate forests. Biogeochemistry 46, 45–65. doi: 10.1023/                  Reconstructing continental-scale variation in soil δ15N: a machine learning
   A:1006100128782                                                                                    approach in South America. Ecosphere 11:e03223. doi: 10.1002/ecs2.3223
McKey, D. (1994). “Legumes and nitrogen: the evolutionary ecology of a nitrogen-                   Siddique, I., Engel, V. L., Parrotta, J. A., Lamb, D., Nardoto, G. B., Ometto,
   demanding lifestyle,” in Advances in Legume Systematics – Part 5: The Nitrogen                     J. P. H. B., et al. (2008). Dominance of legume trees alters nutrient relations in
   Factor, eds J. I. Sprent and D. McKey (Kew: Royal Botanic Gardens), 211–228.                       mixed species forest restoration plantings within seven years. Biogeochemistry
Melillo, J. M., Aber, J. D., and Muratore, J. F. (1982). Nitrogen and lignin control                  88, 89–101. doi: 10.1007/s10533-008-9196-5
   of hardwood leaf litter decomposition dynamics. Ecology 63, 621–626. doi:                       Smirnoff, N., and Stewart, G. R. (1985). Nitrate assimilation and translocation by
   10.2307/1936780                                                                                    higher plants: comparative physiology and ecological consequences. Physiol.
Meseguer, A. S., Antoine, P. O., Fouquet, A., Delsuc, F., and Condamine, F. L.                        Plant 64, 133–140. doi: 10.1111/j.1399-3054.1985.tb02326.x
   (2020). The role of the Neotropics as a source of world tetrapod biodiversity.                  Sprent, J. I. (1995). Legume trees and shrubs in the tropics: N2 fixation
   Glob. Ecol. Biogeogr. 29, 1565–1578. doi: 10.1111/geb.13141                                        in perspective. Soil Biol. Biochem. 27, 401–407. doi: 10.1016/0038-0717(95)
Nakagawa, S., Johnson, P. C. D., and Schielzeth, H. (2017). The coefficient of                        98610-Z
   determination R2 and intra-class correlation coefficient from generalized linear                Swenson, N. G., and Enquist, B. J. (2007). Ecological and evolutionary
   mixed-effects models revised and expanded. J. R. Soc. Interface 14:20170213.                       determinants of a key plant functional trait: wood density and its community-
   doi: 10.1098/rsif.2017.0213                                                                        wide variation across latitude and elevation. Am. J. Bot. 94, 451–459. doi: 10.
Nardoto, G. B., Quesada, C. A., Patiño, S., Saiz, G., Baker, T. R., Schwarz, M., et al.               3732/ajb.94.3.451
   (2014). Basin-wide variations in Amazon forest nitrogen cycling characteristics                 Taylor, B. N., and Ostrowsky, L. R. (2019). Nitrogen-fixing and non-fixing trees
   as inferred from plant and soil 15N:14N measurements. Plant. Ecol. Divers. 7,                      differ in leaf chemistry and defence but not herbivory in a lowland Costa Rican
   173–187. doi: 10.1080/17550874.2013.807524                                                         rain forest. J. Trop. Ecol. 35, 270–270. doi: 10.1017/S0266467419000233
Nasto, M. K., Alvarez-Clare, S., Lekberg, Y., Sullivan, B. W., Townsend, A. R.,                    Tedersoo, L., Laanisto, L., Rahimlou, S., Toussaint, A., Hallikma, T., and Pärtel,
   and Cleveland, C. C. (2014). Interactions among nitrogen fixation and soil                         M. (2018). Global database of plants with root-symbiotic nitrogen fixation:
   phosphorus acquisition strategies in lowland tropical rain forests. Ecol. Lett. 17,                NodDB. J. Veg. Sci. 29, 560–568. doi: 10.1111/jvs.12627
   1282–1289. doi: 10.1111/ele.12335                                                               Tilman, D., Isbell, F., and Cowles, J. M. (2014). Biodiversity and ecosystem
Oelmann, Y., Buchmann, N., Gleixner, G., Habekost, M., Roscher, C., Rosenkranz,                       functioning. Annu. Rev. Ecol. Evol. Syst. 45, 471–493. doi: 10.1146/annurev-
   S., et al. (2011). Plant diversity effects on aboveground and belowground N                        ecolsys-120213-091917
   pools in temperate grassland ecosystems: development in the first 5 years                       Townsend, A. R., Asner, G. P., and Cleveland, C. C. (2008). The biogeochemical
   after establishment. Glob. Biogeochem. Cy. 25:GB2014. doi: 10.1029/2010GB                          heterogeneity of tropical forests. Trends Ecol. Evol. 23, 424–431. doi: 10.1016/j.
   003869                                                                                             tree.2008.04.009
Oliveira, L. Z., Uller, H. F., Klitzke, A. R., Eleotério, J. R., and Vibrans, A. C. (2019).        Townsend, A. R., Cleveland, C. C., Asner, G. P., and Bustamante, M. M. C. (2007).
   Towards the fulfillment of a knowledge gap: wood densities for species of the                      Controls over foliar N:P ratios in tropical rain forests. Ecology 88, 107–118.
   subtropical Atlantic forest. Data 4:104. doi: 10.3390/data4030104                                  doi: 10.1890/0012-9658(2007)88[107:cofnri]2.0.co;2
Oliveras, I., Bentley, L., Fyllas, N. M., Gvozdevaite, A., Shenkin, A. F., Peprah,                 Ulloa, U. C., Acevedo-Rodríguez, P., Beck, S., Belgrano, M. J., Bernal, R., Berry,
   T., et al. (2020). The influence of taxonomy and environment on leaf trait                         P. E., et al. (2017). An integrated assessment of the vascular plant species of the
   variation along tropical abiotic gradients. Front. For. Glob. Change 3:18. doi:                    Americas. Science 358, 1614–1617. doi: 10.1126/science.aao0398
   10.3389/ffgc.2020.00018                                                                         Valentine, A. J., Benedito, V. A., and Kang, Y. (2018). Legume nitrogen fixation and
Ometto, J. P. H. B., Ehleringer, J. R., Domingues, T. F., Berry, J. A., Ishida, F. Y.,                soil abiotic stress: from physiology to genomics and beyond. Annu. Plant Rev.
   Mazzi, E., et al. (2006). The stable carbon and nitrogen isotopic composition of                   Online 42, 207–248. doi: 10.1002/9781119312994.apr0456
   vegetation in tropical forests of the Amazon Basin, Brazil. Biogeochemistry 79,                 Vasseur, F., Violle, C., Enquist, B. J., Granier, C., and Vile, D. (2012). A common
   251–274. doi: 10.1007/s10533-006-9008-8                                                            genetic basis to the origin of the leaf economics spectrum and metabolic scaling
Pardo, L. H., Templer, P. H., Goodale, C. L., Duke, S., Groffman, P. M., Adams,                       allometry. Ecol. Lett. 15, 1149–1157. doi: 10.1111/j.1461-0248.2012.01839.x
   M. B., et al. (2006). Regional assessment of N saturation using foliar and root                 Vieira, S. A., Alves, L. F., Duarte-Neto, P. J., Martins, S. C., Veiga, L. G.,
   δ15N. Biogeochemistry 80, 143–171. doi: 10.1007/s10533-006-9015-9                                  Scaranello, M. A., et al. (2011). Stocks of carbon and nitrogen and

Frontiers in Forests and Global Change | www.frontiersin.org                                  15                                                  July 2021 | Volume 4 | Article 662801
You can also read