High-spatial-resolution probability maps of drought duration and magnitude across Spain
←
→
Page content transcription
If your browser does not render page correctly, please read the page content below
Nat. Hazards Earth Syst. Sci., 19, 611–628, 2019
https://doi.org/10.5194/nhess-19-611-2019
© Author(s) 2019. This work is distributed under
the Creative Commons Attribution 4.0 License.

High-spatial-resolution probability maps of drought
duration and magnitude across Spain
Fernando Domínguez-Castro1 , Sergio M. Vicente-Serrano1 , Miquel Tomás-Burguera2 , Marina Peña-Gallardo1 ,
Santiago Beguería2 , Ahmed El Kenawy1,3,4 , Yolanda Luna5 , and Ana Morata5
1 Instituto
          Pirenaico de Ecología, Spanish National Research Council (IPE-CSIC), Zaragoza, 50059, Spain
2 EstaciónExperimental de Aula Dei, Spanish National Research Council (EEAD-CSIC), Zaragoza, 50059, Spain
3 Department of Geography, Mansoura University, Mansoura, 35516, Egypt
4 Department of Geography, Sultan Qaboos University, Alkhud, 12317, Oman
5 Agencia Estatal de Meteorología (AEMET), Madrid, 28071, Spain

Correspondence: Fernando Domínguez-Castro (f.dominguez.castro@gmail.com)

Received: 9 October 2018 – Discussion started: 1 November 2018
Revised: 20 February 2019 – Accepted: 22 February 2019 – Published: 21 March 2019

Abstract. Assessing the probability of occurrence of drought     1   Introduction
is important for improving current drought assessment, man-
agement and mitigation measures, and strategies across           Drought is one of the main hydroclimatic hazards in Spain,
Spain. This study employed two well-established drought          with adverse impacts on natural and human environments
indices, the Standardized Precipitation Index (SPI) and the      (Pérez and Barreiro-Hurlé, 2009; UNEP, 2006). Numer-
Standardized Precipitation Evapotranspiration Index (SPEI),      ous studies have analysed drought characteristics in Spain,
to characterize drought duration and magnitude at different      suggesting a strong variability over both space and time
timescales over Spain. In order to map the drought hazard        (e.g. Domínguez-Castro et al., 2019a; González-Hidalgo et
probability, we applied the extreme value theory and tested      al., 2018). In Spain, drought management measures are usu-
different thresholds to generate peak-over-threshold (POT)       ally based on insurance and government subsidies to dimin-
drought duration and magnitude series. Our results demon-        ish their impacts, particularly those related to the agricul-
strate that the generalized Pareto (GP) distribution performs    tural sector (Fernández, 2006). Alongside the existing sys-
well in estimating the frequencies of drought magnitude and      tems for monitoring hydrological drought conditions across
duration. Specifically, we found a good agreement between        Spain (Maia and Vicente-Serrano, 2017), there are various
the observed and modelled data when using upper percentiles      pieces of national legislation (e.g. special drought plans) that
to generate the POT series. Spatially, our estimations suggest   aim at improving drought adaptation strategies and practices
a higher probability of extreme drought events in southern       (Garrick et al., 2017).
and central Spain compared to the northern and eastern re-          Although current national measures are quite useful to
gions. Also, our study found spatial differences in drought      diminish drought risk, other improved approaches are still
probability estimations as a function of the selected drought    desired to reduce drought risk, particularly for real-time
index (i.e. SPI vs. SPEI) and timescale (i.e. 1, 3, 6, and 12    drought monitoring (e.g. Svoboda et al., 2002) and forecast-
months). Drought hazard probability maps can contribute          ing (e.g. Mishra et al., 2009; Mishra and Singh, 2011). In this
to the better management of different sectors (e.g. agricul-     context, drought probability maps can be a promising tool to
ture, water resources management, urban water supply, and        characterize drought risk at a detailed spatial scale. In par-
tourism) at national, regional, and even local scale in Spain.   ticular, it is possible to determine the probability of drought
                                                                 episodes of a certain severity, allowing for better sectorial
                                                                 management strategies. Due to the availability of dense spa-
                                                                 tial climate data, there is a possibility to map drought proba-
                                                                 bility at a fine spatial scale. This detailed scale can be useful

Published by Copernicus Publications on behalf of the European Geosciences Union.
612            F. Domínguez-Castro et al.: High-spatial-resolution probability maps of drought magnitude across Spain

for different socioeconomic sectors and for natural ecosys-         be assessed at various drought timescales (McKee et al.,
tems. The utility of probabilistic approaches for enhancing         1993; Vicente-Serrano, 2013). Moreover, the spatial patterns
drought monitoring and adaptation was evidenced in many             of drought and hazard probability maps can differ largely
regions worldwide (e.g. Engeland et al., 2005; Hussain et al.,      in response to timescale (Vicente-Serrano, 2006). Taken to-
2018; She et al., 2014; Tosunoglu and Can, 2016; Zamani et          gether, it is important to assess drought hazard probability
al., 2015).                                                         at different drought timescales to meet the specific needs of
   In Spain, several studies have developed dry spell proba-        different socioeconomic sectors and natural systems.
bility maps (e.g. Lana et al., 2006; Martin-Vide and Gomez,             The overall objective of this study is to employ a newly
1999; Pérez-Sánchez and Senent-Aparicio, 2018). However,            developed high-resolution spatial (1.21 km2 ) and temporal
given that the probability of occurrence of dry spells is higher    (weekly) gridded dataset of drought indices (Vicente-Serrano
in arid regions than in humid regions, these studies did not        et al., 2017) to characterize drought events in Spain. Specif-
account for the different drought hazard probabilities across       ically, this study aims to (i) apply the extreme value theory
Spain. It is well-recognized that the frequency and duration        to determine the best threshold and statistical distribution to
of dry spells are largely driven by the climatology of the          fit the probability of drought duration and magnitude, (ii) ex-
studied area. Accordingly, the spatial variability of climate       plore spatial variations in this probability as a function of two
aridity can show similar spatial patterns to those of dry spell     common drought indices, with different underlying calcula-
probability. However, drought probability cannot necessar-          tions (i.e. SPI vs. SPEI), and (iii) assess whether there are
ily be related to the spatial patterns of climate aridity, as it    spatial differences in drought hazard probability in response
can be associated more with the intrinsic characteristics of        to the different drought timescales. In Spain, this detailed
drought events. This is simply because, irrespective of the         spatial assessment is still lacking, limiting the possibility to
climatology, drought can occur in any world region when             provide guidance on the use of drought hazard probability to
there is a negative anomaly with respect to the long-term           manage and mitigate drought risks at the national, regional,
average moisture conditions (Wilhite and Pulwarty, 2017).           and even local scale.
This highlights the importance of data standardization to
make drought characteristics (e.g. duration, intensity, sever-
ity) comparable among regions with different climatic con-          2     Data and methods
ditions. Several drought indices (e.g. Standardized Precipi-
tation Index (SPI), Standardized Precipitation Evapotranspi-        2.1    Dataset
ration Index (SPEI), Palmer Drought Severity Index, Self-
calibrated Palmer Drought Severity Index) have been devel-          Based on gridded datasets of maximum and minimum air
oped to characterize drought conditions across regions with         temperatures (1304 observatories), precipitation (2269 ob-
different climatic conditions (Redmond, 2002). Also, irre-          servatories), wind speed (82 observatories), relative humid-
spective of climatic conditions, these indices can identify         ity (179 observatories), and sunshine duration (112 obser-
drought episodes according to their duration and magnitude          vatories), Vicente-Serrano et al. (2017) developed a high-
(Dracup et al., 1980) Overall, based on these drought indices,      resolution spatial (1.21 km2 ) and temporal (weekly) drought
the probability of occurrence of drought duration and magni-        dataset for Spain (412 178 pixels). This dataset spans the
tude can be characterized at a detailed spatial resolution. In      period from 1961 to 2014. This drought dataset was devel-
their assessment of drought characteristics in Serbia, Tošić       oped after a rigorous procedure to check the quality and
and Unkašević (2014) analysed the probability of occurrence        homogeneity of the input climatic data. The grid of each
of drought using the SPI between 1949 and 2011, concluding          variable was computed by a universal kriging method (Bor-
that the generalized Pareto (GP) distribution fits well with        rough and McDonnell, 1998; Pebesma, 2004) using the lat-
the series at 1- and 12- month timescales. Similarly, Yusof         itude, longitude, and elevation of each grid cell as auxil-
et al. (2013) analysed the probability of drought duration          iary variables. The grid layers were validated with a jack-
and magnitude using the SPI and rainfall data from 30 rain          knife resampling procedure (Phillips et al., 1992), indicat-
gauges distributed across peninsular Malaysia. Also, Zin et         ing low differences between the predicted and the observed
al. (2013) assessed the return period of drought severity over      values for each grid. A detailed description of this dataset
peninsular Malaysia by means of the SPI. An inspection of           can be found in Vicente-Serrano et al. (2017). Overall, these
these studies reveals that they employed only an individual         gridded climatic data were employed to compute the SPI
drought index in most cases, with few attempts to explore the       (McKee et al., 1993) and the SPEI (Vicente-Serrano et al.,
possible differences in drought hazard probability as a func-       2010) at different timescales ranging from 1 to 48 months
tion of different drought indices (e.g. Yan et al., 2018) or dif-   (http://monitordesequia.csic.es, last access: 6 March 2019).
ferent drought timescales (Moradi et al., 2011; Tošić and Un-      While the SPI accounts only for precipitation data, the SPEI
kašević, 2014). Due to the varying response of the different       is based on a normalization of the difference between pre-
hydrological subsystems, socioeconomic sectors, and natu-           cipitation and atmospheric evaporative demand (AED). In
ral ecosystems to drought, the impacts of droughts should           this study, we employed these two drought indices to char-

Nat. Hazards Earth Syst. Sci., 19, 611–628, 2019                              www.nat-hazards-earth-syst-sci.net/19/611/2019/
F. Domínguez-Castro et al.: High-spatial-resolution probability maps of drought magnitude across Spain                           613

acterize the possible impacts of the AED on drought hazard               Numerous studies employed the GP distribution to model
probability. Drought characteristics were assessed for the pe-        meteorological and hydrological droughts (e.g. Fleig et al.,
riod 1961–2014 using the SPI and SPEI at timescales of 1, 3,          2006; Nadarajah, 2008; Nadarajah and Kotz, 2008; Chen et
6, and 12 months.                                                     al., 2011; Yusof et al., 2013; Tošić and Unkašević, 2014;
                                                                      Trenberth et al., 2014; Zamani et al., 2015; Liu et al., 2016).
2.2   Selection of drought events                                     This is mainly because the probability distribution of a POT
                                                                      series, with random occurrence times, fits well with GP dis-
There are several criteria (thresholds) to identify indepen-          tribution (e.g. Hosking and Wallis, 1987; Pham et al., 2014;
dent drought events (e.g. Fleig et al., 2006; Lee et al., 1986).      Wang, 1991). The GP distribution is a flexible, long-tailed
These thresholds are generally arbitrary, with no clear objec-        distribution, whose distribution function is formulated as
tive metrics to relate a certain value of a drought index with
specific sectorial impacts. Indeed, this is a challenging task,
                                                                                   h     κ        i1/κ
                                                                      F (x) = 1 − 1 − (x − ε)          ,                          (2)
given the large number of economic sectors and environ-                                  α
mental systems impacted by droughts (Pérez and Barreiro-              where κ, α, and ε are the shape, scale, and location pa-
Hurlé, 2009). Furthermore, regions and sectors can respond            rameters of the distribution origin that correspond to the
differently to various drought timescales (Lorenzo-Lacruz et          lower bound x0 . The GP parameters were obtained using L-
al., 2013; Pasho et al., 2012). In this work, we obtained se-         moment statistics following Hosking (1990).
ries of drought events from weekly gridded series of SPEI                Hosking (1990) proposed a procedure to provide paramet-
and SPI at four selected timescales (1, 3, 6, and 12 months).         ric approximations to the relationships between L skewness
We used a zero threshold to define drought events. Although           and L kurtosis. This procedure allows for the determination
this threshold allows for the inclusion of less severe drought        of the suitability of the GP distribution to fit the exceedance
events, it can secure a sufficient sampling size to conduct the       obtained from different x0 values. Herein, we plotted the dif-
probabilistic analysis. Importantly, the retention of drought         ferent L-moment diagrams with the statistics obtained from
events in this manner will not bias the obtained results, con-        drought duration and magnitude series. The aim was to as-
sidering that high values of the series will be retained follow-      sess the suitability of the different x0 thresholds to obtain
ing the peak-over-threshold approach.                                 POT series with a good fit to the GP distribution.
   Overall, each drought event was defined as the period of              We applied the Anderson–Darling test to check the good-
consecutive weeks with SPI or SPEI values lower than zero.            ness of fit of the POT series obtained from different x0
Likewise, the series of drought duration and magnitude were           thresholds. To define the most suitable threshold, we paid
created based on the consecutive weeks of SPEI–SPI values             attention to securing a sample of sufficient length to obtain
below zero. The drought magnitude was calculated follow-              solutions for the GP parameters. This is important to obtain
ing the classical approach of Dracup et al. (1980). However,          reliable probability estimations. For this purpose, we com-
for operational purposes, the total magnitude of drought was          pared the observed maximum drought duration and magni-
transformed to positive values.                                       tude obtained for the whole study period (1961–2014) with
                                                                      those estimated using GP distribution and POT for the dif-
2.3   Probabilistic analysis                                          ferent thresholds. Then, we calculated the probability that
                                                                      an event of magnitude XT in a period of T = 54 years (ex-
The peak-over-threshold (POT) series were obtained using
                                                                      pressed in the original scale) will occur at least once in a
series of drought duration and magnitude calculated at 1-
                                                                      period of T years. This is formulated as
, 3-, 6-, and 12-month timescales. These series are stationary
                                                                                             1 κ

and do not show any trend (Domínguez-Castro et al., 2019a),                       α
which is a prerequisite for the application of extreme value          XT = ε +       1−             ,                             (3)
                                                                                  κ         λT
theory. The POT series were obtained according to a thresh-
old (x0 ) as                                                          where λ is a frequency parameter equalling the average num-
                                                                      ber of occurrences of X per year in the original sample. The
Y = X − x0 ∀X > x0 .                                           (1)    performance of each threshold was assessed using different
                                                                      accuracy statistics, including the mean absolute error (MAE),
In order to assess the role of the selected threshold in fitting      the Willmott D agreement index (Willmott, 1981), and the
the probability distribution of the series, we tested different       Pearson’s r correlation coefficient. Comparisons were made
thresholds defined according to the percentiles of the series         for the observed maximum drought duration and magnitude
(i.e. 0th, 10th, 20th, . . . , 90th, and 95th). Following this pro-   and the GP estimations for the same sample length.
cedure, we selected the optimal percentile threshold to define           Once a general threshold was established to define the
the exceedance series of drought duration and magnitude for           POT series of drought duration and magnitude, we deter-
the different indices and timescales.                                 mined the goodness of the GP modelling for each drought
                                                                      index and timescale. For this purpose, we used probability–
                                                                      probability (P–P) plots, which define the extent to which

www.nat-hazards-earth-syst-sci.net/19/611/2019/                                Nat. Hazards Earth Syst. Sci., 19, 611–628, 2019
614            F. Domínguez-Castro et al.: High-spatial-resolution probability maps of drought magnitude across Spain

Figure 1. L-moment diagrams for the peak-over-threshold series obtained from the 1-month SPEI duration series.

Nat. Hazards Earth Syst. Sci., 19, 611–628, 2019                               www.nat-hazards-earth-syst-sci.net/19/611/2019/
F. Domínguez-Castro et al.: High-spatial-resolution probability maps of drought magnitude across Spain                     615

Figure 2. L-moment diagrams for the peak-over-threshold series obtained from the 12-month SPEI magnitude series.

www.nat-hazards-earth-syst-sci.net/19/611/2019/                                Nat. Hazards Earth Syst. Sci., 19, 611–628, 2019
616 F. Domínguez-Castro et al.: High-spatial-resolution probability maps of drought magnitude across Spain
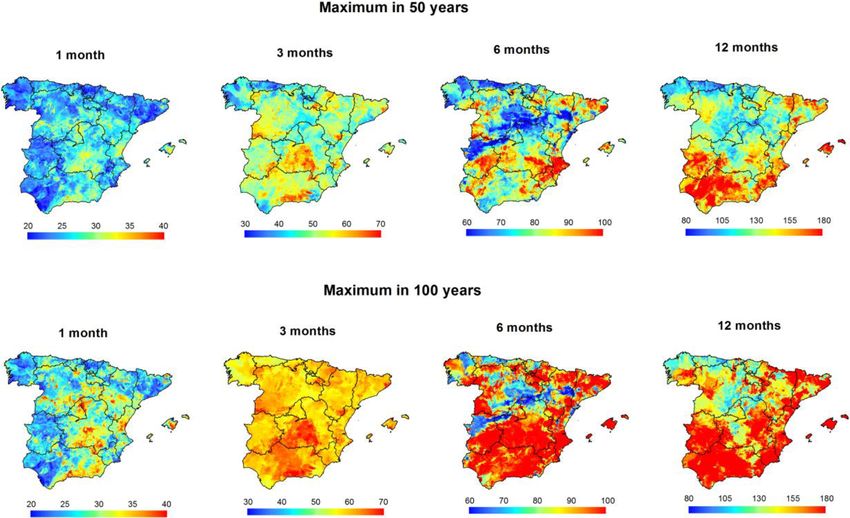
Figure 3. Probability density diagrams showing the number of cases corresponding to the peak-over-threshold drought duration–magnitude
series at different percentiles and different timescales (1, 3, 6, and 12 months) using (a) SPI and (b) SPEI.
the empirical and modelled GP cumulative distribution func-
tions (CDFs) closely match. This procedure was applied to a 1
wj = , (5)
total of 412 178 gridded series of drought magnitude and du- 1 − CDF(j )
ration covering the four selected timescales of the SPI and
SPEI. The empirical CDFs were obtained using the plot- where CDF is the cumulative distribution function, and
ting position formula proposed by Hosking (1990) for highly j refers to the observations in the series of exceedance sorted
skewed data, according to in ascending order.
i − 0.35
P (X ≤ x) = , (4) 3 Results
N
where i is the rank of the observations arranged in descend- 3.1 Selection of the distribution and threshold to define
ing order, and N is the number of observations. The goodness the POT series
of agreement between the empirical and modelled CDFs was
tested using a weighted correlation coefficient. This proce- Figure 1 illustrates some examples of L-moment diagrams,
dure gives more weight to the highest and less frequent ob- considering the 1-month SPEI duration series over peninsu-
servations in the sample, which are more relevant to extreme lar Spain. The series for each diagram were obtained con-
value analysis. The weight was defined using the empirical sidering POT at different percentiles. Each line represents a
CDF as theoretical curve distribution: the generalized logistic (GLO,
blue), generalized extreme value (GEV, green), generalized
Nat. Hazards Earth Syst. Sci., 19, 611–628, 2019 www.nat-hazards-earth-syst-sci.net/19/611/2019/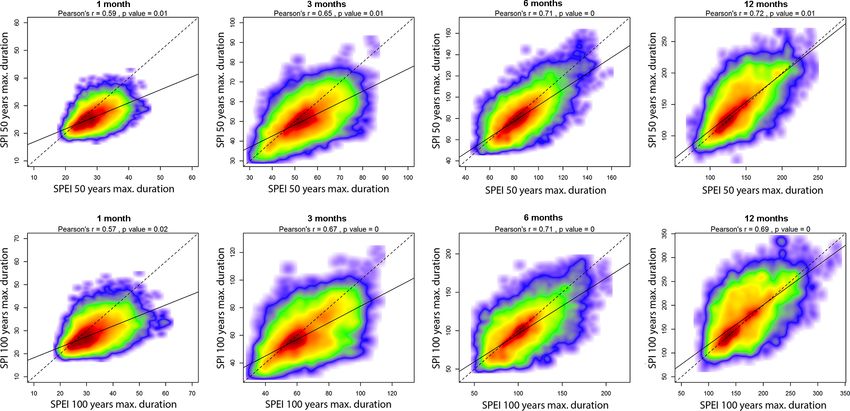
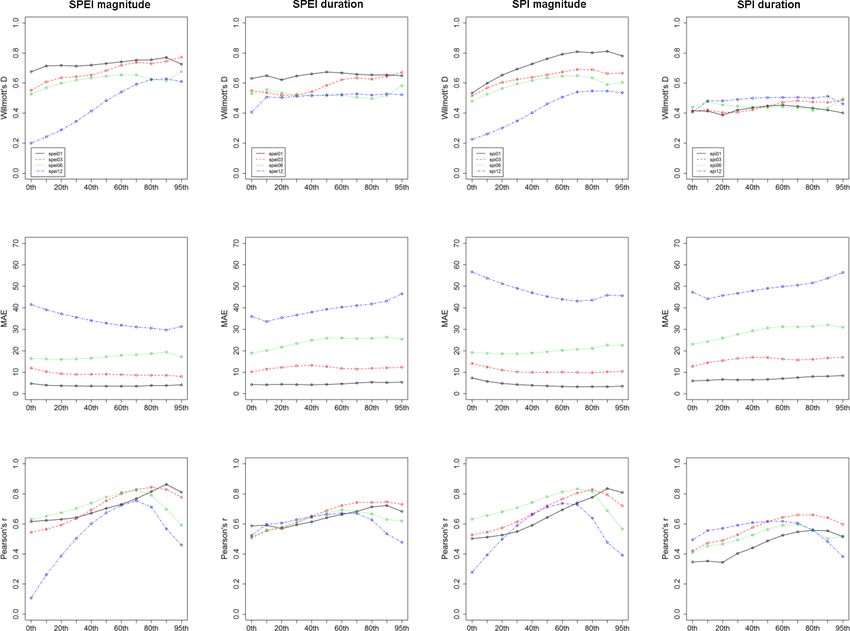
F. Domínguez-Castro et al.: High-spatial-resolution probability maps of drought magnitude across Spain                                617

Figure 4. Willmott’s D, mean absolute error (MAE), and Pearson’s r summarized as a function of the different percentiles used to obtain the
peak-over-threshold series. All accuracy metrics were computed based on comparing the maximum observed and modelled 1-, 3-, 6-, and
12-month SPI and SPEI drought duration and magnitude between 1961 and 2014. The modelled data were computed using the generalized
Pareto distribution.

Pareto (GPA, red), generalized normal (GNO, black), and                 using the SPI. Table 1 summarizes the percentage of the
Pearson type III (PE3, light blue). As noted, irrespective of           POT series that fit well with the GP distribution following
the selected threshold, the drought duration series tend to             Anderson–Darling statistics. As listed, the series of drought
closely approximate to the GP distribution. Notably, there is           magnitude show a better fit to GP distribution than those of
a higher dispersion of points around the theoretical curve at           drought duration, but with no considerable differences be-
higher percentiles, which can simply be seen in the context             tween SPI and SPEI. In contrast, we noted remarkable dif-
of lower sampling size. Figure 2 depicts the L-moment di-               ferences amongst the different timescales. For example, we
agrams corresponding to the 12-month SPEI magnitude se-                 noted that a high percentage of the series obtained for low
ries. The plots show high dispersion considering the differ-            percentiles did not fit well to the GP distribution. In con-
ent percentile thresholds. Nevertheless, at low percentiles,            trast, for all drought duration and magnitude series, this fit-
the points do not approximate to the theoretical curve of the           ting improved markedly when considering higher percentiles
GP distribution, but they conversely tend to approximate to             (mostly above the 40th percentile). The only exceptions were
the GP curve at percentiles between 60th and 80th. Again, the           found for the duration series obtained at a 1-month timescale,
points exhibited high dispersion at upper percentiles (mostly           but considering thresholds higher than the 80th percentile
above the 85th). An inspection of Figs. S1 to S14 in the                either for SPI or SPEI. The total percentage of these series
Supplement suggests similar patterns for other timescales               is close to 100 %. Overall, although the results suggest that
and for the drought duration and magnitude series obtained              high percentiles (e.g. 90th or 95th) were more appropriate

www.nat-hazards-earth-syst-sci.net/19/611/2019/                                   Nat. Hazards Earth Syst. Sci., 19, 611–628, 2019
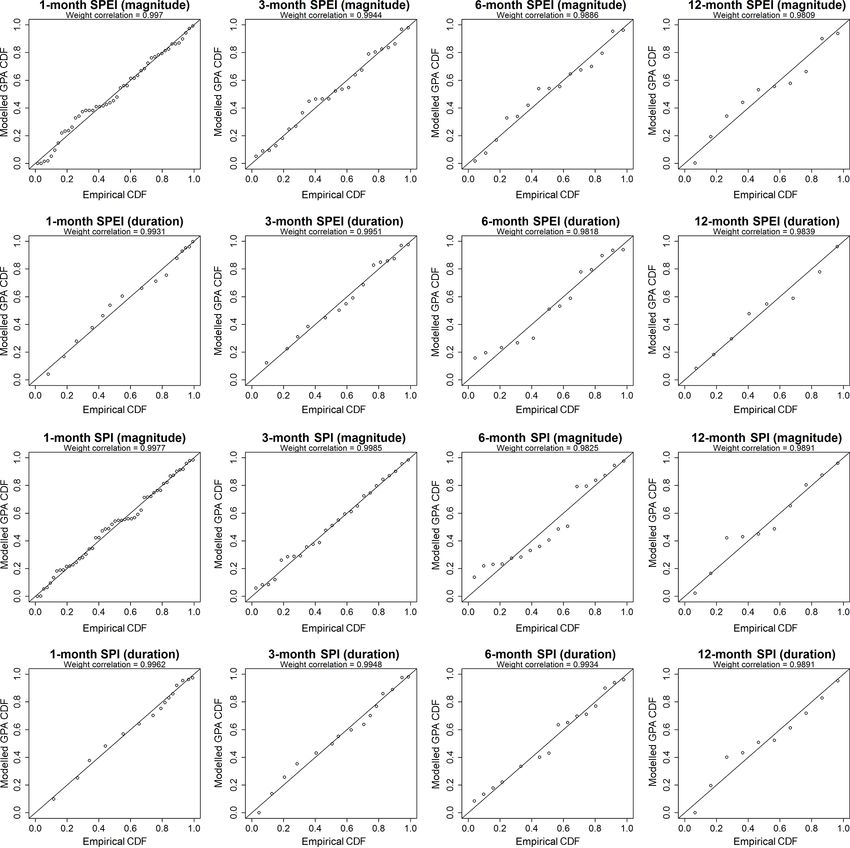
618            F. Domínguez-Castro et al.: High-spatial-resolution probability maps of drought magnitude across Spain

Figure 5. Example of probability–probability (P–P) plots for the series of 1-, 3-, 6-, and 12-month SPEI and SPI drought duration and
drought magnitude obtained by means of the 80th percentile used as a threshold to derive the peak-over-threshold series.

to define the series of drought duration and magnitude, our          6, and 12 months). It can be noted that the number of events
decision was to define the series using a more relaxed thresh-       using the 90th and 95th percentile thresholds was very low
old (80th percentile). This decision was motivated mainly by         for all timescales. This low number of events was statisti-
the notion that L-moment statistics showed high dispersion at        cally insufficient for the reliable estimation of L-moment and
the uppermost percentiles. Furthermore, it was quite difficult       GP parameters (Table 2). Accordingly, we considered lower
to secure a sufficient sampling size using these upper per-          percentiles to get more reliable probabilistic estimations. In
centiles. Figure 3 shows the number of drought events corre-         this context, our results indicated that the series of drought
sponding to the different percentiles and timescales (i.e. 1, 3,     duration and magnitude obtained using the 80th percentile

Nat. Hazards Earth Syst. Sci., 19, 611–628, 2019                              www.nat-hazards-earth-syst-sci.net/19/611/2019/
F. Domínguez-Castro et al.: High-spatial-resolution probability maps of drought magnitude across Spain                                     619

Figure 6. Spatial distribution of the weight correlation coefficients from probability–probability (P–P) plots for the series of 1-, 3-, 6-, and
12-month SPEI and SPI drought duration and magnitude series obtained considering the 80th percentile as a threshold for the peak-over-
threshold series.

as a threshold mostly fit to the GP distribution, and the ma-                Also, we compared the empirical and modelled cumu-
jority of these series (≈ 99 %) showed solutions for GP pa-               lative distribution functions using the GP distribution con-
rameters. Figure 4 depicts the accuracy metrics (i.e. Will-               sidering the 80th percentile POT series. Comparisons were
mott’s D, MAE, and Pearson’s r coefficient), which com-                   made at the pixel scale considering the two drought indices
pare the maximum observed and modelled drought duration                   (SPI vs. SPEI) and the different timescales. A representa-
and magnitude for each grid. It can be noted that the agree-              tive example is shown in Fig. 5 for the grid point located
ment between the maximum observed and modelled values                     at 40◦ N and 3◦ W. As illustrated, we noted a high agree-
is higher for drought magnitude series than for drought dura-             ment between the empirical and modelled CDFs, irrespec-
tion series. However, for drought magnitude and duration se-              tive of the drought index and the timescale. However, a lower
ries, this agreement improved when considering higher per-                agreement was observed for longer timescales (i.e. 6 and 12
centiles, especially the 80th percentile. These findings were             months). This can be expected given the low sampling size
clearly evident for the SPI and SPEI and for all timescales.              at long timescales in comparison to shorter timescales. Over-
                                                                          all, the weighted correlations between the empirical and the

www.nat-hazards-earth-syst-sci.net/19/611/2019/                                      Nat. Hazards Earth Syst. Sci., 19, 611–628, 2019
620 F. Domínguez-Castro et al.: High-spatial-resolution probability maps of drought magnitude across Spain
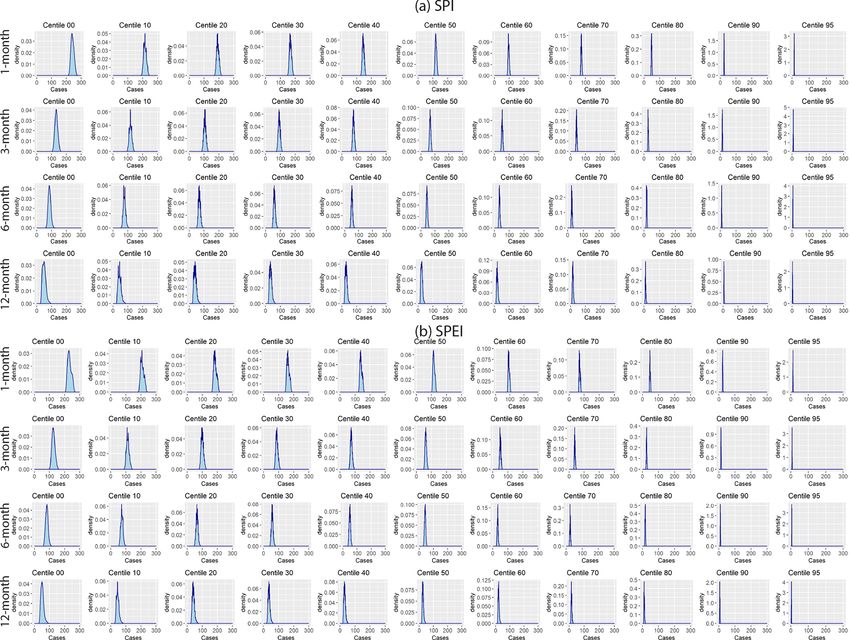
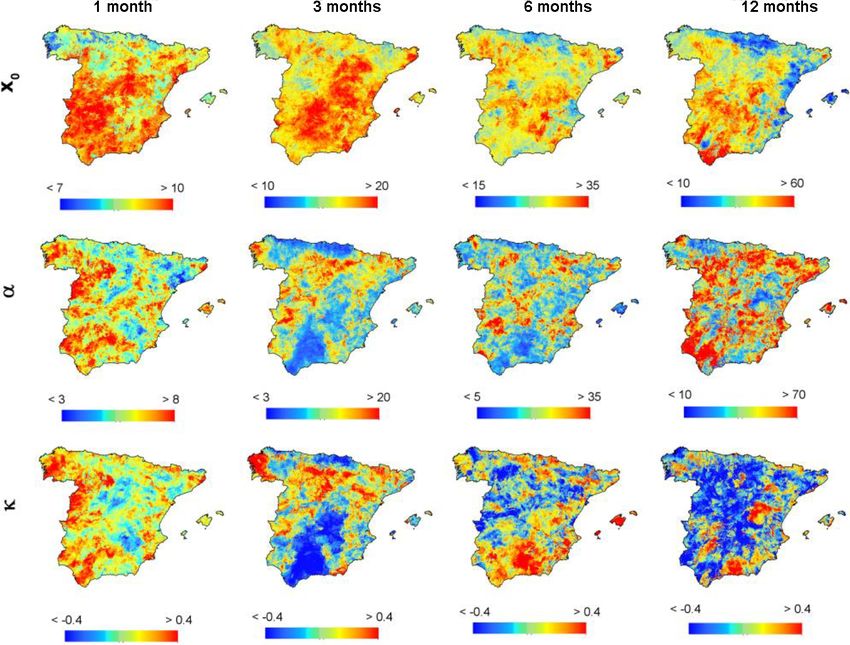
Figure 7. Spatial distribution of the parameters of the GP distribution calculated for the SPI duration series.
modelled CDFs showed high values (> 0.98) in all cases, scale (α) parameters for longer timescales. This can be
which was reflected in the general observed pattern for the explained by the increase in drought duration at longer
whole of Spain. Figure 6 depicts the spatial distribution of timescales. The shape (k) parameter exhibited similar range
the weighted correlations between the empirical and the GP- values for all timescales. Herein, it is difficult to interpret
distribution-modelled CDFs using the 80th percentile POT the geographical distribution of the shape (k), as there is
series. At the 1- and 3-month timescales, the correlations large uncertainty in estimating this parameter (Rosbjerg et
were close to 1 for all of Spain. The magnitude of correlation al., 1992). As illustrated in Figs. S15 and S16, all parameters
decreased for the 6- and 12-month timescales, despite being showed similar spatial patterns for the drought magnitude se-
above 0.97 in most areas. Overall, these findings support our ries.
decision to select the 80th percentile and the GP distribution We mapped drought probability for the drought duration
to statistically model drought duration and magnitude in our and magnitude series using parameter maps and Eq. (3). Fig-
study domain. ure 9 shows the estimated drought duration (in weeks) ob-
tained from the 1-, 3-, 6-, and 12-month SPEI series for
3.2 Mapping drought duration and magnitude periods of 50 and 100 years. The results suggest impor-
tant spatial differences among drought timescales. For ex-
Figures 7 and 8 illustrate the spatial distribution of GP pa- ample, at the 1-month timescale, the maximum duration
rameters calculated for drought duration series obtained us- was found in the central areas of Spain, with more than
ing the SPI and SPEI, respectively. The GP parameters 40 weeks of consecutive negative SPEI values. A similar pat-
showed very similar distributions for SPI and SPEI. How- tern can also be noted for the 3-month timescale, as central
ever, we found considerable spatial variations in the dis- and southern Spain experience a longer duration. In northern
tribution of these parameters as a function of the drought Spain, the estimated maximum drought duration is almost
timescale, with higher values of the location (Xo ) and half that in central Spain. Nevertheless, the spatial patterns
Nat. Hazards Earth Syst. Sci., 19, 611–628, 2019 www.nat-hazards-earth-syst-sci.net/19/611/2019/F. Domínguez-Castro et al.: High-spatial-resolution probability maps of drought magnitude across Spain 621 Figure 8. Spatial distribution of the parameters of the GP distribution calculated for the SPEI duration series. of drought probability differ markedly at the timescales of are clearly minimized. For drought magnitude, the quantile 6 and 12 months, with the maximum duration recorded in estimates show more consistent spatial patterns for the two south-eastern and south-western regions and parts of north- indices compared to those identified for drought duration se- ern and north-eastern Spain. The spatial patterns found at the ries (Figs. S17 to S19). 12-month timescale closely resemble those observed at the 6-month timescale, suggesting a maximum drought duration (> 180 weeks) in a period of 50 years over some regions in the south-west and along the eastern Mediterranean coast. On 4 Discussion and conclusions the other hand, considering the maximum drought duration for a period of 100 years, drought events are expected to ex- We developed high-resolution drought probability maps for tend spatially, especially in southern Spain. Figure 10 reveals Spain using two widely recognized drought indices that are that drought probability maps obtained using SPI are similar spatially and temporally comparable: the Standardized Pre- to those obtained using SPEI, although with some spatial dif- cipitation Index (SPI) and the Standardized Precipitation ferences that can mainly be linked to drought timescale. Fig- Evapotranspiration Index (SPEI). Although they have simi- ure 11 summarizes the relationship between the maximum lar conceptual backgrounds, these indices differ in their in- drought duration of SPEI and SPI, considering 1-, 3-, 6-, and put variables. Specifically, while the SPI accounts only for 12-month timescales and periods of 50 and 100 years. For precipitation data (McKee et al., 1993), the SPEI considers drought duration, the agreement between SPI and SPEI is the atmospheric evaporative demand (AED) in its calcula- stronger considering long timescales. For timescales between tion (Vicente-Serrano et al., 2010). In this study, we com- 1 and 6 months, the SPEI tends to record higher quantile esti- puted these two drought indices at different timescales (1, 3, mates than SPI. Nevertheless, at the 12-month timescale, the 6, and 12 months). The aim was to assess whether there are differences in the quantile estimates between the two indices noticeable spatial differences in the obtained drought haz- www.nat-hazards-earth-syst-sci.net/19/611/2019/ Nat. Hazards Earth Syst. Sci., 19, 611–628, 2019
622             F. Domínguez-Castro et al.: High-spatial-resolution probability maps of drought magnitude across Spain

Figure 9. Spatial distribution of the maximum drought duration (in weeks) from the 1-, 3-, 6-, and 12-month SPEI series in a period of 50 and
100 years.

ard probabilities as a function of the selected index and/or             independent series. While regionalization is advantageous in
timescale.                                                               terms of spatial homogeneity and the reduction of param-
   We assessed the suitability of the GP distribution to model           eter uncertainty (Hosking and Wallis, 1997), characteriza-
drought duration and magnitude events. The results demon-                tion of drought conditions in our study domain reveals no-
strate that drought magnitude and duration series mostly fit             ticeable spatial differences in response to drought timescale.
well with a GP distribution, a finding that was confirmed                This is clearly evident for probabilities of both drought dura-
in earlier drought assessment investigations in many regions             tion and magnitude. Regionalization is usually based on the
worldwide (e.g. Chen et al., 2011; Serra et al., 2016; Vicente-          variables used for calculating drought indices (i.e. precipita-
Serrano and Beguería-Portugués, 2003; Zamani et al., 2015).              tion or the difference between precipitation and atmospheric
In this study, our decision to select the GP distribution was            evaporative demand) (Ghosh and Srinivasan, 2016; Habibi
motivated by the need to achieve a balance between the good-             et al., 2018; Santos et al., 2011; Yuan et al., 2013; Zhang
ness of the fit to the GP distribution on the one hand and the           et al., 2015). Importantly, this study stresses that this kind
selection of a representative threshold to obtain the POT se-            of regionalization might not be useful when drought haz-
ries on the other hand. Our exploratory analysis suggests the            ard differs strongly due to drought timescale. Previous stud-
use of the 80th percentile as a threshold. This threshold is a           ies indicated that the spatial patterns of drought may differ
good balance between the two requirements for the SPI and                strongly as a function of drought timescale, especially with
SPEI and for all timescales.                                             different temporal influences of local–regional precipitation
   In earlier hydrologic and climatic hazards investigations,            events on drought index values (e.g. Vicente-Serrano, 2006).
a regionalization approach has been employed to estimate                 This is confirmed in our study for the whole of Spain, where
the probability distribution, L-moment statistics, and distri-           the spatial patterns of the GP parameters and the maps of
bution parameters (e.g. Durrans and Tomic, 1996; Serra et                hazard probability strongly vary due to the different drought
al., 2016; She et al., 2014). As opposed to these studies, our           timescale. Again, this stresses the difficulty of applying re-
preference was given to analyse hazard probability locally.              gionalization approaches to obtain maps of drought probabil-
Specifically, to calculate the L-moment statistics and the dis-          ity. This difficulty is confirmed in this study, as our findings
tribution parameters, we considered each gridded cell as an              reveal differences in drought probability as a consequence

Nat. Hazards Earth Syst. Sci., 19, 611–628, 2019                                   www.nat-hazards-earth-syst-sci.net/19/611/2019/
F. Domínguez-Castro et al.: High-spatial-resolution probability maps of drought magnitude across Spain                                  623

Figure 10. Spatial distribution of the maximum drought duration (in weeks) from the 1-, 3-, 6-, and 12-month SPI series in a period of 50 and
100 years.

Figure 11. Scatterplots showing the relationship between the maximum drought duration (in weeks) expected in a period of 50 and 100 years
considering 1-, 3-, 6-, and 12-month SPEI and the SPI. The colours represent the density of points, with red denoting the highest density.
Given the large sample used, the significance of the Pearson’s r coefficients was estimated by means of a Monte Carlo approach using
103 random samples, with each sample containing 30 cases.

www.nat-hazards-earth-syst-sci.net/19/611/2019/                                    Nat. Hazards Earth Syst. Sci., 19, 611–628, 2019
624             F. Domínguez-Castro et al.: High-spatial-resolution probability maps of drought magnitude across Spain

Table 1. Percentage of the peak-over-threshold drought duration and magnitude series that fit well with the generalized Pareto distribution
following Anderson–Darling statistics. Results are summarized for different percentiles and timescales using SPEI and SPI.

                                         Magnitude                                                 Duration
                        1 month    3 months    6 months      12 months        1 month    3 months      6 months    12 months
               SPEI
               00          98.5        42.8        51.8           68.9            0.0        12.8          51.7         81.6
               10th       100.0        91.1        90.4           91.5            3.8        91.0          98.3         99.2
               20th       100.0        99.8        99.1           98.4            3.8        94.8          99.1         99.6
               30th       100.0       100.0       100.0           99.9            5.6        99.5          99.9         99.9
               40th       100.0       100.0       100.0          100.0            8.9       100.0         100.0        100.0
               50th       100.0       100.0       100.0          100.0           37.0       100.0         100.0        100.0
               60th       100.0       100.0       100.0          100.0           57.9       100.0         100.0        100.0
               70th       100.0       100.0       100.0          100.0           84.3       100.0         100.0        100.0
               80th       100.0       100.0       100.0          100.0           98.6       100.0         100.0        100.0
               90th       100.0       100.0       100.0          100.0           98.8       100.0         100.0        100.0
               95th       100.0       100.0       100.0           96.9           98.6       100.0          99.9         98.5
               SPI
               00          85.8        27.9        41.3           70.9            0.0         6.4          39.2         81.5
               10th        99.3        79.9        80.8           88.9            0.1        84.4          96.8         99.1
               20th       100.0        99.0        97.3           97.3            0.1        89.8          98.2         99.5
               30th       100.0       100.0        99.9           99.7            1.4        98.0          99.8         99.9
               40th       100.0       100.0       100.0          100.0            5.0        99.8         100.0        100.0
               50th       100.0       100.0       100.0          100.0           20.8       100.0         100.0        100.0
               60th       100.0       100.0       100.0          100.0           45.2       100.0         100.0        100.0
               70th       100.0       100.0       100.0          100.0           75.7       100.0         100.0        100.0
               80th       100.0       100.0       100.0          100.0           94.4       100.0         100.0        100.0
               90th       100.0       100.0       100.0          100.0           98.6       100.0         100.0         99.9
               95th       100.0       100.0       100.0           98.2           97.1        99.9          99.9         98.8

Table 2. Percentage of cases in which the solution for the L moment and the generalized Pareto distribution parameters is found for the
peak-over-threshold drought duration–magnitude series at different percentiles from 1-, 3-, 6-, and 12-month SPI and SPEI.

                         1 month    3 months    6 months      12 months     1 month     3 months     6 months     12 months
                            SPEI       SPEI        SPEI           SPEI          SPI         SPI          SPI           SPI
                 00        100.0       100.0         100.0        100.0        100.0       100.0         100.0        100.0
                 10th      100.0       100.0         100.0        100.0        100.0       100.0         100.0        100.0
                 20th      100.0       100.0         100.0        100.0        100.0       100.0         100.0        100.0
                 30th      100.0       100.0         100.0        100.0        100.0       100.0         100.0        100.0
                 40th      100.0       100.0         100.0        100.0        100.0       100.0         100.0        100.0
                 50th      100.0       100.0         100.0        100.0        100.0       100.0         100.0        100.0
                 60th      100.0       100.0         100.0        100.0        100.0       100.0         100.0         99.9
                 70th      100.0       100.0         100.0         99.6        100.0       100.0          99.9         99.2
                 80th      100.0       100.0          99.7         97.4        100.0        99.9          99.3         96.8
                 90th       99.7        98.5          96.8         79.8         99.5        97.7          96.6         84.9
                 95th       98.7        86.7          75.9         52.7         96.8        91.1          85.0         52.8

of the selected drought index, which makes this kind of re-               (e.g. stakeholders, decision makers, and local communities).
gionalization a challenging task. A possible solution could               Also, with the spatial coherence and the observed gradients
be establishing different regionalization schemes based on                of GP parameters, a direct calculation of hazard probabili-
the different series of drought indices and timescales. How-              ties at the local scale is highly recommended, particularly in
ever, this is practically disadvantageous, as it makes the                regions with strong spatial and temporal climatic variability
use of probability estimations by end users more confusing                like Spain. Overall, taking all these limitations into consider-

Nat. Hazards Earth Syst. Sci., 19, 611–628, 2019                                   www.nat-hazards-earth-syst-sci.net/19/611/2019/
F. Domínguez-Castro et al.: High-spatial-resolution probability maps of drought magnitude across Spain 625
ation, this study stresses that employing regionalization ap- Assessing drought hazard probability by means of joint
proaches to determine drought hazard probabilities should be probabilities of drought duration and magnitude has been ap-
done with caution, especially when different drought indices plied in more depth through the use of copulas (e.g. Ganguli
and timescales are used. and Reddy, 2012; Liu et al., 2011; Zhang et al., 2015). Nev-
Assessing the different spatial patterns of drought prob- ertheless, given the nature of drought indices, the time se-
abilities as a function of timescales has strong implications ries exhibit strong temporal autocorrelation, and accordingly
for drought impact assessment and drought mitigation. It the duration and magnitude of particular drought events can
is well-established that different hydrological, agricultural, show high agreement. Here, we found a strong correlation
and environmental systems respond differently to drought between the magnitude and the duration of drought events for
timescales (Pasho et al., 2012; Peña-Gallardo et al., 2018; the selected drought indices and timescales. This indicates
Vicente-Serrano, 2013). As such, for more effective assess- that – as expected – the total magnitude of an event is pro-
ment and monitoring of drought hazard, drought timescales portional to drought duration. Therefore, although copulas
must be linked to specific drought impacts. This is basically could give some additional information for particular events,
because although drought probability can differ in response we still believe that an accurate evaluation of drought haz-
to drought timescale, the impacts of drought hazard may ard probability in Spain using a univariate approach is more
vary considerably from one region to another due to different advantageous.
environmental and socioeconomic factors. Correspondingly, Recalling the strong spatial differences in the drought haz-
the degree of vulnerability can differ according to drought ard probability over Spain, the maps obtained in this study
timescale and region. For example, although with the high can contribute to better management practices for differ-
probability of occurrence of an extreme drought event at a ent sectors, including agriculture, water resources manage-
certain timescale in a particular region, drought risk may be ment, urban water supply, tourism, and environmental man-
small if the sensitivity to drought timescale is low. This con- agement. The spatial quantile probabilities developed in this
firms that it is essential to obtain drought hazard probabil- study, combined with those estimated for 50 and 100 years,
ity maps at different timescales. Practically, the real hazard are fully accessible to the research community and end users
would be definitely derived from a drought timescale that via the web repository of the Spanish National Research
triggers impacts in a given space and sector. Council (CSIC) (Domínguez-Castro et al., 2019b).
Recently, there has been a great debate on the influence
of climate change processes on drought severity (Dai, 2013;
Sheffield et al., 2012; Trenberth et al., 2014). This debate Data availability. The Generalized Pareto parameters and drought
is largely motivated by the role of warming processes and risk maps developed in this study are accessible at http://digital.csic.
the atmospheric evaporative demand in drought severity. Nu- es/handle/10261/178150 (Domínguez-Castro et al., 2019b).
merous studies have shown a noticeable increase in the AED
across the Mediterranean region, which could enhance the
severity of drought events in comparison to events driven Supplement. The supplement related to this article is available
online at: https://doi.org/10.5194/nhess-19-611-2019-supplement.
mainly by precipitation deficit (Stagge et al., 2017; Vicente-
Serrano et al., 2014). Here, we indicated that, mainly at
timescales from 1 to 6 months, SPEI duration and magni-
Author contributions. All the authors contributed equally to the pa-
tude values are higher than those of the SPI. This finding
per.
suggests that the increased AED due to warming processes
may have a certain role in increasing drought duration and
magnitude hazard probabilities in Spain. When a drought Competing interests. The authors declare that they have no conflict
event occurs as a consequence of a precipitation deficit, high of interest.
values of the AED can increase the magnitude and duration
of drought events. However, this pattern was not observed
for long drought timescales (i.e. 12 months), which showed Special issue statement. This article is part of the special issue
small differences between the SPI and SPEI drought dura- “Hydroclimatic extremes and impacts at catchment to regional
tion and magnitude quantile maps. This could be explained scales”. It is not associated with a conference.
by the strong seasonality that characterizes the climate of
Spain. This can be seen for the 12-month timescale, which
summarizes the annual climate conditions. As indicated by Acknowledgements. This work was supported by the following
Vicente-Serrano et al. (2014), the role of increased AED research projects: CGL2014-52135-C03-01 and PCIN-2015-220
(mostly recorded during summer months) would be dimin- financed by the Spanish Commission of Science and Technology
ished in comparison to the role of precipitation. In contrast, and FEDER, 1560/2015; Herramientas de monitorización de la
vegetación mediante modelización ecohidrológica en parques
the role of the AED would be more highlighted at shorter
continentales financed by the Red de Parques Nacionales; IM-
timescales that record stronger seasonal variability.
www.nat-hazards-earth-syst-sci.net/19/611/2019/ Nat. Hazards Earth Syst. Sci., 19, 611–628, 2019626 F. Domínguez-Castro et al.: High-spatial-resolution probability maps of drought magnitude across Spain
DROFLOOD financed by Water Works 2014; a co-funded call Ghosh, S. and Srinivasan, K.: Analysis of Spatio-temporal Char-
of the European Commission and INDECIS, which is part of acteristics and Regional Frequency of Droughts in the South-
ERA4CS; and an ERA-NET initiated by JPI Climate, funded by ern Peninsula of India, Water Resour. Manage., 30, 3879–3898,
MINECO with co-funding by the European Union (grant 690462). https://doi.org/10.1007/s11269-016-1396-5, 2016.
Marina Peña-Gallardo was funded by the Spanish Ministry of González-Hidalgo, J. C., Vicente-Serrano, S. M., Peña-Angulo,
Economy and Competitiveness, Miquel Tomas-Burguera was sup- D., Salinas, C., Tomas-Burguera, M., and Beguería, S.: High-
ported by a doctoral grant by the Spanish Ministry of Education, resolution spatio-temporal analyses of drought episodes in the
Culture and Sport, and Ahmed El Kenawy was supported by a western Mediterranean basin (Spanish mainland, Iberian Penin-
postdoctoral Juan de la Cierva contract. sula), Acta Geophys., 66, 381–392, 2018.
Habibi, B., Meddi, M., Torfs, P. J. J. F., Remaoun, M., and
Edited by: Chris Reason Van Lanen, H. A. J.: Characterisation and prediction of me-
Reviewed by: two anonymous referees teorological drought using stochastic models in the semi-arid
Chéliff–Zahrez basin (Algeria), J. Hydrol. Reg. Stud., 16, 15–31,
https://doi.org/10.1016/j.ejrh.2018.02.005, 2018.
Hosking, J. R. M.: L-moments: analysis and estimation of distribu-
tions using linear combinations of order statistics, J. Roy. Stat.
References Soc. Ser. B, 52, 105–124, 1990.
Hosking, J. R. M. and Wallis, J. R.: Parameter and quantile es-
Borrough, P. A. and McDonnell, R. A.: Principles of Geographi- timation for the generalized pareto distribution, Technometrics,
cal Information Systems, Oxford University Press, Oxford, UK, 29, 339–349, https://doi.org/10.1080/00401706.1987.10488243,
1998. 1987.
Chen, L.-H., Hong, Y.-T., and Hsu, C.-W.: A study on regional Hosking, J. R. M. and Wallis, J. R.: Regional Frequency Analy-
drought frequency analysis using self-organizing map and l- sis: An Approach Based on L-moments, Cambridge University
moments, J. Taiwan Agric. Eng., 57, 57–77, 2011. Press, Cambridge, 1997.
Dai, A.: Increasing drought under global warming in ob- Hussain, T., Bakouch, H. S., and Iqbal, Z.: A New Prob-
servations and models, Nat. Clim. Change, 3, 52–58, ability Model for Hydrologic Events: Properties and
https://doi.org/10.1038/nclimate1633, 2013. Applications, J. Agric. Biol. Environ. Stat., 23, 63–82,
Domínguez-Castro, F., Vicente-Serrano, S. M., Tomás-Burguera, https://doi.org/10.1007/s13253-017-0313-6, 2018.
M., Peña-Gallardo, M., Beguería, S., El Kenawy, A., Luna, Y., Lana, X., Martínez, M. D., Burgueño, A., Serra, C., Martín-Vide,
and Morata, A.: High spatial resolution climatology of drought J., and Gómez, L.: Distributions of long dry spells in the Iberian
events for Spain: 1961–2014, Int. J. Climatol., in review, 2019a. Peninsula, years 1951–1990, Int. J. Climatol., 26, 1999–2021,
Domínguez-Castro, F., Vicente-Serrano, S. M., Tomás-Burguera, https://doi.org/10.1002/joc.1354, 2006.
M., Peña-Gallardo, M., Beguería, S., El Kenawy, A. M., Luna, Lee, K. S., Sadeghipour, J., and Dracup, J. A.: An Approach for Fre-
Y., and Morata, A.: Generalized Pareto Parameters and maps of quency Analysis of Multiyear Drought Durations, Water Resour.
drought risk for Spain, Digital CSIC, http://digital.csic.es/handle/ Res., 22, 655–662, https://doi.org/10.1029/WR022i005p00655,
10261/178150, 2019b. 1986.
Dracup, J. A., Lee, K. S., and Paulson, E. G.: On the Liu, C.-L., Zhang, Q., Singh, V. P., and Cui, Y.: Copula-based
definition of droughts, Water Resour. Res., 16, 297–302, evaluations of drought variations in Guangdong, South China,
https://doi.org/10.1029/WR016i002p00297, 1980. Nat. Hazards, 59, 1533–1546, https://doi.org/10.1007/s11069-
Durrans, S. R. and Tomic, S.: Regionalization of low-flow fre- 011-9850-4, 2011.
quency estimates: An Alabama case study, J. Am. Water Resour. Liu, Y., Lu, M., Huo, X., Hao, Y., Gao, H., Liu, Y., Fan, Y., Cui,
Assoc., 32, 23–37, 1996. Y., and Metivier, F.: A Bayesian analysis of Generalized Pareto
Engeland, K., Hisdal, H., and Frigessi, A.: Practical extreme value Distribution of runoff minima, Hydrol. Process., 30, 424–432,
modelling of hydrological floods and droughts: A case study, https://doi.org/10.1002/hyp.10606, 2016.
Extremes, 7, 5–30, https://doi.org/10.1007/s10687-004-4727-5, Lorenzo-Lacruz, J., Moŕan-Tejeda, E., Vicente-Serrano, S. M., and
2005. Ĺopez-Moreno, J. I.: Streamflow droughts in the Iberian Penin-
Fernández, A.: El sistema español de seguros agrarios, El Sect. Ase- sula between 1945 and 2005: Spatial and temporal patterns, Hy-
gur. y los planes y fondos pensiones, 833, 87–99, 2006. drol. Earth Syst. Sci., 17, 119–134, https://doi.org/10.5194/hess-
Fleig, A. K., Tallaksen, L. M., Hisdal, H., and Demuth, S.: A 17-119-2013, 2013.
global evaluation of streamflow drought characteristics, Hydrol. Maia, R. and Vicente-Serrano, S. M.: Drought planning and man-
Earth Syst. Sci., 10, 535–552, https://doi.org/10.5194/hess-10- agement in the iberian peninsula, in: Drought and Water Crises,
535-2006, 2006. CRC Press, Boca Raton, 481–506, 2017.
Ganguli, P. and Reddy, M. J.: Risk Assessment of Droughts in Gu- Martin-Vide, J. and Gomez, L.: Regionalization of peninsular Spain
jarat Using Bivariate Copulas, Water Resour. Manage., 26, 3301– based on the length of dry spells, Int. J. Climatol., 19, 537–555,
3327, https://doi.org/10.1007/s11269-012-0073-6, 2012. 1999.
Garrick, D. E., Hall, J. W., Dobson, A., Damania, R., Grafton, McKee, T. B., Doesken, N. J., and Kleist, J.: The relationship of
R. Q., Hope, R., Hepburn, C., Bark, R., Boltz, F., De Ste- drought frequency and duration to time scales, in: Eighth Conf.
fano, L., O’Donnell, E., Matthews, N., and Money, A.: Valu- Appl. Climatol., 17–22 January 1993, Anaheim, USA, 179–184,
ing water for sustainable development, Science, 358, 1003–1005, 1993.
https://doi.org/10.1126/science.aao4942, 2017.
Nat. Hazards Earth Syst. Sci., 19, 611–628, 2019 www.nat-hazards-earth-syst-sci.net/19/611/2019/F. Domínguez-Castro et al.: High-spatial-resolution probability maps of drought magnitude across Spain 627
Mishra, A. K. and Singh, V. P.: Drought mod- low River Basin, China, Hydrol. Process., 28, 4694–4707,
eling – A review, J. Hydrol., 403, 157–175, https://doi.org/10.1002/hyp.9930, 2014.
https://doi.org/10.1016/j.jhydrol.2011.03.049, 2011. Sheffield, J., Wood, E. F., and Roderick, M. L.: Little change in
Mishra, A. K., Singh, V. P., and Desai, V. R.: Drought characteriza- global drought over the past 60 years, Nature, 491, 435–438,
tion: A probabilistic approach, Stoch. Environ. Res. Risk A., 23, https://doi.org/10.1038/nature11575, 2012.
41–55, https://doi.org/10.1007/s00477-007-0194-2, 2009. Stagge, J. H., Kingston, D. G., Tallaksen, L. M., and Hannah, D.
Moradi, H. R., Rajabi, M., and Faragzadeh, M.: Investigation of M.: Observed drought indices show increasing divergence across
meteorological drought characteristics in Fars province, Iran, Europe, Sci. Rep., 7, 14045, https://doi.org/10.1038/s41598-017-
Catena, 84, 35–46, https://doi.org/10.1016/j.catena.2010.08.016, 14283-2, 2017.
2011. Svoboda, M., LeComte, D., Hayes, M., Heim, R., Gleason, K.,
Nadarajah, S.: Generalized Pareto models with applica- Angel, J., Rippey, B., Tinker, R., Palecki, M., Stooksbury, D.,
tion to drought data, Environmetrics, 19, 395–408, Miskus, D., and Stephens, S.: The drought monitor, B. Am.
https://doi.org/10.1002/env.885, 2008. Meteorol. Soc., 83, 1181–1190, https://doi.org/10.1175/1520-
Nadarajah, S. and Kotz, S.: The generalized Pareto sum, Hydrol. 0477(2002)0832.3.CO;2, 2002.
Process., 22, 288–294, https://doi.org/10.1002/hyp.6602, 2008. Tošić, I. and Unkašević, M.: Analysis of wet and dry
Pasho, E., Camarero, J. J., and Vicente-Serrano, S. M.: Climatic periods in Serbia, Int. J. Climatol., 34, 1357–1368,
impacts and drought control of radial growth and seasonal wood https://doi.org/10.1002/joc.3757, 2014.
formation in Pinus halepensis, Trees – Struct. Funct., 26, 1875– Tosunoglu, F. and Can, I.: Application of copulas for regional bi-
1886, https://doi.org/10.1007/s00468-012-0756-x, 2012. variate frequency analysis of meteorological droughts in Turkey,
Pebesma, E. J.: Multivariable geostatistics in S: The gstat package, Nat. Hazards, 82, 1457–1477, https://doi.org/10.1007/s11069-
Comput. Geosci., 30, 683–691, 2004. 016-2253-9, 2016.
Peña-Gallardo, M., Vicente-Serrano, S. M., Domínguez-Castro, F., Trenberth, K. E., Dai, A., Van Der Schrier, G., Jones, P. D.,
Quiring, S., Svoboda, M., Beguería, S., and Hannaford, J.: Effec- Barichivich, J., Briffa, K. R., and Sheffield, J.: Global warm-
tiveness of drought indices in identifying impacts on major crops ing and changes in drought, Nat. Clim. Change, 4, 17–22,
across the USA, Clim. Res., 75, 221–240, 2018. https://doi.org/10.1038/nclimate2067, 2014.
Pérez, L. and Barreiro-Hurlé, J.: Assessing the socio-economic im- UNEP: Geo Year Book 2006: An overview of our changing envi-
pacts of drought in the Ebro River Basin – Análisis de los efectos ronment, Nairobi, 2006.
socioeconómicos de la sequía en la cuenca del Ebro, Spanish J. Vicente-Serrano, S. M.: Differences in spatial patterns of drought on
Agric. Res., 7, 269–280, 2009. different time scales: An analysis of the Iberian Peninsula, Wa-
Pérez-Sánchez, J. and Senent-Aparicio, J.: Analysis of meteoro- ter Resour. Manage., 20, 37–60, https://doi.org/10.1007/s11269-
logical droughts and dry spells in semiarid regions: a compar- 006-2974-8, 2006.
ative analysis of probability distribution functions in the Se- Vicente-Serrano, S. M.: Spatial and temporal evolution of pre-
gura Basin (SE Spain), Theor. Appl. Climatol., 133, 1061–1074, cipitation droughts in Spain in the last century, in: Adverse
https://doi.org/10.1007/s00704-017-2239-x, 2018. Weather in Spain, edited by: Martínez, F. and Rodríguez, C. C.-
Pham, H. X., Asaad, Y., and Melville, B.: Statistical prop- L., AMV Ediciones, Madrid, Spain, 283–296, 2013.
erties of partial duration series: Case study of North Vicente-Serrano, S. M. and Beguería-Portugués, S.: Estimating
Island, New Zealand, J. Hydrol. Eng., 19, 807–815, extreme dry-spell risk in the middle Ebro valley (northeast-
https://doi.org/10.1061/(ASCE)HE.1943-5584.0000841, 2014. ern Spain): A comparative analysis of partial duration series
Phillips, D. L., Dolph, J., and Marks, D.: A comparison of geosta- with a general Pareto distribution and annual maxima series
tistical procedures for spatial analysis of precipitation in moun- with a Gumbel distribution, Int. J. Climatol., 23, 1103–1118,
tainous terrain, Agric. Meteorol., 58, 119–141, 1992. https://doi.org/10.1002/joc.934, 2003.
Redmond, K. T.: The depiction of drought: A commentary, B. Am. Vicente-Serrano, S. M., Beguería, S., and López-Moreno, J. I.: A
Meteorol. Soc., 83, 1143–1147, https://doi.org/10.1175/1520- multiscalar drought index sensitive to global warming: The stan-
0477(2002)0832.3.CO;2, 2002. dardized precipitation evapotranspiration index, J. Climate, 23,
Rosbjerg, D., Madsen, H., and Rasmussen, P. F.: Prediction in 1696–1718, https://doi.org/10.1175/2009JCLI2909.1, 2010.
partialduration series with generalized Pareto-distributed ex- Vicente-Serrano, S. M., Azorin-Molina, C., Sanchez-
ceedances, Water Resour. Res., 28, 3001–3010, 1992. Lorenzo, A., Revuelto, J., López-Moreno, J. I., González-
Santos, J. F., Portela, M. M., and Pulido-Calvo, I.: Regional Fre- Hidalgo, J. C., Moran-Tejeda, E., and Espejo, F.: Ref-
quency Analysis of Droughts in Portugal, Water Resour. Man- erence evapotranspiration variability and trends in
age., 25, 3537–3558, https://doi.org/10.1007/s11269-011-9869- Spain, 1961–2011, Global Planet. Change, 121, 26–40,
z, 2011. https://doi.org/10.1016/j.gloplacha.2014.06.005, 2014.
Serra, C., Lana, X., Burgueño, A., and Martínez, M. D.: Partial du- Vicente-Serrano, S. M., Tomas-Burguera, M., Beguería, S.,
ration series distributions of the European dry spell lengths for Reig, F., Latorre, B., Peña-Gallardo, M., Luna, M. Y.,
the second half of the twentieth century, Theor. Appl. Climatol., Morata, A., and González-Hidalgo, J. C.: A High Reso-
123, 63–81, https://doi.org/10.1007/s00704-014-1337-2, 2016. lution Dataset of Drought Indices for Spain, Data, 2, 22,
She, D.-X., Xia, J., Zhang, D., Ye, A.-Z., and Sood, A.: https://doi.org/10.3390/data2030022, 2017.
Regional extreme-dry-spell frequency analysis using the Wang, Q. J.: The POT model described by the generalized Pareto
L-moments method in the middle reaches of the Yel- distribution with Poisson arrival rate, J. Hydrol., 129, 263–280,
https://doi.org/10.1016/0022-1694(91)90054-L, 1991.
www.nat-hazards-earth-syst-sci.net/19/611/2019/ Nat. Hazards Earth Syst. Sci., 19, 611–628, 2019You can also read