Changing the Slow Onset Mentality of Drought: A Case Study of Flash Drought in the United States and the Northern Plains - PreventionWeb
←
→
Page content transcription
If your browser does not render page correctly, please read the page content below
Changing the Slow Onset Mentality of Drought: A Case Study of Flash Drought in
the United States and the Northern Plains
Mark Svoboda

    Key Messages
      • Drought early warning and information systems must be flexible and
         receptive toward the integration of new indicators and impacts as they
         become available and validated
      • Systematic collection of impacts must be treated in the same light as that
         of other drought indicators such as precipitation, temperature, soil
         moisture, evapotranspiration, surface and ground water storage, etc. as a
         means of building a risk/vulnerability baseline and monitoring the change
         in this baseline in the context of a climate change
      • The need for better prediction and monitoring of flash droughts should be
         considered to be an opportunity in changing the slow-onset mentality of
         how droughts have been traditionally viewed and dealt with. These rapid
         onset/intensification droughts may provide an innovative pathway of
         advocating for proactive drought risk management for planners, decision
         and policy makers.
      • The idea that drought is only a slow onset disaster should not be the only
         doctrine
      • Enhancing or building drought early warning information systems
         (monitoring and Subseasonal-to-Seasonal (S2S) forecasting) accounting
         for rapid onset/intensification “flash” drought can provide us a better path
         toward resilience to future droughts.

Traditional thinking leads us to believe that droughts are only slow-onset hazards, which
take months or years to manifest themselves over space and time and across a multitude
of economic sectors. As such, the mentality in planning and responding to droughts often
lacks a sense of urgency. The new reality is that droughts can develop quite rapidly on
the order of several days or weeks. While these rapid onset/intensification “flash”
droughts are difficult to predict and monitor, they may also provide us with an opportunity
to change the slow onset paradigm going forward when it comes to how we approach
forecasting, monitoring and drought risk management, including mitigative policy,
response and planning measures. Ensuring that we systematically collect drought
impacts in the same way that we monitor other key environmental parameters is critical
in building a baseline aimed at better understanding our risks to drought and the impacts
that follow, thus helping us build resilience to drought in the future.
1. Flash Drought in the United States with a Focus on the Northern Plains

1|Page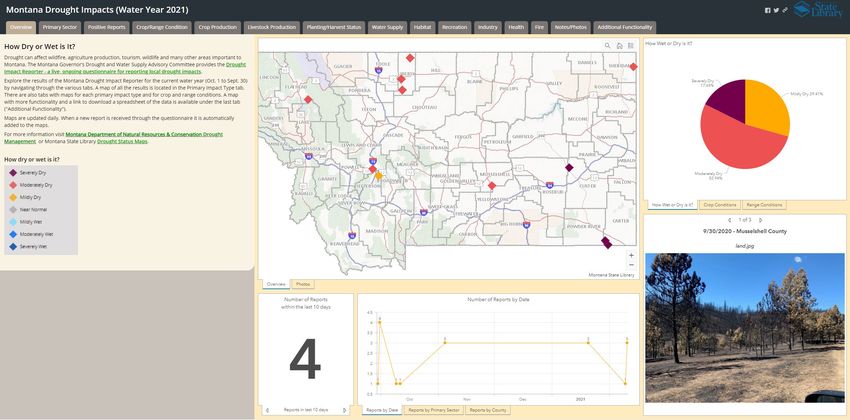
The major challenges faced in accurately forecasting and diligently monitoring drought is that of space and time. Droughts can span days to decades while potentially encompassing millions of hectares all the while cutting across any number of geo-political borders. No other hazard has such a vast spatial and temporal footprint to manage and respond to. Drought is a normal part of virtually all climates, which has become an even larger issue resulting in even greater importance given the enhanced risk of extreme events expected as the result of a warming climate (IPCC, 2012; USGCRP, 2018). Thus, it only makes sense that under conditions borne from a warming planet, the characteristics of drought and how we forecast and monitor them would be impacted as well. Drought early warning information systems must account for the inclusion of both monitoring (including impacts) and forecasting elements. These early warning systems should be constructed and viewed as a linked risk information (including people׳s perception of risk) and communication system that actively engages communities involved in preparedness (Pulwarty and Sivakumar, 2014). Their work found that context matters and there are indeed numerous drought early warning systems being implemented at different scales of governance. The American Meteorological Society’s Glossary of Meteorology defines “flash drought” as “An unusually rapid onset drought event characterized by a multiweek period of accelerated intensification that culminates in impacts to one or more sectors (agricultural, hydrological, etc.)” (AMS, 2020). Although there is no universal definition or indicator of flash drought, most of the work to date in this area focuses on rapid onset and/or intensification as the most telling characteristics of such type of drought (Otkin et al., 2018; Pendergrass et al., 2020). It should be noted that that there are others define flash drought in terms of duration (Mo and Lettenmaier, 2015, 2016; Wang and Yuan, 2018). The relationship to soil moisture levels, heat waves, vapor pressure deficits and evapotranspiration are all key factors that can help drive how a flash drought develops, evolves and decays. (Anderson et al., 2011; Otkin et al., 2014; Hobbins et al., 2016 and McEvoy et al., 2016). Given the fact that skill is presently low (Hoell et al., 2020) for predicting these flash droughts, even more emphasis should be put on the need for diligent monitoring of these parameters and conditions in order to detect onset of droughts as early as possible. Early research on the frequency of flash droughts in the U.S. is providing us with some general characteristics. As suspected, there is a relationship between these types of droughts and the growing season in particular and regional/seasonal factors are important. Timing of onset in relation to the phenological cycle is critical in terms of vegetation stress and potential impacts to yields or forage production. For the U.S. as a whole, relatively few flash drought events occurred over mountainous and arid regions. Using a method where flash droughts were categorized based on their rate of intensification, the most intense flash droughts occurred over the central Great Plains, Corn Belt, and western Great Lakes region (Christian et al., 2019a) 2|Page
Christian et al. (2019b) found that May and June had a higher frequency of flash drought
events in the western United States, while a climatological peak in flash drought
frequency was found in July and August for the eastern United States. For all climate
regions, flash drought intensity was found to increase throughout the beginning of the
growing season, then decrease in the latter portion of the growing season. Analysis of
preceding moisture conditions revealed that antecedent dry conditions increased flash
drought risk for all regions. They also found that differences exist in the seasonality of
flash drought risk across climate regions. It is worth noting that the results from Christian
et al. (2019b) showed that for the Northern Plains region, the percentage of flash droughts
that transitioned to longer term drought (6 months) varied between 35-60% depending on
the month with May being the peak at 60% according to their criteria.
Drought is no stranger to the United States (Figure 1) and the Northern Plains in particular
(Figure 2). The concept of flash drought wasn’t fully mainstreamed until during and after
the widespread and intense flash drought of 2012 across the central United States. The
drought of 2012 (Figure 3) ended up being the most severe and extensive drought since
the infamous Dust Bowl drought of the 1930s and was estimated to have a total impact
of $34.5 billion USD (NCEI, 2021). Moderate to exceptional drought (D1-D4 according to
the U.S. Drought Monitor) conditions affected over 65% of the continental U.S. at its peak.
Costly drought impacts occurred across the central agriculture states resulting in
widespread harvest failure for corn, sorghum and soybean crops, among others. The
associated summer heatwave also caused 123 direct deaths, but an estimate of the
excess mortality due to heat stress is still unknown according to NCEI.

Figure 1. Time series of percent of areal drought coverage according to the U.S. Drought
Monitor for the United States during the current period of record (2000-January 2021).

3|Page
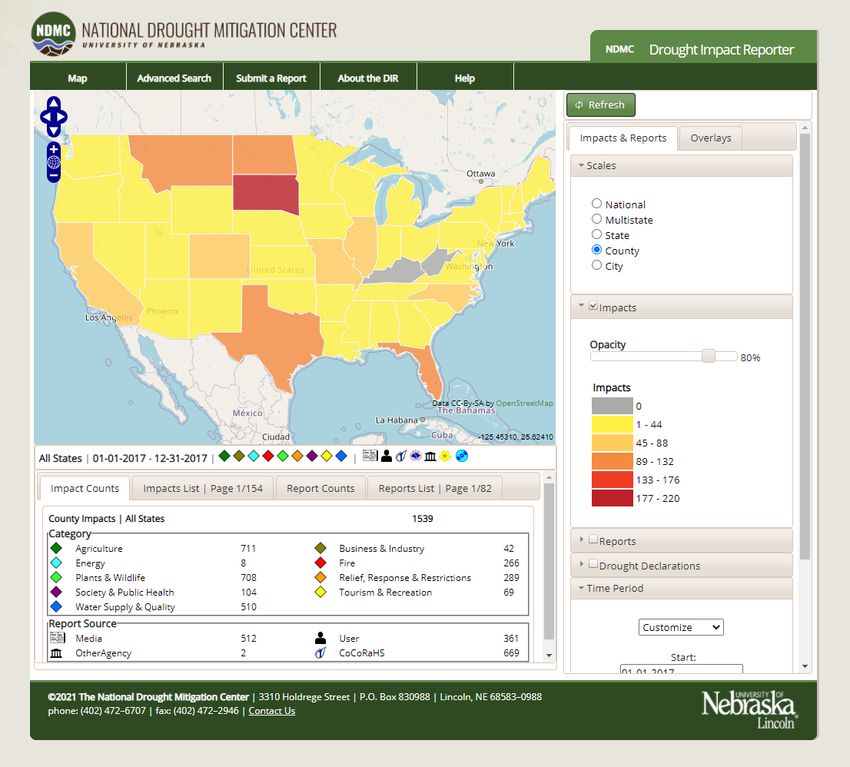
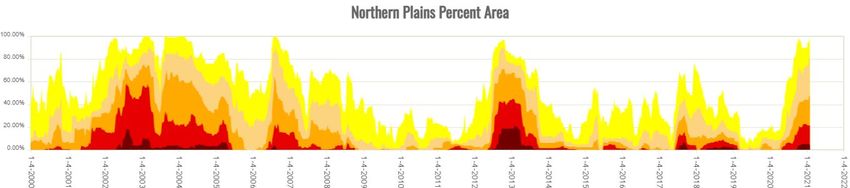
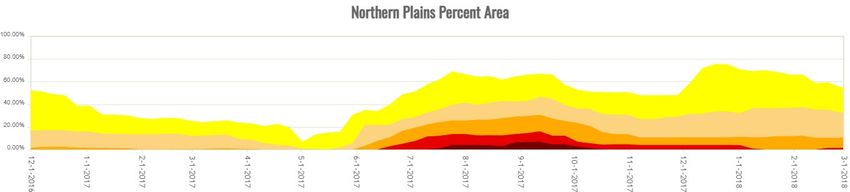
Figure 2. Time series of percent of areal drought coverage according to the U.S. Drought
Monitor for the Northern Plains region for the period of record (2000-January 2021).

Figure 3. The flash drought across the North Central United States in summer 2012 as
depicted by the USDM for July 31, 2012.
This case study focuses on a relatively new categorization of drought type typically
referred to as rapid onset/intensification, or “flash”, drought. The term was first coined
nearly 20 years ago (Svoboda et al., 2002) as a way of informing early warning through
the U.S. Drought Monitor (USDM). The USDM recognized the need to account for rapid
drought onset and intensification along with subsequent impacts associated with such
events, particularly in the agricultural (e.g., crops, range/pastureland and livestock)
sector. The makers of this product realized that impacts are a critical part of drought and
that these droughts may, or may not, linger on for months or years after the rapid
onset/intensification itself, which could potentially develop into any of the various types of
drought (e.g., agricultural, hydrological, ecological, socio-economic) and could eventually
impact several economic sectors, not just agriculture. Timing of onset is also a key factor
to consider as knowing how flash droughts develop and propagate can vary by region or
season (Christian et al., 2019b).
According to the USDM (https://droughtmonitor.unl.edu), the Northern Plains has been in
an active drought cycle over the past two decades (Figure 4). Figure 4 also illustrates
how no two droughts are the same in how they develop or persist, how severe they will
become, or in how much area they cover. The drought early in this period for the Northern
Plains shows a long-term drought that ramped up gradually over time and lasted a decade
from 2000-2009. Figure 4 shows a much more rapid intensification from showing no

4|Page
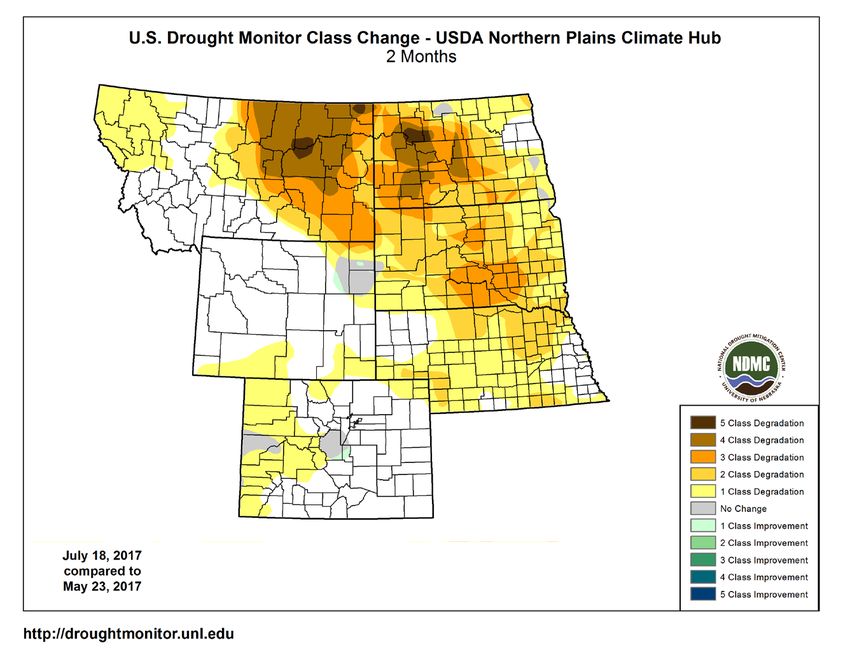
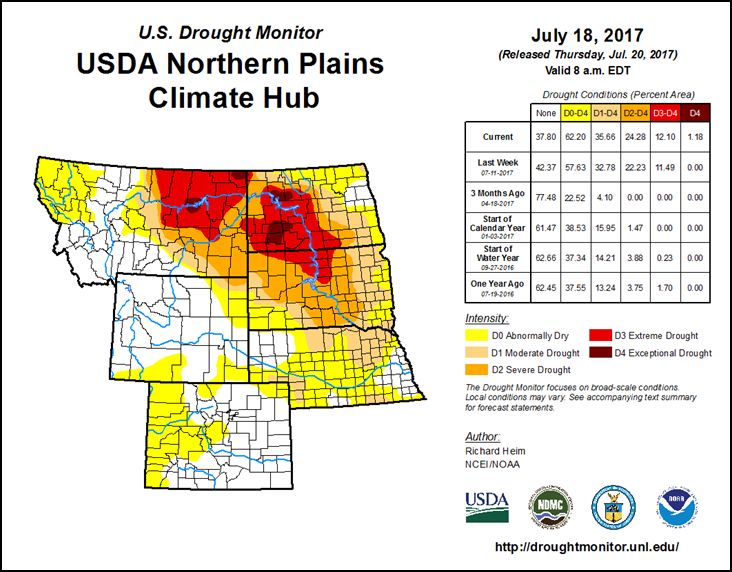
drought in this entire region as of mid-May 2017 and then ramping up to exceptional (D4)
drought in a matter of just 6-8 weeks.

Figure 4. Time series of 2017 percent of areal drought coverage according to the U.S.
Drought Monitor for the Northern Plains region.
In the United States, the most contemporary and iconic of such flash droughts occurred
within five years of each other in 2012 and 2017. In fact, both occurred within relative
geographic proximity to one another in the Midwest and Central Plains (2012) and in the
Northern Great Plains (2017). Although the primary impacts were centered on agriculture
(e.g., forage/rangeland and livestock production), other impacts were felt and are
described in more detail in Section 3. The Northern Great Plains flash drought led to a
rapid deterioration of rangeland conditions in this region in just a few short weeks as seen
in Figure 5, leading to severe forage loss and the culling of livestock herds. According to
the USDM, approximately 36% of the region centered over most of North Dakota, South
Dakota and eastern Montana, was in some form of drought (D1-D4). By late July, 12% of
this region was shown as being in extreme (D3) or exceptional (D4) drought after having
been at 0% as of late May. A change map for this eight-week period is shown in Figure
6. Over this two month period, vast areas of this region saw both a rapid deterioration and
rapid intensification in the form of a 4-5 class drop-off as depicted by the USDM.

5|Page
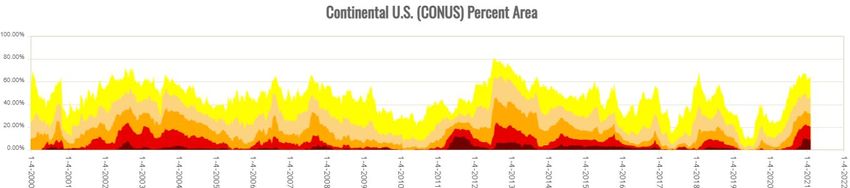
Figure 5. Extent and severity of the 2017 flash drought in the Northern Plains region
according to the USDM.

Figure 6. USDM 2-month change map for the period May 23 through July 18, 2017, which
depicts the large areas of deterioration across eastern Montana, western North Dakota
and central South Dakota. Large parts of the Northern Plains saw a 4-5 class deterioration
over this two month period.

6|Page
A National Integrated Drought Information System (NIDIS) supported assessment of the
2017 flash drought resulted in a report titled, The Causes, Predictability, and Historical
Context of the 2017 U.S. Northern Great Plains Drought (Hoell et al., 2019). The objective
of the assessment was to investigate the causes, predictability and historical context of
the 2017 Northern Plains drought. The primary outcomes from this report showed that the
failed growing season rains were the primary cause and they were not well forecasted.
The May-July precipitation across eastern Montana was the lowest on record (dating back
to 1895) and for the region covering the Dakotas and Montana, recorded rainfall came in
as the third lowest on record. This was coupled with near-record rate of soil moisture
depletion. In regards to the forecasting of this drought, below average May-July 2017
precipitation was not predicted in advance of the season. In fact, sequences of longer
than five day forecasts provided no indication that the seasonal evolution of precipitation
would be different from average. They also determined that climate model simulations
revealed that anthropogenic forcing made the occurrence of the observed 2017 drought
intensity up to 20% more likely. Finally, it should be stressed that although the drought in
this region developed very rapidly, it doesn’t compare to the spatial extent and longevity
of the multi-year Dust Bowl years experienced throughout the region.

2. Measuring and Assessing the Effects of the 2017 Northern Plains Flash Drought
According to the National Oceanic and Atmospheric Administration’s (NOAA) National
Centers for Environmental Information (NCEI), the 2017 Northern Plains flash drought
resulted in an economic impact of approximately $2.6 billion USD. (NCEI, 2021). At its
peak, the 2017 Northern Plains flash drought sparked wildfires, destroyed livestock, and
reduced agricultural production. Neither the drought’s swift onset nor its severity were
forecasted. In May 2017, the region was mostly drought-free, and at least average
summer precipitation was forecasted. By July 2017, North Dakota, South Dakota, eastern
Montana, and the Canadian prairies were experiencing severe to extreme drought,
resulting in fires that burned 4.8 million acres across both countries (Jencso et al., 2019).

As collected and described through the Drought Impact Reporter (DIR) and through the
National Drought Mitigation Center’s (NDMC) DroughtScape Impact Summaries for 2017,
dryness developed rapidly in the Dakotas and eastern Montana during May and resulted
in unusually high cattle sales as pastures and hay growth slowed, leading to a challenging
growing season of feeding livestock hay or culling herds and selling early. Auctions were
busy, moving as many as three to five times the usual number of livestock in June.
Governors of the Dakotas and Montana declared drought emergencies for all or parts of
their states. The U.S. Department of Agriculture gave authorization for emergency grazing
of Conservation Reserve Program acres in late June to help farmers and ranchers cope
with the drought. Drought also adversely affected the production of most crops in the
Dakotas, according to statistics released by the U.S. Department of Agriculture (NDMC,
2021).

2.1 Monitoring and Capturing Drought Impacts
In essence, impacts are the face of drought. They illuminate where our society and natural
systems are at risk, or vulnerable to droughts. The reality is that the collection of drought

7|Page
impacts is critical for both developing a baseline of conditions in the present and for better
understanding and estimating how our risk and vulnerability to impacts may change under
the context of a warming climate. To date, very little in the way of resources or priority
has been given to any systematic or standardized collection of drought impacts anywhere
around the globe. Efforts are ad hoc and leveraged at best. The collection of drought
impacts needs to be as high of a priority as that of collecting other traditional drought
monitoring indicators (e.g., precipitation, temperature, soil moisture, evapotranspiration).
Going forward, it is only logical then that we emphasize and insist on impact collection in
the same vein when developing or enhancing drought early warning information systems.
There are a few examples (and may be others not included here) of efforts to better collect
and monitor impacts. One of these is the U.S. Drought Impact Reporter (DIR). Established
in 2015, the Drought Impact Reporter (DIR) (https://droughtreporter.unl.edu) was the
world’s first on-line, comprehensive database and user interface dedicated to
operationally monitoring and archiving impacts of all types of drought. Updated daily,
drought impacts are moderated and categorized into eight areas, including agriculture,
water supply and quality, fire, tourism & recreation, business & industry, plants & wildlife,
society and public health and relief, response and restrictions. To date, the DIR database
houses nearly 28,000 impacts documenting the effects of drought across the entire
country. The impact data for the United States are archived and freely available and

8|Page
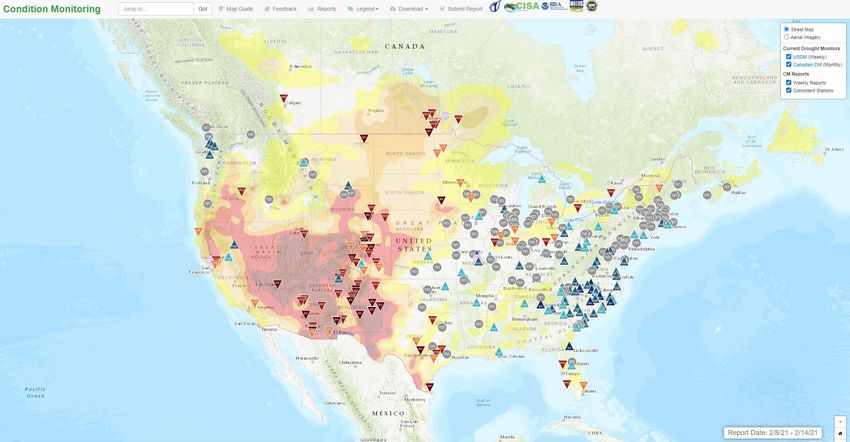
accessible    to    the    public   through     an    on-line    interface    (Figure    7).

Figure 7. The DIR interface, showing impacts collected during 2017 across the country.
Note the higher impact counts in the Northern Plains region marked by the darker colors
in Montana, North Dakota and South Dakota. The NDMC moderated and documented
over 1,500 impacts across the U.S. in 2017.

Recent changes in the way we aim to collect this impact data has led to more coordination
between the local, state, tribal and federal levels. The National Drought Mitigation Center,
the National Integrated Drought Information System (NIDIS) and the U.S. Department of
Agriculture’s Climate Hubs are working with states, tribes, university extension, producers
and others across the country to collect Condition Monitoring Observer Reports on
Drought                                   (CMOR                                    Drought)
(https://droughtimpacts.unl.edu/ConditionMonitoringObservations.aspx). Nearly 4,000
CMOR reports from individuals have been collected since the tool went live in 2018. The
flash drought of 2017 in the Northern Plains was a key motivating factor in launching the
CMOR tool in 2018. The primary goal of the tool is to provide a platform and voice for
people to reflect on what they are seeing at their locale in terms of being normal, wet or
dry. They also have the option to upload photos into the database through the user
interface.

9|Page
Yet another coordinated impact collection effort can be found in the Community
Collaborative Rain, Hail & Snow Network (CoCoRaHS), which is housed and maintained
at Colorado State University (https://cocorahs.org). CoCoRaHS is a grassroots volunteer
network of over 20,000 backyard weather observers of all ages and backgrounds working
together to measure and map precipitation (rain, hail and snow) in their local
communities. By using low-cost measurement tools, stressing training and education, and
utilizing an interactive Web-site, their objective is to provide the highest quality data for
natural resource, education and research applications. CoCoRaHS observers sign up to
measure and record precipitation, snow and hail every day. As a way of better
coordinating these collection efforts, drought condition monitoring reports (in cooperation
with the NDMC) was integrated into the CoCoRaHS data collection interface and this
national drought information stream is also fed into the national DIR database at the
NDMC. CoCoRaHS also provides drought condition reports by mapping and overlaying
them on the USDM (Figure 8).

Figure 8. Map of condition reports according to CoCoRaHS observers overlaid on the
U.S. Drought Monitor as accessed on February 14, 2021.

More recently, coordinated impact collection activities have been developed and lessons
learned shared between the states and national efforts such as the DIR and CoCoRaHS
as described above. For example, Montana, through its Department of Natural
Resources, has set up an interface (Figure 9) for their users to submit drought impacts.
Impacts           collected       from          this        state       level       tool
(https://montana.maps.arcgis.com/apps/MapSeries/index.html?appid=d3acc1a624d841
efbc7ed1a882d9dc6b) are then fed into the National DIR and CMOR databases housed
at the National Drought Mitigation Center at the University of Nebraska-Lincoln. At this
time, both the DIR and CMOR interfaces and databases contain impacts collected from
the rest of this region and for the rest of the United States. Lessons learned between

10 | P a g e
these platforms has led to a sharing of ideas and a more uniform drought reporting system
at all scales.

Figure 9. The Montana state drought impact reporter interface.
Drought impact collection efforts are also occurring outside of the United States. The
European Drought Impact Inventory (EDII) and European Drought Reference (EDR) are
housed            within          the         European            Drought       Centre
(https://www.geo.uio.no/edc/droughtdb/index.php). The EDII allows the user to search
reported drought impacts and submit new impact reports for Europe, while the EDR
summarizes historical droughts for Europe and provides a tool to visualize standardized
precipitation index (SPI) data for any date within the period 1958-2009.
The need for including drought impact monitoring is critical as part of a comprehensive
drought early warning and information system and for identifying risk and subsequent
mitigation strategies (Smith et al. 2020; Hayes et al. 2011; Wilhite et al. 2007). A
national/international drought impacts monitoring workshop was held in the United States
in order to bring in a diverse set of participants involved in local, regional and national
drought impact collection in an effort to learn from one another, build a community of
practice and discuss a strategy moving forward (Lackstrom et al., 2013). Several key
recommendations emerged from this workshop, including the need to:
    1. Evaluate existing drought impacts reporting programs to identify approaches and
       opportunities
    2. Establish and foster effective connections between drought impacts reporting and
       decision making
    3. Evaluate and develop new tools and methods to motivate reporting, facilitate the
       collection of impacts, and improve the communication of drought impacts
       information
    4. Investigate and pursue opportunities for mainstreaming

11 | P a g e
5. Investigate and pursue opportunities to “professionalize” or “institutionalize”
drought impacts reporting
The impacts of the recent 2012 and 2017 flash droughts has led to a deeper
understanding of the need for research and services aimed at the community of practice
in order to assess needs and ultimately develop usable tools, forecasts, products and
information that can be used to better inform decision and policy makers at all levels.
3. Drought Risk Management Activities
During the 2017 Northern Plain flash drought, coordination of current assessments by a
variety of local, state, tribal and federal partners came frequently in the form of bi-weekly
briefings organized and coordinated by NOAA’s Regional Climate Service Directors
(RCSD) office. These well attended regional webinars focused on the current state of
drought severity and extent, impacts and future outlooks were carried out and conducted
by all partners across the region using a rotation of regional experts as presenters.
Hearing updates from known and trusted presenters led to large numbers of participants
(regularly well over 100 in attendance), which led to engaged information exchange,
impacts, lessons learned and question and answer sessions throughout the drought’s
duration.
Other outcomes resulted in how we coordinated monitoring efforts along with
improvements in tools and services provided to a variety of users in the region. In order
to better track the impacts of droughts on commodities in near real-time, the U.S.
Department of Agriculture’s (USDA) Office of the Chief Economist (OCE) supported the
creation and launch of a new on-line tool and web services titled U.S. Agricultural
Commodities in Drought (https://agindrought.unl.edu). Maps highlighting the effects of
drought on six agricultural commodities across the continental U.S. were developed and
supported by the USDA and are generated, housed and archived at the National Drought
Mitigation Center at the University of Nebraska-Lincoln. The maps are a collaborative
effort between the USDA OCE and the NDMC. The maps were developed and are
operationally disseminated between the NDMC and USDA World Agriculture Outlook
Board and are based on the weekly U.S. Drought Monitor. The USDM overlays show the
locations and percentages of drought-affected areas that produce crops or livestock. In
addition to the maps, the website offers data tables, time series graphs and animations.
The maps show drought’s effects on cattle, hogs and pigs, sheep and lambs, hay, and
alfalfa. In the near future, using Ag census data, the partners will make available six field
crop maps, one each for corn, cotton, soybeans, winter wheat, spring wheat and durum
wheat.
As the state-of-the-science drought monitoring indicator in the United States, the USDM
(Svoboda et al., 2002) has continued to evolve in response to these recent flash droughts
and the needs of the users. As a direct result of the widespread 2012 flash drought in the
central U.S., several new satellite based products (e.g., Evaporative Stress Index,
Evaporative Demand Drought Index, QuickDRI, next generation NLDAS soil moisture
models) have been researched and developed thanks to increased emphasis and funding
12 | P a g eby a variety of research programs within NASA, NOAA and USDA focused on funding products that can help us better monitor and detect emerging droughts, particularly flash droughts. Whereas the 2012 drought saw around a 6-8 week lag in flash drought detection, the 2017 drought and the new tools above allowed the USDM to respond and depict this flash drought on the order of a 2 week lag due to the new tools developed in the past 5-10 years. Lessons learned during and after the 2012 flash drought led to the USDM being better prepared and equipped to monitor and assess the 2017 Northern Plains flash drought as compared to what limited guidance was available during the 2012 flash drought. A cycle forms where, as drought early warning information systems become better and more accurate, the need for better and more usable risk management information increases. In turn, as planning and mitigation strategies and measures are implemented, the need for an improved drought early warning and information system increases. 4.1 Policy Actions A recent series of policy activities have been implemented at a variety of levels. All three states (Montana, North Dakota and South Dakota) that bore the brunt of impacts in this case study drought have drought plans in place. Coordination between the respective state drought monitoring task groups occurs with the authors of the weekly U.S. Drought Monitor map in working to collect on-the-ground impact information that could be used to verify and/or validate various models and drought indicators, including the USDM. Although the intent of this case study was not meant to evaluate the state drought plans, it should be noted that Hoell et al. (2020) found that all three state drought plans worked as they were intended to during the 2017 drought. Most efforts, however, were emergency response related rather than mitigative in nature. They also recognized a need for better understanding of triggers is needed as related to decision making and for those tied to drought plans. Poor crops and forage growth in the Northern Plains meant that hay and forage for livestock was in short supply, leaving ranchers anxious to find hay to purchase. Responding to the need, North Dakota's Agriculture Department, North Dakota State University, and Ag Community Relief, based in Michigan, worked together to get hay to North Dakota ranchers via a lottery system. Ranchers in South Dakota and Montana were later invited to participate in the lottery. While some livestock producers were fortunate enough to win hay in the lottery, many producers had to decide whether to sell some of their herd or purchase hay at exorbitant prices for winter feeding. To take some of the sting out of the cost of hauling hay, the North Dakota Emergency Commission set up a $1.5 million USD fund for a hay transportation program for livestock producers that was administered by the state Department of Agriculture. Under the program, eligible producers could be reimbursed for a portion of hay transportation costs. (NDMC, 2021) At the national level, the United States Congress passed two recent bills into law that will help address the need for better forecasting and monitoring of flash drought. The first bill, 13 | P a g e
was passed in 2017 and is known as the Weather Research and Forecasting Innovation
Act (Public Law No: 115-25, 2017). This bill directs the National Weather Service to collect
and utilize information to make reliable and timely foundational forecasts of sub-seasonal
and seasonal (S2S) temperature and precipitation. Sub-seasonal forecasting is defined
as falling between two weeks and three months and seasonal forecasting is between
three months and two years. This focus on S2S research and enhancement has been
deemed a major priority in the years since by a variety of research programs as
understanding the interaction between the atmospheric and boundary layers is critical to
better understanding and monitoring of rapid depletion of soils via evapotranspiration,
particularly when accompanied by heat waves. Among other issues centered on better
early warning for tornadoes, hurricanes and storm surge, the issue of rapid onset
droughts was indirectly addressed by directing efforts to assess gaps in our observation
systems, which is particularly relevant in regards to our national soil moisture capacity.
Among other potential applications, better soil moisture observations will lead to validation
of remotely sensed products and models, better models and better S2S forecasting.

In 2020, NOAA dedicated specific focus on the subseasonal-to-seasonal (S2S) effort via
the development of the SubX project (NOAA, 2020). The Subseasonal Experiment
(SubX) is a Climate Test Bed project focused on improving subseasonal predictions and
providing a research dataset for the community to explore subseasonal predictability in
leading modeling systems. It is supported through a partnership including NOAA
Research’s Modeling, Analysis, Predictions, and Projections Program as well as the
National Weather Service’s Office of Science and Technology Integration, the Office of
Naval Research, and NASA. Multiple global models from NOAA, NASA, Environment
Canada, the Navy, and the National Center for Atmospheric Research are producing 17
years of ensemble retrospective forecasts initialized weekly. The project will test the skill
of individual prediction systems as well as multi-model combinations, and the data is to
be made available to both the research and operational communities.

Traditionally, the U.S. Farm Bills have many programs aimed at responding to drought.
The USDM has been used as a decision making and policy trigger since the 2008 Farm
Bill, known as the Food, Conservation and Energy Act, to help USDA monitor, plan for
and respond to drought. In 2014, the Farm Bill (Public Law 113-79) streamlined how the
Office of the Secretary of Agriculture responded to drought through the authorization of
“Fast Track Secretarial Designations” as a means of timely response to direct disaster
assistance relief measures to those who are eligible. The primary program tied to this law
is the Livestock Forage Disaster Program (LFP), which is managed by the Farm Service
Agency (FSA). LFP response payments are tied to certain drought severity and duration
thresholds depicted by the USDM (https://www.fsa.usda.gov/Assets/USDA-FSA-
Public/usdafiles/FactSheets/livestock_forage_program_lfp-fact_sheet.pdf). As part of
this legislation, resources are directed toward the Office of the Chief Economist in order
to enhance the U.S. Drought Monitor (in terms of onset, accuracy and services) and to
work with USDA’s Climate Hubs to determine drought needs for field offices and their
constituents on the ground. In 2018, the most recent version of the Farm Bill (Public Law
115-334), known as the Agriculture Improvement Act of 2018, contained additional

14 | P a g e
measures to respond to drought, such as LFP. In 2020, authority was given to USDA FSA
to use the USDM as a trigger for the Conservation Reserve Program, which is focused
on keeping potentially highly erodible lands fallow in exchange for payments over a given
contract period of several years. During drought, release of acreage is allowed for
emergency haying and grazing for certain periods as a measure of providing some relief
in terms of making additional forage available that would otherwise be untouchable during
the                contract                (https://www.fsa.usda.gov/Assets/USDA-FSA-
Public/usdafiles/FactSheets/crp_haying_grazing_factsheet.pdf).

4.2 A Way Forward

As part of NIDIS’s regional Drought Early Warning System activities, a report titled, Flash
Drought: Lessons Learned from the 2017 Drought Across the U.S. Northern Plains and
Canadian Prairies (Jencso et al., 2019), investigated the region’s 2017 flash drought in
order to document the effects of this drought, understand the timeliness and access to
early warning information as well as documenting what coordination and management
activities were undertaken during the drought. The report involved collaboration between
several entities (including Canada), which encompassed several experts having
academic, state, tribal and federal backgrounds. One of the key points they discovered
was a strong consensus enforcing the need for maintaining strong relationships and
networks that share information across all jurisdictions (local to federal) before, during
and after drought. Some common themes emerged from their work including the
identification of needs focused on:

    •   Investing in new and existing monitoring and observation networks, which would
        support the development of better indicators to provide early warning and allow
        decision-makers to better assess their drought risk and determine what actions to
        implement.
    •   Improving the understanding of the relevant processes that inform forecast models
        in the region, which could improve seasonal forecasts to enhance drought
        preparedness.
    •   Improving drought mitigation and response plans to consider trade-offs and actions
        that benefit both the human and ecosystem health and services, and put plans in
        place before drought happens.

The recent flash droughts of 2012 and 2017, coupled with the directives and programs
laid out in P.L. 115-25 above, also helped motivate the organization of a 2018 workshop
(When the Rain Stops: Drought on Subseasonal and Longer Timescales) organized by
the Aspen Global Change Institute (https://www.agci.org/event/18s4) and several
partners focused on S2S. One of the key issues discussed during this workshop focused
on flash drought and the forecasting needs centered on these rapid onset types of
droughts. This international workshop brought in over two dozen experts from over a half
dozen countries and led to recommendations focused on key areas where progress could
be made to better understand flash droughts. These recommendations include improved

15 | P a g e
understanding of events in the recent and more distant past and their impacts; establishing predictability and improving prediction of flash-drought events; applying these predictions to improve early warning systems for impending events as well as responding to events as they unfold; and understanding how flash drought will respond to climate variability and change. (Pendergrass et al., 2020). In December 2020, NIDIS coordinated and held a virtual workshop (https://www.drought.gov/news/what-flash-drought-what-can-we-do-about-it) dedicated entirely to the flash drought topic with an aim toward: 1) develop a better understanding of how to define flash drought; 2) discuss how to focus near-term as well as future research and tools to better meet user needs; 3) develop a list of research needs in monitoring, prediction and planning response to improve early warning; and 4) agree upon next steps to help NIDIS and other partners support future research and coordination activities (NIDIS, 2020). Additionally, near-term next steps taken away from this workshop were: a) a comprehensive workshop report will be published in 2021; b) developing a more concrete characterization of flash drought as a means of better guiding future research and tool development; and c) additional outreach forums on flash drought will be conducted to incorporate end user community perspectives. A continued focus on such multi-entity collaborative efforts aimed at all relevant scales will be critical in developing, enhancing and implementing the next generation of drought early warning information systems aimed at integrating monitoring and forecasting of flash droughts with pro-active drought risk management policy and mitigation measures. The challenges of predicting and monitoring flash droughts illustrate both the gaps and potential for how we can better detect, monitor and respond to this type of drought. The flash droughts of 2012 and 2017 have led to many new tools and policy actions aimed at improving how we monitor, assess, forecast and respond to these rapid onset extreme events. Response and services provided during recent flash droughts have also improved through better coordinated and enhanced programs as a result of efforts such as the National Drought Resiliency Partnership (consisting of approximately two dozen federal partners), the National Integrated Drought Information System (NIDIS) and their regional drought early warning systems, NOAA’s Regional Integrated Sciences and Assessments program, the USDA’s Office of the Chief Economist and regional Climate Hubs. In addition, state agency and state and regional climate offices and other partners such as the National Drought Mitigation Center at the University of Nebraska-Lincoln are working together to better tackle this emerging new breed of drought. 16 | P a g e
References:
American Meteorological Society, 2020. Glossary of Meteorology:
https://glossary.ametsoc.org/wiki/Flash_drought

Anderson, M. C., C. Hain, B. Wardlow, A. Pimstein, J. R. Mecikalski, and W. P. Kustas,
   2011. Evaluation of
Drought Indices Based on Thermal Remote Sensing of Evapotranspiration over the
   Continental United
States. J. Clim., 24, 2025–2044, https://doi.org/10.1175/2010JCLI3812.1.

Christian, J. I., J. B. Basara, J. A. Otkin, E. D. Hunt, R. A. Wakefield, P. X. Flanagan, and
   X. Xiao, 2019a: A
Methodology for Flash Drought Identification: Application of Flash Drought Frequency
   across the United

17 | P a g e
States. J. Hydrometeorol., 20, 833–846, https://doi.org/10.1175/JHM-D-18-0198.1.

Christian, J. I., J. B. Basara, J. A. Otkin, and E. D. Hunt, 2019b: Regional characteristics
   of flash droughts
across     the       United    States.     Environ.    Res.     Commun.,     1,    125004,
   https://doi.org/10.1088/25157620/ab50ca.

Hayes, M., M. Svoboda, N. Wall, and M. Widhalm, 2011. The Lincoln Declaration on
   Drought Indices:
Universal Meteorological Drought Index Recommended. Bulletin of the American
   Meteorological Society
92 (4):485-488.

Hobbins, M. T., A. Wood, D. J. McEvoy, J. L. Huntington, C. Morton, M. Anderson, and
   C. Hain, 2016: The
evaporative demand drought index. Part I: Linking drought evolution to variations in
   evaporative
demand. J. Hydrometeorol., 17, 1745–1761, https://doi.org/10.1175/JHM-D-15-0121.1.

Hoell, A., Parker, B., Downey, M., Umphlett, N., Jencso, K., Akyuz, F. A., Peck, D.,
    Hadwen, T., Fuchs, B.,
Kluck, D., Edwards, L., Perlwitz, J., Eischeid, J., Deheza, V., Pulwarty, R., & Bevington,
    K., 2020. Lessons
Learned from the 2017 Flash Drought across the U.S. Northern Great Plains and
    Canadian
Prairies, Bulletin of the American Meteorological Society, 101(12), E2171-E2185.
    Retrieved from
https://journals.ametsoc.org/view/journals/bams/101/12/BAMS-D-19-0272.1.xml
https://doi.org/10.1175/BAMS-D-19-0272.1

Hoell, A., Perlwitz, J. and Eischeid, J., 2019. The Causes, Predictability, and Historical
    Context of the
2017 U.S. Northern Great Plains Drought. National Oceanic and Atmospheric
    Administration and
Atmospheric Research Earth System Research Laboratory and National Integrated
    Drought Information
System.
https://www.drought.gov/documents/causes-predictability-and-historical-context-2017-
    us-northern-great-plains-drought

IPCC, 2012. Summary for Policymakers. In: Managing the Risks of Extreme Events and
   Disasters to
Advance Climate Change Adaptation [Field, C.B., V. Barros, T.F. Stocker, D. Qin, D.J.
   Dokken, K.L. Ebi,
M.D. Mastrandrea, K.J. Mach, G.-K. Plattner, S.K. Allen, M. Tignor, and P.M. Midgley
   (eds.)]. A Special

18 | P a g e
Report of Working Groups I and II of the Intergovernmental Panel on Climate Change.
Cambridge
University Press, Cambridge, UK, and New York, NY, USA, pp. 1-19.
Jencso, K., B. Parker, M. Downey, T. Hadwen, A. Howell, J. Rattling Leaf, L. Edwards,
and A. Akyuz, D.
Kluck, D. Peck, M. Rath, M. Syner, N. Umphlett, H. Wilmer, V. Barnes, D. Clabo, B. Fuchs,
M. He, S.
Johnson, J. Kimball, D. Longknife, D. Martin, N. Nickerson, J. Sage and T. Fransen, 2019.
Flash Drought:
Lessons Learned from the 2017 Drought Across the U.S. Northern Plains and Canadian
Prairies. NOAA
National Integrated Drought Information System.
https://www.drought.gov/drought/sites/drought.gov.drought/files/NIDIS_LL_FlashDrough
t_2017_low-res_Final_6.6.2019.pdf
Lackstrom, K., Brennan, A., Ferguson, D., Crimmins, M., Darby L., Dow, K., Ingram, K.,
Meadow,
A., Reges, Henry; Shafer, M., and Smith, K.H., 2013. "The Missing Piece: Drought
Impacts Monitoring. Carolinas Integrated Sciences & Assessments Program and the
Climate Assessment for the Southwest Workshop Report, 23pp.,
https://www.drought.gov/drought/sites/drought.gov.drought/files/media/resources/works
hops/20130305_Drought_Impacts_Monitoring_Tuscon_AZ/Drough_Impacts_Report_Ju
ne2013_final.pdf.
McEvoy, D. J., J. L. Huntington, M. T. Hobbins, A. Wood, C. Morton, M. Anderson, and
C. Hain, 2016: The evaporative demand drought index. Part II: CONUS-wide assessment
against common drought indicators. J. Hydrometeorol., 17, 1763–1779,
https://doi.org/10.1175/JHM-D-15-0122.1.
Mo, K. C., and D. P. Lettenmaier, 2015. Heat wave flash droughts in decline. Geophys.
Res. Lett., 42, 2823–2829, https://doi.org/10.1002/2015GL064018.
Mo, K. C., and D. P. Lettenmaier, 2016. Precipitation deficit flash droughts over the United
States. J. Hydrometeor., 17, 1169–1184, https://doi.org/10.1175/JHM-D-15-0158.1
NDMC, 2021. National Drought Mitigation Center, DroughtScape, Winter 2018. National
Drought Mitigation Center,
https://drought.unl.edu/archive/Documents/NDMC/DroughtScape/DS2018winter.pdf
National Centers for Environmental Information (NCEI), 2021. U.S. Billion-Dollar Weather
and Climate Disasters. NOAA. https://www.ncdc.noaa.gov/billions/, DOI: 10.25921/stkw-
7w73
National Integrated Drought Information System (NIDIS), 2021. https://drought.gov
19 | P a g eNOAA, 2020. National Oceanic and Atmospheric Administration, https://cpo.noaa.gov/Meet-the-Divisions/Earth-System-Science-and- Modeling/MAPP/Research-to-Operations-and-Applications/Subseasonal-Experiment Otkin, J. A., Svoboda, M., Hunt, E. D., Ford, T. W., Anderson, M. C., Hain, C., Basara, J. B., 2018. Flash Droughts: A Review and Assessment of the Challenges Imposed by Rapid-Onset Droughts in the United States. Bulletin of the American Meteorological Society (5th ed., vol. 99, pp. 911-919). https://journals.ametsoc.org/doi/10.1175/BAMS-D-17-0149.1 Otkin, J. A., M. C. Anderson, C. Hain, and M. Svoboda, 2014. Examining the relationship between drought development and rapid changes in the Evaporative Stress Index. J. Hydrometeor., 15(3), 938-956. DOI: 10.1175/JHM-D-13-0110.1 Pendergrass, A.G., Meehl, G.A., Pulwarty, R., Hobbins, M, Hoell, A., AghaKouchak, A., Bonfils, C.J.W., Ailie J. E. Gallant, A. J. E., Hoerling, M., Hoffmann, D., Kaatz, L., Lehner, F., Llewellyn, D., Mote, P., Neale, R.B., Overpeck, J.T., Sheffield, A., Stahl, K., Svoboda, M., Wheeler, M.C., Wood, A.W., Woodhouse, C.A., 2020. Flash droughts present a new challenge for subseasonal- to-seasonal prediction. Nat. Clim. Chang. 10, 191–199 (2020). https://doi.org/10.1038/s41558-020-0709-0 Public Law 115-334, 2018. 2018 Farm Bill/Agriculture Improvement Act of 2018. 115th Congress, U.S. https://www.congress.gov/115/plaws/publ334/PLAW-115publ334.pdf Public Law 115-25, 2017. Weather Research and Forecasting Improvement. 115th Congress, U.S. https://www.congress.gov/115/plaws/publ25/PLAW-115publ25.pdf Public Law 113-79, 2014. Agricultural Act of 2014. 113th Congress, U.S. https://www.congress.gov/113/plaws/publ79/PLAW-113publ79.pdf Pulwarty, R.S. and Sivakumar, M.V.K., 2014. Information systems in a changing climate: Early warnings and drought risk management, Weather and Climate Extremes, Volume 3, 14-21, ISSN 2212-0947, https://doi.org/10.1016/j.wace.2014.03.005. Smith, K., Burbach, M.E., Hayes, M.J., Guinan, P.E., Tyre, A.J., Fuchs, B., Haigh, T. and Svoboda, M.. 2020. Whose Ground Truth Is It? Harvesting Lessons from Missouri’s 2018 Bumper Crop of Drought Observations. Weather, Climate, and Society. https://doi.org/10.1175/WCAS-D-19-0140.1 20 | P a g e
Svoboda, M., D. LeComte, M. Hayes, R. Heim, K. Gleason, J. Angel, B. Rippey, R. Tinker,
M. Palecki, D. Stooksbury, D. Miskus, and S. Stephens, 2002. The Drought Monitor.
Bulletin of the American Meteorological Society, 83(8):1181-1190.

USGCRP, 2018. Impacts, Risks, and Adaptation in the United States: Fourth National
Climate Assessment, Volume II [Reidmiller, D.R., C.W. Avery, D.R. Easterling, K.E.
Kunkel, K.L.M. Lewis, T.K. Maycock, and B.C. Stewart (eds.)]. U.S. Global Change
Research Program, Washington, DC, USA, 1515 pp. doi: 10.7930/NCA4.2018.

Wang, L., and X. Yuan, 2018. Two Types of Flash Drought and Their Connections with
Seasonal Drought. Adv. Atmos. Sci., 35, 1478–1490, https://doi.org/10.1007/s00376-
018-8047-0.

Wilhite, D. A., M. D. Svoboda, and M. J. Hayes, 2007. Understanding the complex impacts
of drought: A key to enhancing drought mitigation and preparedness. Water Resources
Management 21 (5):763-774

21 | P a g e
You can also read


