A Multimedia Web GIS Portal for Promotion of Tourism in Kenya
←
→
Page content transcription
If your browser does not render page correctly, please read the page content below
Journal of Geographic Information System, 2021, 13, 19-35
                                                                                                 https://www.scirp.org/journal/jgis
                                                                                                           ISSN Online: 2151-1969
                                                                                                             ISSN Print: 2151-1950

A Multimedia Web GIS Portal for Promotion of
Tourism in Kenya

Charles M. Muriuki, Benson Kenduiywo

Department of Geomatic Engineering and Geospatial Information System (GEGIS), Jomo Kenyatta University of Agriculture and
Technology (JKUAT), Nairobi, Kenya

How to cite this paper: Muriuki, C.M. and       Abstract
Kenduiywo, B. (2021) A Multimedia Web
GIS Portal for Promotion of Tourism in          Tourism is a major foreign exchange earner in Kenya contributing to 10% of
Kenya. Journal of Geographic Information        the gross domestic product (GDP). Whereas Kenyan government strives to
System, 13, 19-35.
                                                boost its GDP through improved arrivals, lack of effective tourism marketing
https://doi.org/10.4236/jgis.2021.131002
                                                strategies hinders growth in tourist arrivals in Kenya. To advertise and mar-
Received: December 3, 2020                      ket the untold wealth of tourist destinations, the government utilizes cam-
Accepted: February 1, 2021                      paigns through print and electronic media, which are expensive and limited
Published: February 4, 2021
                                                in updating. This study addresses the gap by designing a web Geographic In-
Copyright © 2021 by author(s) and               formation System (GIS) portal for marketing and promotion of tourism. To
Scientific Research Publishing Inc.             realize this a multimedia GIS database was created using PostgreSQL/PostGIS
This work is licensed under the Creative
                                                software to store spatial and multimedia tourism data, while itinerary plan-
Commons Attribution International
License (CC BY 4.0).                            ning tools were designed using Dijkstra algorithm and Travelling Salesman
http://creativecommons.org/licenses/by/4.0/     Problem (TSP) approach. The result was a web GIS portal interface contain-
               Open Access                      ing tourist information enhanced with text and/or video/audio descriptions.
                                                Facebook advertisement was used to popularize the tourism products availa-
                                                ble in Kenya through visitor engagements as well as directing traffic to the
                                                portal fast and inexpensively.

                                                Keywords
                                                Dijkstra, Travelling Salesman Problem Approach, Trip Planning, GIS in
                                                Travel, Optimal Path

                                              1. Introduction
                                              Tourism is a major foreign income generator and its contribution to global
                                              economy is remarkable as it plays a major role in enhancing a country’s gross
                                              domestic product (GDP) [1]. It is a dynamic and valuable sector of economy
                                              that is gainful if natural, cultural and historical wealth is well managed [2].

DOI: 10.4236/jgis.2021.131002       Feb. 4, 2021                  19                     Journal of Geographic Information System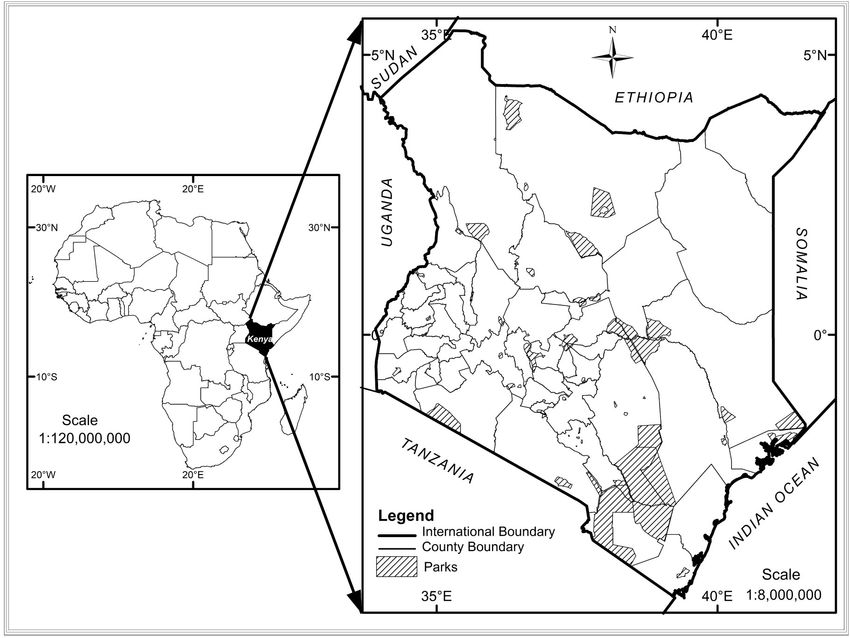
C. M. Muriuki, B. Kenduiywo

                                Global tourism supported 319 million jobs equivalent to 10% of total global em-
                                ployment in 2018 [3]. However, African region is yet to reach full potential be-
                                cause of the inability to progressively attract local and international tourists.
                                This is caused by the failure to adapt and innovate the tourism industry in line
                                with global trends and the changing world leading to slow growth in tourist des-
                                tinations [4]. Kenya’s vision 2030 identifies tourism as the leading sector in eco-
                                nomic pillar and aims to position the country as one destination that offers high
                                end and diverse visitor package [5]. In 2017, Kenya earned approximately Ksh
                                157 billion in receipts from approximately 2 million arrivals; this was Ksh 43 bil-
                                lion short of midterm II (2013-2017) projection which anticipated a target of 200
                                billion in receipts from 3 million tourist arrivals [6] [7]. Kenya therefore needs
                                to employ effective methods of tourism marketing in order to realize this goal
                                and become a premier tourist destination in the region.
                                   Tourist facilities are geographically distributed in the real world, on the other
                                hand Geographical Information System (GIS) is used to capture their location
                                and visualize this information on a web GIS platform [8]. According to Abdul-
                                hamid & Usman (2014) tourists need extensive information about their intended
                                destination [9]. In addition, tourists require good guidance and navigation
                                around their destination of choice [10]. In this respect, GIS has the capability to
                                store spatial and attribute components of attraction sites as well as visualize
                                them on the internet. With its strength in spatial queries, GIS supports decision
                                making processes and contributes immensely to various applications like infor-
                                mation management where ordinary maps are converted into smart maps [11].
                                   Galelekile (2020) describes destination marketing as a way of communicating
                                destination’s value proposition to give reason why people should visit your at-
                                traction [12]. In support of this, studies have shown that prior information on a
                                destination helps to promote tourism by way of influencing tourist’s decision
                                making [13]. Moreover, over 80% of users search for information on products
                                and services prior to making a purchase, travel being an example [14]. Kaylo, Ju-
                                liane Katuse (2013) noted that before travel decision is made, a mental image of
                                the destination is formed [15]. However, a research by M. Ndivo & N. Waudo
                                (2012) to investigate the level of attractiveness for Kenya’s tourist destinations
                                revealed that out of 47 destinations, only 46.8% of these destinations were
                                known and considered as possible holiday destination [16]. The authors contin-
                                ue to argue that despite Kenya’s attractions spread throughout the country,
                                tourism is mainly concentrated in coastal beaches and a few National Parks and
                                Reserves. This was attributed to limited information about tourist activities and
                                lack of sufficient travel information in the country [16].
                                   Kenya Tourist Board (KTB) is the body mandated by government to develop,
                                implement and coordinate national tourism marketing [17]. In its endeavor to
                                market Kenya’s tourism globally, KTB depends heavily on established foreign
                                based tourist offices in various countries in Europe, Asia and the USA to achieve
                                global visibility [18]. Other methods employed to capture local market include
                                electronic (i.e. radio and TV) and print media (i.e. newspapers and magazines)

DOI: 10.4236/jgis.2021.131002                        20                     Journal of Geographic Information System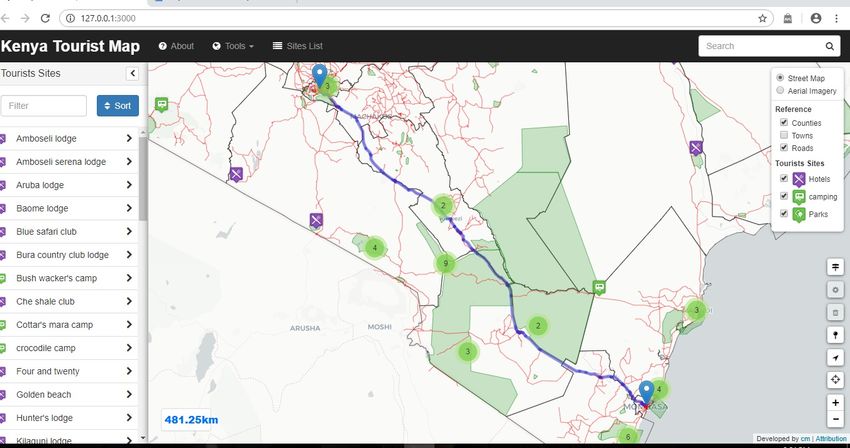
C. M. Muriuki, B. Kenduiywo

                                all of which are expensive to sustain and reach a relatively small audience [19]
                                [20]. A study by Philip O. Obiero refers to these methods as traditional methods
                                and distinguishes them from the non-traditional methods which employ online
                                marketing [21]. The study also recommended the rebranding and upgrading of
                                attraction sites, using both traditional and non-traditional marketing strategies
                                to make them more visible in the global market.
                                   With the emergence of mobile and Internet technology, Information and
                                Communication Technology (ICT) is used to share destination information to
                                prospective tourists across the world [22]. This is becoming common and more
                                popular in many countries because information technology can reduce cost of
                                doing business and enhance efficiency [23]. For efficient tourism marketing, in-
                                formation systems will require GIS to deliver spatial-travel information on the
                                internet [24]. The resultant architecture contains a web GIS server and a client
                                side application. Such model is a web GIS application that supports a graphical
                                user interface, implements GIS analysis and facilitates data visualization proce-
                                dures cheaply [25].
                                   A number of countries have embraced a full-fledged web GIS system to pro-
                                mote tourism. An example is the Nigeria open source GIS used to create a web
                                GIS platform to plan, manage and promote tourism [26]. Another study by
                                Sharma (2016) developed a similar platform to aid tourists in Assam district, In-
                                dia [27]. Being a web based application, it targeted wider audience and imple-
                                mented updates regularly. A similar study used multimedia data (i.e. video, au-
                                dio, and text) [28] combined with spatial data to form web GIS. Video files, au-
                                dio and spatial data were combined with internet technology to form multime-
                                dia web GIS application that provided powerful tools to solve spatial query solu-
                                tions online [29] [30]. However, these systems lacked trip planning capabilities
                                useful for trip personalization.
                                   For tourists, trip planning involves visualizing, exploring and sampling of
                                available tourist activities and routes with a view to gaining awareness about
                                tourist destinations they intend to visit [31]. Information on proximity is key to
                                travelers as it forms a clear picture of destination accessibility and the sur-
                                roundings [32]. Tourists can select preferred destinations, choose favorite ac-
                                commodation, decide which routes to take and more importantly generate se-
                                quence of destinations points of interest in an optimal order [33] [34]. Our pro-
                                posed system employs Travelling Salesman Problem (TSP) optimization algo-
                                rithm using GIS, as a decision tool to determine shortest routes [35]. It helps the
                                visitors to plan their itineraries before they reach their destinations making it
                                easier for them to decide where to visit and what to see [36] [37]. This enables
                                individual attractions sites to gain equal visibility and ensures country wide
                                competitiveness [8]. Less known and unique products have a chance to be dis-
                                covered.
                                  World over, the internet technology and e-commerce have helped improve
                                online marketing by using Business to Consumer (B2C) transactions with tour-
                                ism benefiting a great deal [38]. Facebook is an effective communication channel

DOI: 10.4236/jgis.2021.131002                        21                     Journal of Geographic Information System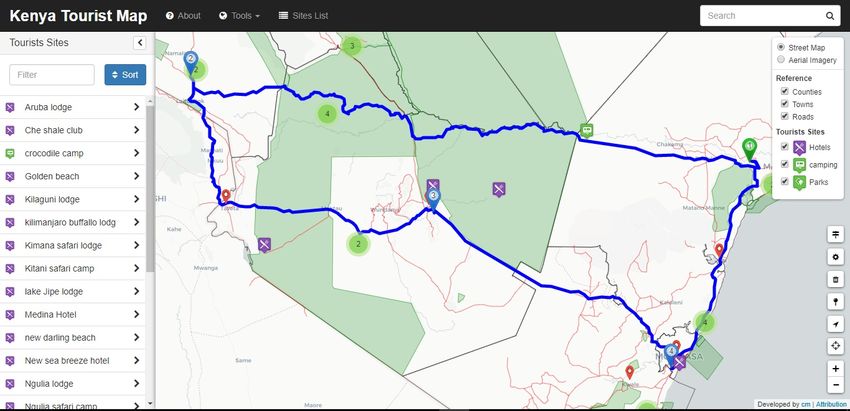
C. M. Muriuki, B. Kenduiywo
mainly used to raise brand awareness and creating engagement with the users.
According to Facebook Newsroom (2019) there were 2.38 billion active users by
31st March 2018 [39]. Facebook allows destinations to manage their image as
well as sharing content. It is interactive, dynamic and connects people with sim-
ilar interests [40]. In tourism marketing Facebook offers travel destinations the
ability to showcase their brands to prospective visitors, engage directly with
clients, in addition to creating a branded experiences through Facebook adver-
tisements.
2. Materials and Methods
2.1. Study Area
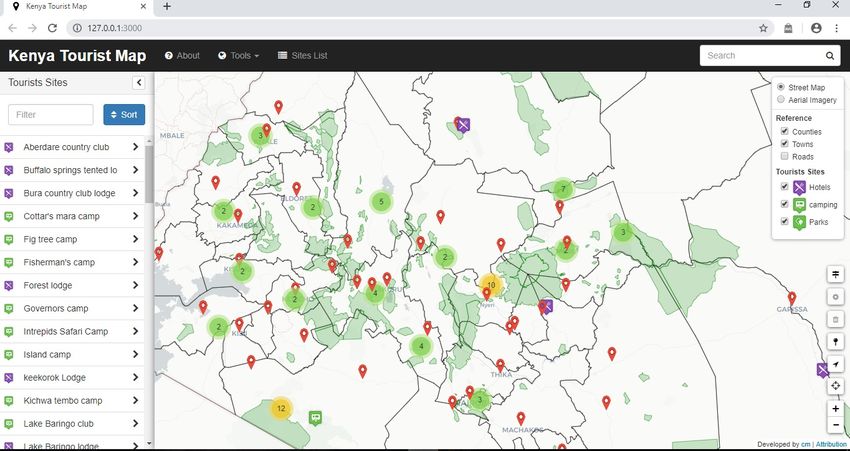
Kenya was chosen as study area because of its diverse tourist attraction sites.
Moreover, the country lacks a web enabled web GIS platform for planning and
marketing tourism. Kenya as shown in Figure 1 is an Eastern Africa country and
spans approximately 582,000 km2 in land mass where 7.5% of the land surface
(43,600 km2) is covered by National parks and National reserves that offer tou-
ristic activities. There are 59 scenic national parks and reserves, 4 marine parks,
private reserves and game ranches across the country. With palm fringed shore-
line of 480 km that is home to beautiful cliffs and magnificent sandy beaches,
Kenya coastline is ideal for water sports and deep sea fishing. The Great Rift
Valley has an approximate width of 80 km and divides the country down the
length into two, it is home to most spectacular sceneries like the escarpments,
lakes, hot springs, geysers, extinct and active volcanoes.
2.2. Methods
Figure 2 summarizes approaches we adopted to develop a multimedia GIS web
application. GIS shapefiles were prepared in QGIS software [41] for purposes of
Figure 1. A map of the study area showing touristic attractions in Kenya. (Data source:
World Resource Institute).
DOI: 10.4236/jgis.2021.131002 22 Journal of Geographic Information System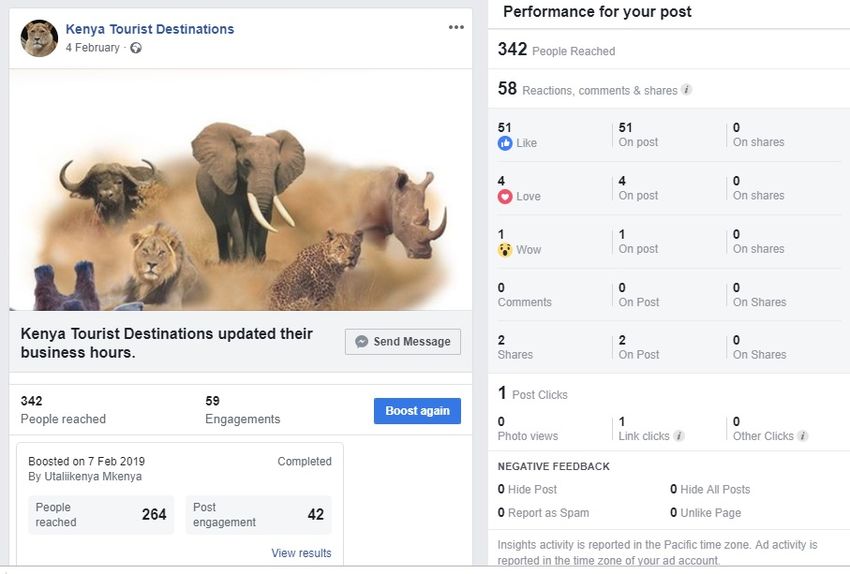
C. M. Muriuki, B. Kenduiywo
Figure 2. Conceptual framework adopted in the study.
creating a GIS database. Multimedia files were grouped into two categories
namely; pictures and videos. Videos described activities in parks and were saved
in an online video database while pictures representing what to see in the attrac-
tion were stored in a folder together with the index html. GIS routing database
was created using PostgreSQL Software [42] and published using Geoserver [43]
web server, while Leaflet [44] client application programming interface (API)
was used to create an interactive map.
2.3. Needs Assessment and User Requirements
In order to understand tourism products in Kenya, a survey was conducted us-
ing 220 structured questionnaires distributed using random sampling to Kenyan
residents and foreign visitors. The survey was aimed at assessing any gaps or
trends in terms of popularity of tourism products as well as to decide on a con-
venient marketing method. Also examined were the preferred methods of trip
planning and how travel experiences are shared within the social media. To get a
proportionate representation of the targeted respondents, the study used Coch-
ran’s standard sample size calculation formula designed for infinite population
as shown in Equation (1).
z 2 pq
N= (1)
e2
where N is the sample size.
Z is confidence, p sample proportion, q = 1 − p, N0 is population size, and e is
Margin of error. A second survey for all the travels and tour companies was ad-
ministered with a sample size of 98 questionnaires determined using Cochran’s
second formula as shown in Equation (2) for finite population [45].
Sample size,
z 2 p (1 − p )
N= e2 (2)
z p (1 − p )
2
1 + 2
e N0
DOI: 10.4236/jgis.2021.131002 23 Journal of Geographic Information System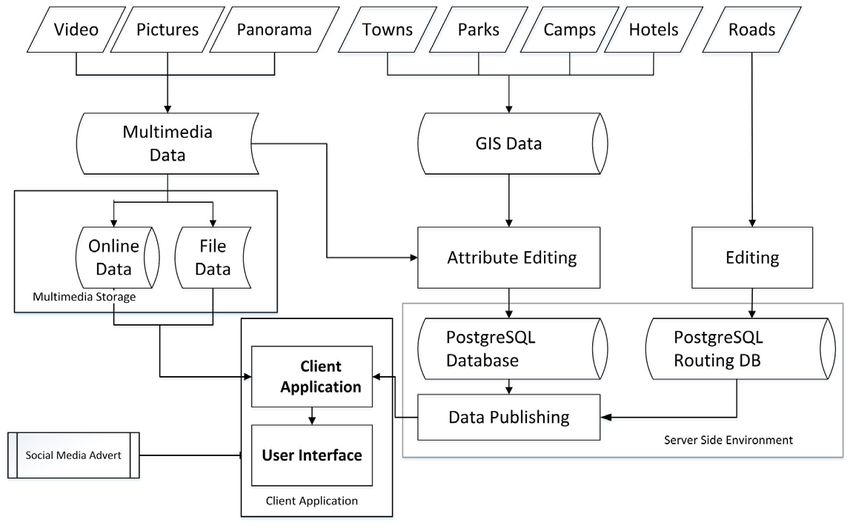
C. M. Muriuki, B. Kenduiywo

                                2.4. Data Acquisition
                                Excerpts and derived Openstreetmap (OSM) roads data for Kenya were down-
                                loaded from Geofabrik [46] available for free. Other open and free data sets in-
                                cluded Kenya Parks, Kenya Hotels, Kenya Towns, and Kenya Campsites all ac-
                                quired from World Resource Institute [47]. Selected free to use videos and pic-
                                tures were downloaded from the Kenya wildlife service website [48] all covered
                                under creative commons attribution license.

                                2.5. Data Preparation
                                It involved two processes, first was preprocessing and editing of all the GIS data
                                in QGIS software and second was creation of Network dataset. Kenya roads data
                                was edited in QGIS to eliminate unwanted fields and creating new fields relevant
                                to this study. Eventually 57 columns for Kenya roads attribute table were re-
                                duced to 7 fields after editing. Kenya hotels attribute table was edited to intro-
                                duce new field to carry Uniform Resource Locator (URL) for hotels websites.
                                This field links Kenya hotels and camps Shapefiles to their respective online
                                websites. Similar attribute editing was done for Kenya parks Shapefile which
                                carried two fields to hold URLs for videos and photographs describing activities
                                in parks and other attractions. Photographs describing parks were placed in a
                                common folder with the index html, while videos were freely hosted in Vimeo
                                database to be retrieved online using URL provided in the attribute table.

                                2.6. Database Design
                                PostgresSQL [49] was used to create spatially enabled database using the graph-
                                ical PgAdmin 4 [42] utility. Edited Shapefiles for Kenya hotels and camps, Kenya
                                parks, and Kenya towns were imported into PostGIS database using a pgShape-
                                loader utility. pgRouting extension [50] was used to create network dataset for
                                roads where fields to hold routing characteristics were created. Roads topology
                                was established creating nodes and arcs in order to achieve a routable roads da-
                                taset. The Shapefiles were exported to Geoserver application [43] for publishing.
                                This is an open source web mapping server used to create workspace and sub-
                                sequently publishing data online using Web browser.

                                2.7. Network Routing Using Dijkstra Algorithm
                                Dijkstra algorithm was used to model Roads data as a graph with weighted edges
                                suitable for finding shortest paths between two vertices [51]. Graph theory as
                                shown in Equation (3) forms basis for weighted graphs and their applications
                                [52] e.g. network analysis where sets of vertices (V) and edges (E) are processed
                                using Dijkstra algorithm. Inputs for the graph includes weighted (w) graphs
                                representing connected vertices and edges with some numerical values attached
                                to the edges to represent distances [11] i.e.
                                                              Graph: G = (V , E , w )                                (3)

DOI: 10.4236/jgis.2021.131002                         24                        Journal of Geographic Information System
C. M. Muriuki, B. Kenduiywo
where V = {v1 , v2 , , vn } , E = {e1 , e2 , , em } and w = {w1 , w2 , , wm } .
GIS graphs are geo-referenced to provide vertices that have geographically de-
fined coordinates [11]. Our roads data were topologically modelled therefore
had the correct geometry for the network analysis. Data was represented as ver-
tices and a numerical value assigned to the edges that describes the entire length
of path. The weight of a path is the sum of weights of all edges it contains [11].
In this study network was modelled using roads database to obtain minimum
cost between source node and destination node to form an optimal path dis-
tances for roads network. Given graph equation (Equation (3)) for source node
u0 ∈ V , shortest path and distance from a node u to v given by dist(u, v) for all
v ∈ V , carries minimum weight of all possible paths with source u and destina-
tion v. The distance from u0 to S is given by formula in Equation (4) where
S denotes V-S and that u0 ∈ S
dist ( u0 , S )
= min {d ( u0 , u ) + w ( uv )} (4)
u∈S , v∈S
2.8. Traveling Salesman Problem Algorithm
This algorithm was used to find the most optimal route through a set of points
located spatially in space along roads data. It follows the Hamiltonian principle
which states that a tour starts and ends at the same point, and all locations are
visited once and only once and in the best order, with an optimally minimal
overall travelled distance [53]. Its aim in tourism is to select a planned sequence
of tourist destination points and find an optimal route with minimum distance
generated along the road network [36].
2.9. System Implementation
The application was built using Leaflet API [44] which is a client side program-
ing language. This is an open source JavaScript library for making interactive
maps. Leaflet API pulls shapefiles from Geo-server workspace and displays them
as a GeoJSON files on a web browser. It was used to style and display the layer
properties for all layers. URLs in respective attribute tables helped to link data to
online resource where videos and other information can be explored online.
Route optimization was implemented using open source GraphHopper routing
API [54], the user selects points of interest to be visited and the functionality
creates an itinerary of ordered points in sequence of visit. Shortest routes be-
tween points on the map were implemented by use of movable marker that con-
tained source and second marker for destination points. Other functionality in-
cluded finding closest facilities from selected location, slider tool was used to
specify the radius of coverage to select nearest facilities. The user interface pro-
vides tools to explore the web GIS functionalities and allows users to interact
with tourist data. A search bar was provided to search and display data in vari-
ous layers of the web GIS application. Facebook Ad™ was prepared targeting au-
dience living in the USA and in particular, Los Angeles, aged between 30 - 65
years. USA being one of the world’s best performing outbound market, remains
DOI: 10.4236/jgis.2021.131002 25 Journal of Geographic Information SystemC. M. Muriuki, B. Kenduiywo
Kenya’s leading tourism source markets with market share of 11.8% as at De-
cember 2017 [55]. A link was provided in Facebook Advertisement to direct vis-
itors to the web portal for purposes of sampling Kenya’s tourism products to
create awareness. Kenya has an opportunity to expand further and capture a
bigger share away from the competitors by creating more awareness to increase
arrivals [56]. The advertisement was used to engage audience and popularize the
site with the intention to increase traffic to our portal.
3. Results
3.1. Questionnaire Results
Figure 3 represents results of a survey conducted to assess the need for a tour-
ism marketing portal. Findings from the survey indicate that Kenyan citizens
and foreign visitors aged between 20 and 70 years responded, where 51% of res-
pondents were female and 49% were male. The survey showed that 60% of the
respondents had previously visited an attraction site in Kenya while 40% had not
visited any tourist attraction. From the study wildlife tourism was found to be
the most preferred of all the tourist products offered in Kenya followed closely
Figure 3. Needs assessment survey results: (a) Preferred tourist products; (b) Marketing
methods; (c) Preferred trip planning methods; (d) Preferred social media content sharing
method; (e) Tourist booking methods.
DOI: 10.4236/jgis.2021.131002 26 Journal of Geographic Information SystemC. M. Muriuki, B. Kenduiywo
by activities in the coastal beaches (Figure 3(a)). The results further indicated
that internet is the leading source of tourist information, however traditional
methods like electronic media, print media, exhibitions and travel agencies also
play a significant role in providing tourism information for Kenya’s destination
(Figure 3(b)). Further, the survey revealed that close to half of the respondents
preferred planning their trips online while the remaining proportion preferred
using other methods as shown in Figure 3(c). However, a survey on tours and
travel companies revealed that 46% of the bookings were done through travel of-
fices while 37% was done through the company websites (Figure 3(e)). This
means that although a large proportion of travelers preferred planning trips on-
line, tourist operators had not fully embraced online planning technology and
were still using travel booking offices. Regarding sharing of content, Facebook
was found to be the most preferred online method of sharing holiday experience
followed closely by Twitter as shown in Figure 3(d). Facebook was therefore the
most effective methods of reaching the potential clients over social media.
3.2. Kenya Tourist Facilities
Figure 4 represents Kenya web GIS map showing parks, hotels, road network,
and towns. This is an interactive map that displays activities and brands in the
attraction sites. Multimedia data, in form of Videos, audio, and websites, were
linked to spatial data to provide more detailed information about the products
available. Tools for querying data, proximity were provided, these included
Search tool, Select tool and closest facilities.
3.3. Network Routing
Figure 5 represents a routable road network system developed representing
roads in Kenya. Shortest distances from origin to destinations were established
with their distances displayed. The routes and closest facilities are computed
along the roads using the Dijkstra algorithm. Minimized distances between ori-
gin and destination are selected and displayed on map.
Figure 4. Kenya tourist attraction sites on a web GIS application.
DOI: 10.4236/jgis.2021.131002 27 Journal of Geographic Information SystemC. M. Muriuki, B. Kenduiywo
Figure 5. Map showing shortest routes between two selected nodes.
3.4. Web GIS Itinerary
GIS was used to recommend optimal routes and itinerary planning using TSP
along Kenya Roads network. Distances are displayed in kilometers, representing
the entire length of the itinerary along the roads through a set of selected points.
Points to be visited were ordered sequentially for entire travel plan as indicated
in Figure 6. Customized tour plan consisting of least distance between the mul-
tiple tourists destinations are displayed spatially on a map.
3.5. Marketing Tourism Web GIS Platform Using Facebook
Advertisement
Figure 7 contains results from Facebook advertisement after running a promo-
tion of Kenya tourist web GIS application through engagement. The advertise-
ment targeted travel groups within 40 km from Los Angeles city, USA, running
for one week starting from 8th February to 15th February 2019. Results of the in-
sight indicate that a total of 342 people were reached with 59 engagements.
4. Discussion
Kenya is endowed with plenty of scenic natural landscape, national parks, re-
serves, Museums, sports tourism, conferencing facilities, nature trails, beaches
and a rich diverse culture. The aim of the study was to gather all these tourism
products and services into one central point using web GIS for purposes of
creating awareness and marketing. An inventory of Kenya’s tourist sites with
their activities represented using multimedia was created. A web GIS was devel-
oped to display the attraction sites in their respective geographical locations
while attribute and multimedia data was used to provide more information
about the destinations’ appeal such as; brands, services available, activities,
opening times, and charges. This content creates awareness and allows visitors to
explore various alternatives to help in making travel choices. The main aim was
to raise the status of appeal for attraction sites and to reverse the impression that
DOI: 10.4236/jgis.2021.131002 28 Journal of Geographic Information SystemC. M. Muriuki, B. Kenduiywo
Figure 6. Map showing optimal routes for an itinerary planning.
Figure 7. Results for one week’s performance of the Facebook Advertisement, extracted
from Facebook insight.
tourism in Kenya only revolves around the coastal beaches and a few wildlife
parks [16] [57].
The developed web GIS platform provides enough content for all attractions
sites to gain equal visibility. Therefore, less known attraction sites with unique
products have a chance to be discovered and considered for visit. In line with the
government’s planned decongestion programme of some highly visited attrac-
tion sites, this is a modest contribution to policy makers to deliberately innovate
unique products in alternative centers and use our portal for marketing the sites
[4].
Studies have shown that, information presented using different formats
through visualization is captured well by the human memory [28]. Our portal
previews what is offered at every attraction sites and helps the visitor to plan a
sequence of ordered destination points that forms an itinerary. This process is
DOI: 10.4236/jgis.2021.131002 29 Journal of Geographic Information SystemC. M. Muriuki, B. Kenduiywo
guided by the individual interests and knowledge acquired about the desti-
nation, consequently making customized trips more satisfying than the usual
pre-determined tour circuits which are centered only on the prominent tourist
regions [58]. Our results described for the first time in Kenya, a self-generated
travel plan informed by travel interests and cognitive content.
Similar studies have been done, an example being tourism in public forest [59]
which implemented shortest routes to manage traffic within a forest, however in
our study particular attention was paid to implementation of customized trips.
Like the web enabled GIS navigation system [60], our study also provided visi-
tors with information about nearest facilities including accommodation, restau-
rants, places of interest and generates the most feasible routes.
Kenya tourism Stakeholders don’t have a dedicated portal to display tourist
information but instead they heavily rely on Google maps [61] and Google earth
[62]. Although this is a great way to visualize data and finding shortest routes, it
lacks the detailed customized content to promote brands in a destination,
enough to place every attraction sites on the same level of competitiveness. They
are generic and are not focused in a thematic area. Searching data is however
cumbersome as it involves browsing the deeply hyperlinked textual information.
Our tourist information on the other hand is a thematic web GIS map custo-
mized as one unified product placed in a central inventory to guarantee conve-
nient and easy searching of tourism data in one place. Facebook page was
created to advertise tourism products through engagements with visitors, this
allows deeper understanding of brands packaged in various individual attraction
sites. To achieve this, a link carrying the web portal’s URL was provided in Fa-
cebook page to connect visitors to the portal. A similar link carrying Facebook
page URL was provided in the web portal to connect with the Facebook page.
This mode of advertisement is cheap and fast enough to reach many users
worldwide in a short time. Findings from our advertisement illustrate that, this
is a convenient method that reached audience with targeted travel interests.
However one limitation, encountered in the study was that our Facebook ad-
vertisement ran for 7 days, but it was realized that advertisements are a process
that requires continuous monitoring and active engagement in order to sustain
the needs of social media clients. The study recommends that the country should
invest more on social media advertisement in order to gain more visibility in the
world market as well as generating continuous engagement with the audience.
5. Conclusions
Advent of web Geographical Information System (GIS) has made possible sto-
rage, analysis and dissemination of spatial data over the internet. We tap into
this potential in order to design a web GIS tool to enable route planning and
promotion of tourism in Kenya for the first time. A multimedia GIS database
representing tourism activities and attraction sites in Kenya was created using
free and open source software. Our study demonstrated that for a country to
DOI: 10.4236/jgis.2021.131002 30 Journal of Geographic Information SystemC. M. Muriuki, B. Kenduiywo
make impact on tourism growth, a comprehensive tourism inventory is created
to provide destination information to potential visitors. Geospatial functionali-
ties combined with tourism information packaged in audio and videos were used
to show activities in the parks as well as facilities in hotel rooms. This inventory
was customized to create awareness and sell the image of the site for marketing
and promotion of the destination. To share this data, a GIS web server functio-
nality was used for publishing the content online. Users only required a regular
web browser to interact with the system and do not need to be experts in com-
plex GIS applications.
Our system uses route optimization technique to recommend optimal itine-
rary plan between multiple destinations in a GIS environment. Other Capabili-
ties in our web GIS system included tools to query data as well as route planning
that included shortest routes and optimal paths. This was implemented using
Travelling Salesman Problem (TSP) and Dijkstra algorithm. Both techniques use
Kenya road network dataset to provide shortest path distances between points
on a map. For purposes of marketing tourism in Kenya, a Facebook advertise-
ment Page was created to promote tourist products through visitor engage-
ments. The results showed that Facebook with its large following can reach a
large audience in a short span of time.
Acknowledgements
This research received no specific grant from any funding agency in the public,
commercial, or not-for-profit sectors.
Disclosure
We declare that this manuscript is original, has not been published before and is
not being currently considered for publications elsewhere. We know of no con-
flicts of interest associated with this publication, and there has been no signifi-
cant financial support for this work that could have influenced its outcome. As a
first author I confirm that the manuscript has been read and approved for sub-
mission by the 2nd author who supervised the entire work until completion.
Conflicts of Interest
The authors declare no conflicts of interest regarding the publication of this pa-
per.
References
[1] Khan, A., Bibi, S., Lorenzo, A., Lyu, J. and Babar, Z.U. (2020) Tourism and Devel-
opment in Developing Economies: A Policy Implication Perspective. Sustainability,
12, 1-19. https://doi.org/10.3390/su12041618
[2] Kulyk, V. and Sossa, R. (2018) Determining the Tourist Attractive Regions by GIS
Analysis Using Heatmaps. Geodesy and Cartography, 44, 22-27.
https://doi.org/10.3846/gac.2018.882
[3] WTTC (2019) Travel & Tourism World Impact 2019—World.
DOI: 10.4236/jgis.2021.131002 31 Journal of Geographic Information SystemC. M. Muriuki, B. Kenduiywo
[4] Ministry of Tourism and Wildlife (2020) Republic of Kenya.
[5] Kippra (2017) Kenya Economic Report 2017. Sustaining Kenya’s Economic Devel-
opment by Deepening and Expanding Economic. Integration in the Region. 1-138.
[6] Tourism Research Institute (2018) Tourism Sector 2018.
[7] GoK (2013) Sector Plan for Tourism 2013-2017. 1-56.
[8] Thecla, A. and Chigozie, O. (2014) Designing and Developing a GIS Database for
Tourism in Nigeria: The Case of Anambra State. IOSR Journal of Humanities and
Social Science, 19, 109-120. https://doi.org/10.9790/0837-19108109120
[9] Abdulhamid, S.M. and Usman, G. (2014) Destination Information Management
System for Tourist.
[10] Ngwira, C. and Kankhuni, Z. (2018) What Attracts Tourists to a Destination? Is It
Attractions? African Journal of Hospitality, Tourism and Leisure, 7, 1-19.
[11] Ni, K., Zhang, Y.-T., et al. (2014) Shortest Path Analysis Based on Dijkstra’s Algo-
rithm in Emergency Response System. TELKOMNIKA Indonesian Journal of Elec-
trical Engineering, 12, 3476-3482. https://doi.org/10.11591/telkomnika.v12i5.3236
[12] Galelekile, T. (2020) Destination Marketing Explained: Meaning, Trends and Chal-
lenges. https://placebrandobserver.com/destination-marketing-explained
[13] Chetthamrongchai, P. (2017) The Influence of Travel Motivation, Information
Sources and Tourism Crisis on Tourists’ Destination Image. Journal of Tourism &
Hospitality, 6, Article ID: 1000278. https://doi.org/10.4172/2167-0269.1000278
[14] de las Heras-Pedrosa, C., Millan-Celis, E., Iglesias-Sánchez, P.P. and Jambri-
no-Maldonado, C. (2020) Importance of Social Media in the Image Formation of
Tourist Destinations from the Stakeholders’ Perspective. Sustainability, 12, 4092.
https://doi.org/10.3390/su12104092
[15] Kaylo, P. and Katuse, J. (2013) Kenya’s Destination Image: Perceptions of Kenya as
a Premier Destination of Africa. International Journal of Social Sciences and Entre-
preneurship, 1, 654-666.
[16] Ndivo, R.M. and Waudo, J.N. (2012) Examining Kenya’s Tourist Destinations? Ap-
peal: The Perspectives of Domestic Tourism Market. Tourism and Hospitality, 1,
Article ID: 1000103. https://doi.org/10.4172/2167-0269.1000103
[17] Government of Kenya (2012) Tourism Act 2012. No. 1.
[18] Tourism Research Institute (2019) Tourism Sector Performance Report.
[19] Madondo, E., Chiguvi, D. and Tadu, R. (2019) Assessment of the Effectiveness of
Traditional Media for the Promotion of Tourism in This Digital Age in KwaZu-
lu-Natal South Africa. Business & Management Studies, 5, 36.
https://doi.org/10.11114/bms.v5i4.4598
[20] Vinaya Kumar, C.M. and Mehrota, S. (2018) Print vs. Online Advertising—Impact
on Buying Behavior of Youth. Global Media Journal, 16, 1-3.
[21] Abiero, P.O., et al. (2017) Influence of Marketing Strategies on Performance of
Cultural Heritage Tourism in Kenya. European Journal of Business and Manage-
ment, 9, 49-60.
[22] Bethapudi, A. (2013) The Role of ICT in Tourism Industry. Journal of Applied
Economics and Business, 1, 67-79.
[23] Ayed Al qeed, M., Bazazo, I.K., Hasoneh, A.I. and Al Qaid, B.A. (2014) Using Geo-
graphic Information System to Visualize Travel Patterns and Market Potentials of
Petra City in Jordan. International Journal of Marketing Studies, 2, 144-159.
https://doi.org/10.5539/ijms.v2n2p144
DOI: 10.4236/jgis.2021.131002 32 Journal of Geographic Information SystemC. M. Muriuki, B. Kenduiywo
[24] Wei, W. (2012) Research on the Application of Geographic Information System in
Tourism Management. Procedia Environmental Sciences, 12, 1104-1109.
https://doi.org/10.1016/j.proenv.2012.01.394
[25] Maiti, A., Majumdar, S., Shukla, S., Koti, S.R. and Gupta, P.K. (2018) An Open
Source Web-GIS Based Precise Satellite Tracking and Visualisation Tool Using Two
Line Element Data. The ISPRS Annals of the Photogrammetry, Remote Sensing and
Spatial Information Sciences, 4, 109-114.
https://doi.org/10.5194/isprs-annals-IV-5-109-2018
[26] Ayeni, O. (2006) A Multimedia GIS Database for Planning Management and Pro-
motion of Sustainable Tourism Industry in Nigeria. Proceedings 33th FIG Con-
gress, Munich, 8-13 October 2006, 1-17.
[27] Sharma, N. (2016) Development of Web-Based Geographic Information System
(GIS) for Promoting Tourism in Sivasagar District. International Journal of Innova-
tion and Scientific Research, 24, 144-160.
[28] Unel, F.B., Gundogdu, I.B. and Yalpir, S. (2014) The Impact of Multimedia Geo-
graphic Information System in Tourism. International Journal of Computer Theory
and Engineering, 7, 81-85. https://doi.org/10.7763/IJCTE.2015.V7.935
[29] Pispidikis, I. and Dimopoulou, E. (2015) Web Development of Spatial Content
Management System through the Use of Free and Open-Source Technologies. Case
Study in Rural Areas. Journal of Geographic Information System, 7, 527-540.
https://doi.org/10.4236/jgis.2015.75042
[30] Zerihun, M.E. (2017) Web Based GIS for Tourism Development Using Effective
Free and Open Source Software Case Study: Gondor Town and Its Surrounding
Area, Ethiopia. Journal of Geographic Information System, 9, 47-58.
https://doi.org/10.4236/jgis.2017.91004
[31] Almer, A. and Stelzl, H. (2002) Multimedia Visualization of Geoinformation for
Tourism Regions Based on Remote Sensing Data. Earth.
[32] Kumar, P. and Kumar, D. (2016) Network Analysis Using GIS Techniques: A Case
of Chandigarh City. International Journal of Science and Research, 5, 409-411.
https://doi.org/10.21275/v5i2.NOV161143
[33] Sharma, O., Mioc, D. and Dharmaraj, G. (2005) Traveling Salesperson Approxima-
tion Algorithm for Real Road Networks. Proceedings of International Symposium
on Spatio-Temporal Modeling, Spatial Reasoning, Analysis, Data Mining and Data
Fusion.
http://www.isprs.org/proceedings/XXXVI/2-W25/source/TRAVELING_SALESPER
SON_APPROXIMATION_ALGORITHM_FOR_REAL_ROAD.pdf
[34] Ardiansyah and Rainis, R. (2015) A PostgreSQL/PostGIS Implementation for the
Sightseeing Tour Planning Problem. Jurnal Rekayasa Elektrika, 10, 115-119.
[35] Gu, W., Liu, Y., Wei, L.-R. and Dong, B.-K. (2015) A Hybrid Optimization Algo-
rithm for Traveling Salesman Problem Based on Geographical Information System
for Logistics Distribution. International Journal of Grid and Distributed Compu-
ting, 8, 359-370. https://doi.org/10.14257/ijgdc.2015.8.3.33
[36] Abubakar, E.O., Idoko, O. and Ocholi, O.S. (2017) Efficient Tour Planning for
Tourist Sites Visitation in Lokoja, Nigeria: A Multi-Scenario Analysis Using GIS.
Journal of Geographic Information System, 9, 59-81.
https://doi.org/10.4236/jgis.2017.91005
[37] Wijesinghe, K.D.K.D., Delpachithra, C.N., Perera, L.K.C.T., Wijetilake, S.H., Raja-
paksha, S. and Fernando, N. (2013) GIS Enabled Travel Planner System with TSP
Implementation. PNCTM, 2, 49-55.
DOI: 10.4236/jgis.2021.131002 33 Journal of Geographic Information SystemC. M. Muriuki, B. Kenduiywo
[38] Kumar, P. (2014) Internet Marketing in Tourism. 1-5.
[39] Facebook Newsroom (2019) Company Info. Facebook Newsroom.
https://newsroom.fb.com/company-info
[40] Önder, I., Gunter, U. and Gindl, S. (2020) Utilizing Facebook Statistics in Tourism
Demand Modeling and Destination Marketing. Journal of Travel Research, 59,
195-208. https://doi.org/10.1177/0047287519835969
[41] QGIS 3.8.1 (2019) Welcome to the QGIS Project! https://qgis.org/en/site
[42] pgAdmin 4 (2019) PostgreSQL: File Browser.
https://www.postgresql.org/ftp/pgadmin/pgadmin4/v4.8/windows
[43] Geoserver (2019) GeoServer. http://geoserver.org
[44] Leaflet (2019) Leaflet—A JavaScript Library for Interactive Maps.
https://leafletjs.com
[45] Cochran, W.G. (1977) Stratified Random Sampling, Further Aspects of Stratified
Sampling.
[46] Geofabrik (2018) Geofabrik Download Server.
http://download.geofabrik.de/africa/kenya.html
[47] World Resources Institute (2017) Kenya GIS Data.
https://www.wri.org/resources/data-sets/kenya-gis-data#tourism
[48] Kenya Wildlife Services (2018) Photo_store. Kenya Wildlife Service.
https://www.kws.go.ke/photo-store
[49] PostgresSQL (2019) PostgreSQL: File Browser.
https://www.postgresql.org/ftp/pgadmin/pgadmin4/v4.0/windows
[50] PgRouting (2019) pgRouting Project—Open Source Routing Library.
https://pgrouting.org
[51] Kirono, S., Arifianto, M.I., Putra, R.E., Musoleh, A. and Setiadi, R. (2018)
Graph-Based Modeling and Dijkstra Algorithm for Searching Vehicle Routes on
Highways. International Journal of Mechanical Engineering & Technology, 9,
1273-1280.
[52] Lloyd, E.K., Bondy, J.A. and Murty, U.S.R. (2007) Graph Theory with Applications.
The Mathematical Gazette, 62, 63. https://doi.org/10.2307/3617646
[53] Papadimitriou, C.H. and Vazirani, U.V. (2006) Algorithms.
[54] Graphhoper (2019) Developers—GraphHopper Directions API.
https://www.graphhopper.com/developers
[55] CS Min of Tourism (2019) Ministry of Tourism and Wildlife.
http://www.tourism.go.ke/tourism-principal-secretary-joe-okudo-welcomes-kenya-
airways-return-flight-kq003-from-new-york-to-nairobi
[56] Business Daily (2019) Direct US Flights a Game Changer for Kenya’s Tour-
ism—Business Daily.
https://www.businessdailyafrica.com/analysis/columnists/Direct-US-flights-a-game
-changer-for-Kenya-s-tourism/4259356-4815618-bin28x/index.html
[57] KNBS (2018) Kenya Economic Survey 2018 Highlights Economic Survey 2018, No.
April.
[58] Mutinda, R. and Mayaka, M. (2012) Application of Destination Choice Model: Fac-
tors Influencing Domestic Tourists Destination Choice among Residents of Nairobi,
Kenya. Tourism Management, 33, 1593-1597.
https://doi.org/10.1016/j.tourman.2011.12.008
[59] Brach, M. and Górski, D. (2014) Application of Network Analysis for Development
DOI: 10.4236/jgis.2021.131002 34 Journal of Geographic Information SystemC. M. Muriuki, B. Kenduiywo
and Promotion of Sustainable Tourism in Public Forests. Folia Forestalia Polonica
Seria A, 56, 105-112. https://doi.org/10.2478/ffp-2014-0010
[60] Singh, A.P. and Goyal, S. (2015) Web Enabled GIS Based Navigation Information
System Using Network Analysis Capability.
[61] Google Maps. 2020. https://www.google.co.ke/maps/@-1.0987706,37.0078127,15z
[62] Google Earth. 2020.
https://earth.google.com/web/@-1.47503342,22.44933783,1386.83552741a,22250367
.03265429d,35y,355.24065359h,0t,0r
DOI: 10.4236/jgis.2021.131002 35 Journal of Geographic Information SystemYou can also read