Comparing technologies and algorithms behind mapping and routing APIs for Electric Vehicles - Jönköping University
←
→
Page content transcription
If your browser does not render page correctly, please read the page content below
Comparing
technologies and
algorithms behind
mapping and routing
APIs for Electric
Vehicles

PAPER WITHIN Computer Science
AUTHOR: Amanda Axelsson, Erik Andreasson
TUTOR: Beril Sirmacek
JÖNKÖPING 05 2020
This exam work has been carried out at the School of Engineering in Jönköping
in the area of Computer Science. The work is a part of the three-year Bachelor
of Science in Science in Engineering program.
The authors take full responsibility for opinions, conclusions, and findings
presented.

Examiner: Beril Sirmacek

Supervisor: Linus Rudbeck

Scope: 15 credits (first cycle)

Date: 2020-05-10
Acknowledgments
We want to thank Beril Sirmacek for being involved in our project as much as she
was and helping us achieve our goals.

We want to thank Linus Rudbeck and Emil Karlsson for being our supervisors and
being there for us when we needed to ask questions and making sure we were on track
with the project.

We want to thank our parents for being there for us during the years and inspiring us to
achieve our goals.

We want to thank the teachers who have helped us develop over the course of our
education during these last three years.
Summary

Abstract
The fast-developing industry of electric vehicles is growing, and so is the driver community,
which puts pressure on the electric charging grid. The purpose of this thesis is to simplify for
the drivers of electric cars to charge their cars during trips. The research questions
investigated are” How do the technologies and algorithms behind navigation APIs differ from
each other?” and “What information is provided by the charging station APIs and how do
they collect data about new stations?”. Information for the thesis was collected by reading and
analyzing both documentation and previous work, as well as by conducting experiments. The
study was limited to purely electric vehicles. We created an application to conduct
experiments on the API combination Mapbox and Open Charge Map, we call it ChargeX. We
compare, TomTom, Tesla, Plugshare, Google Maps and ChargeX. The most common
shortest-path algorithms are Dijkstra’s, A* and Bidirectional A*. They provide reasonable
solutions to the shortest path problem. The algorithms can be improved by considering traffic
flow, travel time and distance between origin and destination and apply it as weights on the
edges. What has the largest impact on the final route is the choice of charging stations. The
algorithm for picking charging stations can be optimized in several ways for example by
considering real time availability information of the charging stations, prioritize highways,
calculate the temperature and altitude impact on the battery or prioritize faster chargers such
as superchargers for Tesla.
Summary

Summary
Den innovationsintensiva elfordonsindustin växer snabbt och detsamma gäller för gruppen
elbilsägare, vilket sätter press på laddningsnätet. Syftet med avhandlingen är att förenkla för
elbilsägare att ladda sina bilar under resor. Forskningsfrågorna som undersöks är “Hur skiljer
sig teknologierna och algoritmerna bakom navigations-API:er från varandra?” och “Vilken
information tillhandahålls av laddstations API:er och hur samlar de in data om nya
stationer?”. Informationen som ligger till grund för avhandlingen samlades in genom att läsa
och analysera både dokumentation och tidigare arbeten, samt från genomförda experiment.
Studien genomförs på endast helt elektriska fordon. Vi skapade en applikation för att
genomföra experiment på API kombinationen Mapbox och Open Charge Map, som vi kallar
ChargeX. Vi jämför TomTom, Tesla, Plugshare, Google Maps och ChargeX. De vanligaste
algoritmerna för att hitta kortaste och billigaste vägen är Dijkstras, A* och Bidirectional A*.
De ger rimliga lösningar till det så kallade ”shortest path”-problemet. Algoritmerna kan
förbättras genom att låta dem ta hänsyn till trafikflödet, restiden och avståndet mellan
ursprung, destination och tillämpa dem som viktningar av bågarna i grafen. Det som har störst
inverkan på den slutliga rutten är valet av laddstationer. Algoritmen för att välja laddstationer
kan optimeras på flera sätt, till exempel genom att överväga information i realtid om
laddningsstationerna, prioritera motorvägar, beräkna temperatur- och höjdpåverkan på
batteriet eller prioritera snabbladdare såsom Tesla gör med sina superchargers.

Keywords
Charging station, Electric vehicles, Routing API, Navigation API, Routing Algorithm,
Pathfinding algorithm, Map visualization
Contents

Table of Contents
1. Introduction ........................................................................... 7
 1.1 BACKGROUND.............................................................................................................7

 1.2 PURPOSE AND RESEARCH QUESTIONS.........................................................................8

 1.3 DELIMITATIONS ..........................................................................................................8

2. Theoretical background ........................................................ 9
 2.1 WEIGHTED GRAPH ......................................................................................................9

 2.2 SHORTEST PATH PROBLEM .........................................................................................9

 2.3 DIJKSTRA’S ALGORITHM.............................................................................................9

 2.4 A* SEARCH ALGORITHM .............................................................................................9

 2.5 RELATED WORK ........................................................................................................10

 2.6 DIFFERENT WAYS OF CHARGING ..............................................................................10

 2.7 TEMPERATURE IMPACT ON BATTERIES .....................................................................10

3. Method and implementation .............................................. 11
 3.1 FOCUS .......................................................................................................................11

 3.2 LITERATURE REVIEW ...............................................................................................11

 3.3 CONDUCTING THE RESEARCH ...................................................................................11

 3.4 SELECTING CAR MODELS .........................................................................................12

 3.5 DECIDING ON WHICH APIS TO RESEARCH ................................................................13

 3.6 CHOOSING WHICH APIS TO IMPLEMENT ...................................................................14

 3.7 DESIGN OF EXPERIMENT ...........................................................................................14

4. Findings and analysis ........................................................... 15
 4.1 FINDING TECHNOLOGIES AND ALGORITHMS ............................................................15

 4.2 MAPBOX ANALYSIS ..................................................................................................15

 4.3 BIDIRECTIONAL A* ...................................................................................................15

 4.4 THE TRAVELING SALESMAN PROBLEM ....................................................................15

 4.5 GOOGLE MAPS ANALYSIS .........................................................................................16

 4.6 PLUGSHARE ..............................................................................................................16
Contents

 4.7 TOMTOM...................................................................................................................16

 4.8 OPEN CHARGE MAP ..................................................................................................17

 4.9 COMPARING CHARGING STATION APIS ...................................................................17

 4.10 CS API ANALYSIS ....................................................................................................19

 4.11 EXPERIMENT .............................................................................................................20

 4.12 ROUTE ANALYSIS .....................................................................................................21

 4.13 OVERALL ANALYSIS .................................................................................................22

 4.14 AVAILABILITY ANALYSIS .........................................................................................22

 4.15 SPP ALGORITHM ANALYSIS .....................................................................................22

 4.16 ROUTING ALGORITHM DIFFERENCES .......................................................................23

 4.17 IMPROVING THE ALGORITHMS ..................................................................................24

5. Discussion and conclusions ................................................. 25
 5.1 DISCUSSION OF METHOD...........................................................................................25

 5.2 DISCUSSION OF FINDINGS .........................................................................................26

 5.3 CONCLUSIONS ...........................................................................................................28

 5.4 FURTHER RESEARCH .................................................................................................28

6. References ............................................................................ 28
7. Search terms........................................................................ 31
8. Appendices ........................................................................... 32
Theoretical background

 1. Introduction
The fast-developing industry around electric vehicles (EV) is, to a large extent, driven by
environmental concerns. The increasing number of EVs on the roads will create a larger
demand for charging stations (CS). EVs have started gaining popularity in Sweden over the
last decade, in 2008 there were 129 EVs in Sweden, in 2018 the number of registered EVs in
Sweden had reached 16 664 (Stoll, 2019). EVs are therefore more common and have
increased by 96% from 2012-2018 (Wagner, 2019). As an effect of the increasing demand,
the prices have decreased to an affordable level. In this thesis, we have developed an
application for navigating with an EV, it is called ChargeX. The purpose is to compare
ChargeX with existing solutions that help drivers to locate CS. The route is calculated based
on the car brand, connector type, origin/destination, and current battery percentage that the car
has. Some solutions also take the current traffic flow into account when optimizing the route.

Since one of the major difficulties of driving an EV is to locate CS’, the first aim of the study
is to increase driver accessibility for CS.

The existing applications for locating CS’ have issues regarding navigation to the charging
station because CS are not always easy to find. The pathfinding algorithms behind these apps
do not take battery percentage and temperature into account when calculating the optimal
route. The most common pathfinding algorithms for navigation are Dijkstra's and A*
(Algfoor, et.al, 2015). The applications do not take charging into account because most
people do not have EVs and the navigation companies naturally want to increase their
business presence. The second aim of this study is, to find the differences in the pathfinding
algorithms, and to locate why and how they have an impact on, for example, travel time.

The ambition is to collect experiences with different application programming interfaces
(APIs) for testing purposes to reach the aims of this study. The definition of an API according
to Oxford Languages is; “A set of functions and procedures allowing the creation of
applications that access the features or data of an operating system, application, or other
service” ("API: Definition of API by Lexico"). An API can be used for many different things,
in this case the APIs are libraries with CS information and frameworks for Map navigation.

 1.1 Background
The market offers several APIs for receiving data about mapping and routing. The project
focuses on making it easier for drivers of EVs to locate a charging station depending on where
they are. In this thesis we will compare the technologies and algorithms used for a collection
of APIs with the aim to evaluate which combination is the most optimal and why. The
following APIs have been selected for the study: Mapbox, Plugshare, TomTom, and Open
Charge Map.

In this thesis we look at these four APIs because when researching the subject these are the
ones that appear the most in past research. They are well known, created by reliable
organizations and are free to use for testing purposes. One API that we chose to not include in
our research was the HERE EV API because of the need for credentials to use their API. The
process of acquiring the credentials was complicated and evaluation agreements had to be
signed. The optimal result will be the combination of APIs which produces the fastest and
cheapest route combined with easy access to CS. The study will focus on why this
combination gives us that result.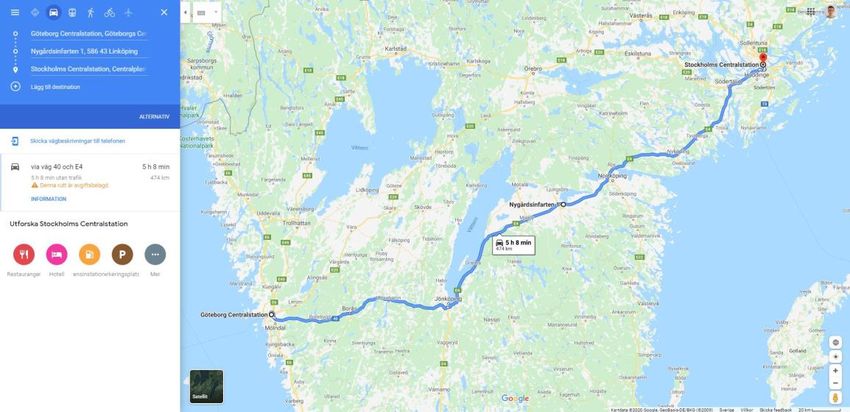
Theoretical background

 1.2 Purpose and research questions
The purpose of this comparative study is to simplify for drivers of EVs to charge their cars
during trips. There exists APIs for electric vehicles and we want to help the community to
find which of these are the most optimal based on the underlying technology and algorithms.

In this thesis, we compare the technology and algorithms used for different APIs and evaluate
which one of them is the most optimal and why. This research looks at why some of the APIs
have a better performance than others and why some of them provide more information.

Research questions:

• How do the technologies and algorithms behind navigation APIs differ from each other?
• What information is provided by the charging station APIs and how do they collect data
 about new stations?

 1.3 Delimitations
We will not create our own navigation system. We will only research existing solutions, using
APIs. Neither will we create our own charging station API since there are good APIs out
there.
Theoretical background

 2. Theoretical background
In this chapter background information is presented to facilitate understanding of the technical
aspect of the thesis. It brings up graphs, algorithms, electronics, and a bit of chemistry and ties
the thesis to previous work.

 2.1 Weighted graph
A weighted graph is a graph where the edges have been assigned with weights. (Glossary of
graph theory, 2020). The weight can be affected by different factors, e.g. distance, traffic, and
time. By finding the route with the lowest total weight from origin to destination, this will
help fulfill the second objective of this study.

 2.2 Shortest Path Problem
The shortest path problem (SPP) is to find a path between two nodes in a graph by minimizing
the sum of weights of its edges. The SPP can be applied to a road map to find the shortest path
between two intersections. It is modeled as a special case of the problem, where the nodes
correspond to the intersections, and the edges correspond to road segments. The weight of the
edge corresponds to the length of the road segment (Shortest Path Problem, 2020).

Dijkstra’s Algorithm and A* are solutions for the SPP for any weighted, directed graphs. An
exception where they cannot find a solution to the SPP is when there are negative weights in
the graph (Fundamentals of Algorithms, 2020). In route planning for EVs, there are never any
negative weighted edges, so this does not apply to this study.

 2.3 Dijkstra’s algorithm
Dijkstra’s is an algorithm for finding the shortest path between two nodes in a weighted
graph. The most common algorithm uses a single node as the origin node and finds the
shortest paths from the origin to all other nodes in the graph, producing a shortest-path tree.
The path complexity is O(V2) where V is the number of nodes. This means that in a graph
with 20 nodes, where a specific node wants to be found the worst-case scenario would be that
the algorithm has to check 400 nodes to find the shortest path. (Dijkstra’s algorithm, 2020)

 2.4 A* search algorithm
Like in the previous case, the A* algorithm begins at the origin and aims to find a path to the
given goal node with the minimal cost. It is an informed search algorithm which means it has
information about the goal to calculate the remaining distance. It does this by maintaining a
tree of paths starting in the origin and extending those paths one edge at a time until a goal
criterion is satisfied. In each iteration, the algorithm determines which path to extend based on
the cost of the path and the estimate of the cost required to extend the path to the goal. A*
selects the path that minimizes ( ) = ( ) + ℎ( ) where n is the next node on the path.
g(n) is the cost of the path from the origin to n, and h(n) is a heuristic function which
estimates the cost of the cheapest path from n to the goal. A heuristic function ranks the
alternative paths at each branching step based on available information to determine which
path to continue with. (A* search algorithm, 2020). Apart from ordinary A*, the Bidirectional
A* utilizes the same principle as A*but starts from origin and destination. The Bidirectional
A* will be described in chapter 4.3.
Theoretical background

 2.5 Related work
The algorithms behind today's navigation/routing applications for EVs are based on physical
and mathematical equations. Bedogni et al. (2014) offers a thorough explanation for optimal
route finder algorithms, and Breuer-Lábady (2019) discusses EVs, route planning, and offers
conclusions on the Single-Pair Shortest Path problem, like Dijkstra’s and A*.
 2.6 Different ways of charging
There are different ways of charging an EV. You can charge it either in your garage with a
charger that fits your car model, or you can charge on the road with a charging station.
Different cars have different charge time and battery capacities. Depending on the connector
type the output differs as described below:
 Connector type Output
 Type 2 7.4 – 22 kW
 CHAdeMO ~50 kW
 Tesla Supercharger ~150 kW
 CCS ~50 kW
Table 1, Connector type
 2.7 Temperature impact on batteries
The temperature effects that occur on batteries have to do with the chemical reactions that occur
in the batteries as well as the materials they are made of. The relationship between the rate of
the chemical reactions and temperature follows the Arrhenius equation (Arrhenius equation,
2020).
 −
 =
 k is the rate constant;
T is the temperature in kelvin;
A is the pre-exponential factor, which is a constant for each chemical reaction. It can also be
explained as the frequency of collisions. With a unit of s-1, which is why it is often called the
frequency factor.
Ea is the activation energy for the reaction;
R is the universal gas constant, 8.314 J/(mol * K)

The Arrhenius equation’s rate constant affects how fast the battery discharges. Besides
following the Arrhenius equation, the temperature variation in the battery can lead to the change
of electrochemical reaction rates. The conductivity of the electrodes and the electrolytes are
also affected by temperature. The conductivity rate of the salt electrolytes that are used in
lithium-ion batteries decreases at low temperatures, which in turn decreases the battery’s charge
capacity. (Ma, et al., 2018)

A Lithium-ion battery has its optimal capacity at 20-25°C. It loses 95%
of the capacity when going from 25°C to -40 °C, and it loses
approximately 23% of the capacity when it is going from 25°C to -15°C.
For example, if an EV has a range of 300 km at 25°C it only has a range
of 231 km at -15°C, and a range of15 km at the extreme temperature of -
40°C. (Ma, et al., 2018)

 Figure 1,
 temperature impact
 on batteries
Search terms

 3. Method and implementation
Information about APIs was collected by reading and analyzing their documentation. Prior
research papers were also considered. To find prior research a literature survey was
conducted. ChargeX provides valuable information to the experiments, by implementing an
API combination that does not already exist, the combination that was chosen is Open Charge
Map and MapBox.

 3.1 Focus
The focus of the project is on map APIs and Charging Station APIs for EVs. There are some
different EVs, e.g. bikes, cars, and hybrids but here the focus was pure electric cars.
Hybrids are not included because they are able to operate with other fuels. This would
complicate the calculations for when and where the cars need to be charged. It is impossible
to calculate how far the hybrid can drive without direct access to the car's data.

 3.2 Literature Review
The scientific articles were found using the research databases Google Scholar, Primo and
Scopus. Google Scholar is a database with scientific articles, patents and more, accessible for
free. Primo is a search tool for scientific papers that is provided by Jönköping University.
Scopus is a database from Elsevier, containing peer-reviewed literature and quality web
sources.

The literature review began after we had decided the main idea of the project and the research
field was defined. To begin with, the search terms/keywords only consisted of one word,
“Mapbox” which we got from our supervisor Emil at XLENT. In the second search iteration,
the keyword list was extended with the following words, GIS, Navigation API, Charging
station, and Electric Vehicle.

After the literature search and collection of relevant papers, the more in-depth analysis of the
papers began. The papers were sorted into folders by topic and relevance. After this stage, only
the most relevant papers to our research were saved. The literature review is an iterative process
which is why we were open to returning to this stage throughout the research process.

 3.3 Conducting the research
The research of the APIs is mainly focused on the technologies and algorithms behind each
API. How the technologies and algorithms act when implemented is what is compared to
conclude which of the APIs are the most optimal for EVs.

Comparison criteria for the different APIs are as follows:

• Compare technologies and algorithms behind navigation APIs
 o What makes a navigation API optimal for us?
 ▪ Lowest travel time, including charging time if needed
 ▪ Adapt to current traffic flow
 ▪ Maps are up to date
 ▪ Multiple route choices
• Compare technologies and algorithms behind CS APIs
 o What makes a charging station API optimal for us?
 ▪ Information about connector type
 ▪ Up to date on charging station locations
 ▪ How many chargers there are
Search terms

 ▪ Does the API allow users to give comments about the charging
 station?
 ▪ Does the API have information about if someone is currently
 charging?

 3.4 Selecting Car Models
For ChargeX a collection of car models were chosen. The purpose of including car models is
to get the correct distance that a specific car model is capable of traveling. This information
becomes important when we want to evaluate if the car needs to charge or not. The capacity of
the battery is an indicator of the maximum distance the car can travel. Since the battery can be
affected by temperature, the distance will decrease if the temperature decreases. A variety of
cars from different car brands were selected, since each car had to be manually entered into the
code it was not possible to include all EVs.

Our choice is based on the frequency of sales both worldwide and in Sweden. The sales data
has been collected from (Power Circle. 2020) and (Shaulova, E., & Biagi, L. 2020). The car
models that are dominant in both Sweden and worldwide are BMW i3, Tesla Model S, Tesla
Model X, and Nissan Leaf. In addition to these models, Renault Zoe was selected because its
popularity in Sweden.

 THE FOLLOWING MODELS WERE THE FOLLOWING CAR MODELS
 SELECTED, WERE CONSIDERED BUT NOT
 AND THE REASON WHY: INCLUDED:
 Nissan Leaf Polestar 2
 (Nissan, 2020) (Polestar, 2020)

 One of the most common EVs. Price: 659 000 SEK
 It is not very expensive. Not easily accessible
 Range: 385 Km Range: 470 Km
 Priced from 397 000 SEK It is not an established brand; the number
 of cars is very slim.
 Renault Zoe Nissan NV200
 (Renault, 2020) (Nissan, 2020)

 One of the most common EVs. Price: 444 150 SEK
 It is not very expensive. Range: 200 Km – 301 Km
 Range: 210 Km The focus is on private consumers, and
 Price from 286 990 SEK this is a work van.

 Hyundai Ioniq Volkswagen ID-family
 (Hyundai, 2020) (Volkswagen, 2020)

 Price from 389 900 SEK The ID-family is not in production yet.
 Range 311 Km
 Tesla Model 3
 Tesla Model X (Tesla, Design Your Model 3, 2020)
 (Tesla, Design Your Model X, 2020) We already have two Tesla models and
 we prioritize diversity.
 Very long range
 Long-range model 507 km Standard
 Expensive, price from 1 034 900 SEK Range: 409 Km
 Popular car Price: 549 900 SEK
 Long Range
 Range: 560 Km
Search terms

 Price: 659 900 SEK
 Performance
 Range: 530 Km
 Price: 699 900 SEK

 BMW i3 Tesla Model Y
 (BMW, 2020) (Tesla, Design Your Model Y, 2020)

 Cheaper BMW models. Tesla Model Y was released during the
 writing of this thesis.
 Price i3s: 439 200 SEK Long Range
 BMW i3s range: 283 km Range: 505 Km
 Price: 719 000 SEK
 Price i3: 419 200 SEK Performance
 BMW i3 range: 307 km Range: 480 Km
 Price: 769 000 SEK
 Tesla Model S Tesla Cybertruck
 (Tesla, Design Your Model S, 2020) (Tesla, Design Your Cybertruck, 2020)

 The longest range on the market Not on the market, at the time of writing
 Long-range model 610 km of this thesis
 Expensive, price from 939 900 SEK Single Motor RWD
 Popular car Range 400+ Km
 Dual Motor AWD
 Range 480+ Km
 Tri-Motor AWD
 Range 800+ Km
 3.5 Deciding on which APIs to research
We searched for Map navigation and CS APIs in the research papers that we had found. The
terms that were considered when conducting the search were e.g. GIS, navigation API,
Charging station API. From these key terms, the keywords that were chosen to search for in
research articles were: Tomtom, Mapbox, Open Charge Map, Plugshare, GIS, Google Maps
API.

Categorization of APIs
 Type of Price Waypoints Routing Misc.
 API
 MapBox API Map Free Yes Yes Bidirectional A*,
 TSP
 Google API Map 5$ < Yes Yes Dijkstra’s
 Google API Map Free No No Static map
 TomTom Map + CS Free Yes Yes A*
 Open Charge CS Free Yes -
 Map
 Plugshare CS Only Yes Yes It only gives
 commercial access if a
 use company is
 stakeholders in EV
 development.
Table 2, categorization of APIs.
Search terms

 3.6 Choosing which APIs to implement
A combination of Mapbox and Open Charge Map were implemented because these APIs were
the most accessible and had relevant documentation that could be used. We decided not to
implement Googles map API because a free alternative with routing included was desired. We
decided not to implement TomTom because they already have an application where you can do
the experiments we have decided to conduct. So, we can get data from there to compare it with
our implementation. We decided to use Open Charge Map because the other alternative was
Plugshare and they do not provide API keys to private developers.

 3.7 Design of experiment
The experiment tests three routes, namely Jönköping – Gothenburg (144 Km), Gothenburg –
Stockholm (473 Km), and Malmö – Stockholm (613 Km). These were selected because they
are common and well-trafficked routes, with predominantly highways. Therefore, CS should
be easily accessed.

Each route was tested at the same time during the day to make the conditions as similar as
possible. We tested each route with five different applications, which are listed below:

• ChargeX
• Tomtoms app (https://mydrive.tomtom.com/)
• Plugshares website (https://www.plugshare.com/)
• Tesla's app (https://www.tesla.com/sv_SE/trips?redirect=no)
• Google Maps (https://www.google.com/maps).

Pre-requirements for each experiment:

• The same car model should be used for each test.
• Start with the same amount of charge for each test.

For each test we seek answers to these questions:

• Number of charging stops
• Does it calculate the route with charging stops automatically?
• Travel time
• Charging time
• Total time
• What is the calculated distance?
• How is it available?
 o A mobile app, website, both? is registration required?
• How user-friendly is it?
 1 2 3 4 5
 Can create Can create Can create Can search 4 + adds
 a route a route, a route, for the time for
 with CS with CS destination, charging
 and time adds
 for charging
 charging stations
 Table 3, Scale of how we measure user-friendliness
Search terms

 4. Findings and analysis
 4.1 Finding technologies and algorithms
To figure out which technologies the different APIs use we started by looking for information
about it on the APIs websites, we soon realized that it is not something that companies want
to share openly. So, we wrote an e-mail to each of them asking about which technologies and
algorithms they use, for Map APIs we asked about navigation and routing, for CS APIs we
asked what they use to gather data.

 4.2 MapBox analysis
“We are utilizing a bidirectional A* search algorithm starting from both origin and
destination.” - (Förster, 2020).
MapBox uses the Traveling salesman problem (TSP) to optimize their route (Navigation
service, 2020).

 4.3 Bidirectional A*
The benefits of a bidirectional A* compared to an ordinary A* search is time efficiency. The
normal A* search starts from the origin and uses a heuristic (e.g. Manhattan distance) to find
the shortest single path from origin to destination. This results in a big O time complexity of
O(bd) where b is the branching factor of the search tree and d is the distance (nodes) from
origin to destination. Because the bidirectional search optimally only needs half the distance,
from origin to the middle and from destination to the middle (Figure 2 (Holte, R. et al, 2017))
it becomes a lot faster than the normal A*. The big O notation then becomes O(bd/2) + O(bd/2).

Here follows an example of the time difference between A* and bidirectional A*:

b (branching factor) = 4
d (distance) = 10

A* O(bd) = 1 048 576
Bidirectional A* O(bd/2) + O(bd/2) = 2 048

A downside with a bidirectional A* search is that it is only beneficial when the two searches
meet in an early halfway point. If the two search trees grow in the wrong direction compared
to each other the time complexity could end up worse than the normal A*.

Figure 2 (Holte, R. et al, 2017)
 4.4 The Traveling Salesman Problem
The Traveling Salesman Problem (TSP) can be modeled as an undirected weighted graph,
where cities are the graph's vertices, roads are the graph's edges and a road’s distance are the
Search terms

edge’s weight. It is a minimization problem starting and finishing at specified vertices, after
having visited each vertex exactly once. If no path exists between two cities, an arbitrary long
edge will be added to complete the graph without affecting the optimal route (Travelling
salesman problem, 2020).

 4.5 Google Maps analysis
Travel time is the primary factor for optimizing routes, but it also considers the number of
turns and the distance from the origin to the destination (Google Developers, 2020)

Google maps use Dijkstra’s pathfinding algorithm to find the most optimal routes based on
the previously named criteria (time, number of turns, and distance). In this case, the edges in
the graph represent the roads and the different criteria represent the weights for each edge.

 4.6 Plugshare
Plugshare does not support personal, academic, or any non-commercial licenses to use their
data. The API is only available for EV industry stakeholders. Plugshare has limited resources
and therefore can only support its existing partners. This is why they will not allow us to
implement their services, but they have a website where you can plan a trip. We use the
website to conduct the experiments, to compare with our implementation and the other
applications.

 4.7 TomTom
IQ Route
IQ Route is a smart routing system developed by TomTom. It is based on user collected data
containing the velocity in which the drivers are going on specific streets and at what time on
the day. Based on this information the IQ Route system takes the traffic flow into account and
estimates the fastest route to the destination. The system starts with finding a variety of different
routes and then chooses the fastest one as seen in Figure 3 (TomTom International BV, 2019).
For example, during times with low traffic its faster to drive through a circulation place but
during peak traffic hours it is faster to take another route to avoid getting stuck in traffic.

Figure 3 (TomTom International BV, 2019)

EV Service
TomTom EV Service provides information about charging opportunities for EV drivers. This
information contains locations and details about charging stations as well as real-time
availability for the different charging points of each station.
Search terms

They use a functionality called the dynamic feed that provides frequently updated information
on the availability of charging points.

 4.8 Open Charge Map
Open charge map is an open API that provides information about charging stations, their data
is mainly collected through voluntary collaborators and tends to have a high quality (Zeng et
al., 2019).

According to the developer of Open Charge Map, Christopher Cook, their first import of data
in 2011 was from the US AFCD (US government, "EERE: Alternative Fuels Data Center Home
Page") which seeded their database with a few thousand charging locations. They added more
imports manually where there was open or public data and they were authorized to import it as
time went on, but over the past few years, it has been rare for them to add any more imports.
Most charging networks see their charging location data as a valuable asset and will license its
use, which means Open Charge Map has to source the data from users directly. Currently, 54%
of the data is crowd-sourced, which means it was manually entered by users. A downside with
relying on crowd-sourced data is that acquiring and maintaining a large community of people
willing to make edits and submit new entries is a big challenge. It is very common that users
complain that Open Charge Map data is incomplete or inaccurate without realizing that they
are the only source of accurate data. (Cook. C, 2020). Appendix 21, Open Charge Map
information.

Open Charge Map was the API that was used in our application. It is easy to use and understand
while providing a lot of information about the charging stations. There is no need for any API
keys to use open charge map which makes it convenient and quick to get started. Open charge
map is the largest provider of CS locations and they also have a mobile application with a
community approach. In the app, users can contribute by commenting, checking-in, and adding
photos to the charging stations, which contributes to the crowd-sourcing problem that they have.

 4.9 Comparing Charging Station APIs
This part displays and compares information about the charging station APIs. Some irrelevant
information is left out for example ID’s and other types of data that are not relevant for this
comparison.

Open Charge Map
Information gathered from API and (Open Charge Map.org, 2020)

• User comments:
 o “Easy access and free of charge!”
• Provider information:
 o NOBIL by Transnova, Norway is licensed under Creative Commons 3.0 Unported
 License
• Address information:
 o Hamnplansgatan 3
• Distance left:
 o 0.3 km
• Connector types:
 o Type 2
• The number of connectors:
 o 3
• Charger information:
Search terms

 o Voltage, Power Kw
• Access comments:
 o “On the parking lot by the sea”
• Usage cost:
 o True

Plugshare
Information gathered from (Plugshare, 2020)

• Cost
 o True/False
• Name
 o Name of parking structure or business
• Description
 o Describing the location
• Number of connectors
 o 3
• Score
 o Between 1 – 10.
 o Score is based on reviews and may also be affected by cost, available power, and
 other factors.
• Address information
 o Hamnplansgatan 3
• Reviews
 o Comments from users
• Access
 o Number 1-3
 1: A public location
 2: A restricted location. Not available for general public use. Examples include
 workplace charging and car dealerships with charging policy restrictions.
 3: A residential location that has been shared. Not available for public use
 without prior permission.
• Poi_Name
 o Point of interest, e.g. park, restaurant
• Hours
 o Opening hours. Often 24/7
• Cost description
 o "$1/hour: first 4 hours. $20/hour thereafter. 50 cent minimum. Fees continue
 while the car is connected even if not charging."
• Photos
 o Photos of the charging location
• Outlets
 o Describes the connector types and output voltage
• Distance left
 o 0.3 km

Tomtom
Information from (TomTom International BV, 2020, EV Service)

• Remaining Charge at Arrival
Search terms

 o The estimated battery charge in kWh upon arrival at the end of the leg or the route.
• Total Charging Time in Seconds
 o The estimated time in seconds spent at the charging stop, allowing for some
 additional time needed to use the charging facility.
• Connector types
 o A list of charging connections, one of which should be used at this charging stop.
 It contains one facility type and one plug type which are compatible with the
 vehicle.
• Charging time
• Charger voltage

EV charging station availability API, (Separate API)

• The EV Charging Stations Availability endpoint provides information about the current
 availability of charging points.
 o The station id is sent to this API to check the availability of that specific station

 4.10 CS API Analysis
The charging station APIs that are compared are Open Charge Map, Plugshare, and TomTom.
Tesla was left out of this comparison because of the lack of information about their charging
station API.

All the APIs provide the basic and most necessary information such as an address, number of
chargers, costs, opening hours, and what type of chargers that exists. There are some significant
differences between the APIs. Open Charge Map and Plugshare have two different ways of
describing the charging stations. Open Charge Map uses a community approach that lets the
users upload comments and pictures about the charging stations to make the community aware
of important information. Plugshare also has a function where users can review charging
stations but in the API the reviews are represented by a score from 1-10. Plugshares API
describes the location. TomTom does not provide any description or review functionality.

TomTom has an API that can provide real-time availability information about the charging
stations. This is a unique feature that we have not seen in other APIs. With this information, the
route planning algorithms can be improved to plan smarter routes based on where there is a
charger available.
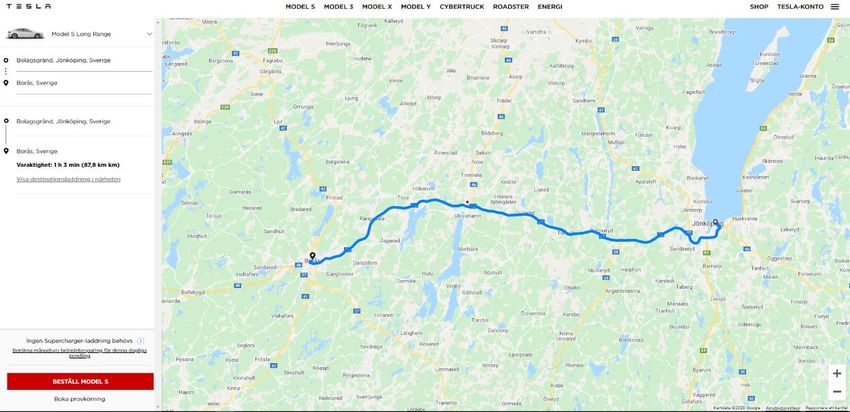
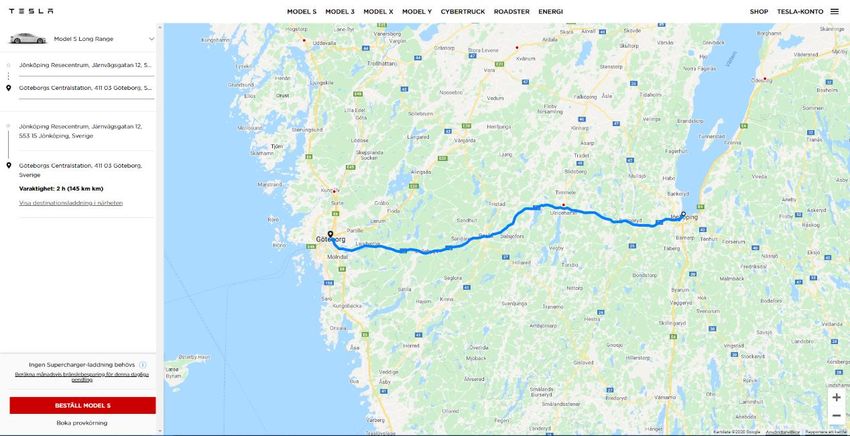
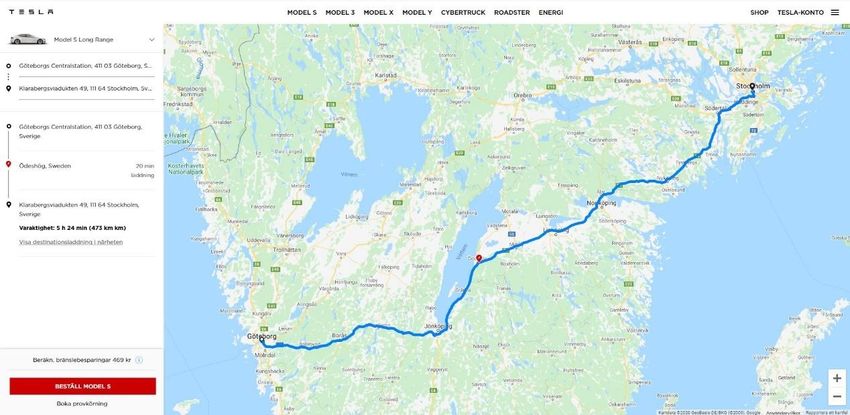
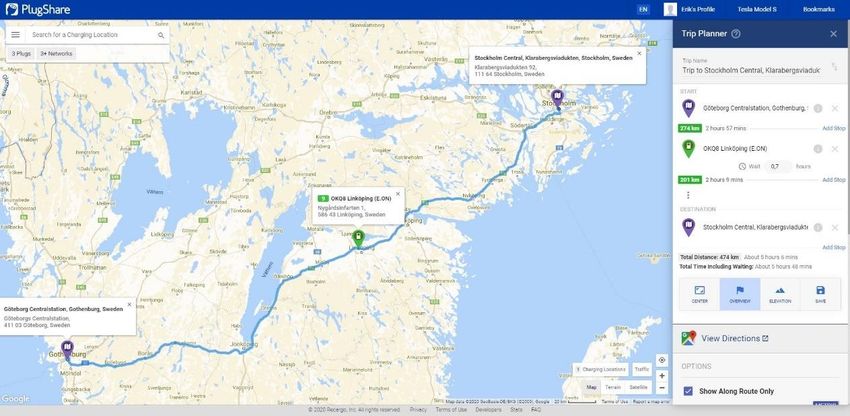
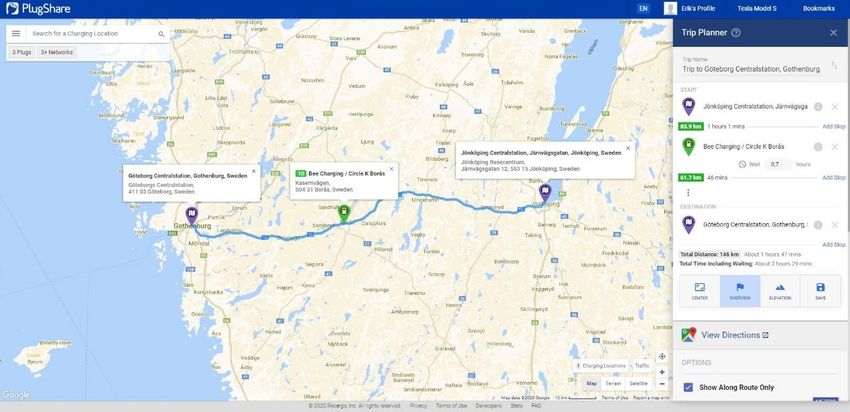
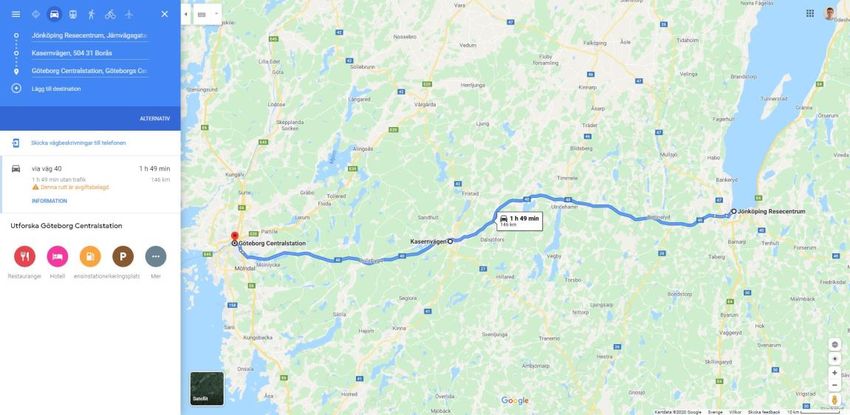
Search terms

 4.11 Experiment
Questions:
Qp1 = How user-friendly is it? 1-5 scale described in Table 3, Scale of how we measure user-
friendliness.
Qp2 = Which platforms are available?
Qp3 = Which platform we used.

Q1 = Number of charging stops?
Q2 = Does it calculates the route with charging stops automatically?
Q3 = Travel time?
Q4 = Charging time?
Q5 = Total time?
Q6 = What is the calculated distance?

Prerequisites
 ChargeX TomTom Plugshare Tesla Google Maps
 Battery 30% (set) 30% (chosen) 30% (chosen) 100% (set) 30% (chosen)
 level
 Qp1 3 2 4.5 5 1
 Qp2 App App, Web, App, Web App, Web, Car App, Web, Car
 GPS unit
 Qp3 App Web Web Web Web
Table 4, Prerequisites for experiment
(AY) = Add Yourself
(NN) = Not Needed
(set) = decided in application
(chosen) = decided by us and added manually

Gothenburg to Stockholm Experiment time: 11:30 – 11:45
 ChargeX TomTom Plugshare Tesla Google Maps
 Q1 1 1 1 1 1
 Q2 YES NO YES YES NO
 Q3 6h 4m 4h 32m 5h 6m 5h 24m 5h 8m
 Q4 42m 42m (AY) 42m (AY) 20m 42m (AY)
 Q5 6h 46m 5h 14m 5h 48m 5h 44m 5h 50m
 Q6 502km 471km 474km 473km 474km
Table 5 Gothenburg to Stockholm
Jönköping to Gothenburg Experiment time: 11:15 – 11:30
 ChargeX TomTom Plugshare Tesla Google Maps
 Q1 1 1 1 0 1
 Q2 YES NO YES YES NO
 Q3 1h 54m 1h 38m 1h 47m 2h 1h 49m
 Q4 42m 42m (AY) 42m (AY) (NN) 42m (AY)
 Q5 2h 36m 2h 20m 2h 29m 2h 2h 31m
 Q6 144km 148km 145km 146km 146km
Table 6 Jönköping to Gothenburg
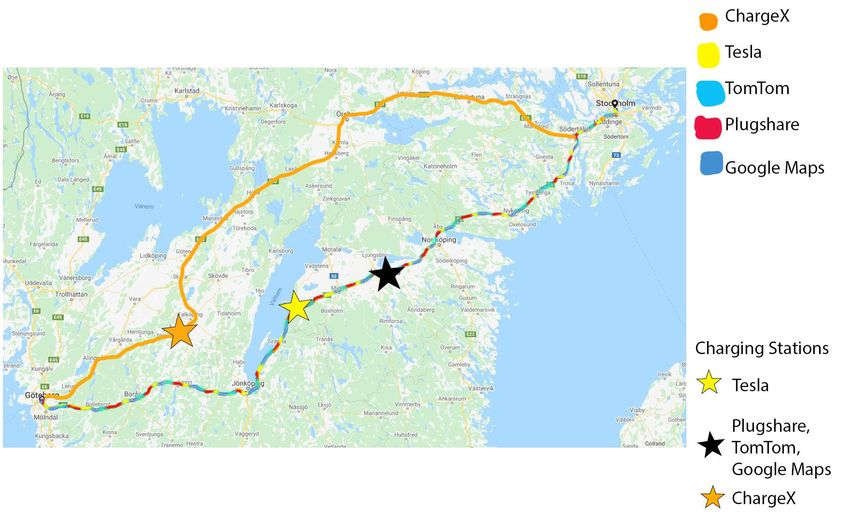
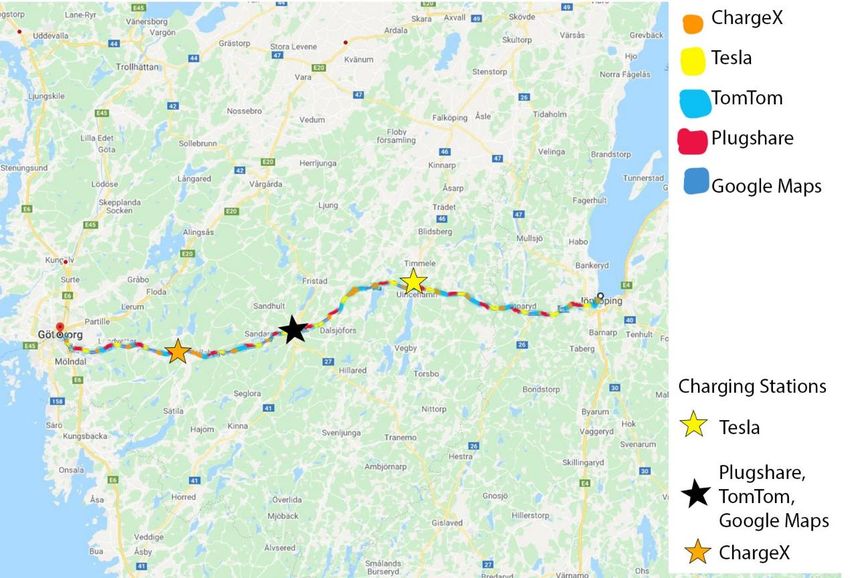
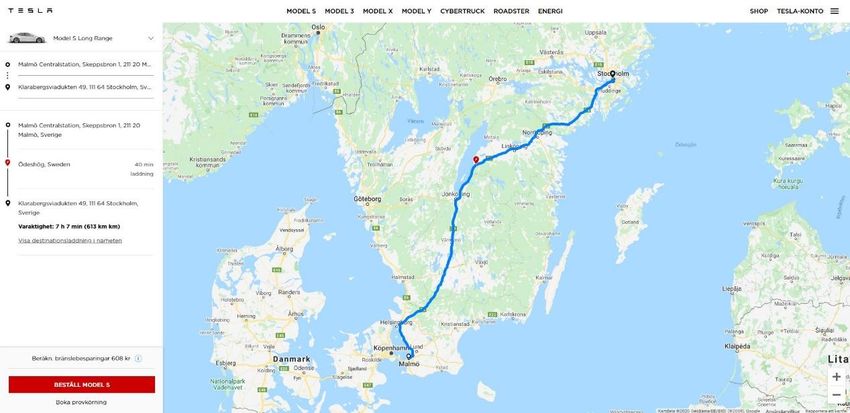
Search terms

Malmö to Stockholm Experiment time: 11:45 – 12:00
 ChargeX TomTom Plugshare Tesla Google Maps
 Q1 2 2 2 1 2
 Q2 YES NO YES YES NO
 Q3 7h 9m 5h 54m 6h 33m 6h 27m 6h 33m
 Q4 1h 24m 1h 24m (AY) 1h 24m (AY) 40m 1h 24m (AY)
 Q5 8h 33m 7h 18m 7h 57m 7h 7m 7h 55m
 Q6 640km 617km 615km 613km 616km
Table 7 Malmö to Stockholm

 4.12 Route Analysis
Jönköping – Gothenburg
(Appendix 19, Jönköping – Gothenburg, Merged all routes result)

Is the route the same for each application?
 The route is the same for each application, this is because there is only one main road
between the cities, which makes it the fastest route.

Are the Charging stations the same or do you have to choose them yourself?
 ChargeX chooses to charge in Bollebygd which is the closest charging station to
Gothenburg out of the results. Tesla charges in Ulricehamn at a supercharger, Tesla's algorithm
prioritizes superchargers over other types. For the rest of the applications we chose one of the
charging locations that Plugshare offered, we chose one in Borås.

Gothenburg – Stockholm
(Appendix 18, Gothenburg – Stockholm, Merged all routes resultAppendix 18)

Is the route the same for each application?
 The only application that deviates completely from the most common route is ChargeX,
which drives through Örebro instead of taking the E4 highway.

Are the Charging stations the same or do you have to choose them yourself?
 The reason ChargeX deviates is because it charges the car outside of Falköping. Tesla
charges in Ödeshög and the rest of the applications charge in Linköping. Plugshare gives you
options for charging locations along the route, we chose the charging station and then used
that charging station for the applications that do not add charging.

Malmö - Stockholm
(Appendix 20, Malmö – Stockholm, Merged all routes result)
Is the route the same for each application?
 The route is the same for all applications except for ChargeX. The reason that ChargeX
deviates from the route is because it charges in Hästveda.

Are the Charging stations the same or do you have to choose them yourself?
 The other applications charge higher up in the county which is why they take the
Helsingborg route because the E4 highway starts there.

 All of the applications except for Tesla charge one last time in Stockholm so that the car
has enough battery to drive around when the goal has been reached. Once again Tesla chooses
Search terms

to charge at a supercharger over other chargers, which is why it reaches the destination the
fastest.
 4.13 Overall analysis
TomTom has lower estimated travel time compared to all the others, in all cases. A good
example is in Table 7 Question 3. This might be because we checked a box so that it would
consider traffic flow. But then again Google Maps has a very good traffic flow algorithm, which
makes it feel like TomTom’s algorithm is over-optimistic.

A conclusion from the experiment is that Plugshare, Tesla, and Google Maps use similar traffic
flow predictions. Because as seen in the experiment the travel time of these three solutions is
the same with small deviations.

Because Tesla has an in-car trip planner, it is more reliable when it comes to reaching the
charging station before running out of battery, because it can calculate how much energy is
being used.

According to the experiment result, Tesla is mainly focusing on reaching the destination in the
fastest time. Therefore, it only charges the amount that is needed to reach the destination as
seen in Appendix 2 and Appendix 12. This, of course, reduces the total travel time but could be
a disadvantage if you are not able to charge the car at the destination. This could lead to that
you need to charge almost immediately at the start of the next route.

 4.14 Availability analysis
Tesla’s application is only available for Tesla vehicles which makes it less available, but the
solution is better for those who have a tesla.

ChargeX is available for the car models stated in the chapter Selecting Car Models.

Plugshare is available for most EVs including all of the ones in this thesis. In
Plugshares application users have to create a profile, where they add the car model they have.
Then users can filter manually on connector types if they want to charge using a specific
connector.

TomTom has an EV Service API available for developers, but we cannot find an application
from TomTom that uses the EV service. The service is only available for their GPS units
(Tomtom EV Services Product Sheet, 2019). To get a result from TomTom we used their
normal GPS service and added charging stops manually to get a result. Since the EV service
that TomTom provides is for GPS devices, we used their basic navigation application. It
negatively impacted the result we got, because the normal GPS service was not created for what
we tested it for.

 4.15 SPP Algorithm Analysis
Dijkstra’s and A* are both greedy algorithms and as previously explained in the Theoretical
Background chapter, both algorithms find the optimal path. Then, what is the difference
between them?

A* is an optimized variant of Dijkstra’s which uses a cost function to find the right path faster.
This requires the cost function to be admissible which means that the estimated cost always
should be lower than the real cost. This optimization makes A* both faster and less memory
consuming than Dijkstra’s (Schlotfeldt, B., Atanasov, N., & Pappas, G. J. 2019). That is why
A* is the algorithm that for certain the majority of map and navigation systems uses.
Search terms

The A* algorithm could be improved either by calculating the cost with different parameters
such as travel time left, distance left or a combination of both, MapBox uses bidirectional A*.
The bidirectional A* can be a big improvement in time and memory consumption compared to
ordinary A* (Bidirectional A*). To conclude the SPP algorithm analysis, no algorithm is
superior in the form of finding a more optimal path. The only advantages between the different
algorithms are calculation times and memory consumption which is not the focus of this study.

 4.16 Routing Algorithm Differences
The majority of the companies do not want to share the details about the algorithms that they
use, but after researching the field we have a good understanding of what algorithms that are
the most optimal. As shown in the experiment all the applications get almost the same calculated
distance which indicates that they are using similar underlying algorithms for finding the
shortest path. They are most likely using A* or a variation on A*. The reason why the
companies are making changes to the algorithms and do not want to share their exact solutions
is not because their solution can find a better path than the competitors, but it is more efficient.
In this thesis, the primary goal is not to find the algorithm that calculates the route the fastest
or uses the least amount of memory. The focus is on the result i.e. what route the algorithm
recommends and how fast it is.

Only two out of these five applications calculate the route and automatically include charging
stations. The first one is our application ChargeX and the second one is the Tesla application.
As you can see in the experimental results, ChargeX and Tesla get different route suggestions.
This is not because of the shortest path algorithm but the different charging station locations.
Tesla uses Google Maps to calculate the route and ChargeX uses Mapbox. A good example
where we clearly can see that Tesla and ChargeX use a similar or the same shortest path
algorithm is in Appendix 16 and Appendix 17 which shows a route without any charging
stations added. The route and travel time are the same when there are no charging stations
added. This shows that the choice of charging stations is highly important when creating the
optimal route.

There are some significant differences between Tesla and ChargeX when it comes to
choosing charging stations. The first and most obvious difference is that Tesla’s web app
always assumes that the car is fully charged when the trip begins, unlike ChargeX where the
user can set their current battery level. This affects when the applications want the car to
charge for the first time and as a result of that, it also affects all the upcoming charging
locations.

We need to consider that ChargeX is still being developed, it still contains bugs and does not
always pick the best route or charging station. Tesla, on the other hand, plans the route in a
smart way. It takes the remaining distance between charging stations and the distance that is
left to the destination into account. For example, Tesla only charges the amount that is
necessary in comparison with ChargeX that is set to always charge from 15% to 80%.
According to (Lee and Clark, 2018) Li-ion batteries do not charge linearly. Up to 80%, the
batteries are charging faster than the last 20% because the charger needs to lower the speed to
avoid damaging the batteries. Another reason not to charge fully according to Tesla´s CEO
Elon Musk is because the regenerating braking system does not work on fully charged
vehicles. (Musk, 2019)

Another difference between ChargeX and Tesla’s algorithm is that Tesla’s goal seems to be to
have as few charging stops as possible. In other words, the weights of the edges in Tesla’s A*
graph is affected by the number of charging stops. For example, it would avoid charging two
times if it instead could charge for a longer period in the same place. Tesla themselves have
not confirmed this theory but according to our experiments and research, it is most likely the
Search terms

case. To conclude, what makes a good routing algorithm is not if you use Dijkstra’s or A* but
how you adapt them to choose the most optimal charging stations on the way.

 4.17 Improving the algorithms
If the algorithm could take temperature into account when calculating the route, it would
become more precise, since low temperatures lower the battery capacity (Erdinc, et al., 2009)
as we also state in the theoretical background chapter. Tesla even has a Battery Preconditioning
feature in the cars which heats the battery if the temperature is too low. This is to avoid draining
the battery too fast or damaging the battery during supercharging.

One way of adding temperature awareness to the algorithm is to implement a weather API into
the algorithm which fetches the current temperature and based on the temperature adjusting a
variable that affects the range of the car. Tesla would be able to use sensors on the car to
calculate this, but for everyone else who is not directly linked to the car they need to use an
API. If the variation in range could be calculated in real-time and included in the routing
algorithm the final route estimation would become more precise.

If the algorithm could take the differences in altitude into account, it could be more precise
when calculating how much energy will be spent during a trip (Bedogni, 2014). More energy
is consumed by the car when the altitude increases which makes it relevant to include in the
algorithm. For example, it would be preferable to pick a charging station where the altitude
increases the least.

If the application were connected to the car’s battery, it could dynamically change the route
depending on the battery life. It could add and remove charging stops depending on the car’s
battery, turn off systems to save battery in dire situations where the battery is getting low, etc.

All of these improvements would lead to a more realistic result when it comes to estimating the
route from origin to destination including charging stops. A lot of solutions that exist today do
not have these features which often leads to over-optimistic travel time estimations. It is
resulting in the need to do more charging stops than planned. It is also harder to plan when to
arrive at the destination and increases the anxiety of running out of battery.
Search terms

 5. Discussion and conclusions
After conducting this research about “Comparing the technologies and algorithms behind
mapping and routing APIs for electric vehicles” some novel conclusions and analyses have
been made. Some things have gone as planned and some things have not gone as planned.

 5.1 Discussion of method

The method started by narrowing down the focus, then conducting a literature review. In
retrospect, the literature review should have been more extensive and done methodically. The
searches were not saved which should have been done, the keywords were saved on the other
hand. But all in all, the collection of literature went smoothly. It was an iterative process when
information about a subject was needed, we used a keyword related to the subject to find
relevant information. In the initial collection of literature, everything was saved where we
thought the abstract was relevant. We later went through all the literature and filtered out what
was relevant. It was a good experience to read the literature that was not as relevant, to know
what we wanted to cover and what to leave out.

In conducting the research section, the focus was on collecting information about the APIs and
compared them based on different criteria. The comparison criteria are a list of questions that
were gone through when researching each API, we divided the criteria questions into navigation
and charging, some of the APIs were both navigation and charging, but was not used as both in
the comparison, the only exception was the experiment when it was easier to test the APIs using
their user interface (UI). When looking back, we should have collected more information about
each API before entering this step.

A collection of specific car models was included in the study based on sales statistics and
popularity. These models had a different range and battery capacity which helped us to verify
that ChargeX worked correctly. It also helped us in the experiment where one of the car models
were used. Because of the restricted amount of car models provided in ChargeX, it is not
available for the whole market but a large part of it. A good thing with ChargeX is that it is
implemented in a way, so it is easy to add more car models in the future. The selection of car
models was not something that had a big impact on the result of the study.

The method for deciding which APIs to use was the easiest. We looked at all the CS APIs
websites, used their UIs, and tested their services. Open Charge Map was the one where we felt
that we could do the most good, it is free to use and has a large collection of charging stations.
While Open Charge Map has its UI, we felt like it was lacking, and we wanted to be able to add
CS to a route that Open Charge Map is not capable of. Since Open Charge Map is a crowd-
sourced API it was not the best option for reliability, but if more reliable data is wanted, it costs
money. Open Charge Map was good enough for our experiments and was the right choice to
implement according to us since their UI on the website was the one that was the hardest to use.

Mapbox was chosen as the navigation API since it was free and had everything that we needed.
Mapbox has good documentation and was fairly easy to implement. There was not a choice
when it came to Navigation APIs since Google Maps API costs money unless a static image of
a map is wanted. TomTom was the other option, but since TomTom had its solution to the
research questions, we felt it was unnecessary to implement a second solution that is using the
same API.

The design of the experiment section presents how we planned to execute our experiments, the
only thing that we failed at was testing the experiments at different times during the day. The
Search terms

reason why we wanted different times was a desire to compare how much the traffic flow
impacts the result. Since the traffic flow is not a big part of the research question and the
experiment took longer than expected, we felt like we did not have enough time to do the
experiments two more times. If we would have used the TomTom software that is implemented
in GPS devices instead of their web app the result of the experiment would have been more
precise. The same goes for Tesla's software that is implemented in their cars. The only reason
for not using those solutions is our budget.

Through our method, we have come closer to the answer to our research questions. The methods
that have contributed the most to our goal are experiment and literature review. Experiments
because we got hands-on experience with all the APIs and good comparative results. The
literature review because we found good information about how the temperature affects the
batteries used in EVs, and algorithms used for the shortest path problem.

 5.2 Discussion of findings

As stated in the purpose of this thesis we want to help the electric vehicle community to easily
plan their trips/routes with charging stations and with that relieve some of the anxiety connected
with driving. Our approach to finding the best solution to this problem was to conduct several
experiments and as well as comparing the different variables that the algorithms consider. By
doing this we made some findings that we think will contribute to the research field.

In the experimental section, we present the questions and answers that were asked during the
experiment to reach a satisfactory result. The questions are mostly factual, there is only one
question that could be skewed by our opinion, which is Qp1. We tried to make that question as
factual as possible by making a scale for it, where the application gets points on the scale based
on what features it had. That question should have been rephrased so that it fits the answers for
the scale better. The experiment should have been prepared better. Since we were unprepared
the experiments took longer than expected, and the route results could not be presented in a
good way. If we had thought about how to present the result of the routes before doing the
experiment, the result would have been easier to understand for the readers. We took
screenshots of each route and then added the screenshots on top of one another to create the
combined result, shown in Appendix 18, Appendix 19, and Appendix 20. This solution is hard
to analyze in a good way, but it is somewhat understandable where the different application
chooses to charge.

The route analysis goes through the differences between each application for each route. The
questions, “Is the route the same for each application” and “Are the charging stations the same
or do you have to choose them yourself” are answered in a way so that only the ones that deviate
are brought to light. ChargeX deviates the most, because our way of finding CS, is not as
complex as the other solutions. ChargeX only looks at the maximum distance to CS and current
battery level when deciding which CS to choose. Currently, it looks for CS when reaching 15%
battery level. The route could have been improved by checking for CS earlier along the route,
so that it checks multiple times, and chooses the CS that deviates the least from the original
route. Another thing would be to take charging time into account, and not always charging to
80%. Since this is the way to optimize the route, this is information that no company will give
out, because this is what makes their application better at creating a route. As an example,
TomTom has EV service and IQ route, which optimizes the result, but they do not share
information about how they achieve their results.

In the overall analysis, we draw the final conclusions about the experiments by analyzing
deviations from the results. The availability analysis goes through each application and presents
You can also read