Success Stories on User Engagement - Global Science & Technology, Inc. Success Story 8: Weather Service Providers March 30, 2018 - National ...
←
→
Page content transcription
If your browser does not render page correctly, please read the page content below
2018

Success Stories on User
Engagement
Global Science & Technology, Inc.

Success Story 8: Weather Service Providers

March 30, 2018

                                       Page | 1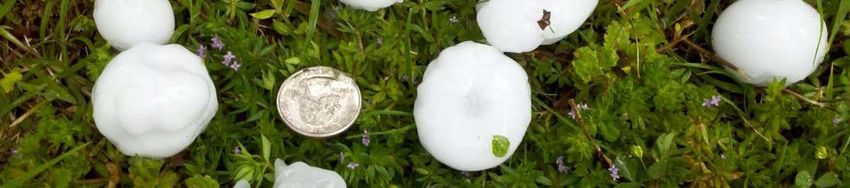
Table of Contents
i. Success Stories on User Engagement                            3
1. Introduction                                                  5
2. Applications
        2.1. Climatology: Energy                                _ 9
        2.2. Forensic Analysis: Legal and Insurance              12
        2.3. Probability and Planning: Retail and Maintenance    14
        2.4. Contextualizing Weather: Media and Editorials _     16
3. Room for Improvement                                          18
4. Conclusions                                                   19
        References                                               21
        Appendix A: Interviewees                                 23

                                                                      Page | 2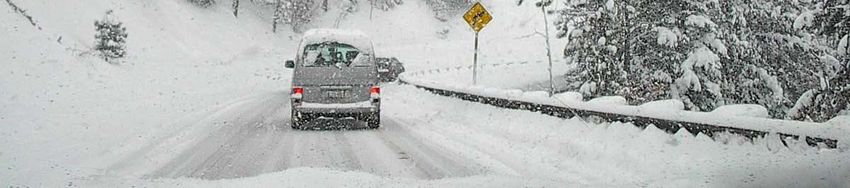
i.   Success Stories on User Engagement

This report examines user engagement with NOAA’s National Centers for Environmental Information
(NCEI) climate and weather data. It demonstrates the value that the free and publicly available provision
of NCEI’s information to the weather service provider industry. Interviews conducted with key sector
stakeholders and supplemental desk-based research illustrate how weather service providers use climate
and weather data from NCEI to create value-added products and services to serve a range of sectors.
NCEI’s information provides an important resource to weather service providers, a rapidly growing sub-
sector that contributes $7 billion annually to the U.S. economy.

                                                                                                Page | 3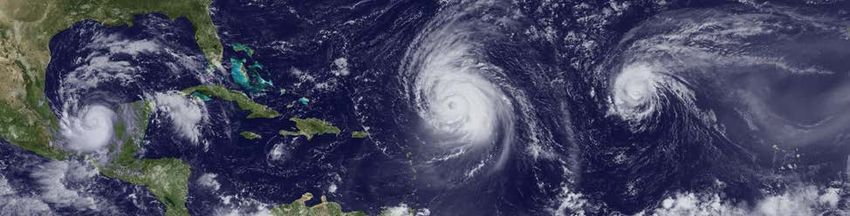
Acronyms Used

CDD: Cooling Degree Days
COOP: Cooperative Observer Network
DOC: Department of Commerce
FERC: Federal Energy Regulatory Commission
GHCN-D: Global Historical Climatology Network, Daily
HDD: Heating Degree Days
LCD: Local Climatological Data
NCDC: National Climatic Data Center (now, NCEI)
NCEI: National Centers for Environmental Information
NESDIS: National Environmental Satellite, Data, and Information Service
NASA: National Aeronautics and Space Administration
NCEP: National Centers for Environmental Prediction
NOAA: National Oceanic and Atmospheric Administration
NSSL: National Severe Storms Laboratory
NWS: National Weather Service
USDM: U.S. Drought Monitor

Terms and Definitions

Anomalies: the departure or difference from an average, or baseline, value (like temperature). Baseline
climate values are typically computed by averaging 30 or more years of data

Bulk climate and weather data: electronic collection of high-volume datasets that are typically available
in a raw or quality-checked format

Heating and Cooling Degree Days: measures of expected energy usage for heating and cooling, based
on cumulative daily average temperature observations below (heating degree days) or above (cooling
degree days) a specific threshold, typically 65°F (NCDC, 2010)

Weather service provider, (third party) weather vendor, decision-support provider: commercial
weather service providers combine climate and weather data, often with industry specific data, to
develop customized products, tools, and services for their clients

Weather service product: outputs produced by weather service providers for their clients. They include
but are not limited to: maps, charts, graphics and reports, or software tools and dashboards that
integrate weather data with users’ operating systems

                                                                                                 Page | 4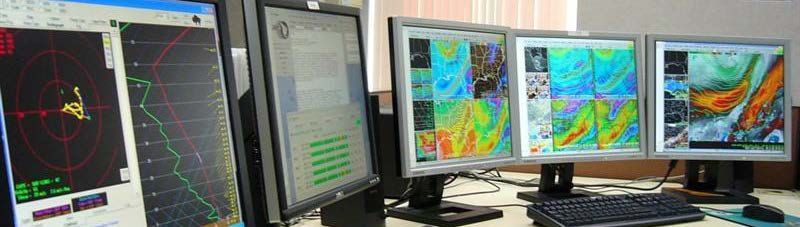
1. INTRODUCTION

        IMPACTS OF WEATHER TO BUSINESS AND THE U.S. ECONOMY

Figure 1: Storm conditions
Source: NOAA’s National Severe Storms Laboratory (NSSL)

An estimated 30 percent of the Nation’s economy is impacted by weather, as disruptions to the supply
chain affect businesses’ ability to produce and sell products and meet customer demand. Weather
influences Gross Domestic Product (GDP) fluctuations between 3 to 6 percent a year, or up to $1.3
trillion dollars in economic gain or loss (using 2011–2014 GDP estimates) (NWS, 2017).

Weather impacts the economy in a multitude of ways. Economic impacts can be influenced by slight
temperature changes, extreme events like hurricanes or slow onset events like drought. Weather events
do not create uniform positive or negative impacts. A snowstorm can bring transportation to a standstill
but increase demand for outdoor recreation. A rainy week can reduce foot traffic foot fall at retail
locations but boost online shopping. A hailstorm can damage crop production but drive demand for roof
repair. A hurricane warning can create an economic payroll deficit but offer a competitive advantage to
bottled water companies allocating stock in the projected hurricane track.

Actionable weather information is therefore valuable across all economic sectors. Every industry, and
virtually every company, uses weather information in some capacity. This may range from a cursory
glance at a forecast to see the next day’s weather, to appointing the services of a weather vendor to
answer an optimization query, or hiring meteorological staff to enhance in-house capabilities (C. Walter,
personal communication, July 26, 2017).

        VALUE-ADDED WEATHER SERVICE INDUSTRY

In response to weather’s influence on commerce, a thriving value-added service industry has emerged
over the past 30 years, especially the last decade. These value-added providers are often referred to as

                                                                                                  Page | 5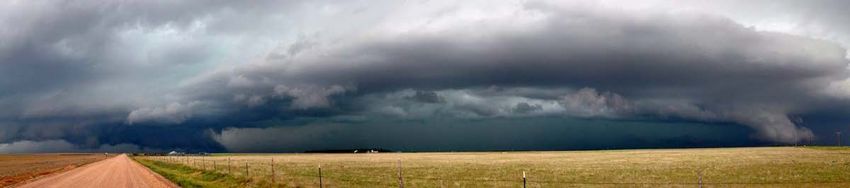
third party weather vendors, weather service providers, or decision support providers terms that are
used interchangeably throughout the industry. These companies combine climate and weather data,
often with company specific information, to develop products and services that support company
decision-making. The analytics offer a competitive advantage to businesses, allowing them to capitalize
on weather-dependent behavior and implement risk management strategies (NWS, 2017).

        Commercial weather service providers combine climate and weather data, often times with
        industry specific data, to develop customized products, tools, and services for their clients.

The value-added industry serves its clients by developing customized products such as maps, charts,
graphics, and reports, or software tools and dashboards that integrate weather data with users’
operating systems. This information, often accompanied with consulting support, serves to enhance
business performance or manage risk (NWS, 2017). Examples may include a software tool that helps
trucking companies to route vehicles around high winds, a warning system that alerts railways to
tornado risk, a two-week outlook that allows energy companies to forecast heating and cooling demand,
or a temperature map that allows retailers to optimize product placement. Service providers also
support clients in collecting and analyzing historical weather information for legal or insurance claims.
For example, a service provider may access historical radar data to recreate weather at a particular
location, in support of an insurance claim for hail damage.

While estimates vary, roughly 250 commercial weather service providers offer industry-specific or cross-
sectoral weather analytics (Brin, 2011). The Weather Company and AccuWeather own 50% of the
market share of weather services, while the remainder are offered by smaller companies with fewer
than 150 employees. The market value of the climate and weather industry is an estimated $7 billion
and projected to grow 10-15% per year as it continues to serve customers domestically and
internationally (Dutton, 2002). The continued growth of the value-added industry is predicated on
access to NOAA, NCEI, and other federal data (NWS, 2017).

The potential growth prospects of combining weather analytics with industry-specific data are
demonstrated by several recent high-profile acquisitions. In 2013 Monsanto acquired Climate Corp, and
Panasonic acquired AirDat, while in 2016 IBM acquired The Weather Company (NWS, 2017). Estimates
show that if fully monetized, the value of weather data that could be realized across all U.S. industries is
on the order of $13 billion (NWS, 2011).

                                                                                                    Page | 6
Weather service providers not only serve industry-specific clients, they also serve one another. For
example, Weather Source relies on NCEI’s information to develop a high-resolution gridded OnPoint
climatology product which is then used by other value-added providers such as Earth Networks to
develop products and services for their client base. Earth Networks believes it’s more efficient to license
a ready-to-use climatology product from Weather Source, rather than “re-inventing the wheel” devoting
staff resources to reproducing the process in-house (M. Hozekma, personal communication, Jan 16,
2018).

The general public also consumes value-added information. Baron and The Weather Company own the
majority market share of weather forecast licenses, which are then broadcast on news programs by
meteorologists (S. Bray, personal communication, Jan 9 2018). Baron’s technology reaches two-thirds of
the U.S. population through its television, internet, and radio broadcasting clients (Baron, 2016).
Weather Underground, a subsidiary of The Weather Company, employs weather bloggers who produce
online weather content, reaching millions of readers per year. Individuals also use this information for
day-to-day decision-making that influences economic activity. The Weather Company’s native weather
apps available on Android or iPhone, tailor advertisements based on localized weather conditions (Paul
Walsh, Personal Communication, March 19, 2018). Consumer behavior and tailored advertisements may
drive a consumer to purchase barbeque food over umbrellas on a sunny day.

         Value-added industry is predicated on access to NOAA’s information

The U.S. model for free and publicly open data access has enabled a robust weather services market
both in the U.S. and worldwide. Data agencies like NOAA’s National Centers for Environmental
Information (NCEI), NOAA’s data archive, provide basic services (as opposed to specialized, value-added
services) which are characterized as non-rival, non-excludable, public goods (Gunasekera, 2004). Once
produced, NCEI data are available at no cost, generating boundless market potential. Weather service
providers rely on NCEI along with other public agency data (e.g. NOAA, NASA), to serve as foundational
components in their products and services (Weiher, 2008).

Value-added service providers depend on public data for a number of reasons. Generating weather and
climate information requires extensive capital investment, infrastructure development (e.g. building and
launching satellites, installing ground-based networks, etc), and management and coordination over
long time periods, that can only be effectively executed on a large scale by a government agency.

                                                                                                      Page | 7
Further, raw data collection may not offer an immediate return on investment or may have a primary
public-safety benefit versus commercial benefit and may be unprofitable for the private sector to
produce (NWS, 2017). While NOAA and NCEI do produce user-friendly tools and products, 1 much of the
information is available in bulk format that is accessed primarily by expert users. This presents skilled
entrepreneurs with a market opportunity to source bulk data, develop value-added processes, and
produce commercially viable products (Weiher, 2008).

           “NCEI’s data is used broadly as a foundational component along, with NOAA and other government data,
           and all the data and capabilities generated using Accuweather, in order to develop value-added products
           and services.” – Jonathan Porter, Vice President of Business Services and General Manager of Enterprise
           Solutions, Accuweather

From an economic model perspective, centers like NCEI exist to fulfill the supply side, and weather
service providers fulfill the demand side. It is not NCEI’s mission, nor does NCEI have the capacity, to
develop company-specific value-added products. NOAA’s public-private partnership policy, which NCEI
follows, recognizes the benefit in working together, and not in competition, with the private sector and
academia for the provision of weather information (M. Brewer, personal communication, Mar 28, 2018).
Bulk climate and weather data are considered a competitive advantage as they require the expertise of
a value-added service provider to make these data useable. If agencies like NCEI provided user-friendly,
ready-to-use products, this would limit the commercial viability of weather service providers (J. Porter,
personal communication, Jan 17, 2018).

NCEI, NOAA’s data archive, collects and archives weather and climate observations from around the U.S.
and globally and is recognized as the largest repository of authoritative climate and weather data in the
world. Weather service providers depend on NCEI’s information, along with other data, to develop a
range of products and services. NCEI’s information contributes too many applications, including energy
demand forecasting and trading, forensic analysis, probability and planning, and providing context to
historical weather events. With over 250 weather service provider businesses supporting a range of
industry stakeholders, this study is limited in its ability to capture all present and emerging applications
of NCEI’s information. Rather, this study demonstrates conventional applications of NCEI’s information
to develop products and services for sector-specific groups.

1
    Examples include; Coral Reef Watch, U.S. Drought Monitor

                                                                                                         Page | 8
2. APPLICATIONS
2.1. CLIMATOLOGY: ENERGY
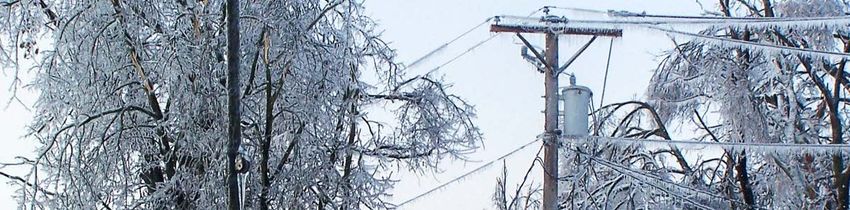
Figure 2: Frozen power lines
Source: NOAA NSSL
A long-term weather record, or climatology, can demonstrate how the weather tomorrow or next week
deviates from normal conditions. A climatology provides the foundation for a variety of analyses that
businesses seek to understand how their weather-related performance deviates from normal. Many
weather service providers cater to energy companies and financial services trading energy on markets,
supporting volatile demand management. This section explains climatology application development in
relation to energy supply and energy trading.
Table 1: NCEI products used for energy demand forecasting
Product Name Description
Global Forecast The GFS is a weather forecast model that provides atmospheric and land/soil variables,
System (GFS) including temperature, wind, precipitation, soil moisture, and atmospheric ozone
Reanalysis concentration. GFS provides global coverage with base horizontal resolution of 18 miles (28
kilometers) between grid points that drops to 44 miles (70 kilometers) between grid points
for forecasts greater than one week. The GFS is a coupled model, composed of four
separate models (an atmosphere model, an ocean model, a land/soil model, and a sea ice
model), which work together to provide an accurate picture of weather conditions. GFS is
produced by National Centers for Environmental Prediction (NCEP) and archived by NCEI
(NCEI, 2018a).
Coupled Forecast The CFS model represents global interaction between Earth’s land, atmosphere, and
System (CFS) oceans. This model offers hourly data with a horizontal resolution of one-half of a degree
Reanalysis & CFS (approximately 35 miles) for many variables. CFS is produced by the NCEP and archived by
Hindcast NCEI (NCEI, 2018b).
Reforecast
Page | 9Energy supply disruptions have significant economic and operational impacts to energy companies, and
industries that rely on their services, including hospitals, food production, water supply, and more. As
energy cannot be stored in large quantities, energy supply must match demand in order to avoid
economic losses (more supply than demand) and brownouts (more demand than supply). To support
optimal energy production, weather service providers develop proprietary forecasts and long-range
outlooks (sub-seasonal, seasonal) to serve energy and utility clients. Weather is a primary influencer of
energy demand. Subscription-based services help natural gas, hydroelectric power suppliers, and
electricity distributors estimate short- and long- term demand, and optimize generation on daily,
monthly, and yearly time scales. These forecasts can help companies increase personnel during
potentially hazardous weather conditions that may pose a threat to infrastructure or installations.
Natural gas and electricity are traded on the markets like any other commodity, such as copper, coal, or
corn. The market for natural gas and electricity has surged in recent decades as markets have matured
and investors recognize the commodities as investments. The global revenue for energy trading and risk
management is estimated at $1.22 billion and is growing at a rate of 2.32% per year (NBC, 2018). Energy
traders speculate on how a range of factors that influence supply and demand (including weather) will
drive the market price of electricity and natural gas. In response to these factors, traders then buy, sell,
or trade commodities to profit from the change in price (FERC, 2015).
“A few years ago, when natural gas was at an all-time high there was this energy trader, a meteorologist
from Boston, who went to work as a trader in NYC. On his first day of work he made one trade and retired.
The trade was worth $30 million dollars.” – Dr. Michael Ventrice, Meteorological Scientist, IBM
IBM’s The Weather Company develops energy demand
forecasts to help traders understand how weather will
influence demand. The Weather Company relies on NCEI’s
Coupled Forecast System (CFS) archived model data and CFS
hindcast, reforecast reanalysis data to compute deviations
from average climatic conditions on a global grid. This
deviation is a value of the departure from average conditions Figure 3: Coupled Forecast System
Source: NOAA NCEI
of a parameter (e.g. +1°C or -1°C for temperature) at a given
point location (e.g. 49°N 100°W) over the course of a base 30-year period, for each day of the year. The
deviations are compared against real-time model outputs to understand how demand will be influenced
Page | 10in the short-term and medium range (1 - 15 day) and sub-seasonal range (5 - 6 weeks). Energy traders
use this population-weighted information to speculate on how weather may impact demand for energy
and drive decision-making to buy, sell, or trade energy on the market (M. Ventrice, personal
communication, Jan 9, 2018).
“I find the data from NCEI to be extremely valuable, specifically the CFSV2 sub-seasonal model, if mean
(sic) if we didn't have this it would hurt our forecast skill.” – Dr. Michael Ventrice, Meteorological Scientist,
IBM’s The Weather Company
The Weather Company also uses Global Forecast
System (GFS) reanalysis data to develop sub-seasonal
and seasonal weather forecast anomalies (5 to 6
weeks). While The Weather Company archives GFS
data internally, they rely on NCEI when the internal
system malfunctions. In this regard, NCEI serves as an
important backup to ensure the information is always Figure 4: Energy traders at work
Source: Energy Management Services
available. NCEI’s information is also used to validate the
accuracy of in-house forecasts and guide improvements (M. Ventrice, personal communication, Jan 9,
2018). In 2016 Forecast Watch, the Nation’s authority on meteorological accuracy validation, awarded
The Weather Company “the most accurate third-party forecasting company” (Floehr, 2016).
Page | 112.2. FORENSIC ANALYSIS: LEGAL AND INSURANCE
Figure 5: Hailstones
Source: NOAA NSSL
Table 2: NCEI Certified Products used for forensic analysis
Product Name Description
Global Historical GHCN-D is a global, land-based (in situ) database that collects observations from a
Climatology Network number of different observing networks. It contains records from over 80,000 stations
Daily (GHCN-D) in over 180 countries and territories and is the most comprehensive daily global dataset
available. Variables include maximum and minimum temperature, total daily
precipitation, snowfall, and snow-depth. Data for the U.S. is reported once daily (usually
in the mornings) from stations across the country (Menne, et al., 2012).
Local Climatological LCD consists of local climate data summaries (hourly, daily, monthly) for about 1,600
Data (Quality Checked) land-based stations across the U.S. (NCEI, 2018d).
Cooperative Observer Volunteer in situ observations collected in rural, urban, and suburban locations across
Network (COOP) the U.S. COOP data generally consist of daily maximum and minimum temperature,
snowfall, and 24-hour precipitation totals (NCEI, 2018e).
A number of weather service providers are wholly dedicated to the practice of forensic meteorology,
including Forensic Weather Consultants and Veritas Weather, while other service providers including
WeatherBELL Analytics and Accuweather offer forensic analysis as a part of a broader service provision.
Forensic meteorology, the practice of reconstructing a past weather event for a specific time and
location, informs legal proceedings and insurance claims, where weather contributed to the accident or
damage. For example, if a plaintiff brings forward a case for a slip and fall incident, the verdict may
depend on timing of the incident. If the plaintiff slipped and fell during the snowstorm and the
defendant did not have sufficient time to clear the snow, they may be absolved of legal liability. If the
person fell two days after the snowstorm, when the snow had already turned to ice, the defendant
could be liable as a result of negligence to clear the walkway. A weather service provider may be asked
to recreate weather at the time of the incident on behalf of the plaintiff or the defendant to serve as
evidence in the court of law. Weather service providers support legal and insurance firms in recreating
Page | 12historical weather events on a case-by-case basis. Recreating these analyses often depends on
aggregating data from multiple sources to develop time and location specific analysis, a task that is too
time consuming and technical for non-experts to perform. Table 4 lists NCEI products that are commonly
used for forensic analysis and can be certified by the Department of Commerce (DOC). Another common
forensic analysis example are time and location specific hail swath maps. Insurance companies, or
policyholders interested in proving (or disproving) hail damage to a crop field, vehicle, or property can
use the maps as proof in a court of law. Forensic analyses are common for slip and fall incidents and
transportation accidents, particularly involving snow, ice, and high winds, and property damage from
hail, high winds, tornadoes, and hurricanes (T. Riggi, personal communication, Jan 16, 2018).
Normally, a court of law will only accept meteorological data certified by DOC, as evidence. Designated
within the DOC, NCEI-certified products are therefore invaluable to forensic analysis and the legal
sector. This data has the potential to validate or vindicate a client of legal liability, thereby potentially
savings millions of dollars in legal liability on a per case basis. Further, clients of weather service
providers feel reassured knowing that the data supporting their case is from a trusted and reliable
government source (T. Downs, personal communication, Jan 16, 2018).
Page | 132.3. PROBABILITY AND PLANNING: RETAIL AND MAINTENANCE
Figure 6: Winter weather
Source: NOAA NSSL
Table 3: Sample NCEI products used for probability and planning
Product Name Description
GHCN-D (See Table 2)
Regional Snowfall Index A regional snowfall index produced for each of the six NCEI climate regions in the
(RSI) eastern two-thirds of the nation. RSI is a ranking of snowstorm impacts on a scale
from 1 to 5 based on storm spatial extent, snowfall accumulation, and population
density obtained from the U.S. Census (Squires, et al., 2014).
U.S Drought Monitor An online drought-monitoring map and accompanying narrative summary that tracks
(USDM) the magnitude, spatial extent, and probability of occurrence of drought across the
U.S. The USDM is developed through a cooperative effort between NOAA, including
the Regional Climate Centers, the U.S. Department of Agriculture (USDA), and the
National Drought Mitigation Center (NDMC). Under NOAA, NCEI is a key partner in the
USDM, producing many climatological inputs that are ingested into the USDM and
providing three of about a dozen rotating authors (Fuchs, 2017).
Weather service providers support their clients in a many ways, to answer planning and optimization
queries. They analyze historical weather data to determine the likelihood of certain event(s), e.g.
snowstorm, windy day, or sunny day. While these analyses are applicable to a range of sectors, they are
common among weather-sensitive industries such as retail, transportation, construction, and seasonal
maintenance. For example, WeatherBELL Analytics uses NCEI’s information to help winter maintenance
companies budget for crew time and resources including salt, plows, and snow and ice removal
equipment, to prepare for the winter season. When bad weather hits, maintenance companies usually
contracted by a municipality or company must be prepared and available on short notice. WeatherBELL
Analytics uses NCEI’s snowfall indices and station data to understand the average frequency and severity
of snow events in a given region during the winter season. Maintenance companies then use these
Page | 14analyses to budget and prepare resources and personnel in advance of the season (T. Downs & T. Riggi,
personal communication, Jan 16, 2018).
Service providers support retailers in optimizing product placement in favor of weather conditions. For
example, persistent drought conditions during springtime may impact the sale of lawn care items such
as pesticides and lawnmowers. Service providers analyze drought indices such as the U.S. Drought
Monitor and temperature and precipitation data, along with store-specific data, to understand how
weather conditions influence the sale of these items. Further, they may combine this analysis with
forecasts to recommend reorganization of stock and inventory to align better with consumer trends,
helping retailers maximize in-store sales.
In addition to merchandise allocation, retail applications may guide staffing decisions. High winds are a
concern that grocery and department stores must manage. With large, open parking lots, shopping carts
may blow into parked cars, causing vehicle damage. This can lead to economic loss through direct
liability, customer dissatisfaction, and poor brand reputation. Weather service providers analyze NCEI’s
historical wind data to understand how often, on average, winds exceed a certain threshold and pose
store liability. The retailer uses this analysis to inform staffing decisions, for example, scheduling cart
collection and budgeting for additional staff (T. Downs & J. Riggi, personal communication, Jan 16,
2018).
Applications also include selecting optimal site locations for businesses. For example, StormGeo
supports its clients in weather-related site assessments. A tech client planning a new data center
was interested in evaluating severe weather risk to potential candidate sites. Using NCEI’s data,
StormGeo conducted an analysis of historical severe weather risk to the potential sites to identify the
location least prone to extreme weather events (M. Chambers, personal communication, Jan 10, 2018).
Page | 152.4. CONTEXTUALIZING WEATHER: MEDIA AND EDITORIALS
Figure 7: Hurricanes Carl, Igor, and Julia
Source: NOAA
Table 4: NCEI information that supports content creation
Product Name Description
U.S. Drought (See Table 3)
Monitor (USDM)
State of the The State of the Climate reports are monthly and annual summaries that recap climate-
Climate Reports related conditions on a national and global scale. These reports place the month (or year)
within the historical context of all prior months (or years). For example, January 2018 ranks
as the 36th warmest January on record, as compared to all other Januaries in the period of
record (1895 to present) (NCEI, 2017a).
Climate Extremes A framework for quantifying observed climatic changes within the contiguous U.S. The CEI is
Index (CEI) based on a set of indicators including heavy one-day precipitation events, drought severity,
extremes in monthly mean maximum and minimum temperatures, number of days with and
without precipitation, and wind intensity of landfalling tropical cyclones (NCEI, 2018f).
Billion Dollar NCEI’s U.S. Billion Dollar Disasters report, a quarterly publication that began in 1980,
Disasters highlights aggregate losses for major weather and climate events that have occurred in the
U.S. The report quantifies losses for numerous weather and climate events that meet or
exceed $1 billion each in economic losses. These events include tropical cyclones, severe
convective storms (tornadoes, hail, and straight-line wind damage), floods, droughts,
heatwaves, wildfires, crop freeze events, and winter storms. The loss estimates reflect the
direct impacts of the weather and climate events, and the total insured and uninsured losses
including: physical damage to buildings, material assets within a building, business down
time, vehicles, public and private infrastructure, and agricultural assets (e.g. livestock,
forestry, and crops) (Smith & Katz, 2013).
“NCEI’s data is valuable to understand what has occurred. What’s the context of a particular event? How
rare is an event? When have similar types of weather situations occurred in the past?” – Jonathan Porter,
Vice President of Business Services and General Manager of Enterprise Solutions, Accuweather
Page | 16Weather service providers use NCEI’s information to provide context to weather events that impact a
client’s operations. It can contextualize weather events within prior weather events and address
questions pertaining to event frequency and likelihood. For example, a railway company may want to
understand whether a tornado that toppled a train car was an ‘act of God’ or an increasingly common
severe weather event that railways should plan for. An insurance company may seek to understand
whether a hurricane of a given magnitude has occurred in the past, and if so, how much damage it
caused (J. Porter, personal communication, Jan 17, 2018).
Weather service providers often have a department or subsidiary that produces content for a broader
audience, either through online or TV broadcast or editorial articles and blogs. For example, IBM’s The
Weather Company owns Weather Underground, Accuweather writes a weather blog, and
EarthNetworks, until recently, owned WeatherBug.
NCEI’s information supports the development of editorial content. Accuweather uses the USDM maps in
its blogs to provide a visual overview of the state of drought in the U.S. WeatherBug recreates the USDM
map in its weekly drought updates. The maps and editorial summaries are curated to meet a target
audience’s interests (M. Hoekzema, personal communication, Jan 16, 2018). Weather Underground,
owned by The Weather Company, produces a monthly U.S. and Global Round Up which compares the
prior month’s weather within the historical context of that month’s weather on record (e.g. January
2018, compared against all Januaries on record). To create the Round Ups, Weather Underground
summarizes the content and maps from NCEI’s monthly State of the Climate Reports. The Round Ups
also use NCEI’s Billion Dollar Disasters data 2 to show the number of U.S. disasters that exceed $1 billion
in damages for that month. Weather Underground also produces Category 6, a popular blog that
contextualizes extreme events such as hurricanes, tornadoes, floods, and heatwaves within a climate
context. The content is paid for through advertisements, or members can pay an annual subscription fee
to access the articles ad-free. Millions of readers access Weather Underground publications daily,
thereby indirectly accessing NCEI content (B. Henson, personal communication, Jan 10, 2018).
“Without these climate summaries, our editorial content would not exist. Please protect NOAA’s ability to
write about climate change.” – Bob Henson, Meteorologist and Author of Category 6, Weather
Underground
2
Obtained indirectly through editorial content produced by Aon Benfield
Page | 17Companies such as The Weather Company and Baron are two leading vendors of weather forecasts that
are licensed to web and TV stations. Although Baron doesn’t use NCEI data to produce forecasts, it does
recommend NCEI climate information to provide context to its forecasts. For example, if the forecast is
showing an anomalously warm winter day, Baron may recommend including Climate Normals, to show
viewers how the day’s weather deviates from the average. Or, if a region is experiencing drought
conditions, it may recommend using the USDM to show drought conditions across the country. In this
way, NCEI’s information can add a broader narrative to a forecast and help inform audiences about
climate change (S. Bray, personal communication, Jan 9, 2018). Countless reporting and media outlets,
including Bloomberg and Climate Central, not characterized as weather service providers, also use NCEI
information in their programming and editorials.
3. ROOM FOR IMPROVEMENT
Weather service providers offer three primary recommendations to improve to NCEI products and
services:
● Data availability in more conventional formats (e.g. CSV, shapefile). NCEI’s data are often
available in unconventional file formats. Users have to first convert the file into a conventional
format, before they can use the data, which is considered to be an extra and unnecessary step.
● Easier navigation of the NCEI website. Users often express difficultly locating information on
NCEI’s website. A more user-friendly interface would make website navigation and data retrieval
easier.
● In situ products available in gridded format (e.g. GHCN-D). Gridded products are often required
for the types of client-specific analysis that weather service providers undertake. Gridded data
would streamline analysis and the value-added processes.
These enhancements would make NCEI’s information easier to use among the service provider
community.
Page | 184. CONCLUSIONS
Figure 8: Weather forecast models
Source: NOAA NWS
Recent trends show that businesses that traditionally did not use weather data are increasingly turning
to weather information to inform decision-making (NWS, 2017). However, weather information in and
of itself, for example a weather forecast, may be of limited value to businesses if it’s not related to
company performance. Weather service providers offer just this – they combine climate and weather
data often with industry-specific data to develop customized products and services that support
business decision-making. They also create content that supports public understanding of climate and
weather.
Weather service providers cater to a range of sectors, most commonly those with weather-sensitive
operations or outputs including energy, insurance, retail, seasonal maintenance, transport, legal, media,
and agriculture. Value-added products and services offer businesses a range of benefits that ultimately
protect against economic loss, boost profits, and avoid risk. For example, they can help provide guidance
to an energy trader that leads to a lucrative trade on the market, a retailer capitalize on weather-
dependent behavior to maximize sales, a transportation provider avoid risk or liability, a maintenance
company prepare for the winter season ahead, and a media outlet contextualize a weather
phenomenon for millions of viewers. These services directly benefit businesses and their clients. The
value of weather information has far-reaching benefits to commerce and individual citizens.
Weather service providers depend on access to NOAA’s free and publicly available information to
develop value-added products and services. Within NOAA, NCEI’s archived information is a foundational
component of the maps, tools, graphics, charts, dashboards, reports, and other products that weather
service providers produce for their audiences and clients. While there are numerous applications of
Page | 19NCEI’s information, they commonly include climatology development, verifying and testing models,
recreating past weather events for forensic analysis, probability analysis to inform planning, and adding
context to weather forecasts or editorial publications.
For many value-added providers, NCEI’s information is integral to the products and services they create,
and to others it’s indispensable. Some service providers stated that their entire business model is
predicated on NOAA and NCEI data, and without this information they would “not be in business” (M.
Roffer, personal communication, Feb 8, 2018). For applications like forensic analysis, NCEI’s information
is the standard with its DOC certification. Even for service providers that archive their own information,
NCEI’s information serves as an important backup in case internal processes fail.
With more volatile and costly billion-dollar disasters, demand for weather services continues to grow as
does demand for NCEI information. With NCEI’s free and publicly available information, the potential for
continued market expansion in the weather service provider community is considerable. In the words of
John Firth, CEO of Acclimatise, ‘The changes we are now seeing in climate and weather, and the impact
they are having on our daily lives – our need for data and information is self-evident. NCEI is the world’s
greatest repository of climate and weather data and we need its information to manage our new
reality”.
Page | 20REFERENCES
Baron. (2016). University Weather Solutions. Retrieved from
https://www.baronweather.com/assets/2016/06/201606_BaronUniversityWeatherSolutions.pdf.
Brin, B. W. (2011, Aug 1). “Weather Services Become a Big Business”. Stormy Weather 2011- Special
Report. CNBC. Retrieved from, https://www.cnbc.com/id/43672839.
Dutton, J.A. (2002). “Opportunities and priorities in a new era for weather and climate services” in the
Bulletin of the American Meteorological Society. Retrieved from
https://journals.ametsoc.org/doi/abs/10.1175/1520-0477-83.9.1303
Federal Energy Regulatory Commission (FERC). (2015). Energy Primer, a Handbook of Energy Market
Basics. Retrieved from https://www.ferc.gov/market-oversight/guide/energy-primer.pdf.
Floehr, E. (2016). “Three Region Accuracy Overview 2010 through June 2016”. ForecastWatch. Retrieved
from https://www.forecastwatch.com/static/Three_Region_Overview_2010_201606.pdf.
Fuchs, B. (2017, April). A Cornucopia of Data, a Single Map. National Drought Mitigation Center,
University of Nebraska Lincoln. Presentation at the USDM Form, Keystone, SD.
Gunasekera, D. (2004). Economic issues relating to meteorological services provision. BMRC Research
Report no 102. August 2014. “Economic value of meteorological services: a survey of recent studies.”
Menne, M., J., Durre, I., Vose, R. S., Gleason, B. E., & Houston, T.G. (2012). “An Overview of the Global
Historical Climatology Network-Daily Database.” J. Atmos. Oceanic Technol., 29, 897-910.
National Broadcast Corporation (NBC). (2018, Jan 23). “Energy Trading and Risk Management (ETRM)
Market Global Industry Analysis, Share, Growth, Trends and Forecast 2018 2022.” Retrieved from,
http://www.abnewswire.com/pressreleases/energy-trading-risk-management-etrm-market-global-
industry-analysis-share-growth-current-trends-and-forecast-2018-2022_180124.html.
National Climatic Data Center (NCDC). 2014. NCDC Climate Products and Services Market Analysis.
Global Science & Technology, Inc., and Acclimatise Group Ltd.
National Climatic Data Center (NCDC). 2010. “Sectoral Engagement Fact Sheet: Energy”. Retrieved from
https://www.ncdc.noaa.gov/sites/default/files/attachments/Energy_Low%20Res.pdf.
National Centers for Environmental Information (NCEI). (2018a). “Global Forecast System”. Retrieved
from https://www.ncdc.noaa.gov/data-access/model-data/model-datasets/global-forcast-system-gfs.
National Centers for Environmental Information (NCEI). (2018b). “Climate Forecast System”. Retrieved
from https://www.ncdc.noaa.gov/data-access/model-data/model-datasets/climate-forecast-system-
version2-cfsv2.
National Centers for Environmental Information (NCEI). (2018c). “Climate Normals”. Retrieved from
https://www.ncdc.noaa.gov/data-access/land-based-station-data/land-based-datasets/climate-normals.
Page | 21National Centers for Environmental Information (NCEI). (2018d). “Local Climatological Data”. Retrieved
from https://www.ncdc.noaa.gov/data-access/land-based-station-data/land-based-datasets/quality-
controlled-local-climatological-data-qclcd.
National Centers for Environmental Information (NCEI). (2018e). “Cooperative Observer Network”.
Retrieved from https://www.ncdc.noaa.gov/data-access/land-based-station-data/land-based-
datasets/cooperative-observer-network-coop.
National Centers for Environmental Information (NCEI). (2018f). Climate Extremes Index. Retrieved from
https://www.ncdc.noaa.gov/monitoring-references/dyk/cei.
National Centers for Environmental Information (NCEI). (2017a). “Climate Monitoring”. Retrieved from
https://www.ncdc.noaa.gov/climate-monitoring/.
National Weather Service (NWS). (2017). “National Weather Service Enterprise Report, Findings on
Changes in the Private Weather Industry”. Retrieved from
https://www.weather.gov/media/about/Final_NWS%20Enterprise%20Analysis%20Report_June%20201
7.pdf.
National Weather Service (NWS). (2011). “Value of a Weather-Ready Nation”. Retrieved from
http://www.performance.noaa.gov/wp-content/uploads/PPI-Weather-Econ-Stats-10-13-11.pdf.
Smith, A. B. & Katz, R. W. (2013). "U.S. Billion-dollar Weather and Climate Disasters: Data Sources,
Trends, Accuracy and Biases" Natural Hazards, 67, 387-410.
Squires, M. F., Lawrimore, J. H., Heim Jr., R. R., Robinson, D. A., Gerbush, M. R., & Estilow, T. W. (2014).
The Regional Snowfall Index. Bulletin of the American Meteorological Society, 95(12), 1835-1848.
Weiher, R. (2008, Feb). Assessing the Economic and Social Benefit of NOAA Data. Presentation at the
NAS / OCED Conference, Paris, France.
Page | 22ANNEX A: INTERVIEWEES
Weather Service Providers
Steven Bray, Director of Broadcast Meteorology, Baron, Jan 9, 2018
Mark Chambers, Vice President Oil and Gas, StormGeo, Jan 10, 2018
Thomas Downs, Forensic Meteorologist, WeatherBELL Analytics, Jan 16, 2018
Mark Gibbas, CEO, Weather Source, Jan 10, 2018
Mark Hoezkema, Chief Meteorologist and Director of Meteorological Operations, Earth Networks, Jan
16 2018
Jonathan Porter, Vice President of Business Services and General Manager of Enterprise Solutions,
Accuweather, Jan 18 2018
Toni Riggi, Meteorological Developer, WeatherBELL Analytics, Jan 16, 2018
Mitch Roffer, Founder, Roffer’s Ocean Fishing Forecasting Service, Feb 6, 2018
Michael Ventrice, Meteorological Scientist, IBM’s The Weather Company, Mar 3, 2018
Paul Walsh, Vice President, Weather Analytics, IBM’s The Weather Company, March 19, 2018
Management Consultant
Christof Walter, Founder, Christof Walter Associates, July 26, 2017
NOAA Employees
Mike Brewer, Chief of Customer Engagement, NOAA’s National Centers for Environmental Information,
Mar 28, 2018
Mike Tanner, Director of the Center for Weather and Climate, NOAA’s National Centers for
Environmental Information, Mar 16, 2018
Page | 23You can also read


