Endosperm cell size reduction caused by osmotic adjustment during nighttime warming in rice
←
→
Page content transcription
If your browser does not render page correctly, please read the page content below
www.nature.com/scientificreports
OPEN Endosperm cell size reduction
caused by osmotic adjustment
during nighttime warming in rice
1,2,3,6*
Hiroshi Wada , Fang‑Yu Chang 3,4,6, Yuto Hatakeyama 1,2
, Rosa Erra‑Balsells 5
,
2,3
Takuya Araki , Hiroshi Nakano 1 & Hiroshi Nonami 2
High night temperature (HNT) often reduces yield in field crops. In rice, HNT during the ripening stage
diminishes endosperm cell size, resulting in a considerable reduction in final kernel weight; however,
little is known about the underlying mechanisms at cell level. In this study, we performed picolitre
pressure-probe-electrospray-ionization mass spectrometry to directly determine metabolites in
growing inner endosperm cells of intact seeds produced under HNT conditions, combining with 13C
feeding and water status measurements including in situ turgor assay. Microscopic observation in
the inner zone suggested that approximately 24.2% of decrease in cell expansion rate occurred under
HNT at early ripening stage, leading to a reduction in cell volume. It has been shown that HNT-treated
plants were subjected to mild shoot water deficit at night and endosperm cell turgor was sustained
by a decline in osmotic potential. Cell metabolomics also suggests that active solute accumulation
was caused by a partial inhibition of wall and starch biosynthesis under HNT conditions. Because
metabolites were detected in the single cells, it is concluded that a partial arrest of cell expansion
observed in the inner endosperms was caused by osmotic adjustment at mild water deficit during HNT
conditions.
High temperature during grain filling stage has been widely taking a toll on the production of field crops, which
induces a reduction in grain growth, resulting in yield l oss1, 2. Most studies have focused on high day temperature-
related responses; however, information on HNT responses is still limited particularly for the understanding
of cell-specific events. In rice, it is known that HNT affects its physiology in all stages from vegetative through
ripening stages, leading to various negative impacts on rice y ield2, 3. Long-term HNT conditions (i.e., the 5th day
after heading (DAH) until maturation) during the ripening stage severely affect grain development throughout a
reduction in endosperm cell size and decline grain weight4. Based on the fact that the partial heat exposure of the
leaves and culms except for panicles induced no reduction in grain weight, it has been pointed that a reduction
in grain weight at HNT may not be directly caused by the deficit of carbohydrates in the vegetative parts due to
increased respiration loss5. Although another factor(s) might influence the endosperm growth at HNT, what
causes such a reduction in cell volume during HNT conditions remains unknown.
More recently, it has been pointed out the impact of nighttime atmospheric vapor pressure deficit (VPD) on
changes in rice physiology under HNT, rather than HNT itself6. It should not be ignored that increasing VPD
reduces air water potential, causing temporal shoot water deficit7, 8. Dry wind conditions during middle ripen-
ing stage also induce temporal shoot water deficit to produce ring-shaped chalky kernels throughout osmotic
adjustment with no reduction in kernel weight if the duration is relatively short (i.e., < 24 h)8. The reduction
in kernel weight has been recorded when the duration extends > 2 days9. In rice endosperms, cell expansion
occurs first, followed by active starch accumulation at the early ripening stage10, 11. Starch accumulates from
the innermost cells towards the cells of the peripheral part of endosperms12. Water uptake and wall expansion
both need to occur during cell expansion. Therefore, if HNT conditions similarly induce shoot water deficit
at night, it is expected that plant water status may be disturbed to diminish the cell size before starch granules
have been packed. However, there have been no direct analysis conducted on the responses from the viewpoint
1
Kyushu Okinawa Agricultural Research Center, National Agriculture and Food Research Organization, Chikugo,
Fukuoka, Japan. 2Graduate School of Agriculture, Ehime University, Matsuyama, Ehime, Japan. 3The United
Graduate School of Agricultural Sciences, Ehime University, Matsuyama, Ehime, Japan. 4Kaohsiung District
Agricultural Research and Extension Station, Council of Agriculture, Executive Yuan, Pingtung,
Taiwan. 5Department of Organic Chemistry and CIHIDECAR (CONICET), University of Buenos Aires, Buenos
Aires, Argentina. 6These authors contributed equally: Hiroshi Wada and Fang-Yu Chang. *email: hwada@
agr.ehime‑u.ac.jp
Scientific Reports | (2021) 11:4447 | https://doi.org/10.1038/s41598-021-83870-1 1
Vol.:(0123456789)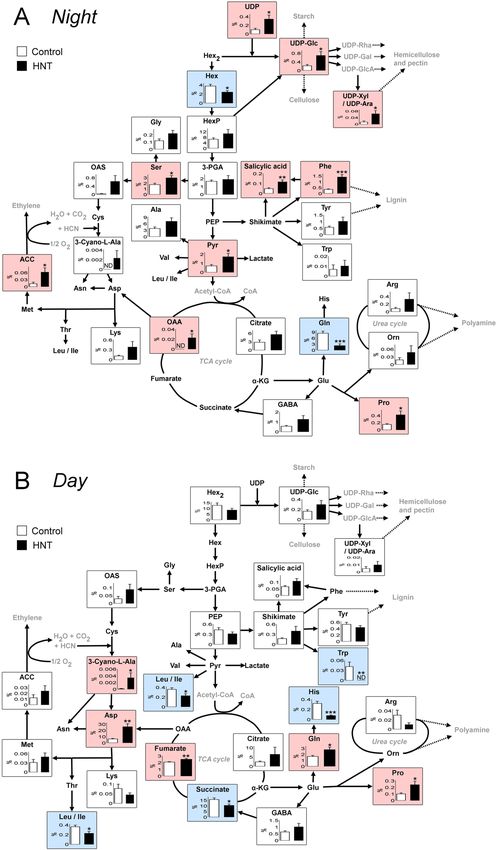
www.nature.com/scientificreports/
Grain dimension
Treatment Grain weight (mg) Grain length (mm) Grain width (mm) Grain thickness (mm) Grain volume (mm3)
Control 21.27 4.99 2.90 2.06 15.63
HNT 20.07 4.97 2.79 2.05 14.87
Treatment effect * NS *** NS **
Table1. Grain weight and dimension (grain length, width, thickness, and volume) in control and HNT
treatment at maturation. Data of grain weight are the mean ± SE of 5–6 individual plants, 8 grains per plant. *,
** and *** shows p < 0.05, 0.01 and 0.001 by Student’s t-test, respectively. NS, no significant difference (Student’s
t-test, p > 0.05). For the determination of grain dimension, see “Materials and Methods” section.
of plant-water relations. In addition, little is known about changes in metabolisms during cell expansion in the
endosperms growing during nighttime.
Electrospray Ionization (ESI) is a widely used mass spectrometry ionization chamber that allows a straight
analysis of analytes in polar solution through the coupling of LC/MS or direct infusion (DI-ESI) analysis. A
cell pressure-probe13 long-used to directly determine turgor pressure in plant cells, has been combined with
an Orbitrap mass spectrometer to establish as in situ cell metabolomics, termed “Picoliter pressure-probe elec-
trospray-ionization mass spectrometry (picoPPESI-MS)” (previously named: internal electrode capillary (iec)
electrospray-ionization mass spectrometry, IEC-PPESI-MS14). In this method, sample solution is infused in the
chamber through a specially sealed needle-electrode embedded in the quarz-capillary attached to the housing
of pressure-probe (see Fig. S2 in Ref.14), which yields poly-charged macro drops. Because of the action of a very
high electric field on this poly-charged drop of the solution, the desorption/desolvation/volatilization of the
analytes take place and intact analyte molecules as gas-ions are formed (soft ionization method). These gas-ions
are focused to the Orbitrap mass spectrometer. This analytical method allows to collect information about (1)
analyte molecular weight and (2) the chemical structure of the analyte by inducing the fragmentation/decom-
position of the selected intact molecule gas-ion (precursor ion) (MS/MS experiments).
In this study, we have hypothesized that the inner endosperm cells might be osmotically adjusted at moder-
ately low water potential, leading to a partial inhibition of cell expansion under nighttime warming conditions.
To test this hypothesis, we have combined cell metabolomics with 13C feeding and water status measurements.
For cell metabolomics, we have utilized picoPPESI-MS to directly assay cell metabolites and turgor pressure in
growing single endosperm cells of intact seeds produced under HNT conditions environmentally controlled in
on-site cell-specific analytical method described p reviously15–18. Here, we show that HNT conditions imposed
the plants to mild water deficit at night and the expanding inner cells were adjusted osmotically, causing several
metabolic changes, reducing cell size, resulting in a decline in final kernel weight.
Results
Final kernel weight and cell size. The rice plants were exposed to the 10 day HNT conditions and grain
weight, grain dimension, and cell anatomy were measured at maturation. A substantial reduction (ca. 5.7%) in
final kernel weight has been observed in HNT-treated kernels (Table 1). Although kernel length thickness was
sustained under HNT conditions (Table 1, Fig. 1A, B), kernel width and grain volume both declined under HNT
conditions, resulting in a remarkable decline in final kernel weight (Table 1, Fig. 1C, D). The image analysis of
inner endosperm cells of 35 DAH kernels, around 30–50% distance from central point in lateral side, where a
cell pressure probe was introduced, shows after treatment difference in the cell size mainly caused by the inhibi-
tion of cell expansion at HNT (Fig. 1E) with a partial occurrence of basal-white and white-back rice (Fig. 1B)
and number of cells in both treatments were similar in the endosperms (Fig. 1E). Time course of cell volume
in above-mentioned region shows that there is no difference between treatments at 9 DAH, but at the end of
stress treatment, 15 DAH, a significant decreasing in cell volume of HNT treatment was observed (Fig. 1F).
Additionally, we also observed that central point of endosperms moved towards dorsal side under HNT condi-
tions (Fig. S1).
13
C distribution percentage. To examine the effect of HNT treatment on 13C distribution in the plants,
plants were subjected to HNT conditions after 13C was pre-fixed. There was no detectable 13C distribution in
roots during the treatment duration, and 13C distribution in other tissues (panicle, superior kernels, flag leaf, the
first internode (INT1) and the first leaf sheath (LS1)) was shown in Fig. 2. Just after 13C was fed in flag leaf at 8
DAH, 13C mass per flag leaf dry weight in HNT treatment and control was 3.11 ± 0.26 mg g DW−1 (n = 4) and
3.02 ± 0.13 mg g DW−1 (n = 4), respectively. This suggests that treatment difference in 13C partitioning was sim-
ply related to translocation capability under different water status. According to the decline in 13C distribution
percentage in flag leaf, 13C entry in HNT-treated panicle remarkably increased in the daytime set even at normal
day temperature (Fig. 2B, C). In panicle, 13C distribution percentage in HNT-treated superior kernels, where we
conducted cell metabolomics (see below), dramatically increased toward the next day, compared with control
(Fig. 2B inset). During daytime in HNT treatment, an rapid increase in 13C distribution in the culms and sheaths
was observed, whereas 13C distribution in control was shown to gradually increase through the night (see the
first internode, first leaf sheath, and others, Fig. 2D, E).
Scientific Reports | (2021) 11:4447 | https://doi.org/10.1038/s41598-021-83870-1 2
Vol:.(1234567890)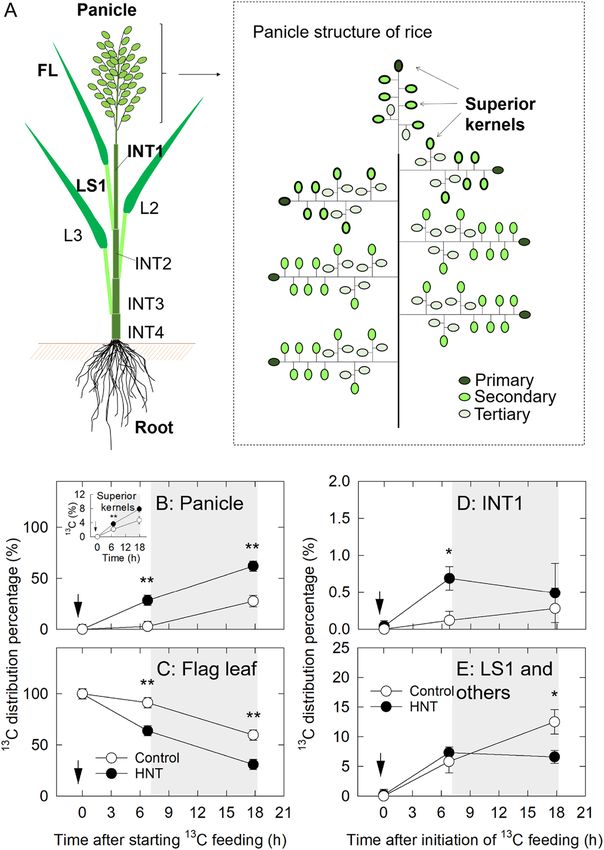
www.nature.com/scientificreports/

                                  Figure 1.  Images of mature rice kernels in control (A, C) and HNT treatment (B, D). (C) and (D) indicate the
                                  top view of the mature kernels. 35 DAH endosperm cell area plotted against the distance (in %) from central
                                  point to the lateral epidermis of transverse sections (corresponding to the dashed line in A and B) of the kernels
                                  in each treatment (E). In the inset in (E), number of endosperm cells across the same zone was counted. Epi,
                                  epidermis; NS, no significance. Time course of changes in inner endosperm cell volume (corresponding to
                                  the dotted line in E, 30–50% distance) in each treatment (F). White and black circles in (E) and (F) indicate
                                  the control and HN treatments, respectively. The gray area in (F) indicates the duration of treatment; an arrow
                                  indicates the time conducting picoPPESI-MS and water status measurements. Data in (E) are the mean ± SE
                                  of 7–64 individual cells collected in 4–5 kernels from three plants. Data in (F) are the mean ± SE of 30–58
                                  individual cells collected in 3–5 kernels from three plants.*, ** and *** shows p < 0.1, 0.05 and 0.01 by t-test,
                                  respectively. (A–D) scale bars = 1 mm.

Scientific Reports |   (2021) 11:4447 |                https://doi.org/10.1038/s41598-021-83870-1                                                  3

                                                                                                                                              Vol.:(0123456789)
www.nature.com/scientificreports/
Figure 2. (A) Diagram of rice plant (left) and rice panicle structure (right). Time course of changes in
13
C distribution in the panicle (B); in the flag leaf (C); in the INT1 (D) and in flag leaf sheath and others
(determined as pooled organs with these tissues) (E). In panicle structure in (A), superior kernels attached to
the same position, where the on-site cell metabolomics was conducted, were displayed with thick lines. Changes
in 13C distribution in the superior kernels were also shown (see inset in B). The plants were labeled with 13CO2
for 30 min from the flag leaf at 8 DAH at day time, as indicated by the arrow in (B–E). White and black circles
indicate the control and HNT treatments, respectively. Gray areas indicate the HNT treatment. FL, flag leaf;
INT1, first internode; LS1, first leaf sheath; L2, second leaf blade. Each point is the mean ± SE of four samples
from different plants. * and ** show p < 0.05 and 0.01 by t-test, respectively.
Water status in panicle and endosperm at nighttime warming. Predawn panicle water potential
in HNT treatment declined down to – 0.46 MPa, whereas that of control remained – 0.30 MPa (Table 2). In the
expanding stage of score 0.8 kernels, the tissue-averaged kernel water potential was highly correlated with pani-
cle water potential (PWP), consistent with the previous w orks8, 9. The regression line between PWP (x) and ker-
nel water potentials (y) was y = 0.91x– 0.07 with r2 = 0.92 (p < 0.001) (Fig. S2), and the relationship was linear and
essentially equivalent across a broad range of PWP in two treatments, ranging from – 0.27 to – 0.58 MPa. There
was no treatment effect on cell turgor (Table 2). The kernel water potential, calculated from the above-mentioned
regression line, was reasonably assumed to be equilibrated with the water potential of expanding cells during
the measurement with isopiestic psychrometers8. When the osmotic potential (negative quantity of osmotic
pressure) of endosperm cells was calculated by subtracting cell turgor from kernel water potential, the osmotic
potential under HNT treatment was shown to be lower than that of control (Table 2). The growth-induced water
potential in control and HNT treatment calculated as the difference of water potential between xylem water
potential (i.e., PWP) and expanding cells was 0.04 MPa and 0.03 MPa, respectively, with a significant treatment
difference (Table 2).
Scientific Reports | (2021) 11:4447 | https://doi.org/10.1038/s41598-021-83870-1 4
Vol:.(1234567890)www.nature.com/scientificreports/
Calculated osmotic potential Growth-induced water potential
Treatment Panicle water potential (MPa) Kernel water potential (MPa) Turgor (MPa) (MPa) (MPa)
Control − 0.30 − 0.34 0.01 − 0.35 0.04
HNT − 0.46 − 0.49 0.01 − 0.50 0.03
Treatment effect *** *** NS *** ***
Table 2. Panicle water potential, kernel water potential, endosperm cell turgor, calculated osmotic potential,
and growth-induced water potential determined at 8 DAH nighttime in control and HNT treatment.
Kernel water potential was calculated by regression equation (see “Results” section). Cell turgor was directly
determined at 9 DAH. The calculated osmotic potential was calculated by subtracting turgor from kernel
water potential. The growth-induced water potential was calculated by subtracting the kernel water potential
from panicle water potential (source of water). The data of panicle and kernel water potential are means ± SE
from 6 to 9 independent plants in each treatment. The data of turgor are means ± SE from 12 to 15 cells from
5 to 8 kernels from three independent plants in each treatment *** and NS indicate p < 0.001 (t-test) and no
significant difference, respectively.
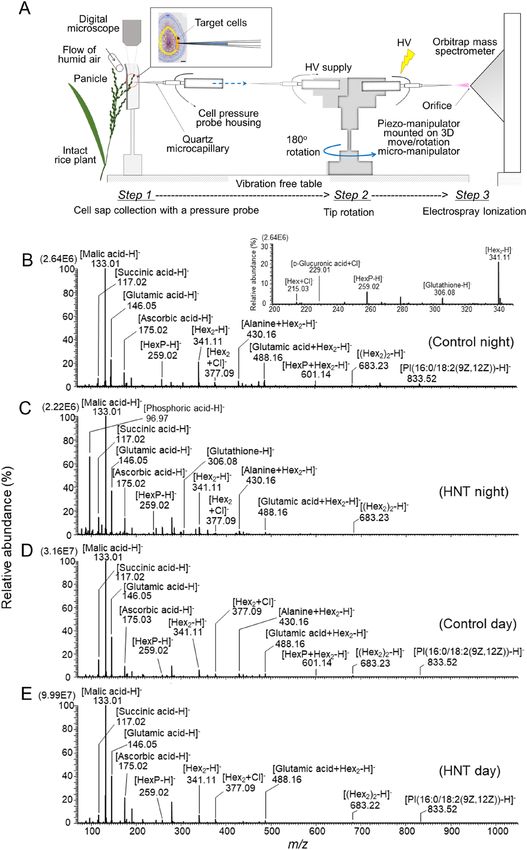
Metabolomic changes at nighttime. When in situ single-cell metabolomics at real time in negative ion
mode was performed in the expanding inner endosperm at night, abundant metabolite signals were identified
(Fig. 3, Table S1, Fig. S2–S5). In control, the peaks of malic acid, glutamic acid, H
ex2, succinic acid and ascor-
bic acid as [M − H]−, (M = molecular mass) were observed as the top five higher intensity signals (Table S1).
A similar pattern has been observed in HNT treatment; the peaks of deprotonated malic acid, glutamic acid,
phosphoric acid, ascorbic acid, and H ex2, were the top five major signals (Table S1). Although signal intensity
value of sugars (except for pentose) as [M + Cl]− in HNT treatment was slightly smaller than control, observed
signal intensity of the majority of amino acids (except for glutamine) in the same treatment was higher than
in control, at night (Fig. 4A and Table S1). In particular, the content of proline, phenylalanine, and serine, was
significantly higher than control (Table S1). Importantly, the content of cell wall realated metabolites, such as
p-coumaric acid, UDP-glucose, UDP-d-xylose (arabinose) and UDP; redox related metabolites, such as mono-
dehydroascorbic acid, dehydroascorbic acid and glutathione; stress response plant hormones, such as salicylic
acid and 1-aminocyclopropane-1-carboxylic acid (ACC) (the known precursor of ethylene); one of metabolic
branch points, pyruvic acid, in HNT treatment were greater than control (Table S1). On the contrary, the con-
tent of phosphatidylinositol (PI(16:0/18:2(9Z,12Z))), dramatically declined under HNT conditions (Fig. 3B, C,
Table S1, and Figs. S5 and S6). Besides, there was no change for cysteine signals (as [cysteine-H]− and the clus-
ter [cysteine + Hex2-H]−) between treatments and the intensity of the cluster [cysteine + Hex-H]− signal slightly
diminished under HNT conditions.
Metabolic changes at daytime. In contrast to the various nighttime responses, there were less treat-
ment differences in metabolic changes and less accumulation of metabolites in HNT treatment during day-
time (Table S1). Importantly, among metabolites related to cell wall synthesis, which were observed significantly
different during nighttime, only α-l-rhamnose was higher under HNT treatment during daytime (Fig. 4 and
Table S1). Overall, the content of sugars and amino acids was slightly lower in daytime, compared with night-
time. It is notable that the relative abundance of proline was still higher under HNT treatment at daytime; glu-
tamine showed an opposite response between daytime and nighttime (Fig. 4). During the daytime, HNT-treated
cells also exhibited greater content of ascorbic acid, aspartic acid, fumaric acid, glycerol, and 3-cyano-l-alanine
that participates in detoxification of cyanide, compared with control. The same behavour was not observed
for succinic acid, histidine, tryptophan, leucine or isoleucine as [M − H]-, and some sugar cluster ions, [Ala-
nine + Hex2 − H]− and [Succinic acid + Hex2 − H]− (Table S1).
Discussion
Microscopic observation shows that a partial inhibition of cell expansion occurred in the inner endosperms
under 10 day HNT conditions (Fig. 1), resulting in approximately 5.7% of reduction in final kernel weight
(Table 1). Unlike foehn-induced dry wind conditions (PWP = ca. – 0.90 MPa)8, predawn PWP at HNT was
– 0.46 MPa, indicating that nighttime shoot water deficit was unexpectedly mild. Similar to other rice studies
reported in leaves19–21 and endosperms8, an decrease in osmotic potential sustaining turgor occurred in the inner
endosperm cells in HNT treatment (Table 2), indicating that osmotic adjustment occurred at least in the cells at
nighttime warming. 13C feeding analysis shows that at least between 8 and 9 DAH (Fig. 2), which corresponds
to the timing of maximum rate of increasing grain dry weight in HNT t reatment4, sink activity was maintained.
On-site cell metabolomics performed under HNT conditions discriminated treatment differences in metabolites
mainly associated with wall and starch biosyntheses and ascorbate–glutathione pathway, together with sugar
and amino acid accumulation (Figs. 3, 4 and Table S1). These data strongly suggest that solutes accumulated into
the cells would have originated from materials to be used for cell expansion and starch accumulation, resulting
in the size reduction in the inner endosperm cells scavenging ROS to cope with nighttime warming. Taken all
together, we conclude that the endosperm cell size reduction locally observed under HNT conditions was caused
by osmotic adjustment (Fig. 1, Table 2).
Scientific Reports | (2021) 11:4447 | https://doi.org/10.1038/s41598-021-83870-1 5
Vol.:(0123456789)www.nature.com/scientificreports/
Figure 3. (A) Schematic diagram showing the flow from on-site cell metabolomics conducted in the rice
endosperm cells growing under controlled environments. After cell sap collection using a cell pressure probe
(Step 1), the tip was immediately rotated (Step 2) and then picoPPESI-MS was performed under the same
environements (Step 3) (also see “Methods” section). Scale bar in the transverse section embedded in A is
200 μm. (B–E) Negative ion picoPPESI mass spectra obtained from the cells in control and HNT treatment at
9 DAH daytime and nighttime. Inset figure in B indicates magnified range of m/z 200–350 to show peaks of
[Hex + Cl]−, [d-Glucuronic acid + Cl]−, [HexP-H]−, [Glutathione-H]−, and [Hex2-H]−. The data are representative
of repeated experiments with 9–14 kernels in each treatment.
Scientific Reports | (2021) 11:4447 | https://doi.org/10.1038/s41598-021-83870-1 6
Vol:.(1234567890)www.nature.com/scientificreports/
Figure 4. Changes in cell metabolisms in the 9 DAH inner endosperm cells at nighttime (A) and daytime (B)
under HNT conditions. White and black bars indicate control and HNT treatment, respectively. Metabolites
highlighted in pink and blue indicate that the relative abundances are significantly higher and lower under HNT
treatment, respectively. The data are means ± SE from 9 to 14 kernels from at least three independent plants in
each treatment. *, ** and *** show p < 0.05, 0.01 and 0.001 by t-test, respectively.
Impact of shoot water deficit under nighttime warming. In the present study, we have investigated
physiological causes on cell size reduction during early ripening stage caused by HNT conditions in the envi-
ronmentally controlled chambers, in order to cancel out potential candidates including heat history prior to
ripening. In addition, to rule out the potential effects from other yield-related components (e.g., the number of
tillers) that affects kernel weight, we only kept main stem per plant in this study. Consistent with the previous
reports7, 8, an increase in VPD dramatically reduces air water potential, and consequently well-watered plants
Scientific Reports | (2021) 11:4447 | https://doi.org/10.1038/s41598-021-83870-1 7
Vol.:(0123456789)www.nature.com/scientificreports/
were subjected to temporal shoot water deficit, as indicated in Table 2. Daytime environmental conditions in two
treatments of this study were same (see “Methods” section, 28.0 °C 70% RH [i.e., VPD = 11.3 hPa]). However, at
night, VPD decreased down to 5.3 hPa in control, whereas that of HNT treatment was 10.6 hPa, corresponding
to – 31.6 MPa of air water potential. Because PWP (i.e., xylem water potential in panicle) in HNT was – 0.46 MPa
(Table 2), the water potential gradient established between air and panicle in HNT should be 31.2 MPa, much
smaller than that of 24 h foehn-induced dry wind conditions (125.6 MPa)8. Therefore, the extent of nighttime
water deficit in this study was suggested to be surprisingly mild. Given the fact that carbon transport actively
occurred to the growing kernels during daytime in HNT treatment (Fig. 2A) and less accumulation of solutes
at daytime (Fig. 4B), shoot water deficit would be released during daytime, causing a reversible effect on rice
physiology.
Regulation of endosperm cell expansion under HNT conditions. Morita et al.4 applied same HNT
treatment (34 °C, 80% RH at night) throughout ripening stage (for 40 days) and observed severe cell volume
reduction over a wide range of endosperms with shorter duration of grain growth than control. When conducted
10 day HNT treatment in this study, inhibition of cell expansion was confined within a part of inner endosperms
(see Fig. 1). The main difference in endosperm cell morphology between two studies was attributed to the dura-
tion difference, rather than difference in intensity of water deficit. Under HNT conditions, an inhibition of
cell expansion mainly occurred from dorsal to lateral endosperms and a reduction in grain width (Fig. 1 and
Table 1), also leading to a remarkable shift of the central point towards the dorsal epidermis (Fig. S1), consistent
with Nagato and E bata22. Regarding the grain growth duration, the maximum grain growth rate between HNT
treatment and control was suggested to be 13 DAH and 16 DAH, respectively4. In this study, we have used the
grains with the same developmental stage to study cell expansion process at 9 DAH, so that the potential age
difference between treatments could be minimized. It has been reported that a decrease in grain dry weight
observed under HNT conditions was mainly caused by a reduction in cell expansion rate4. When plant cell
expands, the water potential gradient associated with growth (i.e., growth-induced water potential) would be
established between xylem and expanding cells23, 24, even when transpiration occurs simultanelously25. The data
suggest that a reduction in growth-induced water potential might occur at HNT (Table 2). Additionally, cell
turgor is required to expand wall during cell expansion; however, there was no treatment difference in turgor
(Table 2). Although cell hydraulic conductivity and wall extensibility associated with cell expansion rate through
metabolic alterations have not been determined in this study, these parameters might also be associated with the
regulation of cell expansion at HNT, as discussed below.
Metabolic changes at osmotic adjustment under HNT conditions. Combining water status meas-
urements with in situ intact cell metabolomics indicate that cells were adjusted osmotically at HNT, similar to
those observed under dry wind c onditions8, 9. Also, turgor maintenance was observed by solute accumulation,
mainly sugars and amino acids, similar to the early s tudy26. An increase in osmotic pressure was 0.15 MPa (see
Table 2), corresponding to approximately 61.5 mM (when calculated as sucrose). Metabolic changes in sugars
and amino acids may refer to the slowdown in metabolic rate, presumably to minimize energy consumption at
osmotic adjustment, increasing osmotic pressure to partially sustain cell expansion through turgor maintenance
(Table 2). Other main solutes detected, such as wall-related compounds and redox metabolites in intact cells
would also take part in the increase in osmotic pressure (Fig. 4A, Table S1 and Table 2). Henzler and S teudle27
treated the alga, Chara corallina with hydrogen peroxide to observe a reduction in cell hydraulic conductivity,
through the deactivation of channel, which shows a close relationship between membrane permeability and
redox status28. If similar metabolic alteration had occurred in the membrane under HNT conditions, this may
partially explain the observed reduction in cell size, as addressed above.
Similar to high day temperature (HDT) conditions16, an increase in content of redox-related metabolites, such
as dehydroascorbic acid, monodehodroascorbic acid, and glutathione at night and ascorbic acid at daytime was
observed, at the stage examined (Table S1). In the endosperms treated at HDT, considerable accumulation of
cysteine that forms disulfide bridges has been observed prior to the chalky formation throughout a reduction in
cytosolic protein s ynthesis16. In contrast to HDT, it has been shown that there were little changes in cysteine con-
tent between two timings in the inner endosperms under HNT conditions (Table S1). This suggests that cysteine
might not participate in osmotic adjustment and protein synthesis itself might not be considerably inhibited
by HNT, contrastingly different from the responses to HDT c onditions16. 13C analysis suggests that starch bio-
synthesis might be sustained by adequate assimilate supply at low water potential (Fig. 2). Consequently, starch
granules (and protein bodies) are most likely to completely fill up the cells whose volume was partially reduced
throughout osmotic adjustment, as no chalkiness was observed in lateral side (Fig. 1B). Furthermore, the cell
metabolomics described here illustrates that several key metabolic pathways associated with cell expansion are
likely to be retarded during HNT conditions, as can be seen in Fig. 5 (75.8% of control at 9 DAH). UDP-glucose
is the precursor of cellulose synthesis. Materials for matrix polysaccharides, such as UDP-glucose and pentose
appeared to remain in cytosol without supplying from cytoplasm to the wall, causing a slight decline in cell
expansion rate in the inner zone. In Arabidopsis, the delivery of cellulose synthase (CESA) complex to plasma
membrane was inhibited under osmotic s tress29. Here, 13C analysis combined with water status measurement
shows greater carbon supply from source to sink occurred at shoot water deficit (Fig. 2 and Table 2), although
greater accumulation of p-coumaric acid, UDP-glucose, UDP-d-xylose (arabinose), and UDP simultaneously
occurred in the target cells (Fig. 4A and Table S1); this fact strongly suggests a partial inhibition of wall biosyn-
thesis caused by osmotic adjustment under HNT conditions. Although cell wall would be remodeled by pectin
methylesterase under heat s tress30, our data showed that there might be less effect on pectin-related metabolites
at nighttime, except for α-l-rhamnose (p = 0.09) (Table S1). As consequence, these metabolic changes might alter
Scientific Reports | (2021) 11:4447 | https://doi.org/10.1038/s41598-021-83870-1 8
Vol:.(1234567890)www.nature.com/scientificreports/
Figure 5. Air temperature setting of 10 day HNT treatment conducted during early ripening stage in this study
(A). Arrow in (A) indicates initiation of HNT treatment. Putative changes in cell volume in inner endosperms
under HNT conditions throughout development (B) (see Fig. 1). The graph was generated based on the cell
volume data shown in Fig. 1F, assuming that cell growth rate during daytime was similar to control. Inset in (B)
shows expanded putative diurnal growth curve, and the cell growth rate (GR) in control and HNT was estimated
to be 48.0 pL . d−1 and 36.4 pL . d−1, respectively. Solid and dashed lines in (A) and (B) indicate control and HNT
treatment, respectively.
wall extensibility, as mentioned above. Although there was no statistical treatment difference in cell volume at
9 DAH (Fig. 1F), 13C feeding experiment (8–9 DAH), water status measurement, and metabolites changes at 9
DAH reveals clear treatment differences in water relations and metabolisms in the inner cells during nighttime.
The opposite pattern of diurnal changes in glutamine content may reflect to phloem unloading (Fig. 4, Table S1).
It is known that cell wall synthesis and cell expansion could be asynchronous, and typically cell expansion
occurred faster at nighttime due to the higher water potential at low evaporative d emand31. Therefore, we gave
a putative growth of inner endosperm cell volume (Fig. 5) in this study. In control treatment, the growth rate is
faster at nighttime; in HNT treatment, because of the mild water deficit and osmotic adjustment at nighttime, the
growth rate is lower than control. The temperature at daytime was same in both treatments, and thus we assumed
that the growth rate at daytime is similar. Even though there is no significant difference in cell volume at 9 DAH
(Fig. 1F), the growth rate of HNT treatment is about 75.8% of control (Fig. 5B). HNT treatment also accelerated
grain development, and then the inner endosperm cells almost stopped to grow after 15 DAH.
Chalky formation under HNT conditions. We have previously reported that osmotic adjustment is
involved in ring-shaped chalky formation under 24 h foehn-induced dry wind c onditions8, 9, 32. There is grow-
ing evidence that preservation of numerous vacuolar structures sustained among amyloplasts in the osmot-
ically adjusted cells leads to chalky formation under dry wind c onditions32, 33 and HDT conditions16. Based
on the data, it is reasonably interpreted that shoot water deficit in this work might have progressed gradually
as a ‘reversible acclimation process’. It has been noted that HNT-treated Koshihikari kernels exhibited chalki-
ness in outer endosperms along the basal side and dorsal vasculatures (see “Results” section, Fig. 1B). In rice
endosperms, all the cells should have taken over same genomes from parents through double-fertilization. It
should be emphasized that various chalkiness and/or reduction in cell size often coexist in the same endosperms,
largely depending on the extent/duration of stress conditions, as addressed above. Therefore, these chalky phe-
notypes might refer to the consequence of various heat acclimations tightly coordinated with embryo growth.
A possible interaction between water stored in chalky area and the promotion of embryo development has been
suggested under HDT conditions16. In this view, there may be certain mechanism(s) for exchanging molecular
signal(s) between embryo and endosperm.
The impact of endosperm cell expansion under HNT conditions. It has been accepted that HNT
decreases rice grain weight2, 4, 34, simultaneously causing chalky formation as described above (Fig. 1). Regarding
the exact contributions of cell size reduction and chalky formation to the total grain weight loss, any quantitative
analysis has not been provided yet. Since whole volume of control perfect rice and HNT-treated chalky rice was
15.63 and 14.87 mm3, respectively (Table 1), and the kernel weight was 20.78 and 19.64 mg, respectively, giving
1.13 mg difference as the total weight loss under HNT conditions; therefore, density of the perfect rice and HNT-
treated chalky rice (basal-white and white-back rice) can be estimated as 1.33 and 1.32 mg mm−3, respectively.
Embryo dry weight of the perfect rice and chalky rice of total kernel dry weight was negligibly small (both less
Scientific Reports | (2021) 11:4447 | https://doi.org/10.1038/s41598-021-83870-1 9
Vol.:(0123456789)www.nature.com/scientificreports/
than 4%). Assuming that grain density of control perfect rice and HNT-treated perfect rice is same, grain weight
of HNT-treated perfect rice was estimated to be 19.77 (= 1.33 × 14.87) mg, and hence weight loss from chalky
formation was calculated to be 0.12 (= 19.77–19.64) mg. And then, the contribution percentage of chalky forma-
tion to the reduction in kernel weight could be determined as 11.02(= 0.12/[20.78–19.64] × 100)%, and the rest
88.98 (= 100–11.02)% would be due to the reduction in cell expansion. Therefore, inhibition of cell expansion
accounts for the kernel weight loss. Even if air spaces in chalky cells were filled with materials (mostly starch in
the zone), the contribution percentage would decline. This estimation is quite reasonable, when considering that
the area threshold above which chalkiness appears ranges between 10.3 and 25.1%16.
Conclusion
In conclusion, plants were subjected to the moderate shoot water deficit at nighttime through an increase in
VPD, and a partial inhibition of cell expansion was caused by osmotic adjustment. The observed size reduc-
tion in the growing cells was shown to occur as the consequence of osmotic adjustment. HNT-induced cellular
responses were monitored by using picoPPESI-MS in intact plants at real time under controlled environments;
it was found that these responses were dynamic in osmotically adjusted cells, accompanied with modification
of hydraulic properties and wall and starch biosyntheses. Furthermore, the increase of relative concentration
of several metabolites observed here strongly supports our hypothesis. Hence, we propose that the observed
cell size reduction in inner endosperms would be attributed to osmotic adjustment at mild shoot water deficit
caused by increasing VPD at night.
Materials and methods
Plant materials. A growth-chamber experiment was conducted in Kyushu Okinawa Agricultural Research
Center, Chikugo, Japan in 2018. The experiment was laid out in a completely randomized design with two treat-
ments (HNT and control) and at least three biological replcations for a total of 24 experimental pots. Two week-
old Oryza sativa L. cv. ‘Koshihikari’ seedlings (ten seedlings per pot) were transplanted into plastic pots (3.82 L,
diameter 0.16 m, and height 0.2 m) containing a lowland paddy soil (Typic Endoaquepts). They were grown by
removing the tillers periodically to restrict each plant to its main culm to minimize sample-to-sample variation
and cultivated in a cycle of day/night air temperatures of 28 °C (13 h, 5:50–18:50)/22 °C (11 h, 18:50–5:50) at
70/80% relative humidity (RH) and 750 μmol photons m −2 s−1 photosynthetically active radiation set at the plant
canopy throughout development. At 5 DAH daytime, approximately half of the plants were transferred to another
growth chamber set at 28 °C and 70% relative humidity/34 °C and 80% RH (day/night) and 750 μmol m−2 s−1
photosynthetically active radiation with the same photoperiod to be treated at high temperature for 10 days
(referred to as ‘HNT treatment’). HNT treatment was initiated from 5 DAH nighttime (18:50). Other potted
plants were kept in the same chamber as control (28/22 °C). At 15 DAH, the potted plants treated under HNT
conditions were transferred to control chamber to grow until the mature stage (40 DAH).
Whole‑plant 13C distribution analyses. The plants were labeled with 13CO2 at 8 DAH (at the 3rd day
after initiation of high night treatment) for the 13C distribution analysis described p
reviously9, 35. The flag leaf
was exposed to 13CO2. 13CO2 was applied by gently enclosing the leaf inside a 1.27-L polyester gas sampling bag
(45 μm thickness, Analytic-Barrier, Ohmi Odor Air Services Inc., Tokyo, Japan) with a plastic container contain-
ing 0.5 g B a13CO3 (99 atom % 13C) and 13CO2 was then generated by injecting 2 mL lactic acid from the outside
of the bag. The leaf was allowed to assimilate 13C under the light conditions provided in the growth chamber
for 30 min between 1100 and 1130 h. Plant parts were similarly harvested and separated into six components:
flag leaf blade, flag leaf sheath, uppermost internode, whole panicle, superior kernels (used in the following cell
metabolomics and turgor measurement), and other organs. The six tissue components were freeze-dried and the
other organs were oven-dried with forced air, after which they were ground to a fine powder. For each tissue,
approximately 1.0 mg well-mixed powder was used to determine total carbon and the isotopic ratio of 12C:13C
using an element analyzer/isotopic ratio MS (Integra CN, Sercon, UK). Whole-plant 13C abundance was esti-
mated according to Mohapatra et al.35.
In situ intact cell metabolomics and turgor assay. We have used picoPPESI-MS14 to conduct in situ
intact cell metabolomics in the inner endosperm under controlled environments, as described p reviously16, 17.
The analytical method was performed in the expanding inner endosperm cells of the superior kernels, attached
to the primary and secondary pedicels on the first to third primary rachis branches, counted from the top of the
panicle (see Fig. 2A). And, grain score was monitored as described previously9. The system was composed of
picoPPESI-MS and two cellular measurement rooms attached to growth chambers individually. When the ker-
nel score reached to 0.89 at 9 DAH, potted plants were placed at the center of a vibration-free table in the room.
A part of the hull in the attached kernels was quickly and gently removed under humid conditions. And then,
a biopsy punch was used to remove 0.031 cm2 of pericarp tissue in the lateral side of the kernel prior to the tip
insertion to minimize the possible contamination effect from the pericarp cell layers. The kernel was gently fixed
on the sample holder using tape and magnets. The microcapillary tip filled with 0.01% (v/v) ionic liquid/silicone
oil mixture14 was impaled into the target inner endosperm cells (typically between 350 and 450 μm below nucel-
lar-epidermis at the stage) with the aid of a motorized piezomanipulator. Cellular fluid was collected by depres-
surizing in the microcapillary, and the probe tip mounted on the 3D move/rotation micro-manipulator was
immediately oriented toward the orifice of an Orbitrap mass spectrometer (Q-Exactive, Thermo Fisher Scientific
Inc., MA, US) was electrified with − 4 kV using a high voltage generator (AKTB-05k1PN/S, Touwa Keisoku
Corp., Tokyo, Japan). The MS scan was performed in negative ion mode in duplicate with the instrumental
settings of 200 ms as maximum injection time, inlet ion transfer tube temperature of 250 °C, and resolution of
Scientific Reports | (2021) 11:4447 | https://doi.org/10.1038/s41598-021-83870-1 10
Vol:.(1234567890)www.nature.com/scientificreports/
35,000. The intensity threshold has been set to be 1000 in this study. All the signals with less than the threshold
had been rejected prior to the analysis. When the target cells were successfully impaled to collect picolitre cel-
lular fluid without tip plugging, the entire process of picoPPESI-MS analysis on the cells was completed within
few minutes. All manipulations were conducted under a digital microscope (KH-8700, HIROX Co. Ltd., Tokyo,
Japan). Reported mass spectra are representative of the same experiments from 9 to 14 kernels from at least three
independent plants in each treatment. Additionally, in situ cell turgor assay in the expanding endosperm located
at the same lateral zone in the kernels was independently determined under humid conditions without removing
the pericarp, as described previously8. Cell turgor values reported here represent averages of 12–15 cells from 5
to 8 kernels from at least 3 independent plants.
Metabolite identification. The list of monoisotopic exact m/z values for all the peaks on acquired mass
spectra were extracted using “Qual Browser” application in the Thermo Xcalibur software (Thermo Fisher Sci-
entific Inc., MA, USA). According to the previous w ork14, the metabolites were identified at less than 5 ppm
differences from the theoretical masses of candidate metabolites in an on-line metabolomics database, Met-
lin (http://metlin.scripps.edu/index.php). Endosperm tissues collected at the same stage were ground, and the
extracts were centrifuged for 15 min at 4240×g at 4 °C, and the supernatant (crude tissue extract) was used
for the MS/MS analysis. By using an Orbitrap MS (Orbitrap Elite, Thermo Fisher Scientific Inc., MA, the US)
coupled with the picoPPESI system, collision-induced dissociation (CID) tandem MS analysis was performed
for PI(34:2), allowing the MS/MS identification in the picolitre supernatant (i.e. crude tissue extract). The MS
scan was performed in negative ion mode with the same settings as described above, except that the resolution
was 120,000. Some of the metabolites were identified based on the results obtained by MS/MS analysis in our
previous studies15, 16. All the standard chemicals and organic solvents used in the experiments were LC/MS grade
purchased from Wako Pure Chemical Industries, Ltd. (Osaka, Japan). Ultrapure water of 18.2 MΩ cm−1 was used
throughout the experiment.
Plant water relations. Panicle water potentials at night were determined using a pressure-chamber tech-
nique (Pump-up model, PMS Instruments, OR, USA). For half of the samples, the tissue-averaged kernel water
potential of 9 DAH spikelets attached to the same position, where the on-site cell metabolomics was conducted,
was determined at nighttime (04:30 h to 05:30 h) with isopiestic p sychrometers36 after determination of PWP
according to the previous s tudies8. A linear regression was obtained from PWP by pressure-chamber and kernel
water potential by isopiestic psychrometers. The reported kernel water potential was calculated by the linear
regression.
Microscopy. Microscopic observation was conducted according to Sato et al.37, 38 and Hatakeyama et al.32.
Transverse segments (1–2 mm thick) from the middle of the kernel at 9, 15, and 35 DAH were fixed with 4%
(w/v) paraformaldehyde in 100 mM sodium phosphate (pH 7.2) for 3 h at room temperature and then washed
in 100 mM phosphate buffer (pH 7.2). Fixed tissues were dehydrated through an ethanol series, and embedded
in LR White resin in the ‘hard’ formulation (London Resin, Hampshire, UK) by 2-days polymerizing at 60 °C.
Semi-thin sections (appropriately 900 nm) for light microscopy were stained with 0.1% (w/v) Coomassie Bril-
liant Blue for 1 h followed by potassium iodide for 1 min, and ultra-thin sections (approximately 80–100 nm) for
electron microscopy were stained with lead citrate. After the staining, ultra-thin sections were observed with a
transmission electron microscope (TEM; JEM-1010, JEOL Ltd., Tokyo, Japan). Sections were cut with an ultra-
microtome (Sorvall MT-5000, DuPont, Newtown, CT, USA) using a diamond knife. For the endosperm cell area
analysis, the outline of inner endosperm cells was traced by using ImageJ software (National Institutes of Health,
Bethesda, MD, USA). The number of cells in endosperm cross-sections along lateral sides from central point of
the kernels in each treatment was counted.
Kernel quality, weight, and dimensions. Superior kernels attached to the same position (top 3
branches, see Fig. 2A) of a panicle in each treatment were harvested. Grain length (2r1), width (2r2) and thick-
ness (2r3) were measured by digital caliper (GDCS-300, Niigataseiki Co., Ltd., Niigata, Japan). Grain volume was
calculated by V = 4/3π r1r2r3. The dry weight of kernel samples in each treatment was determined, as described
previously8. The final grain weight was reported with 15% moisture content in each treatment. Reported grain
weight represents averages of 5–6 independent plants (n = 5–6), and 8 superior grains (brown rice) were pooled
in each plant (panicle). Grain dimension represents averages of 25 kernels collected from 5 independent plants
(n = 25).
Statistical analysis. Analysis of all data was performed using Student’s t test in JMP (version 12.1.0; SAS
Institute Inc., Cary, NC, USA).
Data availability
The datasets generated during and/or analyzed during the current study are available from the corresponding
author on reasonable request.
Received: 29 October 2020; Accepted: 27 January 2021
Scientific Reports | (2021) 11:4447 | https://doi.org/10.1038/s41598-021-83870-1 11
Vol.:(0123456789)www.nature.com/scientificreports/
References
1. Chowdhury, S. & Wardlaw, I. The effect of temperature on kernel development in cereals. Aust. J. Agric. Res. 29, 205–223. https://
doi.org/10.1071/AR9780205 (1978).
2. Peng, S. et al. Rice yields decline with higher night temperature from global warming. Proc. Natl. Acad. Sci. U.S.A. 101, 9971–9975.
https://doi.org/10.1073/pnas.0403720101 (2004).
3. Xu, J., Henry, A. & Sreenivasulu, N. Rice yield formation under high day and night temperatures—A prerequisite to ensure future
food security. Plant Cell Environ. 43, 1595–1608. https://doi.org/10.1111/pce.13748 (2020).
4. Morita, S., Yonemaru, J. & Takanashi, J. Grain growth and endosperm cell size under high night temperatures in rice (Oryza sativa
L.). Ann. Bot. 95, 695–701. https://doi.org/10.1093/aob/mci071 (2005).
5. Morita, S. et al. Effect of high temperature on grain ripening in rice plants: Analysis of the effects of high night and high day tem-
peratures applied to the panicle and other parts of the plant (In Japanese with English abstract). Jpn. J. Crop Sci. 73, 77–83. https
://doi.org/10.1626/jcs.73.77 (2004).
6. Sadok, W. & Jagadish, S. V. K. The hidden costs of nighttime warming on yields. Trends Plant Sci. 25, 644–651. https://doi.
org/10.1016/j.tplants.2020.02.003 (2020).
7. O’Toole, J. C., Hsiao, T. C. & Namuco, O. S. Panicle water relations during water-stress. Plant Sci. Lett. 33, 137–143. https://doi.
org/10.1016/0304-4211(84)90003-8 (1984).
8. Wada, H. et al. Increased ring-shaped chalkiness and osmotic adjustment when growing rice grains under foehn-induced dry
wind condition. Crop Sci. 51, 1703–1715. https://doi.org/10.2135/cropsci2010.08.0503 (2011).
9. Wada, H. et al. Rice chalky ring formation caused by temporal reduction in starch biosynthesis during osmotic adjustment under
foehn-induced dry wind. PLoS ONE 9, e110374. https://doi.org/10.1371/journal.pone.0110374 (2014).
10. Hoshikawa, K. The Growing Rice Plant: An Anatomical Monograph (Nosan Gyoson Bunka Kyokai, Tokyo, 1989).
11. del Rosario, A. R., Briones, V. P., Vidal, A. J. & Juliano, B. O. Composition and endosperm structure of developing and mature rice
kernel. Cereal Chem. 45, 225–235 (1968).
12. Hoshikawa, K. Studies on the development of endosperm in rice: 1. process of endosperm tissue formation (In Japanese with
English abstract). Jpn. J. Crop Sci. 36, 151–161. https://doi.org/10.1626/jcs.36.151 (1967).
13. Hüsken, D., Steudle, E. & Zimmermann, U. Pressure probe technique for measuring water relations of cells in higher plants. Plant
Physiol. 61, 158–163. https://doi.org/10.1104/pp.61.2.158 (1978).
14. Nakashima, T. et al. Single-cell metabolite profiling of stalk and glandular cells of intact trichomes with internal electrode capillary
pressure probe electrospray ionization mass spectrometry. Anal. Chem. 88, 3049–3057. https: //doi.org/10.1021/acs.analch em.5b033
66 (2016).
15. Blokhina, O. et al. Ray parenchymal cells contribute to lignification of tracheids in developing xylem of Norway spruce. Plant
Physiol. 181, 1552–1572. https://doi.org/10.1104/pp.19.00743 (2019).
16. Wada, H. et al. Multiple strategies for heat adaptation to prevent chalkiness in the rice endosperm. J. Exp. Bot. 70, 1299–1311.
https://doi.org/10.1093/jxb/ery427 (2019).
17. Wada, H. New approaches combined with environmental control for enhancing heat-tolerant rice breeding in Japan (Chapter 3)
in Adaptation to Climate Change in Agriculture (eds Iizumi, T., Hirata, R., & Matsuda, R.) 37–51 (Springer, Singapore). https://
doi.org/10.1007/978-981-13-9235-1_3 (2019).
18. Wada, H. et al. On-site single pollen metabolomics reveals varietal differences in phosphatidylinositol synthesis under heat stress
conditions in rice. Sci. Rep. 10, 2013. https://doi.org/10.1038/s41598-020-58869-9 (2020).
19. Cutler, J. M., Shahan, K. W. & Steponkus, P. L. Dynamics of osmotic adjustment in rice. Crop Sci. 20, 310–314. https://doi.
org/10.2135/cropsci1980.0011183X002000030005x (1980).
20. Cutler, J. M., Shahan, K. W. & Steponkus, P. L. Alteration of the internal water relations of rice in response to drought hardening.
Crop Sci. 20, 307–310. https://doi.org/10.2135/cropsci1980.0011183X002000030004x (1980).
21. Hsiao, T. C., O’Toole, J. C., Yambao, E. B. & Turner, N. C. Influence of osmotic adjustment on leaf rolling and tissue death in rice
(Oryza sativa L.). Plant Physiol. 75, 338–341. https://doi.org/10.1104/pp.75.2.338 (1984).
22. Nagato, K. & Ebata, M. Effects of high temperature during ripening period on the development and the quality of rice kernels (In
Japanese with English abstract). Jpn. J. Crop Sci. 34, 59–66. https://doi.org/10.1626/jcs.34.59 (1965).
23. Nonami, H. & Boyer, J. S. Direct demonstration of a growth-induced water potential gradient. Plant Physiol. 102, 13–19. https://
doi.org/10.1104/pp.102.1.13 (1993).
24. Nonami, H., Wu, Y. J. & Boyer, J. S. Decreased growth-induced water potential: Primary cause of growth inhibition at low water
potentials. Plant Physiol. 114, 501–509. https://doi.org/10.1104/pp.114.2.501 (1997).
25. Westgate, M. E. & Boyer, J. S. Transpiration- and growth-induced water potentials in maize. Plant Physiol. 74, 882–889. https://
doi.org/10.1104/pp.74.4.882 (1984).
26. Meyer, R. F. & Boyer, J. S. Sensitivity of cell division and cell elongation to low water potentials in soybean hypocotyls. Planta 108,
77–87. https://doi.org/10.1007/BF00386508 (1972).
27. Henzler, T. & Steudle, E. Transport and metabolic degradation of hydrogen peroxide in Chara corallina: model calculations and
measurements with the pressure probe suggest transport of H 2O2 across water channels. J. Exp. Bot. 51, 2053–2066. https://doi.
org/10.1093/jexbot/51.353.2053 (2000).
28. Schmidt, R., Kunkowska, A. B. & Schippers, J. H. Role of reactive oxygen species during cell expansion in leaves. Plant Physiol.
172, 2098–2106. https://doi.org/10.1104/pp.16.00426 (2016).
29. Gutierrez, R. et al. Arabidopsis cortical microtubules position cellulose synthase delivery to the plasma membrane and interact
with cellulose synthase trafficking compartments. Nat. Cell Biol. 11, 797–806. https://doi.org/10.1038/ncb1886 (2009).
30. Wu, H. C., Bulgakov, V. P. & Jinn, T. L. Pectin methylesterases: cell wall remodeling proteins are required for plant response to heat
stress. Front. Plant Sci. https://doi.org/10.3389/fpls.2018.01612 (2018).
31. Verbančič, J., Lunn, J. E., Stitt, M. & Persson, S. Carbon supply and the regulation of cell wall synthesis. Mol. Plant 11, 75–94. https
://doi.org/10.1016/j.molp.2017.10.004 (2018).
32. Hatakeyama, Y. et al. Evidence for preservation of vacuolar compartments during foehn-induced chalky ring formation of Oryza
sativa L. Planta 248, 1263–1275. https://doi.org/10.1007/s00425-018-2975-x (2018).
33. Brunel-Muguet, S. et al. Heat stress during seed filling interferes with sulfur restriction on grain composition and seed germination
in oilseed rape (Brassica napus L.). Front. Plant Sci. 6, 213. https://doi.org/10.3389/fpls.2015.00213 (2015).
34. Shi, W. et al. High day- and night-time temperatures affect grain growth dynamics in contrasting rice genotypes. J. Exp. Bot. 68,
5233–5245. https://doi.org/10.1093/jxb/erx344 (2017).
35. Mohapatra, P. K. et al. Partitioning of 13C-labelled photosynthate varies with growth stage and panicle size in high-yielding rice.
Funct. Plant Biol. 31, 131–139. https://doi.org/10.1071/FP03177 (2004).
36. Boyer, J. S. Measuring the Water Status of Plants and Soils (Academic Press, Cambridge, 1995).
37. Saito, Y. et al. Ultrastructure of mature protein body in the starchy endosperm of dry cereal grain. Biosci. Biotechnol. Biochem. 74,
1485–1487. https://doi.org/10.1271/bbb.100147 (2010).
38. Saito, Y. et al. Formation mechanism of the internal structure of type I protein bodies in rice endosperm: relationship between the
localization of prolamin species and the expression of individual genes. Plant J. 70, 1043–1055. https://doi.org/10.1111/j.1365-
313X.2012.04947.x (2012).
Scientific Reports | (2021) 11:4447 | https://doi.org/10.1038/s41598-021-83870-1 12
Vol:.(1234567890)www.nature.com/scientificreports/
Acknowledgements
The authors thank Ms. Fujiko Komiya for her help in growing the rice plants and assistance with the experiments.
RE-B is research member of National Council of Scientific and Technological Research (CONICET), Argentina.
This work was supported by JSPS KAKENHI Grant Number 16H02533. F.Y.-C. thanks the scholarship from
“Agriculture Elitist Training Project” of Council of Agriculture, Executive Yuan, Taiwan.
Author contributions
H.W. and F.Y.-C. conceived the study. F.Y.-C. and Y.H. performed the experiments, H.W. and F.Y.-C. analyzed
data. H.W. and F.Y.-C. prepared the manuscript. Y.H., R.E.-B., T.A., H.Na., and H.No. participated in analysis of
data and assisted in writing the manuscript. All authors read and approved the manuscript.
Competing interests
The authors declare no competing interests.
Additional information
Supplementary Information The online version contains supplementary material available at https://doi.
org/10.1038/s41598-021-83870-1.
Correspondence and requests for materials should be addressed to H.W.
Reprints and permissions information is available at www.nature.com/reprints.
Publisher’s note Springer Nature remains neutral with regard to jurisdictional claims in published maps and
institutional affiliations.
Open Access This article is licensed under a Creative Commons Attribution 4.0 International
License, which permits use, sharing, adaptation, distribution and reproduction in any medium or
format, as long as you give appropriate credit to the original author(s) and the source, provide a link to the
Creative Commons licence, and indicate if changes were made. The images or other third party material in this
article are included in the article’s Creative Commons licence, unless indicated otherwise in a credit line to the
material. If material is not included in the article’s Creative Commons licence and your intended use is not
permitted by statutory regulation or exceeds the permitted use, you will need to obtain permission directly from
the copyright holder. To view a copy of this licence, visit http://creativecommons.org/licenses/by/4.0/.
© The Author(s) 2021
Scientific Reports | (2021) 11:4447 | https://doi.org/10.1038/s41598-021-83870-1 13
Vol.:(0123456789)You can also read


