A novel stepwise integrative analysis pipeline reveals distinct microbiota host interactions and link to symptoms in irritable bowel syndrome - Nature
←
→
Page content transcription
If your browser does not render page correctly, please read the page content below
www.nature.com/scientificreports

                OPEN             A novel stepwise integrative
                                 analysis pipeline reveals distinct
                                 microbiota‑host interactions
                                 and link to symptoms in irritable
                                 bowel syndrome
                                 Annikka Polster1*, Lena Öhman1,2, Julien Tap3, Muriel Derrien3, Boris Le Nevé3,
                                 Johanna Sundin1,2, Hans Törnblom1, Marija Cvijovic4,6 & Magnus Simrén1,5,6

                                 Although incompletely understood, microbiota-host interactions are assumed to be altered in
                                 irritable bowel syndrome (IBS). We, therefore, aimed to develop a novel analysis pipeline tailored for
                                 the integrative analysis of microbiota-host interactions and association to symptoms and prove its
                                 utility in a pilot cohort. A multilayer stepwise integrative analysis pipeline was developed to visualize
                                 complex variable associations. Application of the pipeline was demonstrated on a dataset of IBS
                                 patients and healthy controls (HC), using the R software package to analyze colonic host mRNA and
                                 mucosal microbiota (16S rRNA gene sequencing), as well as gastrointestinal (GI) and psychological
                                 symptoms. In total, 42 IBS patients (57% female, mean age 33.6 (range 18–58)) and 20 HC (60%
                                 female, mean age 26.8 (range 23–41)) were included. Only in IBS patients, mRNA expression of
                                 Toll-like receptor 4 and genes associated with barrier function (PAR2, OCLN, TJP1) intercorrelated
                                 closely, suggesting potential functional relationships. This host genes-based “permeability cluster”
                                 was associated to mucosa-adjacent Chlamydiae and Lentisphaerae, and furthermore associated to
                                 satiety as well as to anxiety, depression and fatigue. In both IBS patients and HC, chromogranins,
                                 secretogranins and TLRs clustered together. In IBS patients, this host genes-based “immune-
                                 enteroendocrine cluster” was associated to specific members of Firmicutes, and to depression and
                                 fatigue, whereas in HC no significant association to microbiota was identified. We have developed
                                 a stepwise integrative analysis pipeline that allowed identification of unique host-microbiota
                                 intercorrelation patterns and association to symptoms in IBS patients. This analysis pipeline may aid
                                 in advancing the understanding of complex variable associations in health and disease.

                                 Abbreviations
                                 IBS	Irritable bowel syndrome
                                 GI	Gastrointestinal
                                 IBS-C	IBS with constipation
                                 IBS-D	IBS with diarrhea
                                 IBS-M	IBS with mixed loose and hard stools
                                 IBS-U	Unsubtyped IBS
                                 IL	Interleukin
                                 TJP	Tight junction protein
                                 TLR	Toll-like receptor

                                 1
                                  Department of Internal Medicine and Clinical Nutrition, Institute of Medicine, Sahlgrenska University Hospital,
                                 Sahlgrenska Academy, University of Gothenburg, 41345 Göteborg, Sweden. 2Department of Microbiology and
                                 Immunology, Sahlgrenska Academy, University of Gothenburg, Göteborg, Sweden. 3Danone Nutricia Research,
                                 Palaiseau, France. 4Department of Mathematical Sciences, Chalmers University of Technology and University of
                                 Gothenburg, Göteborg, Sweden. 5Center for Functional Gastrointestinal and Motility Disorders, University of
                                 North Carolina at Chapel Hill, Chapel Hill, NC, USA. 6These authors contributed equally: Marija Cvijovic and Magnus
                                 Simrén. *email: a.v.polster@ncmm.uio.no

Scientific Reports |   (2021) 11:5521                | https://doi.org/10.1038/s41598-021-84686-9                                                 1

                                                                                                                                             Vol.:(0123456789)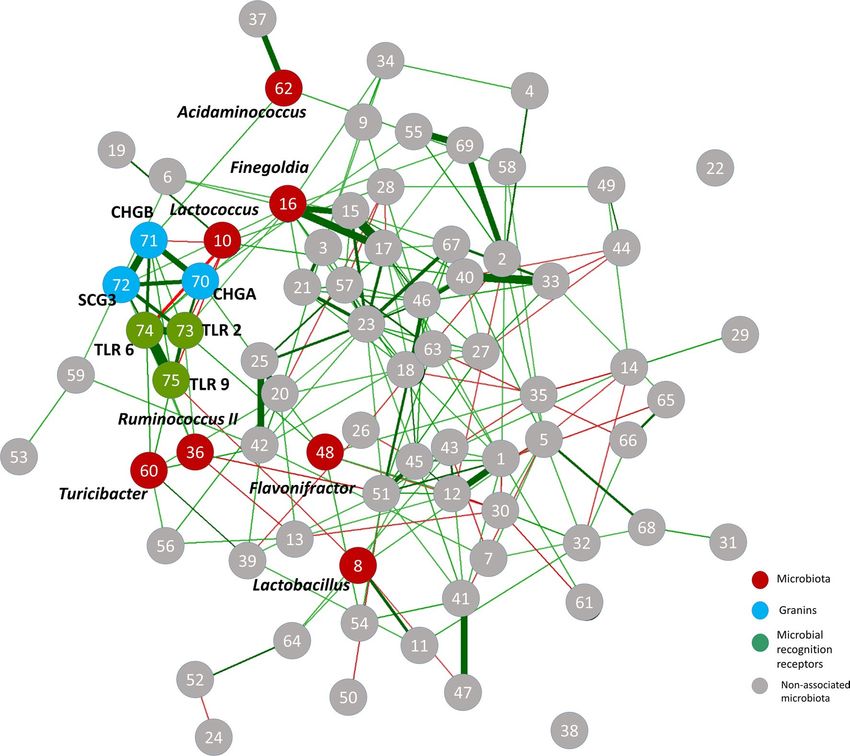
www.nature.com/scientificreports/
TNF Tumor necrosis factor
OCLN Occludin
TPH 1 Tryptophan hydroxylase 1
PAR2 Protease activated receptor 2
CLD Claudin
MUC Mucin
CHG Chromogranin
SCG Secretogranin
DOUX Dual-oxidase
NOX NAD(P)H oxidase
FFAR Free fatty acid receptor
SLC Solute carrier
Irritable Bowel Syndrome (IBS) is the most common functional bowel disorder, affecting around 10% of the
general population1–4. It is characterized by chronic and recurrent abdominal pain in combination with altered
bowel habits1,2. IBS strongly reduces quality of life and social f unction5–7 and leads to frequent work a bsenteeism7,
resulting in a significant personal and societal economic loss7,8. To this day the etiology and the underlying patho-
physiological mechanisms are incompletely understood, and treatment options remain sparse and s uboptimal9.
To improve this situation there is an ongoing effort to better understand the complex pathophysiology, in hopes
of identifying biomarkers which can be utilized to improve diagnosis and predict treatment r esponse10.
A low-grade activation of the immune system seems to be present in at least a subset of IBS p atients11–15. This
has been suggested to be of relevance for symptom generation by influencing the bidirectional communication
between gut and brain (gut-brain axis) and affecting gastrointestinal (GI) sensitivity and motility, and thus
leading to IBS s ymptoms16.
The gut microbiota ecosystem and its role in IBS symptom generation has been subject to extensive research
in the last years, with findings in patients suggesting an altered microbiota c omposition17–19, or a potential over-
reaction to gut microorganisms or their m etabolites20, as well as an influence of microbiota on the gut-brain
axis , thus contributing to both GI and psychological symptoms23–26.
21,22
Intestinal low-grade inflammation and microbiota alterations are hypothesized to be c onnected16, opening
the question as to how exactly this host-microbiota interaction is orchestrated in the gut and how this interaction
may contribute to symptom generation in IBS patients. An interaction between gut microbiota and the immune
system takes place at the mucosal border, where the mucosal tissue presents a semipermeable barrier between
the body and the intraluminal gut environment. Given the difficulties of culturing many of the gut microbial
species, the detailed understanding of the functional interaction between host and gut microbiota is currently
very limited. In silico tools that simplify the preselection of mediators with potential disease-related relevance
would greatly facilitate the design and conduction of more detailed experimental analyses to elucidate how this
interaction is orchestrated.
We hypothesize that the functionally related variables of this biological system exhibit an interdependence,
which can be approximated by the correlations between these variables. Potentially, an integrative analysis
pipeline as an exploratory method to simultaneously analyze all variables of multi-level datasets and visualize
complex variable associations in order to extract relevant information, may identify which mediators involved to
be most relevant in this interaction. The aim of this study was therefore to develop a stepwise integrative network
analysis pipeline tailored to comprehensively analyze host-microbiota interactions and the association to key
IBS symptoms. Further, we exemplify how our approach is useful for understanding relationships between gut
microbiota, host barrier function and symptoms.
Material and methods
Study cohort and biopsy collection. A cohort of well-characterized adult patients (≥ 18 years) fulfilling
the Rome III criteria for IBS2, were recruited at the gastroenterology outpatient clinic at Sahlgrenska Univer-
sity Hospital in Gothenburg, Sweden. The diagnosis of IBS was based on the clinical presentation with normal
results on a limited number of investigations and tests as deemed appropriate by an experienced gastroenter-
ologist (MS or HT). The majority of patients were referred from primary care after having already performed
sufficient investigations to rule out other diagnoses. Exclusion criteria included: abnormal results on standard
screening laboratory tests, other GI diseases or severe psychiatric or systemic diseases. Healthy controls were
recruited through advertisement and had no history of Gl or other acute or chronic diseases and no current
GI symptoms (assessed for the previous seven days). For all participants any history of drug or alcohol abuse
and the inability to reliably respond to questionnaires in Swedish lead to exclusion. Any active infection (such
as respiratory tract infections) also lead to exclusion, but no screening for recent infections was performed. All
study participants refrained from any medication known to affect the nervous system or the GI tract during the
course of this study. The use of probiotics or antibiotics was not allowed during the study period or within one
month before inclusion. Informed consent was obtained for all participants in the study. They gave their writ-
ten consent to participate after verbal and written information, all methods were performed in accordance with
relevant guidelines and regulations and the study protocol was approved by the Regional Ethical Review Board
in Gothenburg prior to the start of patient inclusion (approval number 731–09). Patients and HC were recruited
as part of an extensive pathophysiological research program which included phenotyping of GI sensorimotor
function, symptom profiles and mucosal functioning. Mucosal biopsies were obtained during a sigmoidoscopy
(performed without prior bowel preparation) from 25–35 cm proximal of the anal sphincter using standard
biopsy forceps. The biopsy specimens were taken 25–35 cm proximal of the anus during an unprepared sigmoi-
Scientific Reports | (2021) 11:5521 | https://doi.org/10.1038/s41598-021-84686-9 2
Vol:.(1234567890)
www.nature.com/scientificreports/
doscopy. Once collected, biopsy specimens were placed immediately in liquid nitrogen and stored at − 80 °C
until further analysis. To verify the absence of active inflammation a routine histopathology assessment of biopsy
specimens was conducted.
Symptom assessment and IBS subtypes. To score GI symptom severity, we utilized the Gastrointes-
tinal Symptom Rating Scale (GSRS-IBS)27, a validated 13-item questionnaire commonly used to assess the GI
symptoms typically present in IBS. This questionnaire scores symptoms on a 7-point Likert scale from 1 = “No
discomfort at all” up to 7 = “Very severe discomfort”. We have used the five GSRS domain scores (‘abdominal
pain’, ‘constipation’, ‘diarrhea’, ‘satiety’ and ‘bloating’) to represent the severity of the different major IBS symp-
toms in our patients.
Psychological symptoms were measured using the Hospital Anxiety and Depression (HAD)28 scale, the Vis-
ceral Sensitivity Index (VSI)29 and the Multidimensional Fatigue Inventory (MFI)30.
The HAD28 measures psychological distress and was developed primarily for use in medical outpatients. It
consists of 14 questions, each measuring severity with a 4-grade Likert scale (0–3). We have used these to calcu-
late subscales for severity of anxiety (seven items) and depression (seven items), where the severity is rated on a
scale from 0 to 21 with increasing severity reflected by a higher score.
The VSI29 contains 15 questions inquiring how patients respond to symptoms of the lower abdomen, and
measures the severity of adverse responses on a 6-grade Likert scale. We have used the sum score of these items
to measure the degree of GI-specific anxiety.
The MFI30 uses 20 question to measure different aspects of fatigue on a scale ranging from 4 to 20, with
increasing severity reflected by a higher score. We have used the subscore measuring general fatigue in our
analysis.
To determine IBS subtypes (Rome III)2, patients completed a two-week stool diary using the Bristol Stool
Form scale31. Subtypes were based on the predominant stool consistency in concordance with the Rome III
committee suggestions2. The subtypes IBS-M (mixed type) and IBS-U (unsubtyped) were combined into one
group, IBS without predominant diarrhea or constipation, IBS-nonCnonD.
Analysis of host gene expression. The following genes representing mucosal permeability, endocrine
activity, microbial recognition and local immune-activity were assessed in the mucosal biopsies: Microbial rec-
ognition receptors (TLR 2,4,6,9; PAR2); indicators of barrier function (CLD1; MUC; OCLN; TJP1); cytokines
(IL8; IL10; TNFα); granins (CHGA, CHGB, SCG2, SCG3); indicators of oxidative stress (DOUX2; NOX1); free
fatty acid receptors (FFAR 2,3) and indicators of enteroendocrine function (TPH1; SLC6A4).
These markers were measured using quantitative reverse transcription PCR analysis to quantify the respec-
tive mRNA expression. To extract mRNA, the NucleoSpin RNA Kit was used according to the manufacturer’s
protocol (Ref. 740,955.50, Macherey–Nagel, Düren, Germany): The biopsy was placed in lysis buffer and homog-
enized for two bursts lasting 2 min. Extracted mRNA was stored at − 80 °C. For quantification the mRNA was
reverse-transcribed to cDNA using the “Master mix Reverse Transcription Kit” (Ref. 11,755,250, Life Technolo-
gies, Carlsbad, CA). This cDNA was added to 96-well plates containing lyophilized target probes and primers
and the polymerization process was conducted using «Taqman Fast Advanced Master Mix» (Ref. 444,965, Life
Technologies). To normalize the expression of the targeted genes sequence of interest, the average expression
of several reference housekeeping genes (18S, POLR2A and RPLP0) was measured. The difference between the
average expression of reference genes and that of the sequence of interest is given as Δ Ct (cycle threshold) and
presented as 2 −(Target-Reference) or ( 2ΔCt). Several housekeeping genes were used in this normalization step to mini-
mize the chance of faulty normalization and to achieve high-quality inter-plate validation. Each analysis was run
in triplicate and the triplicates averaged.
Analysis of mucosa‑adjacent microbiota. Mucosa-adjacent microbiota DNA were isolated using
an adapted protocol based on Godon et al.32 as previously described in Tap et al.17. In short, amplification of
hypervariable 16S rRNA regions (V5-V6) was conducted using the primers 5′-AGGATTAGATACCCTGGT
A-3′ and 5′-CRRCACGAGCTGACGAC-3′. Sequencing was performed using the DNA Vision SA (Charleroi,
Belgium) on a 454 Life Sciences Genome Sequencer FLX instrument (Roche) with titanium chemistry. The
quality filtering and trimming of raw reads as well as OTU (operational taxonomic units) clustering and taxo-
nomic assignment were performed using the LotuS v1.32 pipeline. If OTUs could not be assigned as detailed as
genus-level, the most detailed taxonomical assignment achieved is given. Normalization for sequencing depth
was performed by the median of ratios method, on the OTU table, as implemented in DESeq233 in R34 and the
abundance of 188 bacterial genera used for further analysis. Phylum-level taxonomic assignment was used for
the overview-models, while taxonomic assignment up to genus-level was used for detailed analyses of the inter-
correlation clusters as described in the statistical section. Phyla/genera that were screened for but showed no hits
were removed from the network analysis plots.
Data analysis. All data analyses were performed using R (version 3.4.1—“Single Candle”)34. Univariate
comparisons were performed using Students T-test for parametric as well as Mann–Whitney U test for non-
parametric data or Pearsons’ Chi2 test as appropriate. The network analysis in the pilot study was based on a cor-
relation matrix of Spearman correlations to account for non-parametric data. The relative correlation strength
between each variable pair determined the placement of the nodes and thickness of the edges (the connect-
ing lines in-between), with closer approximation of nodes and thicker edges in-between reflecting a stronger
correlation. The graphs were then created by plotting intercorrelations between all variables, which resulted
in clustering of nodes in the cases where several variables were correlated with each other with high relative
Scientific Reports | (2021) 11:5521 | https://doi.org/10.1038/s41598-021-84686-9 3
Vol.:(0123456789)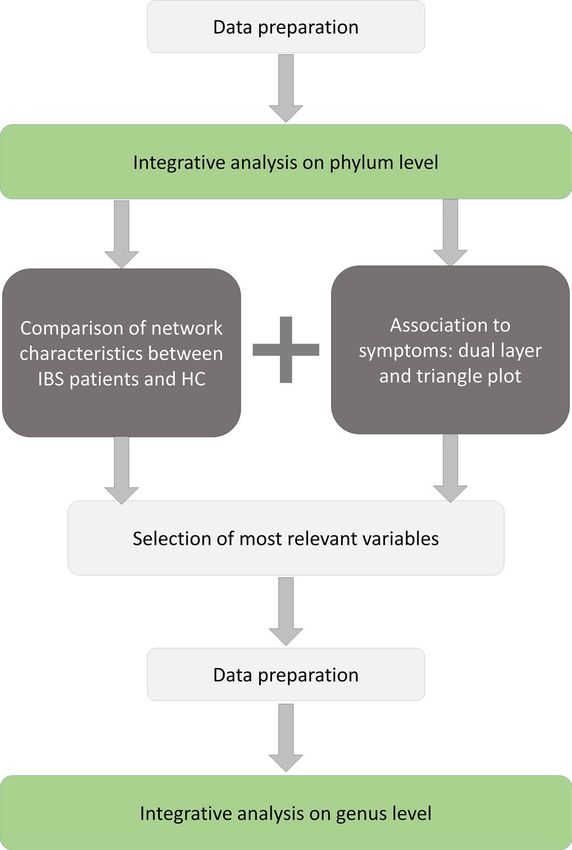
www.nature.com/scientificreports/

                                            Figure 1.  Overview of the steps performed for analyzing the pilot study dataset.

                                            correlation strength. The network visualizations were conducted using the “qgraph”-package (version 1.4.0)35.
                                            Levels of α = 0.05 (p < 0.05) were considered statistically significant. In the pilot analysis significance values were
                                            calculated uncorrected for multiple testing to favor type 1 over type 2 error given the exploratory nature of
                                            the analysis. Both cohorts were checked for multivariate outliers using principal component analysis (with the
                                            inbuilt ‘prcomp’ function in R), and strong outliers (defined as being more than 10 units outside of the 95%
                                            confidence interval) were removed.
                                                For the presented pilot study, the stepwise integrative analysis was conducted in 7 steps which are visualized
                                            in Fig. 1:

                                            1. Data preparation: To limit the complexity of the initial integrative analysis an initial summarizing or clus-
                                               tering step is necessary. Given the limited knowledge of the physiological functioning of the gut microbial
                                               species, we here decided to use phylogenetic relatedness to summarize the bacterial genera into the respec-
                                               tive phyla for the initial integrative analysis. As the pilot study dataset only contained a limited number of
                                               mucosal genes, these were not summarized here. The resulting datasets were quality checked using principal
                                               component analysis to test for multivariate outliers. This step was conducted with regards to the strong
                                               heterogeneity of the gut ecosystem as well as potential technical artifacts of the microbial and molecular
                                               analyses. Patients and HC were analyzed separately, and strong outliers were removed from the subsequent
                                               analysis if appropriate to reduce the risk for false-positive correlation results.
                                            2. Integrative analysis on phylum level: At first all correlations between host genes and microbial phyla were
                                               plotted in their relative correlation strength, disregarding the statistical significance of the correlations, in
                                               order to create an overview plot reflecting the intercorrelation-based associations between the measures in
                                               the analyzed cohort. This step gives a graphical representation of interconnectedness of the variables entered
                                               into the model and was used to identify clusters of close intercorrelation between markers of mucosal activity
                                               and microbiota. Secondly, the same correlation matrix was plotted, but statistically insignificant correlations
                                               (p ≥ 0.05) were omitted from the plot. This step was conducted especially with regards to exploring the sta-
                                               tistical significance of the before identified intercorrelation clusters.

          Scientific Reports |   (2021) 11:5521 |                https://doi.org/10.1038/s41598-021-84686-9                                                      4

Vol:.(1234567890)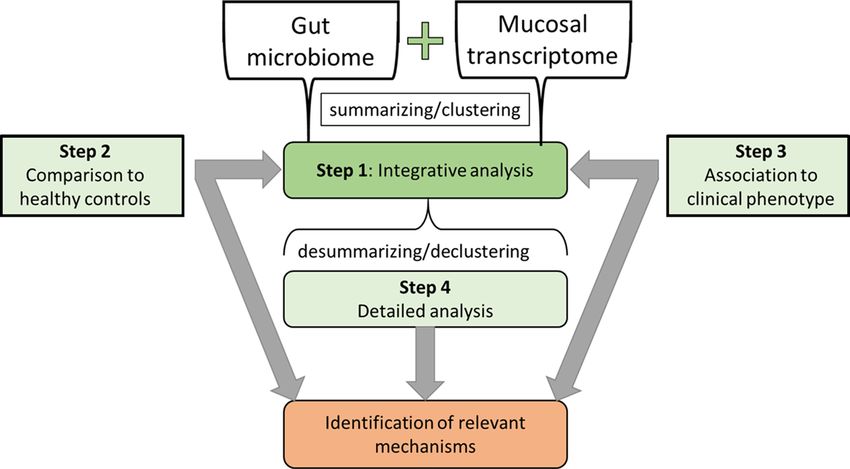
www.nature.com/scientificreports/

                                  Figure 2.  Concept of the stepwise integrative analysis pipeline.

                                  3. Comparison of network characteristics between IBS patients and HC: The plots derived from step 2 were
                                     compared between patients and HC regarding network patterns/clusters as well as network density and dif-
                                     ferences in network patterns highlighted.
                                  4. Association to symptoms: Here three separate network plots were created, representing (i) associations
                                     between microbiota and host genes, as performed in step 2, (ii) associations between GI symptoms and (iii)
                                     associations between psychological symptoms. Statistically significant correlations between variables of these
                                     plots were then added to create the respective figures.
                                  5. Selection of most relevant variables: Steps 3 and 4 were used to select variables that were part of patient-
                                     specific network patterns and/or significantly correlated to symptoms.
                                  6. Data preparation: In step 5 noteworthy phyla were selected, which were now split up again into the respec-
                                     tive genera, to achieve a more detailed understanding of which specific genera were associated to the respec-
                                     tive mucosal genes. Another quality check was performed as described in step 1.
                                  7. Integrative analysis on genus level: Previously identified relevant mucosal genes and associated microbiota
                                     were plotted and associations tested for statistical significance.

                                     Likewise, microbiotas associated only to clinical symptoms were plotted and associations tested for sta-
                                     tistical significance.

                                  Results
                                  Development of an integrative analysis pipeline. This section presents the developed integrative
                                  analysis pipeline, whereas the execution of the steps in the pipeline on the dataset, and the results thereof, are
                                  described in the consecutive sections. A conceptual visualization of the integrative analysis pipeline is given
                                  in Fig. 2. Thus, variables A (for example gut microbiome) and variables B (for example host gene expression)
                                  are initially combined into summary-variables that are then associated to each other in an integrative analysis,
                                  and plotted in a network graph. The initial summarizing step is relevant to enhance the visibility of patterns in
                                  the network graph. This is done separately in both patients and HC, and are then compared between the two
                                  groups. Furthermore, the patient network is associated to variables representing the clinical phenotype, such as
                                  key symptoms. By comparing patients to HC and by associating to the clinical phenotype, summary-variables of
                                  high interest are identified. These specific summary-variables are then de-summarized to identify in detail which
                                  variables are directly associated.

                                  Description of the study cohort. The gender distribution among IBS patients and HC was similar, but
                                  the mean age was higher in the IBS group. Most patients had moderate symptom severity as measured by the
                                  GSRS subscores with the median of the respective scores ranging from 2.5 (satiety) to 4.7 (bloating) (total range
                                  of GSRS scores 1–7), and Rome III subtypes were present to a similar extent. Details are shown in Table 1 and
                                  Fig. 3.
                                      The averaged expression levels of the mucosal host genes did not differ between IBS patients and HC. How-
                                  ever, in IBS patients significantly less OTUs were assigned to unclassified Bacteria, to Lentisphaerae and Firmi-
                                  cutes (all p < 0.01). Expression of mucosal host genes as well as normalized microbiota OTU counts are shown
                                  in Supplementary Figures 1 and 2.

Scientific Reports |   (2021) 11:5521 |                https://doi.org/10.1038/s41598-021-84686-9                                                 5

                                                                                                                                             Vol.:(0123456789)
www.nature.com/scientificreports/
Healthy
Patients controls p value
Gender female/male 24/18 12/8
Age mean (range) 33.6 (18–58) 26.8 (23–41) 0.6a
IBS-C 13 31% 0.02b
IBS-D 15 35.7%
IBS-nonCnonD 14 33.3%
Abdominal pain (GSRS) Median (IQR) 5 (3–5.5)
Constipation (GSRS) Median (IQR) 3 (1.3–4.5)
Diarrhea (GSRS) Median (IQR) 3.5 (2.5–4.8)
Bloating (GSRS) Median (IQR) 4.7 (3.3–5.3)
Satiety (GSRS) Median (IQR) 2.5 (1–3.8)
General anxiety (HAD) Median (IQR) 6 (3–10.5)
Depression (HAD) Median (IQR) 4 (1.5–6.5)
GI-specific anxiety (VSI) Median (IQR) 42 (26.3–55.5)
General fatigue (MFI) Median (IQR) 15 (10.3–18)
Table 1. Demographics, Rome III subtypes and symptom severity. GSRS: gastrointestinal symptom rating
scale. HAD: Hospital anxiety and depression scale. VSI: Visceral sensitivity index. MFI: multidimensional
index. IQR: Interquartile range. a chi2-test, bstudent’s t-text.
Figure 3. Distribution of symptom severity.
Application of the integrative analysis of host‑microbiota interactions. The mucosal host-
microbiota interaction model in IBS patients and HC based on intercorrelation of all variables is visualized in
Fig. 4. The network density, describing the number of actual connections in relation to the number of possible
connections was higher with regards to correlation strength in the HC network, defined as density of connec-
tions where p > 0.3 (IBS = 14.8% vs. HC = 18.9%) (Fig. 4A). The IBS patients’ network however showed a higher
density with regards to statistically significant connections, defined as density of connections where p < 0.05
(IBS = 15.8% vs. HC = 13.0%) (Fig. 4B). Two outliers were removed in the PCA step.
All correlation coefficients of the two models are given in Supplementary Figures 2 and 3.
Uniquely in patients, a cluster of four host genes associated to barrier function and microbial recognition
was identified, referred to as the ‘permeability cluster, which was associated to the phyla Chlamydiae and Len-
tisphaerae (Fig. 4 A and B). In both patients and HC, a cluster consisting of secretogranins and chromogranins
as well as microbial recognition receptors was identified (six genes in IBS and seven in HC), referred to as the
Scientific Reports | (2021) 11:5521 | https://doi.org/10.1038/s41598-021-84686-9 6
Vol:.(1234567890)www.nature.com/scientificreports/
Figure 4. Integrative analysis on phylum level. (A) Overview, all correlations are plotted in relative correlation
strength (disregarding statistical significance) to understand the relationships between the variables present
in the given cohorts. Clusters of high intercorrelation are marked with a red circle. (B) Significance test: Only
statistically significant correlations are plotted to estimate the generalizability of the patterns. Highlighted in
color are the intercorrelation clusters. Clusters of high intercorrelation are marked with a red circle. Green
edges show positive correlation, red edges negative correlation. Closer proximity of nodes and thicker
edges show higher relative correlation strength. 1 = CLD1; 2 = DOUX2; 3 = PAR2; 4 = FFAR2; 5 = FFAR3;
6 = IL10; 7 = IL8; 8 = OCLN; 9 = SCG2; 10 = SLC6A4; 11 = TJP1; 12 = TLR4; 13 = TNFα; 14 = MUC; 15 = NOX1;
16 = TPH1; 17 = CHGA; 18 = CHGB; 19 = SCG3; 20 = TLR2; 21 = TLR6; 22 = TLR9; 23 = unclassified bacteria;
24 = Actinobacteria; 25 = Bacteroidetes; 26 = Chlamydiae; 27 = Firmicutes; 28 = Fusobacteria; 29 = Lentisphaerae;
30 = Proteobacteria; 31 = Tenericutes; 32 = Verrucomicrobia; 33 = Euryarchaeota.
‘immune-enteroendocrine clusters’. In patients the latter cluster was associated to the phyla Firmicutes and Fuso-
bacteria, whereas the HC cluster showed no statistically significant association to microbiota at phylum level
(Fig. 4 A and B).
Scientific Reports | (2021) 11:5521 | https://doi.org/10.1038/s41598-021-84686-9 7
Vol.:(0123456789)www.nature.com/scientificreports/
The permeability cluster uniquely found in patients contained occludin (OCLN) and tight junction protein
1 (TJP1), both involved in epithelial barrier function, as well as the microbial recognition receptors Toll-like
receptor 4 (TLR4) and protease activated receptor 2 (PAR2), which were all positively correlated to each other.
The negative correlation of this cluster to the phyla Chlamydiae and Lentisphaerae was statistically significant
(Fig. 4B).
In both IBS patients and HC, the immune-enteroendocrine cluster contained the Toll-like receptors TLR-
2, TLR-6 and TLR-9 and the chromogranins A and B as well as secretogranin 3, in HC additionally TLR-4.
In patients this cluster was negatively correlated to mucosa-adherent Firmicutes, and positively correlated to
Fusobacteria, whereas in HC no statistically significant association to any microbiota was confirmed (Fig. 4B).
Association between pattern of host‑microbiota interactions to symptoms. Two plots showing
the between-layer relationship of key IBS symptoms (symptom layers) and the intercorrelation patterns of host-
microbiota interaction (mucosal layer) were created to highlight variables significantly associated to the clini-
cal phenotype of the IBS patients. The between-layer correlations predominantly demonstrated an association
between psychological symptoms and the permeability cluster as well as the immune-enteroendocrine cluster,
whereas gastrointestinal symptoms were directly associated to several microbiota and mucosal genes, and indi-
rectly connected to the clusters (Fig. 5 A and B). All significant correlations between symptoms and microbiota
or host genes were of moderate strength ranging from ρ =|0.33| – |0.5|.
Associations between the GI symptom layer and the mucosal layer are featured in Fig. 5 A. Specifically, bloat-
ing showed a positive correlation to Lentisphaerae, as well as a negative correlation to Bacteroidetes; constipation
was positively associated to Tenericutes as well as the anti-inflammatory cytokine IL-10; satiety showed a negative
correlation to the tight junction protein TJP-1. However, abdominal pain and diarrhea showed no significant
correlation to the analyzed host genes or microbiota.
The associations of both the mucosal layer and the GI symptom layer with the psychological symptoms layer
are visualized in Fig. 5 B. General anxiety (HAD) was negatively correlated to Actinobacteria, and the tight-
junction proteins OCLN and TJP1, but showed no statistically significant direct correlation to the GI symptom
layer. Depression was also negatively correlated to TJP1, and positively correlated to enteroendocrine protein
CGB, and positively correlated to satiety. GI-specific anxiety (VSI) showed a negative correlation to Actinobac-
teria and a positive correlation to diarrhea. General fatigue (MFI) showed a positive correlation to CGB, and a
negative correlation to TJP1, and was positively correlated to abdominal pain and satiety.
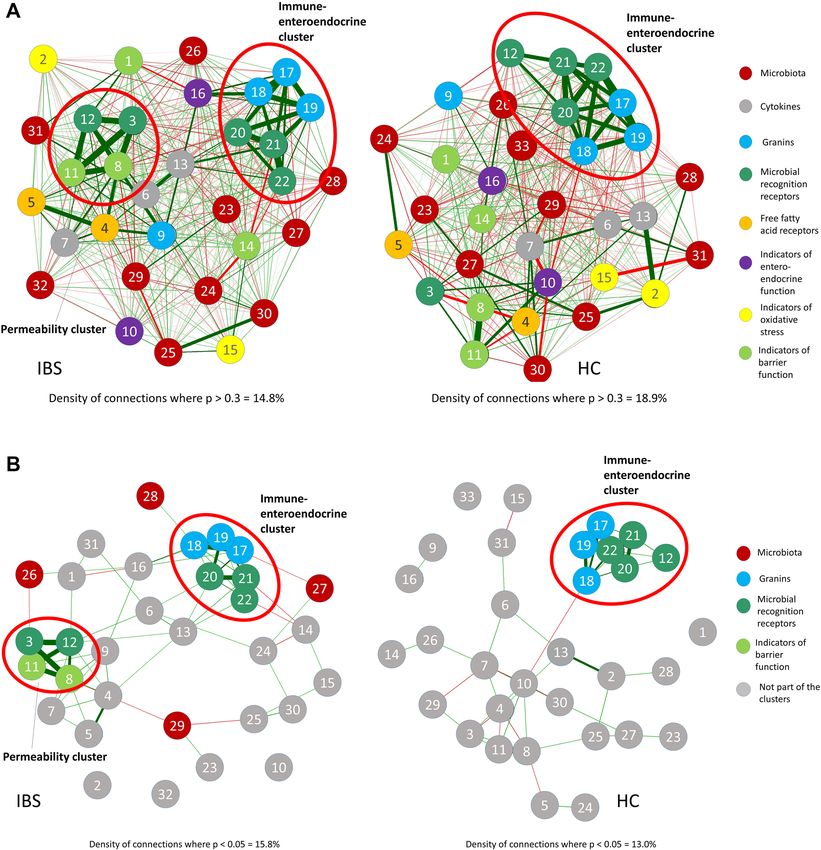
Detailed taxonomic assignment of patient‑specific interaction patterns on genus level. To
better understand the above described associations, we performed additional network analyses with a more
detailed taxonomic assignment on genus level (“desummarizing step”, as described in Fig. 2). This was done
on the variables contained in the patients’ immune-enteroendocrine cluster as well as bacteria of the Firmi-
cutes-phylum, since after exclusion of outliers, Fusobacteria showed no statistically significant association. This
showed that the genes of the immune-enteroendocrine cluster of patients were positively correlated to Fine-
goldia, Peptoniphilus, Ruminococcus II (of the family Lachnospiracea), Flavonifractor, Turicibacter and Acidami-
nococcus, and negatively correlated to Lactobacillus and Lactococcus (Fig. 6). All correlation coefficients are given
in Supplementary Figure 5.
No further detailed analyses were conducted with regards to the permeability cluster in IBS patients since
only the family Parachlamydiaceae of the Chlamydia phylum and only the genus Victivallis of the Lentisphaerae
phylum were found to be present in the samples. Likewise, since the immune-activation cluster in HC showed
no significant association to any microbiota, no detailed analyses were performed.
Additionally, genus-level network analyses were performed on Actinobacteria and Bacteroidetes, which were
associated to symptoms but not mucosal genes. No further analyses were performed on the genera Tenericutes
and Lentispharae, as for Tenericutes only Anaeroplasma and Asteroleplasma, and for Lentispharae only the genus
Victivallis were found.
The Actinobacteria Microbacterium, Rothia, Bifidobacterium and Gardnerella, as well as unclassified genera
from the families Bifidobacteriaceae and Coriobacteriaceae were associated to GI-specific and psychological
symptoms (Supplementary Figure 3). All correlation coefficients are given in Supplementary Table 6.
The Bacteroidetes genera Barnesiella, Paraprevotella, Prevotella, Alistipes and Pedobacter as well as unclassified
genera from the families Prevotellaceae and Flavobacteriaceae were negatively associated to both GI-specific
and psychological symptoms (Supplementary Figure 3). All correlation coefficients are given in Supplementary
Table 7.
Discussion
In this exploratory study we developed a stepwise integrative analysis pipeline tailored to identify host-microbiota
interactions and link to symptoms. Furthermore, to demonstrate the execution, we applied the pipeline to a pilot
data set. Here we identified patterns of host-microbiota interactions found in IBS patients but not in HC, and
were able to link these patterns to IBS symptoms, thus confirming the usefulness of our approach. Intestinal
bacteria may regulate intestinal epithelial barrier function and the immune response, and previous studies sup-
port the potential relevance of our findings. For example, Lactobacillus strains have been demonstrated to induce
TLR2 signaling and impact tight junction proteins in epithelial c ells36. Further, L. plantarum has been shown to
induce genomic DNA-dependent and TLR9-mediated elafin secretion in an epithelial cell l ine37.
This study demonstrates a novel approach to explore and compare complex variable interrelatedness in both
IBS patients and HC and to elucidate mucosal crosstalk between host and microbiota. This approach utilizes the
correlation between variables to estimate potential interrelatedness. The resulting correlation patterns need to
Scientific Reports | (2021) 11:5521 | https://doi.org/10.1038/s41598-021-84686-9 8
Vol:.(1234567890)www.nature.com/scientificreports/
Figure 5. (A) Dual layer visualization of the association of host genes and mucosa-adherent microbiota with GI symptoms.
The GI symptom layer reflects the relationship of the key IBS symptoms abdominal pain, constipation, diarrhea, satiety
and bloating with each other, while the mucosal layer reflects patters of host-microbiota interaction corresponding to
Fig. 3. Between-layer correlations are dotted and rho-value is given. (B) Triangle plot integrating three layers to show
the inter-layer associations between patterns of host-microbiota interaction, GI symptoms and psychological symptoms.
Between-layer correlations are dotted and rho-value is given. Only statistically significant correlations are plotted. Green
edges show positive correlation, red edges negative correlation. Closer proximity of nodes and thicker edges show higher
relative correlation strength in the two layers, which is disregarded in the between-layer edges. 1 = CLD1; 2 = DOUX2;
3 = PAR2; 4 = FFAR2; 5 = FFAR3; 6 = IL10; 7 = IL8; 8 = OCLN; 9 = SCG2; 10 = SLC6A4; 11 = TJP1; 12 = TLR4; 13 = TNFα;
14 = MUC; 15 = NOX1; 16 = TPH1; 17 = CHGA; 18 = CHGB; 19 = SCG3; 20 = TLR2; 21 = TLR6; 22 = TLR9; 23 = unclassified
bacteria; 24 = Actinobacteria; 25 = Bacteroidetes; 26 = Chlamydiae; 27 = Firmicutes; 28 = Fusobacteria; 29 = Lentisphaerae;
30 = Proteobacteria; 31 = Tenericutes; 32 = Verrucomicrobia; 33 = Euryarchaeota.
Scientific Reports | (2021) 11:5521 | https://doi.org/10.1038/s41598-021-84686-9 9
Vol.:(0123456789)www.nature.com/scientificreports/
Figure 6. Detailed analysis of the immune-enteroendocrine cluster in IBS patients and microbiota on genus
level. Red color highlights the bacteria significantly associated to mucosal markers, while grey marks remaining
bacteria of the phylum. Only statistically significant correlations are plotted. Green edges show positive
correlation, red edges negative correlation. Closer proximity of nodes and thicker edges show higher relative
correlation strength. Most relevant nodes are labelled in the figure, and the legend to the grey nodes is given in
supplementary.
be interpreted with caution, but may nevertheless highlight variables which might be functionally connected,
either directly or indirectly by mediators. Therefore, using correlations as an approximation for the potential
functional connection of variables may aid in the development of novel hypotheses regarding IBS pathophysiol-
ogy and symptom generation, and suggest relevant targets for further experimental exploration. The differences
of correlation patters of host-microbiota interaction found between IBS patients and HC, and the association
of these to key IBS symptoms, validate the suitability of our stepwise integrative analysis pipeline to analyze
complex, multilevel datasets and define which variable/s may be of most relevance. The multilayer graphs pro-
vide further insight and enhance interpretability of variable association and the role of potential mediators in
complex diseases such as IBS.
Importantly, we demonstrated some patterns to be common for both IBS patients and HC, whereas oth-
ers were specific for patients. Potentially, patient-specific patterns are related to disease mechanisms and may
improve understanding underlying pathology. In addition, the visualization strategy presented here can be scaled
to include additional compartments, thus facilitating the reduction of the amount of latent variables and increas-
ing the resolution of potential pathomechanistic insights. Thus, the integrative analysis pipeline developed and
presented in this study can provide additional information that traditional univariate analyses do not reveal,
making this method useful for research questions relevant to the field of multifactorial diseases.
A method that aids in identifying relevant variables in a highly complex dataset is especially relevant for
improving our understanding of the details of host-microbiota interactions. The majority of gut microbiota
species are difficult and time-consuming to culture, limiting our experimentally validated knowledge of the
physiological function of these species. Integrative analyses as demonstrated here may therefore be highly useful
to identify which of these microbial species are most relevant to focus on experimentally, improving the cost-
effectiveness of such studies and likelihood of relevant findings.
Scientific Reports | (2021) 11:5521 | https://doi.org/10.1038/s41598-021-84686-9 10
Vol:.(1234567890)www.nature.com/scientificreports/
In this study we have preceded the network analysis with a screening for multivariate outliers. This was done
for two reasons: The in between sample variability expected in microbiota analyses as well as the heterogeneity
typically observed in IBS cohorts9,38. A few microbial genera were only present in singular individuals, the cause
of which is yet unidentified. Given the relatively low number of subjects included and the exploratory nature
of this study, excluding these outliers likely is the best compromise to reduce spurious results while maximiz-
ing statistical power. In studies including a higher amount of study subjects this problem may additionally be
addressed by applying a cut-off that excludes microbial genes that are present only in very low frequencies or
only in a very low number of individuals, thus further reducing technical and biological noise in the dataset.
A major challenge in integrative analyses is the question of how to quantify the association between variables
given highly diverse data characteristics. Rank correlations, as applied in this study, enable the simultaneous
analysis of data of different scales. As mentioned above, correlations need to be interpreted with caution. In
biological systems functionally connected mechanisms are commonly correlated, but, given the complexity of
biological systems, direct causality cannot be concluded. Nevertheless, this integrative analytical approach can
be applied to narrow down which components of complex biological systems may most likely be functionally
connected and therefore are most relevant targets for more detailed experimental analyses. Furthermore, by
applying a multilayer approach to the research question, the role of potential mediators is visualized and can be
taken into account when interpreting the plots. Additional layers can be added to the analysis in future studies
to further enhance the complexity of the obtained results.
Our stepwise integrative analysis pipeline comprises several steps, which, in combination, narrow down the
most relevant variables. The initial step is a summarizing/clustering step, which favors the interpretability of the
resulting integrative plot, but sacrifices detailed information. Therefor complementary secondary integrative
plots are created to achieve a higher resolution of variable associations. Choosing the right strategy for creating
the initial summarized variables remains a challenge since very little is known about most gut microbial species.
With growing knowledge about the physiological function of these species a better summarizing criterion than
phylogenetic relatedness may be developed, but at this time point this likely is the best alternative. Despite these
considerations, our approach showed very noteworthy results in the presented study, suggesting that future
studies, with further improved summarizing step to reduce the risk of false-negative findings, may yield even
more accurate results.
There are several limitations to this study. First, the rather small number of mucosal genes analyzed in this
study is a limitation, as genes not analyzed in this study will most likely also be of high relevance in the orchestra-
tion of host-microbiota interaction. Hence, using comprehensive methods such as whole transcriptome shotgun
sequencing to obtain a more extensive dataset of host gene expression would make a more detailed and accurate
identification of potential key players possible. Second, while 16 s sequencing is state-of-the-art in microbial
research and useful in identifying the microbial composition in obtained s amples39, it does not provide infor-
mation of quantitative nature. Third, traditionally OTU counts are normalized to account for sequencing depth
using ratio-calculations or r arefication40. These methods have been criticized, and currently various improved
methods are developed, tested and d iscussed40–42. We have thus chosen to apply the median of ratios method as
implemented in DESeq233, which has shown to produce more reliable results when normalizing count data than
traditional methods40,42. Fourth, our patients were recruited from a secondary/tertiary care unit, which holds
the risk of a recruitment bias leading to higher severity of symptoms. Fifth, the microbiota data was sequenced
using only the V5-V6 regions, limiting the resolution of this data, which may be the reason a number of bacteria
remained unclassified. Still, this approach has so far been one of the most used methods to analyze gut micro-
biota. Despite these limitations, we were able to show noteworthy differences between well phenotyped IBS
patients of all subtypes and HC and identify distinct associations between host genes and microbiota, support-
ing the generalizability of our findings. The extensive phenotyping conducted on our participants allows us to
assume a low degree of biological noise in our dataset, which is a strong argument for the relevance of our results.
Taken together, we have developed a novel strategy tailored for analyzing the complex host-microbiota inter-
action and its association to symptoms and demonstrated its successful application to a pilot study dataset. Dis-
tinct differences between IBS patients and HC were identified, and an association of host-microbiota interaction
patterns to key IBS symptoms was demonstrated, as well as the potential role of mediators highlighted. Applying
the described pipeline to even more comprehensive datasets may aid in unravelling the complex host-microbiota
interactions in health and disease and aid in identifying key pathophysiological mechanisms and potential bio-
markers. The approach can be used to screen various complex datasets and identify the most relevant variables
for further experimental validation.
Received: 1 April 2020; Accepted: 15 February 2021
References
1. Lacy, B. E. et al. Bowel disorders. Gastroenterology 150, 1393–1407. https://doi.org/10.1053/j.gastro.2016.02.031 (2016).
2. Longstreth, G. F. et al. Functional bowel disorders. Gastroenterology 130, 1480–1491. https://doi.org/10.1053/j.gastro.2005.11.061
(2006).
3. Sperber, A. D. et al. The global prevalence of IBS in adults remains elusive due to the heterogeneity of studies: a Rome Foundation
working team literature review. Gut 66, 1075–1082. https://doi.org/10.1136/gutjnl-2015-311240 (2017).
4. Lovell, R. M. & Ford, A. C. Global prevalence of and risk factors for irritable bowel syndrome: a meta-analysis. Clin. Gastroenterol.
Hepatol. 10, 712–721 e714. https://doi.org/10.1016/j.cgh.2012.02.029 (2012).
5. Agarwal, N. & Spiegel, B. M. The effect of irritable bowel syndrome on health-related quality of life and health care expenditures.
Gastroenterol. Clin. N. Am. 40, 11–19. https://doi.org/10.1016/j.gtc.2010.12.013 (2011).
Scientific Reports | (2021) 11:5521 | https://doi.org/10.1038/s41598-021-84686-9 11
Vol.:(0123456789)www.nature.com/scientificreports/
6. Akehurst, R. L. et al. Health-related quality of life and cost impact of irritable bowel syndrome in a UK primary care setting.
Pharmacoeconomics 20, 455–462 (2002).
7. Ballou, S. & Keefer, L. The impact of irritable bowel syndrome on daily functioning: Characterizing and understanding daily
consequences of IBS. Neurogastroenterol. Motil. 29, e12982. https://doi.org/10.1111/nmo.12982 (2017).
8. Canavan, C., West, J. & Card, T. Review article: the economic impact of the irritable bowel syndrome. Aliment Pharmacol. Ther.
40, 1023–1034. https://doi.org/10.1111/apt.12938 (2014).
9. Enck, P. et al. Irritable bowel syndrome. Nat. Rev. Dis. Primers 2, 16014. https://doi.org/10.1038/nrdp.2016.14 (2016).
10. Sood, R., Law, G. R. & Ford, A. C. Diagnosis of IBS: symptoms, symptom-based criteria, biomarkers or “psychomarkers”?. Nat.
Rev. Gastroenterol. Hepatol. 11, 683–691. https://doi.org/10.1038/nrgastro.2014.127 (2014).
11. Bennet, S. M. et al. Global cytokine profiles and association with clinical characteristics in patients with irritable bowel syndrome.
Am. J. Gastroenterol. 111, 1165–1176. https://doi.org/10.1038/ajg.2016.223 (2016).
12. Chadwick, V. S. et al. Activation of the mucosal immune system in irritable bowel syndrome. Gastroenterology 122, 1778–1783
(2002).
13. Hughes, P. A. et al. Immune activation in irritable bowel syndrome: can neuroimmune interactions explain symptoms?. Am. J.
Gastroenterol. 108, 1066–1074. https://doi.org/10.1038/ajg.2013.120 (2013).
14. Langhorst, J. et al. Elevated human beta-defensin-2 levels indicate an activation of the innate immune system in patients with
irritable bowel syndrome. Am. J. Gastroenterol. 104, 404–410. https://doi.org/10.1038/ajg.2008.86 (2009).
15. Liebregts, T. et al. Immune activation in patients with irritable bowel syndrome. Gastroenterology 132, 913–920. https://doi.
org/10.1053/j.gastro.2007.01.046 (2007).
16. Ohman, L., Tornblom, H. & Simren, M. Crosstalk at the mucosal border: importance of the gut microenvironment in IBS. Nat.
Rev. Gastroenterol. Hepatol. 12, 36–49. https://doi.org/10.1038/nrgastro.2014.200 (2015).
17. Tap, J. et al. Identification of an Intestinal microbiota signature associated with severity of irritable bowel syndrome. Gastroenterol-
ogy 152, 111–123 e118. https://doi.org/10.1053/j.gastro.2016.09.049 (2017).
18. Jeffery, I. B. et al. An irritable bowel syndrome subtype defined by species-specific alterations in faecal microbiota. Gut 61, 997–
1006. https://doi.org/10.1136/gutjnl-2011-301501 (2012).
19. Jalanka, J. et al. Effects of bowel cleansing on the intestinal microbiota. Gut 64, 1562–1568. https://doi.org/10.1136/gutjnl-2014-
307240 (2015).
20. Sundin, J., Rangel, I., Repsilber, D. & Brummer, R. J. Cytokine response after stimulation with key commensal bacteria differ in
post-infectious irritable bowel syndrome (PI-IBS) patients compared to healthy controls. PLoS ONE 10, e0134836. https://doi.
org/10.1371/journal.pone.0134836 (2015).
21. Tillisch, K. et al. Consumption of fermented milk product with probiotic modulates brain activity. Gastroenterology 144, 1394–1401,
1401 e1391–1394. https://doi.org/10.1053/j.gastro.2013.02.043 (2013).
22. Pinto-Sanchez, M. I. et al. Probiotic Bifidobacterium longum NCC3001 reduces depression scores and alters brain activity: a
pilot study in patients with irritable bowel syndrome. Gastroenterology 153, 448–459 e448, doi:https://doi.org/10.1053/j.gastr
o.2017.05.003 (2017).
23. Cryan, J. F. & Dinan, T. G. Mind-altering microorganisms: the impact of the gut microbiota on brain and behaviour. Nat. Rev.
Neurosci. 13, 701–712. https://doi.org/10.1038/nrn3346 (2012).
24. Dinan, T. G. & Cryan, J. F. Melancholic microbes: a link between gut microbiota and depression?. Neurogastroenterol. Motil. 25,
713–719. https://doi.org/10.1111/nmo.12198 (2013).
25. Mayer, E. A., Knight, R., Mazmanian, S. K., Cryan, J. F. & Tillisch, K. Gut microbes and the brain: paradigm shift in neuroscience.
J. Neurosci. 34, 15490–15496. https://doi.org/10.1523/JNEUROSCI.3299-14.2014 (2014).
26. Bhattarai, Y. Microbiota-gut-brain axis: Interaction of gut microbes and their metabolites with host epithelial barriers. Neurogas-
troenterol. Motil. 30, e13366. https://doi.org/10.1111/nmo.13366 (2018).
27. Wiklund, I. K. et al. An irritable bowel syndrome-specific symptom questionnaire: development and validation. Scand. J. Gastro-
enterol. 38, 947–954 (2003).
28. Zigmond, A. S. & Snaith, R. P. The hospital anxiety and depression scale. Acta Psychiatric Scand. 67, 361–370 (1983).
29. Labus, J. S. et al. The Visceral Sensitivity Index: development and validation of a gastrointestinal symptom-specific anxiety scale.
Aliment Pharmacol. Ther. 20, 89–97. https://doi.org/10.1111/j.1365-2036.2004.02007.x (2004).
30. Smets, E. M., Garssen, B., Bonke, B. & De Haes, J. C. The Multidimensional Fatigue Inventory (MFI) psychometric qualities of an
instrument to assess fatigue. J. Psychosom. Res. 39, 315–325 (1995).
31. Lewis, S. J. & Heaton, K. W. Stool form scale as a useful guide to intestinal transit time. Scand. J. Gastroenterol. 32, 920–924. https
://doi.org/10.3109/00365529709011203 (1997).
32. Godon, J. J., Zumstein, E., Dabert, P., Habouzit, F. & Moletta, R. Molecular microbial diversity of an anaerobic digestor as deter-
mined by small-subunit rDNA sequence analysis. Appl. Environ. Microbiol. 63, 2802–2813 (1997).
33. Love, M. I., Huber, W. & Anders, S. Moderated estimation of fold change and dispersion for RNA-seq data with DESeq2. Genome
Biol. 15, 550 (2014).
34. R Core Team. R: A language and environment for statistical computing. R Foundation for Statistical Computing, Vienna, Austria;
ISBN 3-900051-07-0 (2017).
35. Epskamp, S., Cramer, A. O., Waldorp, L. J., Schmittmann, V. D. & Borsboom, D. qgraph: Network visualizations of relationships
in psychometric data. J. Stat. Softw. 48(4), 1–8 (2012).
36. Paveljsek, D. et al. Distinctive probiotic features share common TLR2-dependent signalling in intestinal epithelial cells. Cell
Microbiol. 23, e13264. https://doi.org/10.1111/cmi.13264 (2021).
37. Hiramatsu, Y. et al. Lactobacillus plantarum induces genomic DNA-dependent and TLR9-mediated elafin secretion from Caco-2
cells. Asian Pac. J. Allergy Immunol. 37, 36–42. https://doi.org/10.12932/AP-021017-0174 (2019).
38. Drossman, D. A. Functional gastrointestinal disorders: history, pathophysiology, clinical features and Rome IV. Gastroenterology
150, 1262–1297. https://doi.org/10.1053/j.gastro.2016.02.032 (2016).
39. Zoetendal, E. G., Rajilic-Stojanovic, M. & de Vos, W. M. High-throughput diversity and functionality analysis of the gastrointestinal
tract microbiota. Gut 57, 1605–1615. https://doi.org/10.1136/gut.2007.133603 (2008).
40. McMurdie, P. J. & Holmes, S. Waste not, want not: why rarefying microbiome data is inadmissible. PLoS Comput. Biol. 10, e1003531.
https://doi.org/10.1371/journal.pcbi.1003531 (2014).
41. Weiss, S. et al. Normalization and microbial differential abundance strategies depend upon data characteristics. Microbiome 5, 27.
https://doi.org/10.1186/s40168-017-0237-y (2017).
42. Pereira, M. B., Wallroth, M., Jonsson, V. & Kristiansson, E. Comparison of normalization methods for the analysis of metagenomic
gene abundance data. BMC Genomics 19, 274. https://doi.org/10.1186/s12864-018-4637-6 (2018).
Author contributions
A.P. developed the analysis strategy, conducted all analyses, generated the figures and wrote the manuscript.
All authors contributed to study design and interpretation of results. M.S. is the principal investigator for this
research program, planned the study protocol and obtained funding for the study. All authors revised the manu-
script critically. All authors have approved the final version of the article, including the authorship list.
Scientific Reports | (2021) 11:5521 | https://doi.org/10.1038/s41598-021-84686-9 12
Vol:.(1234567890)www.nature.com/scientificreports/
Funding
Open access funding provided by University of Gothenburg. This study was supported by the Swedish Medical
Research Council (Grants 02317, 13409, 21691 and 21692), AFA Insurance, unrestricted grants from Ferring
Pharmaceuticals and Danone Nutricia Research, and by the Faculty of Medicine, University of Gothenburg.
Annikka Polster has received funding from the People Program of the European Union’s Seventh Framework
Program under REA Grant Agreement No. 607652 (NeuroGut).
Competing interests
AP: No competing interests JS: No competing interests JT: Employee of Danone Nutricia MD: Employee of
Danone Nutricia BL: Employee of Danone Nutricia HT: served as Consultant/Advisory Board member for
Almirall, Danone, and Shire LÖ: No competing interests MC: No competing interests MS: received unrestricted
research grants from Danone, and Ferring Pharmaceuticals, and served as a Consultant/Advisory Board member
for AstraZeneca, Danone, Nestlé, Almirall, Allergan, Albireo, Glycom, and Shire, and as a speaker for Tillotts,
Menarini, Takeda, Shire, Allergan, and Almirall.
Additional information
Supplementary Information The online version contains supplementary material available at https://doi.
org/10.1038/s41598-021-84686-9.
Correspondence and requests for materials should be addressed to A.P.
Reprints and permissions information is available at www.nature.com/reprints.
Publisher’s note Springer Nature remains neutral with regard to jurisdictional claims in published maps and
institutional affiliations.
Open Access This article is licensed under a Creative Commons Attribution 4.0 International
License, which permits use, sharing, adaptation, distribution and reproduction in any medium or
format, as long as you give appropriate credit to the original author(s) and the source, provide a link to the
Creative Commons licence, and indicate if changes were made. The images or other third party material in this
article are included in the article’s Creative Commons licence, unless indicated otherwise in a credit line to the
material. If material is not included in the article’s Creative Commons licence and your intended use is not
permitted by statutory regulation or exceeds the permitted use, you will need to obtain permission directly from
the copyright holder. To view a copy of this licence, visit http://creativecommons.org/licenses/by/4.0/.
© The Author(s) 2021
Scientific Reports | (2021) 11:5521 | https://doi.org/10.1038/s41598-021-84686-9 13
Vol.:(0123456789)You can also read