The Colorado River Delta and California's Central Valley are critical regions for many migrating North American landbirds - AWS
←
→
Page content transcription
If your browser does not render page correctly, please read the page content below
AmericanOrnithology.org

                                                                                                                  Volume 123, 2021, pp. 1–14
                                                                                                            DOI: 10.1093/ornithapp/duaa064

RESEARCH ARTICLE

The Colorado River Delta and California’s Central Valley are critical regions
for many migrating North American landbirds

                                                                                                                                               Downloaded from https://academic.oup.com/condor/advance-article/doi/10.1093/ornithapp/duaa064/6119082 by guest on 26 January 2021
William V. DeLuca,1,*, Tim Meehan,2 Nat Seavy,3, Andrea Jones,4 Jennifer Pitt,2 Jill L. Deppe,5 and
Chad B. Wilsey6,
1
  National Audubon Society, Amherst, Massachusetts, USA
2
  National Audubon Society, Boulder, Colorado, USA
3
  National Audubon Society, Forestville, California, USA
4
  National Audubon Society, Sacramento, California, USA
5
  National Audubon Society, Washington, District of Columbia, USA
6
  National Audubon Society, San Francisco, California, USA
* Corresponding author: william.deluca@audubon.org
Submission Date: June 3, 2020; Editorial Acceptance Date: September 24, 2020; Published January 26, 2021

    ABSTRACT
    Migration is an important component of some species full annual cycle. California’s Central Valley and the Colorado
    River Delta provide important riparian and wetland habitats for migrating waterbirds in the arid west of North America,
    but little is known about whether these locations are important at the population level to migrating landbirds. We used
    eBird Status and Trends abundance data to quantify the importance of the Central Valley and Colorado River Delta to
    landbirds by estimating the proportion of the breeding population of 112 species that use each site during migration.
    We found that ~17 million landbirds use the Colorado River Delta in the spring and ~14 million in the fall. Across 4 study
    regions in the Central Valley, up to ~65 million landbirds migrate through in the spring and up to ~48 million in the fall.
    In the spring and fall, respectively, up to 37 and up to 30 species had at least 1% of their continental population migrate
    through the study regions. We also quantified the spatial concentration of each species across latitudinal transects to
    determine the extent to which study regions were acting as migratory bottlenecks. Landbird abundances were spatially
    concentrated in study regions 29.4% of all migration weeks, indicating that each study region acts as a migratory bot-
    tleneck. This application of eBird data is a powerful approach to quantifying the importance of sites to migrating birds.
    Our results provide evidence of population-level importance of the Central Valley and Colorado River Delta for many
    migratory landbirds.
    Keywords: bottleneck, concentration, conservation, eBird, migration, population

    LAY SUMMARY
    • Migratory birds are declining throughout North America, and we must identify places birds need during migration so
      they can safely move between breeding and winter locations.
    • The Colorado River Delta and the Central Valley are known as important landscapes for wildlife, but their importance
      to migrating landbirds is not well known.
    • We used eBird data to measure the importance of the Colorado River Delta and California’s Central Valley to birds that
      migrate through western North America.
    • Many species have substantial portions of their populations that depend on these locations during migration.
    • Conservation of the Colorado River Delta and Central Valley are important for the entire populations of many breeding
      landbird species of North America.

    El Delta del Río Colorado y el Valle Central de California son regiones críticas para muchas aves terrestres
    migratorias de Norteamérica
    RESUMEN
    La migración es un componente importante del ciclo anual completo de algunas especies. El Valle Central de California
    y el Delta del Río Colorado brindan hábitats ribereños y humedales importantes para las aves acuáticas migratorias en
    la parte árida del oeste de Norteamérica, pero se conoce poco si estas localidades son importantes a nivel poblacional
    para las aves terrestres migratorias. Usamos los datos de abundancia del proyecto eBird Status and Trends para
    cuantificar la importancia del Valle Central y del Delta del Río Colorado para las aves terrestres mediante la estimación

Copyright © American Ornithological Society 2021. All rights reserved. For permissions, e-mail: journals.permissions@oup.com.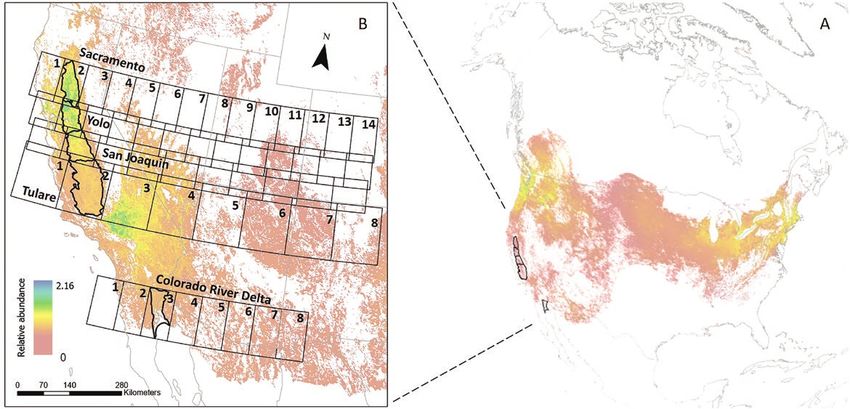
2   Quantifying migration in the American West                                           W. V. DeLuca, T. Meehan, N. Seavy, et al.

    de la proporción de la población reproductiva de 112 especies que usan cada sitio durante la migración. Encontramos
    que ~17 millones de aves terrestres usan el Delta del Río Colorado en primavera y ~14 millones en otoño. A lo largo
    de cuatro regiones de estudio en el Valle Central, hasta ~65 millones de aves terrestres migran en primavera y hasta
    ~48 millones en otoño. En primavera y otoño, respectivamente, hasta 37 y 30 especies tuvieron al menos el 1% de su
    población continental migrando a través de las regiones de estudio. También cuantificamos la concentración espacial
    de cada especie a lo largo de transectas latitudinales para determinar la medida en la que las regiones de estudio
    estuvieron actuando como cuellos de botella migratorios. Las abundancias de aves terrestres estuvieron espacialmente
    concentradas en las regiones de estudio el 29.4% de todas las semanas de migración, indicando que cada región de

                                                                                                                                      Downloaded from https://academic.oup.com/condor/advance-article/doi/10.1093/ornithapp/duaa064/6119082 by guest on 26 January 2021
    estudio actúa como un cuello de botella migratorio. Esta aplicación de los datos de eBird es un enfoque poderoso
    para cuantificar la importancia de los sitios para las aves migratorias. Nuestros resultados brindan evidencia de la
    importancia a nivel poblacional del Valle Central y del Delta del Río Colorado para muchas aves terrestres migratorias.
    Palabras clave: concentración, conservación, cuello de botella, eBird, migración, población

INTRODUCTION                                                      hotspot in the otherwise harsh Sonoran Desert, the river’s
                                                                  delta is now greatly reduced (Pitt et al. 2000).
Effective conservation of many North American birds                  As the Central Valley and the Colorado River Delta
requires consideration of more than just the stationary           have become the focus of major restoration efforts,
breeding period (Marra et al. 2015). This approach requires       landbird conservation planning has focused on the
understanding the conservation value of bird habitat              value of these areas for breeding birds (Hinojosa-Huerta
during breeding, migration, and winter periods. While the         et al. 2004, Dybala et al. 2017), especially their ability
breeding ecology of many landbirds is relatively well known,      to support nesting of species of conservation concern,
there is much less information available for migration and        including Least Bell’s Vireo (Vireo bellii pusillus), Yellow-
winter periods (Faaborg et al. 2010). As the conservation         billed Cuckoo (Coccyzus americanus), and Southwestern
community works to address the large-scale declines of            Willow Flycatcher (Empidonax traillii extimus). During
migratory birds (Rosenberg et al. 2019), quantifying the          the nonbreeding season, attention has been placed on
importance of areas for migrating landbirds will help pri-        the conservation value of these areas to migrating and
oritize places for the protection of birds across their full      overwintering waterbird and shorebird populations
annual cycle.                                                     (Shuford et al. 1998, Gomez-Sapiens et al. 2013, Page et al.
   The need for additional information on landbird mi-            2014, Petrie et al. 2016, Hinojosa-Huerta et al. 2013b) with
gration is especially relevant in western North America,          less emphasis on landbirds (but see Hinojosa-Huerta et al.
where landbird migration remains relatively under-                2004). What is known about landbird migration across
studied (Carlisle et al. 2009). Unlike landbirds that mi-         these areas has been largely derived from local habitat use
grate through eastern North America, western migrants             studies (van Riper et al. 2008, Cormier et al. 2013, Darrah
are not faced with extended overwater flights. Rather,            et al. 2017, Greco and Airola 2018).
they are faced with the challenge of piecing together                One challenge to evaluating the importance of land-
suitable stopover sites across a relatively arid landscape        scapes to migratory species has always been the difficulty
(Kelly and Hutto 2005, Azpiroz et al. 2012). In the arid          in quantifying the passage of migratory birds. However,
environment of the southwestern United States and                 in recent decades, advances in aggregating observations
northwest Mexico, limited distribution of water in-               from community scientists, a more inclusive term for
fluences food and habitat availability for many species           citizen scientists (Meehan et al. 2019), have provided new
passing through this region during migration.                     approaches to understanding bird migration (La Sorte
   California’s Central Valley and the Colorado River             et al. 2014). Range-wide abundance information based on
Delta are 2 examples of regions in the American West              eBird data has been estimated throughout the Western
with conservation efforts that focus on water resources           Hemisphere for hundreds of North American breeding
and land management to maintain their rich biodiversity           bird species (Fink et al. 2020a). These estimates are par-
throughout the year. In the Central Valley, the Sacramento        ticularly useful when considering migratory birds because
and San Joaquin Rivers were once the source of extensive          they include weekly estimates of abundance across species’
riparian ecosystems and wetland complexes, but much of            ranges throughout their annual cycle (Johnston et al. 2019,
that water is now redirected for anthropogenic purposes           Schuster et al. 2019). Additionally, these estimates are pro-
and much of the historical floodplain forest has been con-        duced at a relatively fine spatial resolution (2.96 × 2.96
verted to agriculture. The result has been a reduction in         km cell size), allowing for the consideration of site use at
the extent and function of the habitat for migratory birds        relatively local scales. These estimates are a powerful tool
(Dybala et al. 2017). A similar situation has unfolded in the     that can be used as the basis of spatial prioritizations for
lower Colorado River Basin. Once a productive biodiversity        conservation efforts in the context of the full annual cycle

Ornithological Applications 123:1–14, © 2021 American Ornithological Society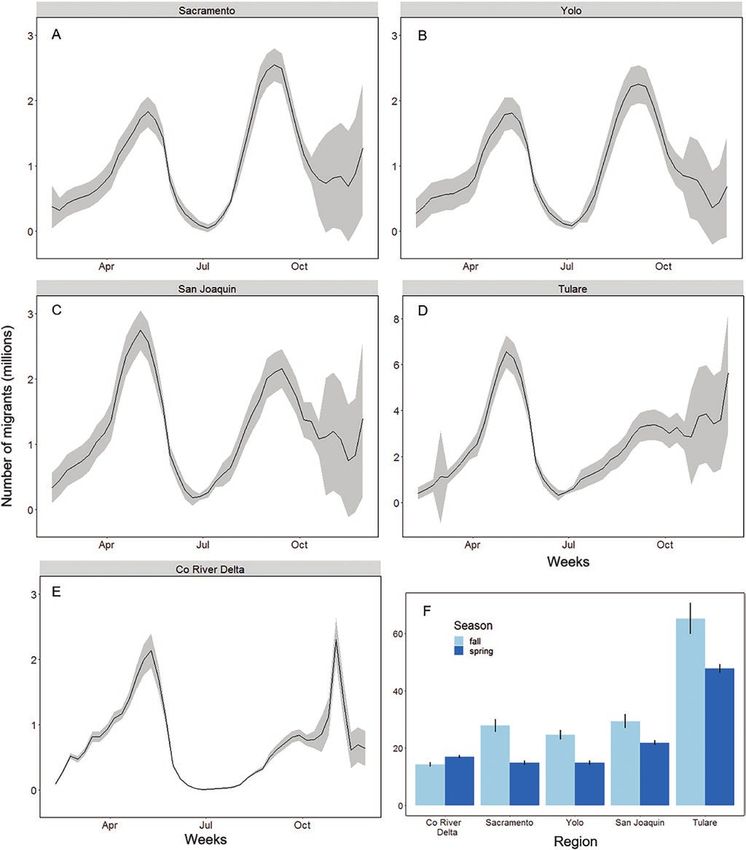
W. V. DeLuca, T. Meehan, N. Seavy, et al.                                             Quantifying migration in the American West     3

                                                                                                                                           Downloaded from https://academic.oup.com/condor/advance-article/doi/10.1093/ornithapp/duaa064/6119082 by guest on 26 January 2021
FIGURE 1. (A) eBird abundance estimates averaged across the breeding season throughout the breeding range of Willow Flycatcher.
In both (A) and (B), bold black lines define the study regions. (B) eBird abundance data for Willow Flycatcher during a week of fall mi-
gration (week 37). The Sacramento, Yolo, San Joaquin, and Tulare are within California’s Central Valley. Gray cells comprise each study
region’s latitudinal transect which stretches from the Pacific Ocean to the Continental Divide. Cells represent a minimum study region
containing rectangle, such that the top and bottoms are consistent with parallels and the sides are consistent with meridians. Cells
were then repeated latitudinally to complete the transect. Numbered cells along the Sacramento, Tulare, and Colorado River Delta
transects correspond to cell numbers in Figure 5.

(Schuster et al. 2019, Wilson et al. 2019, Johnston et al.           along the west by Route 5 in Mexico, the south by the Gulf
2020), as well as offering the potential to quantify the im-         of California, and to the east by Routes 40 and 3 in Mexico
portance of sites to migratory birds.                                (Figure 1). Most of this area is within Mexico and is con-
   We used weekly abundance data modeled from eBird                  sistent with international planning and conservation ef-
(Fink et al. 2020a) to quantify the importance of the                forts (Pitt et al. 2000, Hinojosa-Huerta et al. 2013a). The
Colorado River Delta and California’s Central Valley to 112          upland portion of the site is Sonoran Desert and agricul-
migratory landbird species during spring and fall migration.         ture (Pitt et al. 2000). Along the river, the riparian vegeta-
We combined abundance data with population estimates                 tion was historically dominated by cottonwood and willow
to generate weekly estimates of numbers of individuals               (Glenn et al. 2001), but today non-native salt-cedar is dom-
using the Delta and Valley during migration. We then es-             inant outside of habitat restoration sites. At the southern
timated the proportion of species’ continental populations           extent of the region, the Delta itself is a broad alluvial plain
that use each region during each migration season. Finally,          and is defined by large brackish wetlands and tidal mud
we quantified the weekly spatial concentration of each spe-          flats. Much of the freshwater-dependent habitat is stressed
cies migrating through the study region along a latitudinal          due to the lack of flow from the Colorado River to the sea
transect from the Pacific Ocean to the Continental Divide            caused by anthropogenic uses throughout the watershed
to estimate the extent to which the Delta and the Valley             (Pitt et al. 2017). The general size of the Delta also approxi-
may be acting as migratory bottlenecks.                              mates the smallest extent we felt appropriate to apply our
                                                                     analyses.
METHODS                                                                 California’s Central Valley (hereafter “Valley”) is gen-
                                                                     erally delineated by the Sierra Nevada to the east and the
Study Regions                                                        Coast Ranges to the west. Historically, the Valley contained
We chose 2 study areas that are recognized as important for          extensive riparian forests and wetlands but most have been
migratory birds: the Colorado River Delta and California’s           lost due to agriculture, water diversion, and development
Central Valley (Figure 1). The Colorado River Delta (here-           (Katibah 1984). To maintain consistency with established
after “Delta”) study area is ~930,000 ha and is approxi-             conservation planning regions and with the analytical spa-
mately bounded in the north by Interstate 8 in California,           tial extent of analyses applied to the Delta, Valley study

                                                        Ornithological Applications 123:1–14, © 2021 American Ornithological Society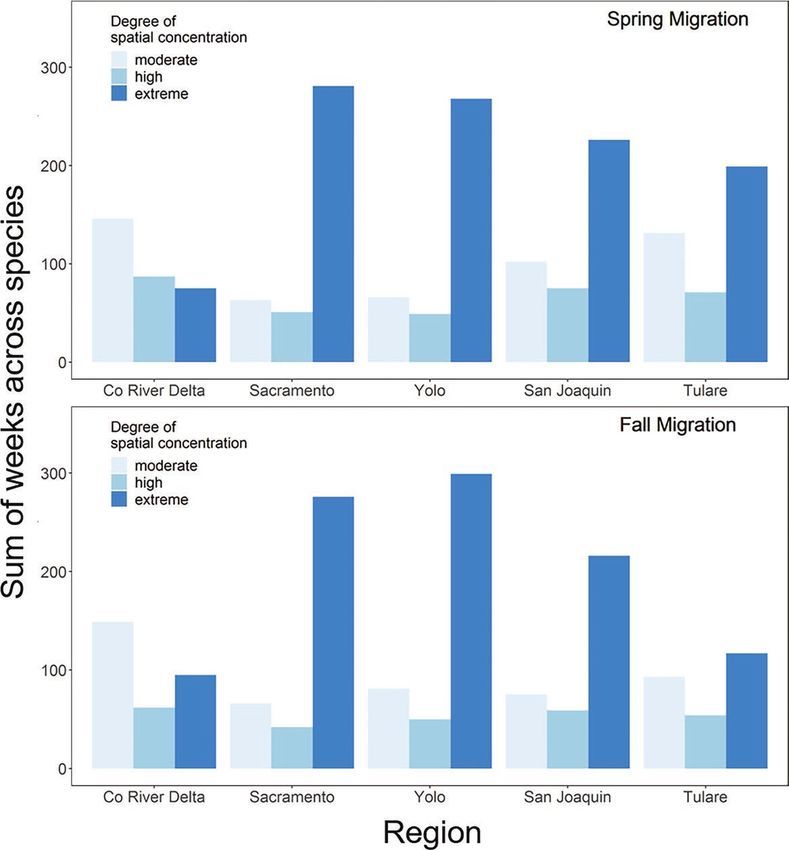
4   Quantifying migration in the American West                                            W. V. DeLuca, T. Meehan, N. Seavy, et al.

regions are based on 4 planning regions identified by the          were substituted for aw and sa, respectively, and i repre-
Central Valley Joint Venture (Figure 1; Dybala et al. 2017).       sented each pixel across the continent. After producing a
The northern-most region (~1,000,000 ha) is the valley             continental sum for each breeding week, we computed an
shaped by the Sacramento River (hereafter “Sacramento”);           average “breeding season sum,” Ā, and standard error, sĀ,
                                                                                             »
the region immediately south is defined by the Yolo Basin                     A
                                                                   as A = W w and sA =             s2A . With a weekly abundance
and the delta of the Sacramento and San Joaquin Rivers
                                                                   sum, aw, available for a study area, and the average breeding
(~890,000 ha; hereafter “Yolo”); the San Joaquin River
                                                                   season sum, Ā, available for the continent, we computed

                                                                                                                                         Downloaded from https://academic.oup.com/condor/advance-article/doi/10.1093/ornithapp/duaa064/6119082 by guest on 26 January 2021
Valley (~1,150,000 ha; hereafter “San Joaquin”) is the re-
                                                                   the proportion of the continental population that used a
gion just south of the Yolo study region; and the Tulare
                                                                   study area on a weekly basis. This “weekly continental pro-
Basin (hereafter “Tulare”) defines the southernmost sub-
                                                                   portion,” pw, and its standard error, sp, were computed as
region (~2,690,000 ha, Figure 1; Dybala et al. 2017).
                                                                                                     Å        ã2       Å        ã2
Study Species                                                                    aw                      sa                sA
                                                                          pw =      and sp = pw                    +                 ,
We identified 112 migratory landbird species                                     A                       aw                A
(Supplementary Material Table S1) with a reasonable
potential to use either the Valley or Delta during migra-          where fractional errors were summed in quadrature and
tion. We generated this list by using range maps and mi-           then scaled to the proportion (Taylor 1997). To convert
gratory season dates from eBird Status and Trends (Fink            from relative abundance, aw, to estimates of numbers of in-
et al. 2020b). We included species that may overwinter             dividual birds, Nw, passing through a study area per week,
or breed at a site as well as migrate through it in addition       we multiplied the weekly continental proportion, pw, by
to species that use the sites solely during migration. The         Partners in Flight (PIF) continental population estimates,
final list includes 25 families of migratory landbirds but         C, for a given species (Stanton et al. 2019), as Nw = pw ×
did not include raptors. We chose not to include raptors           C. The PIF breeding population estimates are the only
because they have different migratory behavior than most           comprehensive population estimates available for North
landbirds, often preferring to follow ridgelines (Goodrich         American breeding birds and are derived from the Breeding
and Smith 2008).                                                   Bird Survey. A standard error for Nw was estimated as

                                                                                            Å ã2  2
                                                                                              sp        sC
Total Landbirds and Population Proportions Migrating                                sN =            +         ,
through Study Regions                                                                         pw        C
We used the ebirdst package (Auer et al. 2020) in Program          where a standard error for the continental abundance esti-
R 3.6.1 (R Core Team 2019) to access eBird Status and
                                                                   mate was estimated as sC = uc −l
                                                                                                  t , uc and lc were the upper
                                                                                                    c
Trends data (Fink et al. 2020b). The following process was
                                                                   and lower 95% confidence limits for C, and z was 3.92, a
applied to each species and study region. First, we summed
                                                                   value of the z-distribution for approximating a standard
the relative abundance values across cells (2.96 × 2.96 km)
                                                                   error from a 95% confidence interval (see Supplementary
within a study region per week (Figure  1B) to produce aw,        Material Figure S1 for an illustrated summary of this
a “weekly abundance sum,” as aw =         αi , where α i was the
                                                                   process).
abundance index of the ith cell in the study area. A standard
                                                                      For species that do not have an overwintering or
error, sa, for the sum was estimated by summing errors in
                                                                   breeding population within a study region, we cal-
quadrature (square root of the sum of squared uncertainty
                                                                   culated the area under the total individuals per week
values; Taylor 1997),
                                                                   curve for the defined (Fink et al. 2020b) pre- and post-
                            …                                      breeding migratory period (Supplementary Material

                       sa =         σ2i ,                          Figure S2A) to estimate the “summed individuals per
                                                                   season” using the study region. When species had either
where σ i was the standard error estimate for each α i, calcu-     an overwintering or breeding population at a study re-
lated as σi = ui −l
                 z , where ui and li were the upper and lower
                   i
                                                                   gion, we calculated the area under the curve that was
80% confidence limits for α i, and z was 2.56, a value of the      above the maximum of the breeding and overwintering
z-distribution for approximating a standard error from an          abundance values that occurred during the middle of the
80% confidence interval. Next, we calculated an analogous          2 seasons (Supplementary Material Figure S2B and C).
weekly sum and standard error, Aw and sA, but for the en-          We chose the chronological medians to account for in-
tire continent and only for the weeks during the breeding          stances when the predefined seasonal dates (Fink et al.
season (as defined by Fink et al. 2020b). This process fol-        2020b) were inaccurate for our study regions. Finally, we
lowed the same equations as above, except that Aw and sA           summed total individuals per season across species for

Ornithological Applications 123:1–14, © 2021 American Ornithological Society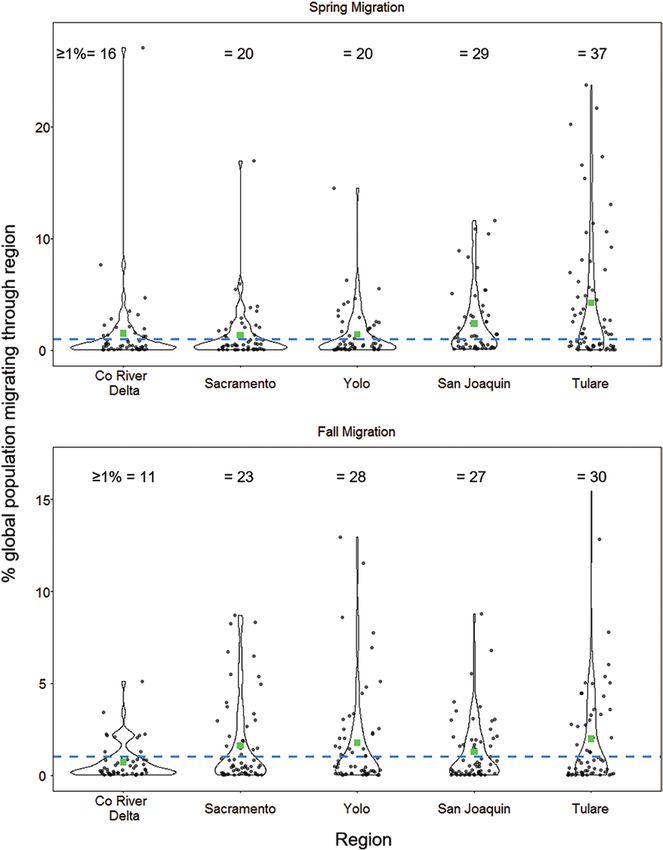
W. V. DeLuca, T. Meehan, N. Seavy, et al.                                        Quantifying migration in the American West   5

each season to estimate the total number of migratory             species had proportional abundance values 1–2, 2–3, and
landbirds using each study region per season. As before,          more than 3 times greater than if it was equally distrib-
uncertainty in total individuals per week and season              uted across the transect. We then categorized the spatial
was propagated across sums by summing approximate                 concentration bins as moderate (1–2 times), high (2–3
standard errors in quadrature.                                    times), and extreme (>3 times). For example, if 35% of all
   To contextualize the estimate of migrating landbirds           abundance values within the latitude transect was found
passing through the study regions, we calculated the pro-         in the cell containing the Delta for week 16, it would get

                                                                                                                                    Downloaded from https://academic.oup.com/condor/advance-article/doi/10.1093/ornithapp/duaa064/6119082 by guest on 26 January 2021
portion of the continental breeding population (hereafter,        counted in the 2–3 bin and categorized as high spatial con-
“continental breeding proportion”) using the study re-            centration, because even distribution across those 8 cells
gion during migration. As mentioned above, continental            of that transect would be 13%. All values are reported with
breeding population estimates were taken from North               ± standard error.
American Partners in Flight estimates (Stanton et al. 2019).
The continental breeding proportion was calculated by             RESULTS
dividing the summed individuals per season by the con-
tinental population estimate per species, season, and study       Total Landbirds and Population Proportions Migrating
region. Uncertainty was again propagated to this propor-          through Study Regions
tion through summing fractional errors and rescaling. In          Of the 112 species considered, 83 used the Delta during
order to put the continental breeding proportions into fur-       migration, 82 used the Sacramento, 79 used the Yolo, 89
ther conservation context, we compared them to Birdlife           used the San Joaquin, and 91 species used the Tulare study
International’s criteria A4 for determining important bird        regions. Across each of the 5 study regions, landbird abun-
areas, which allows study regions to qualify if it is “known      dance peaked during the migratory seasons (Figure 2A–E;
or thought to hold congregations of ≥1% of the global             Supplementary Material Figure S3). At each of the Central
population of one or more species on a regular or predict-        Valley study regions, migrants were more abundant in the
able basis” (BirdLife International 2020).                        fall than in the spring (Figure 2F). The total number of mi-
                                                                  gratory landbirds was relatively similar across migration
Spatial Concentrations                                            seasons in the Colorado River Delta (Figure 2F). The Tulare
To determine if species are spatially concentrating at a          study region, which was the largest study region, had the
study region on a weekly basis during migration within            most migratory landbirds during both fall (65,229,117 ±
western flyways, we established a latitudinal transect for        2,713,517) and spring (47,763,101 ± 736,814) migration
each study region that stretched from the Pacific Ocean to        (Figure 2F). In the fall, the Delta had the least number of
the Continental Divide. We chose to bound this transect           migrating individuals (14,329,393 ± 388,511), while in the
at the Continental Divide because most western landbird           spring the Sacramento study region had the lowest number
migration occurs to the west of this major geographic fea-        of migrating landbirds (14,872,554 ± 343,184; Figure 2F).
ture (La Sorte et al. 2014). We constructed a minimum             During spring migration, Wilson’s Warbler (Cardellina
bounding rectangle (hereafter “cell”) for each study region       pusilla) was the most abundant landbird in each of the 5
such that the tops and bottoms are delineated by parallels,       study regions (Supplementary Material Table S1). Wilson’s
and the sides are delineated by meridians. We repeated            Warbler was also the most abundant landbird during fall
this process to create adjacent but non-overlapping rect-         migration in the Sacramento and Yolo study regions. Tree
angles across each transect (Figure 1B). For each week,           Swallow (Tachycineta bicolor) was the most abundant fall
study region, and species, we estimated the proportional          migrant in the San Joaquin and Tulare study regions. In
abundance of each cell compared to the complete tran-             the Delta, Orange-crowned Warblers (Oreothlypis celata)
sect. For species that had breeding or overwintering popu-        were the most abundant landbird during fall migration
lations within the study cell, we used the same approach          (Supplementary Material Table S1).
as outlined above to ensure our estimates were focused on            Each of the 5 study regions proved to be critically im-
migrants. The transect for the Sacramento study region            portant at the continental population level during one or
had 14 cells, the Yolo had 13 cells, the San Joaquin had          more of the migration seasons (Figure 3; Supplementary
10 cells, the Tulare study had 8 cells, and the Delta had 8       Material Table S1). For spring migration, 79.3% (±29.1)
cells (Figure 1B). Therefore, if abundance was distributed        of the population of Lawrence’s Goldfinch (Spinus
equally across cells within each transect the proportions         lawrencei) migrated through the Tulare study region
would be 0.07, 0.08, 0.10, 0.13, and 0.13, respectively. In the   and 37 total species had ≥1% of their population migrate
absence of knowing exactly what constitutes a meaningful          through the region (Figure 3; Supplementary Material
spatial concentration, for each cell containing a study re-       Table S1). In the Delta, 27.1% (±1.5) of the Tree Swallow
gion, we then summarized the number of weeks that each            population used the region and 15 other species had ≥1%

                                                     Ornithological Applications 123:1–14, © 2021 American Ornithological Society
6 Quantifying migration in the American West W. V. DeLuca, T. Meehan, N. Seavy, et al.
Downloaded from https://academic.oup.com/condor/advance-article/doi/10.1093/ornithapp/duaa064/6119082 by guest on 26 January 2021
FIGURE 2. Weekly estimates (black lines) and 95% confidence intervals (gray) of a total number of individuals across 112 landbird spe-
cies using 4 sites in California’s Central Valley (A–D) and the Colorado River Delta (E). See Supplementary Figure S3 for individual species
plots. (F) Estimates and 95% confidence intervals of a total number of individuals using each site during fall and spring migration across
112 landbird species. Estimates of the total number of individuals were generated using eBird abundance data.
of their population migrate through the Delta (Figure 3; San Joaquin had 29 species (Figure 3; Supplementary
Supplementary Material Table S1). Marsh Wren Material Table S1).
(Cistothorus palustris) had the highest proportion of Across the 5 study regions, between 11 and 30 species
its population in the Sacramento, Yolo, and San Joaquin had ≥1% of their population occur within a study region
study regions: 17.0% (±2.9), 14.5% (±2.5), and 11.6% during fall migration (Figure 3; Supplementary Material
(±2.0), respectively. The Sacramento and Yolo study re- Table S1). Tree Swallows had the highest proportion of
gions had a total of 20 species with ≥1% of their popu- their population occur in the Tulare (58.9% ± 3.2) and San
lation using the regions during spring migration and the Joaquin (23.6% ± 1.3) study regions. Black-throated Gray
Ornithological Applications 123:1–14, © 2021 American Ornithological SocietyW. V. DeLuca, T. Meehan, N. Seavy, et al. Quantifying migration in the American West 7
Downloaded from https://academic.oup.com/condor/advance-article/doi/10.1093/ornithapp/duaa064/6119082 by guest on 26 January 2021
FIGURE 3. Violin plots created from the full species list (n = 112) where each dot represents the proportion of a species population
that uses a region during spring and fall migration. The green squares show the mean proportion across species within a site and
season. The blue dashed line marks the 1% line. Locations meet the criteria as an Important Bird Area when ≥1% of a species popula-
tion consistently and predictably use the location. The total tally of species that meet these criteria is listed along the top. Although all
values were included in generating the plot, extreme values in the spring (79.3) and fall (58.9, 38.8, 32.6, 26.5) are not shown in the illus-
tration. Population proportions were generated using eBird abundance data and values for all species are included in Supplementary
Material Table S1.
Warblers (Setophaga nigrescens) had the highest propor- (either moderate [1–2×], high [2–3×], or extreme
tion of their population use the Sacramento (26.1% ± 2.6), [>3×]) in at least one of the sites and migratory sea-
Yolo (25.9% ± 2.6), and Colorado River Delta (5.1% ± 0.5) sons (Figure 4). Within species, spatial concentration
study regions. in the study region varied across and within migratory
seasons (Figure 4; Supplementary Material Figure S4).
Spatial Concentrations Both the Valley and the Delta showed evidence of a mi-
Of the 112 species, 111 had at least 1 week where their gration bottleneck as indicated by the presence of high
abundance during migration was spatially concentrated to extreme spatial concentration within study region
Ornithological Applications 123:1–14, © 2021 American Ornithological Society8 Quantifying migration in the American West W. V. DeLuca, T. Meehan, N. Seavy, et al.
Downloaded from https://academic.oup.com/condor/advance-article/doi/10.1093/ornithapp/duaa064/6119082 by guest on 26 January 2021
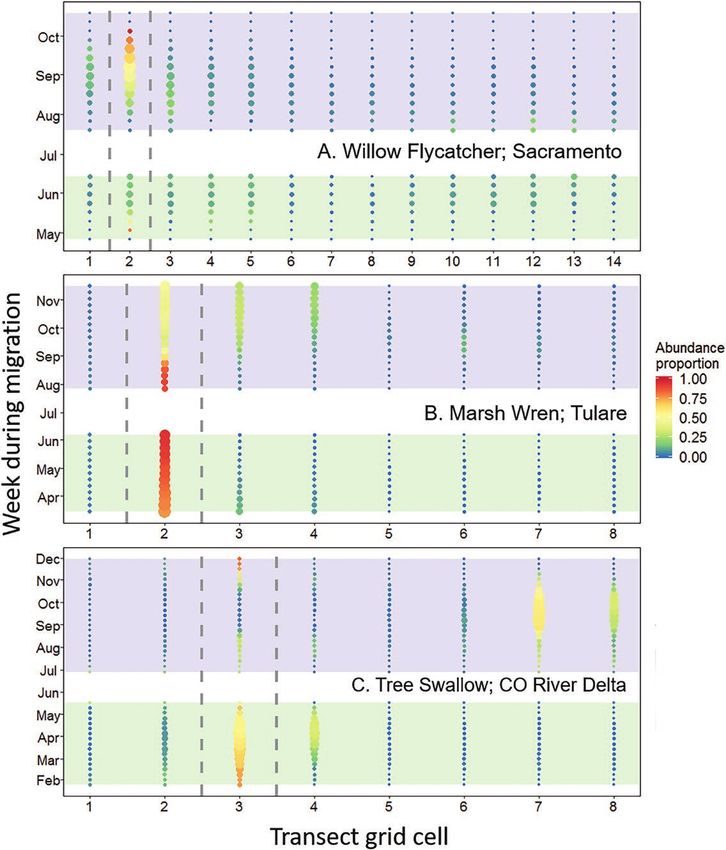
FIGURE 4. Grid plots illustrating the proportional abundance (dot color) in each latitudinal transect grid cell (Figure 1) for each week
during fall (blue rectangle) and spring (green rectangle) migration for 3 example species and study regions. Dot size is relative to total
abundance for that week and cell, where larger dots are indicative of relatively higher abundance values regardless of their propor-
tional relationships to other cells within the transect. Cells between the dashed gray lines correspond to the cell each study region is
located in along the transect illustrated in Figure 1. Examples are (A) Willow Flycatcher for the Sacramento study region transect, (B)
Marsh Wren for the Tulare study region transect, and (C) Tree Swallow for the Colorado River Delta study region transect. Figure 1B
illustrates the spatial concentration of abundance for Willow Flycatcher in mid-September summarized here (A). See Supplementary
Material Figure S4 for plots of each species.
Ornithological Applications 123:1–14, © 2021 American Ornithological SocietyW. V. DeLuca, T. Meehan, N. Seavy, et al. Quantifying migration in the American West 9
Downloaded from https://academic.oup.com/condor/advance-article/doi/10.1093/ornithapp/duaa064/6119082 by guest on 26 January 2021
FIGURE 5. Bar plots summarizing the number of weeks that spatial concentration occurred during fall and spring migration across
112 species for each study region. Spatial concentration was assessed by calculating the proportion of total eBird abundance in the
study cell compared to the total abundance that was in a latitudinal transect stretching across the Pacific Flyway for each study region
(Figure 1). The degree of spatial concentration was classified by first determining the proportion values if abundance was evenly dis-
tributed across the latitudinal transect. Spatial concentration was classified as moderate when the proportion values of the study cell
were 1 to10 Quantifying migration in the American West W. V. DeLuca, T. Meehan, N. Seavy, et al.
cells compared to the full latitudinal transect (Figure 5). estimates of “several million” individuals passing through
Spatial concentration within a study region cell oc- each season (Rosenberg 1991). Our results not only refine
curred during 29% (range across regions: 24.6–36.2%) these estimates but place them in population-level con-
of all migration weeks across species (Supplementary text. Other examples include Black-throated Gray Warbler
Material Table S2). On average, extreme spatial concen- which has 26.0% of its population migrating through the
tration within a study region cell occurred during 16.8% Sacramento study region in the fall and Marsh Wren which
(range across regions: 6.8–25.3%) of all migration weeks has 14.5% of its population migrating through the Yolo
Downloaded from https://academic.oup.com/condor/advance-article/doi/10.1093/ornithapp/duaa064/6119082 by guest on 26 January 2021
(Figure 5; Supplementary Material Table S2). Migratory study region in the spring (Supplementary Material Table
spatial concentration was more evident in study region S1). Our results suggest that the Colorado River Delta
cells in spring, with an average across sites of 34.0% and California’s Central Valley are important regions for
(range: 27.4–37.7%) of migration weeks with spatial con- maintaining populations of many migratory landbirds with
centration, compared to the fall (average across study re- ranges that are not only limited to the west but that span
gions: 25.6%; range across regions: 18.0–35.0%; Figure 5; across North America.
Supplementary Material Table S2). Our approach to use eBird abundance models to gen-
erate estimates of total individuals using a defined geog-
DISCUSSION raphy offers a new tool for assessing space use by migrating
birds. Other approaches that have quantified broad-scale
We showed that each of the 5 study regions is crucial use of space by migrating passerines in North America
to the population-level conservation of several landbird include methods that use radar to estimate the number
species (Figure 3) because they host significant propor- of birds passing latitudinal transects at the northern and
tions (≥1%) of species’ populations during migration. southern extents of the United States during spring and fall
Our study used community science-based, weekly eBird (Dokter et al. 2018). Radar-derived estimates have proved
abundance estimates to provide a comprehensive quan- vitally useful in identifying seasonal (Dokter et al. 2018)
tification of the use of 2 critical regions of conserva- and long-term (Rosenberg et al. 2019) population changes;
tion concern in the western United States, the Colorado however, radar technology cannot identify species and
River Delta and the Central Valley of California, by 112 therefore results in conclusions spanning all avifauna. For
migrating landbird species. Here we developed and species such as shorebirds that regularly congregate in
applied an approach to estimate the population-level habitats that make broad-scale, field-based surveys feas-
importance of specific locations during migration to ible, counts of total individuals, similar to those presented
breeding landbird populations and to quantify the de- in our study, have been made for sites like the Delaware
gree to which species weekly abundances are spatially Bay which report daily counts up to 426,162 total shore-
concentrated and, thus, may be considered a migra- birds (Clark et al. 1993). Survey-based estimates of site
tory bottleneck. We show that across species, there are use during migration can offer fine temporal resolution
hundreds of weeks when species’ abundance is concen- and reasonably accurate estimates by species (Kwon et al.
trated within study regions (Figure 5). This work offers a 2018) but this usually comes with significant time and fi-
novel, multifaceted approach of quantifying spatial use nancial investments. eBird currently has weekly abun-
of migrating landbirds using community-based, eBird dance estimates for 610 species, enabling the possibility of
abundance data. applying our approach to other species and locations at
minimal costs.
Total Landbirds and Population Proportions Migrating To understand the population-level importance of a lo-
through Study Regions cation to a species during migration, we determined the
We estimated that a total of ~14 (spring) and ~17 (fall) mil- proportion of each species’ population that uses each study
lion landbirds migrated through the Colorado River Delta region during spring and fall migration. There is no clear
and at least ~65 (spring) and ~48 (fall) million landbirds threshold for determining whether a specific population
migrated through the Central Valley (Figure 2). There are proportion value is critical from a conservation perspec-
several examples of species for whom some study regions tive, and it is likely that values vary by species depending
are important at the population level. One such example is on population size and trend. However, we used BirdLife
Tree Swallow, a declining aerial insectivore whose breeding International’s Global Important Bird Area criteria A4,
population is distributed across North America (Rosenberg which allows a site to qualify as globally significant if it
et al. 2019); 27.1% (±0.02) of their population uses the regularly holds congregations of ≥1% of the global popula-
Colorado River Delta in the spring and 58.9% (±0.03) of tion of one or more species (BirdLife International 2020).
their population uses the Tulare of the Central Valley in We used the ≥1% threshold only to provide context for the
the fall. Tree Swallows have previously been identified as population proportions calculated for each site and spe-
the Colorado River Delta’s most numerous migrant with cies. Therefore, we interpret values that meet this threshold
Ornithological Applications 123:1–14, © 2021 American Ornithological SocietyW. V. DeLuca, T. Meehan, N. Seavy, et al. Quantifying migration in the American West 11
(Figure 3) as the study region having population-level im- the limitations of the data and how they are applied. We
portance for a given species. We recognize that despite the recognize that eBird abundance estimates vary in pre-
use of this threshold, interpretation of these data does not dictive ability across species and within species, across
necessarily mean that a value below the threshold is not their range throughout the year. For example, our results
important for a species. Consequently, we provide total (Figure 2) reflect a decrease in eBird abundance model
population proportion values for each species, study re- performance during the overwintering season, which is
gion, and migratory season (Figure 3 and Supplementary a common signature in eBird relative abundance models
Downloaded from https://academic.oup.com/condor/advance-article/doi/10.1093/ornithapp/duaa064/6119082 by guest on 26 January 2021
Material Table S1). (Fink et al. 2020b). eBird data, upon which the abundance
models are dependent, are not randomly sampled across
Spatial Concentrations space, and the observations not necessarily independent,
Migratory bottlenecks are “passage points where geog- particularly when they are entered as complete checklists.
raphy constrains migration, leading to significant con- It is possible that the abundance models across species
centrations of populations that could elevate threats or could exaggerate consistency in the response of species to
risks” (Bayly et al. 2018). We found that each study re- their environmental predictors. Our results would then re-
gion had hundreds of weeks where bird abundance esti- flect that potentially misleading consistency across species.
mates were concentrated in study regions. Regions in the Furthermore, the accuracy of the PIF population estimates
Central Valley, in particular, showed evidence of migratory also has many sources of error that vary across species
bottlenecks; most had well over 400 weeks during migra- (Stanton et al. 2019). Therefore, our estimates of study re-
tion (16.8% of all weeks during migration across species) gion use by migrating landbirds incorporate this variation
when abundances were concentrated compared to the rest in predictive ability over time, space, and species.
of the latitudinal transect (Figure 5). These results suggest Our approach depends on several assumptions and the
that when landbirds are migrating through western fly- extent to which they are violated introduces new sources
ways of North America, they are often funneled through of error. One assumption that our analysis makes is that
the Central Valley and Colorado River Delta. once an individual passes through the region, it does not
The temporal resolution of the data (weekly) enabled us reenter the region. For example, during the spring mi-
to detect variations in the spatial concentration within and gration, a bird would not travel north through the site
between migratory seasons, suggesting that regions may and then return south, reentering the site. We believe
act as a migratory bottleneck during either spring or fall that this assumption is likely not violated to the extent
but often not both (Figure 4). Furthermore, within a migra- that it would influence our results. In addition to being
tory season, the distribution of landbird abundance across sensitive to the abundance models, our results, like pre-
space can either remain relatively constant throughout vious efforts to quantify the number of migratory birds
a migratory season (Figure 4B) or the concentration (Hahn et al. 2009), are dependent on the accuracy of con-
abundance can vary as a migratory season progresses tinental estimates of the size of breeding populations.
(Figure 4C). The temporally dynamic nature of migratory A second assumption our approach uses is that individ-
bottlenecks is often only detected with labor-intensive sur- uals do not linger within the study region for prolonged
veys (Farmer et al. 2007, Stȩpniewska et al. 2013). When periods of time (i.e. longer than 1 week, the temporal
locations are quantified as migratory bottlenecks, they resolution of the eBird abundance models). The extent to
frequently depend solely on surveys conducted at a site which this assumption is violated could inflate our esti-
and lack a comparison across space to confirm disparate mates of total individuals using the region and the extent
abundance across the flyway. Our approach offers the flexi- to which individuals stay in the region for less than a
bility of using readily available community science-based week, we could be underestimating the number of indi-
data (Fink et al. 2020a) and can be applied to any region viduals using the study region. For example, Rosenberg
of conservation concern in the context of any flyway. (1991) states that Tree Swallows may “take up temporary
Locations with on-the-ground migratory abundance sur- residence in roosts” at specific locations in the Colorado
veys, coupled with a spatial concentration analysis like the River Delta region. Examples like this could result in
one highlighted here, would offer a comprehensive exam- our counting temporary residents across multiple weeks
ination of space use by migrants at both the site and flyway when our approach assumes new individuals each week.
scales. The population estimates we used have been care-
fully developed by Partners in Flight (Stanton et al. 2019)
Limitations and Assumptions and have been used to quantify the magnitude of broad-
The eBird Status and Trends weekly estimates of abun- scale changes in the number of migratory birds over time
dance are a powerful tool for conservation (Schuster et al. (Rosenberg et al. 2019). As estimates of breeding popula-
2019, Wilson et al. 2019), but it is important to understand tions become more accurate, so will our ability to use eBird
Ornithological Applications 123:1–14, © 2021 American Ornithological Society12 Quantifying migration in the American West W. V. DeLuca, T. Meehan, N. Seavy, et al.
abundance models to quantify the numbers of migrating during migration subsidizes the values generated during
birds. In the meantime, on-the-ground counts of migrating the breeding season (Semmens et al. 2018). Quantifying
birds will remain an important component of validating the value of these subsidies to other regions could pro-
these modeled results. These assumptions highlight the vide additional funding for large-scale river restoration
importance of maintaining a measure of uncertainty and programs. The regional and population-level importance of
were the motivation that we used the delta method, as de- these sites underlines the significance of maintaining local
scribed above, to propagate error through all the estimates habitat quality, not only for breeding birds, but also for
Downloaded from https://academic.oup.com/condor/advance-article/doi/10.1093/ornithapp/duaa064/6119082 by guest on 26 January 2021
generated in these analyses. those that are passing through on migration. For example,
Within the study regions in which we quantified mi- in the Colorado River Delta, native riparian willow (Salix
grant abundance, there may be significant variation across gooddingii) habitat provides the most efficient foraging for
habitats is not recognized by our coarse-filter approach. spring migrating Wilson’s Warbler (Darrah et al. 2017) and
For example, Humple and Geupel (2002) found that is sensitive to Colorado River flow reductions (Hinojosa-
Orange-crowned Warblers, Yellow Warbler (Setophaga Huerta et al. 2013a). Likewise, in urban areas in the Central
petechia), and Ruby-crowned Kinglet (Regulus calen- Valley, the abundance of migrating wood warblers is posi-
dula) were common migrants in remnant riparian for- tively correlated with the cover of native oaks (Quercus
ests along the Sacramento, San Joaquin, and Cosumnes lobata; Greco and Airola 2018). Both examples illustrate
Rivers. However, in an independent study in urban areas how fine-scale vegetation characteristics may be important
of the northern Central Valley, Greco and Airola (2018) to maintaining habitat quality for migratory birds within
reported that the most abundant migrants were 4 spe- and beyond the boundaries of the site. Our approach can
cies of wood warblers, Black-throated Gray, Wilson’s, identify which migrants are most abundant across large
Orange-crowned, and Yellow Warblers. Similarly, in the areas but maintaining the habitat quality within these areas
southwestern United States, migrating landbirds use will depend on more detailed studies of bird behavior and
both riparian and upland areas, and the year-to-year their habitat preferences during migration.
preference for these sites may depend on annual weather One of the challenges to understanding migratory birds
conditions (Kellermann and van Riper 2015). Because across their full annual cycle is that their annual migra-
our analysis was based on eBird abundance models that tory movements cover long distances, are spread across
average across multiple years, they cannot be used to vast areas, and their presence in any one location is typ-
evaluate whether migrating birds may be more abun- ically fleeting. This analysis illustrates the tremendous
dant along these major rivers during dry years, nor can value of applying models generated from data collected
they be used to evaluate whether some vegetation types by community scientists to address questions about bird
may be used preferentially over others. However, as these migration at appropriate spatial scales and at population
models become available at finer spatial and temporal levels (La Sorte et al. 2014). The application of this ana-
resolutions, the application to these types of questions lysis framework across broader spatial extents could help
will improve. identify important stopover regions not previously identi-
fied and in addition, when applied to other known areas of
Conservation and Management Implications conservation importance, could help illuminate temporal
Our results demonstrate that the protection and restor- shifts of avian use throughout the year. Further analyses
ation of ecosystems in the Central Valley and the Colorado that address similar questions at finer spatial and temporal
River Delta have the potential to contribute to the conser- resolutions and in more remote regions will depend on the
vation not just of birds that breed or winter within these continued engagement of community scientists.
regions, but also to the conservation of millions of birds
that breed across North America but migrate through this
region. Incorporating this information into conservation SUPPLEMENTARY MATERIAL
planning has the potential to extend the value of ecosystem
restoration beyond the local footprint of the Colorado Supplementary material is available at Ornithological
River Delta and Central Valley. For example, analytical Applications online.
approaches have been developed to use the information
on migratory species movements to quantify the flow of
ecosystem services between breeding and nonbreeding re- ACKNOWLEDGMENTS
gions (Semmens et al. 2011). If migratory birds generate We are grateful for the time and thought Megan Hertel, Karyn
significant economic value on their breeding grounds (e.g., Stockdale, Daniel Orr, Samantha Arthur, David O’Neill,
through recreational bird watching), this approach could Nicolas Gonzalez, Joey Kahn, Jason Howe, and Nada Culver
be used to quantify the degree to which the habitat used invested in this project to ensure that it would successfully
Ornithological Applications 123:1–14, © 2021 American Ornithological SocietyW. V. DeLuca, T. Meehan, N. Seavy, et al. Quantifying migration in the American West 13
inform conservation. Thank you to Tom Auer and Orrin North America’s migratory avifauna determined by weather
Robinson, Cornell Lab of Ornithology, for providing feedback radar. Nature Ecology & Evolution 2:1603–1609.
on the early conceptual and analytical development of this Dybala, K., N. Clipperton, T. Gardali, G. H. Golet, R. Kelsey,
project. Finally, we appreciate everyone in the Migratory Bird S. Lorenzato, R. Melcer, N. E. Seavy, J. G. Silviera, G. S. Yarris, and
Initiative for providing a scientifically rigorous and creative California Department of Water Resources (2017). Population
sounding board. This work was made possible by generous and habitat objectives for avian conservation in California’s
gifts to Audubon’s Migratory Bird Initiative from Joseph Ellis Central Valley riparian ecosystems. San Francisco Estuary and
and Earl L. and Barbara Doolin. Watershed Science 15. doi:10.15447/sfews.2017v15iss1art5
Downloaded from https://academic.oup.com/condor/advance-article/doi/10.1093/ornithapp/duaa064/6119082 by guest on 26 January 2021
Funding statement: Funding was provided by the National Faaborg, J., R. T. Holmes, A. D. Anders, K. L. Bildstein, K. M. Dugger,
S. A. Gauthreaux, Jr, P. Heglund, K. A. Hobson, A. E. Jahn,
Audubon Society.
D. H. Johnson, et al. (2010). Conserving migratory land birds in
Ethics statement: We followed the National Audubon
the new world: Do we know enough? Ecological Applications
Society’s ethics guidelines.
20:398–418.
Author contributions: W.V.D., T.M., N.S., J.L.D., and Farmer, C. J., D. J. T. Hussell, and D. Mizrahi (2007). Detecting
C.B.W. conceived the idea and designed the study and population trends in migratory birds of prey. The Auk
W.V.D. and T.M. analyzed and summarized the data. A.J. and 124:1047–1062.
J.P. contributed regional perspectives throughout the process. Fink, D., T. Auer, A. Johnston, V. Ruiz-Gutierrez, W. M. Hochachka,
All authors contributed to writing the manuscript. and S. Kelling (2020a). Modeling avian full annual cycle dis-
Data availability: Analyses reported in this article can be tribution and population trends with citizen science data.
reproduced using the data and code provided by https:// Ecological Applications 30:e02056.
github.com/audubongit/western_landbird_migration. Fink, D., T. Auer, A. Johnston, M. Strimas-Mackey, O. Robinson,
Supplementary Material Figures S3 and S4 are located at S. Ligocki, B. Petersen, C. Wood, I. Davies, B. Sullivan, et al.
https://doi.org/10.5061/dryad.3j9kd51gc. (2020b). eBird Status and Trends. https://registry.opendata.
aws/ebirdst/
Glenn, E. P., F. Zamora-Arroyo, P. L. Nagler, M. Briggs, W. Shaw,
LITERATURE CITED and K. Flessa (2001). Ecology and conservation biology of the
Colorado River delta, Mexico. Journal of Arid Environments
Auer, T., D. Fink, and M. Strimas-Mackey (2020). ebirdst: Tools for 49:5–15.
loading, plotting, mapping and analysis of eBird Status and Gomez-Sapiens, M. M., E. Soto-Montoya, and O. Hinojosa-
Trends data products. https://cornelllabofornithology.github. Huerta (2013). Shorebird abundance and species diver-
io/ebirdst/ sity in natural intertidal and non-tidal anthropogenic
Azpiroz, A. B., J. P. Isacch, R. A. Dias, A. S. Di Giacomo, C. S. Fontana, wetlands of the Colorado River Delta, Mexico. Ecological
and C. M. Palarea (2012). Ecology and conservation of grass- Engineering 59:74–83.
land birds in southeastern South America: A review. The Goodrich, L. J., and J. P. Smith (2008). Raptor migration in
Journal of Field Ornithology 83:217–246. North America. In State of North America’s Birds of Prey
Bayly, N. J., K. V. Rosenberg, W. E. Easton, C. Gómez, J. Carlisle, (K. L. Bildstein, J. R. Smith, E. R. Inzunza, and R. R. Veit, Editors).
D. N. Ewert, A. Drake, and L. Goodrich (2018). Major stopover Nuttall Ornithological Club and the American Ornithologist’s
regions and migratory bottlenecks for Nearctic-Neotropical Union, Washington, DC, USA.
landbirds within the Neotropics: A review. Bird Conservation Greco, S. E., and D. A. Airola (2018). The importance of native valley
International 28:1–26. oaks (Quercus lobata) as stopover habitat for migratory song-
BirdLife International (2020). BirdLife Data Zone. http://datazone. birds in urban Sacramento, California, USA. Urban Forestry &
birdlife.org/site/ibacritglob Urban Greening 29:303–311.
Carlisle, J. D., S. K. Skagen, B. E. Kus, C. van Riper, K. L. Paxton, and Hahn, S., S. Bauer, and F. Liechti (2009). The natural link between
J. F. Kelly (2009). Landbird migration in the American West: Europe and Africa—2.1 billion birds on migration. Oikos
Recent progress and future research directions. The Condor 118:624–626.
111:211–225. Hinojosa-Huerta, O. M., H. Iturribarría-Rojas, Y. Carrillo-Guerrero,
Clark, K., L. Niles, and J. Burger (1993). Abundance and distri- M. de la Garza-Treviño, and E. Zamora-Hernández (2004). Bird
bution of migrant shorebirds in Delaware Bay. The Condor Conservation Plan for the Colorado River Delta. Pronatura
95:694–705. Noroeste, Dirección de Conservación Sonora, San Luis Río
Cormier, R. L., T. Gardali, and J. K. Wood (2013). Assessing mi- Colorado, Sonora, México.
gratory stopover site quality for birds during fall migra- Hinojosa-Huerta, O., P. L. Nagler, Y. K. Carrillo-Guererro, and
tion along two California rivers. Western North American E. P. Glenn (2013a). Effects of drought on birds and riparian
Naturalist 73:72–79. vegetation in the Colorado River Delta, Mexico. Ecological
Darrah, A. J., H. F. Greeney, and C. van Riper (2017). Importance of Engineering 51:275–281.
the 2014 Colorado River Delta pulse flow for migratory song- Hinojosa-Huerta, O., E. Soto-Montoya, M. Gomez-Sapiens,
birds: Insights from foraging behavior. Ecological Engineering A. Calvo-Fonseca, R. Guzman-Olachea, J. Butron-Mendez,
106:784–790. J. Juan Butron-Rodriguez, and M. Roman-Rodriguez (2013b).
Dokter, A. M., A. Farnsworth, D. Fink, V. Ruiz-Gutierrez, The birds of the Cienega de Santa Clara, a wetland of inter-
W. M. Hochachka, F. A. La Sorte, O. J. Robinson, K. V. Rosenberg, national importance within the Colorado River Delta.
and S. Kelling (2018). Seasonal abundance and survival of Ecological Engineering 59:61–73.
Ornithological Applications 123:1–14, © 2021 American Ornithological Society14 Quantifying migration in the American West W. V. DeLuca, T. Meehan, N. Seavy, et al.
Humple, D. L., and G. R. Geupel (2002). Autumn populations of (2017). It takes more than water: Restoring the Colorado River
birds in riparian habitat of California’s Central Valley. Western Delta. Ecological Engineering 106:629–632.
Birds 33:34–50. Pitt, J., D. F. Luecke, M. J. Cohen, E. P. Glenn, and C. Valdes-Casillas
Johnston, A., T. Auer, D. Fink, M. Strimas-Mackey, M. Iliff, (2000). Two nations, one river: Managing ecosystem conser-
K. V. Rosenberg, S. Brown, R. Lanctot, A. D. Rodewald, and vation in the Colorado River delta. Natural Resources Journal
S. Kelling (2020). Comparing abundance distributions and 40:819–864.
range maps in spatial conservation planning for migratory R Core Team (2019). R: A Language and Environment for Statistical
species. Ecological Applications 30:e02058. Computing. Vienna, Austria. http://www.R-project.org/
Downloaded from https://academic.oup.com/condor/advance-article/doi/10.1093/ornithapp/duaa064/6119082 by guest on 26 January 2021
Johnston, A., W. M. Hochachka, M. Strimas-Mackey, V. R. Gutierrez, van Riper, C., K. Paxton, C. van Riper, K. van Riper, L. McGrath,
O. J. Robinson, E. T. Miller, T. Auer, S. T. Kelling, and D. Fink and J. Fontaine (2008). The Role of Protected Areas as bird
(2019). Best practices for making reliable inferences from Stop-Over Habitat: Ecology and Habitat Utilization by
citizen science data: Case study using eBird to estimate spe- Migrating Landbirds Within Colorado River Riparian Forests
cies distributions. bioRxiv 574392. of Southwestern North America. Nebraska Cooperative
Katibah, E. F. (1984). A brief history of riparian forests in the Central Fish & Wildlife Research Unit—Staff Publications. https://
Valley of California. In California Riparian Systems: Ecology, digitalcommons.unl.edu/ncfwrustaff/78
Conservation, and Productive Management (R. E. Warner and Rosenberg, K. V. (1991). Birds of the Lower Colorado River Valley.
K. M. Hendrix, Editors). University of California Press, Berkeley, University of Arizona Press, Tucson, AZ, USA.
CA, USA. pp. 23–29. Rosenberg, K. V., A. M. Dokter, P. J. Blancher, J. R. Sauer, A. C. Smith,
Kellermann, J. L., and C. van Riper (2015). Detecting mismatches P. A. Smith, J. C. Stanton, A. Panjabi, L. Helft, M. Parr, et al. (2019).
of bird migration stopover and tree phenology in response to Decline of the North American avifauna. Science 366:120–124.
changing climate. Oecologia 178:1227–1238. Schuster, R., S. Wilson, A. D. Rodewald, P. Arcese, D. Fink, T. Auer, and
Kelly, J. F., and R. L. Hutto (2005). An east-west comparison of J. R. Bennett (2019). Optimizing the conservation of migratory
migration in North American wood warblers. The Condor species over their full annual cycle. Nature Communications
107:197–211. 10:1754.
Kwon, E., L. M. Houghton, R. E. Settlage, D. H. Catlin, S. M. Karpanty, Semmens, D. J., J. E. Diffendorfer, K. J. Bagstad, R. Wiederholt,
and J. D. Fraser (2018). Estimating transient populations of K. Oberhauser, L. Ries, B. X. Semmens, J. Goldstein, J. Loomis,
unmarked individuals at a migratory stopover site using W. E. Thogmartin, et al. (2018). Quantifying ecosystem service
generalized N-mixture models. Journal of Applied Ecology flows at multiple scales across the range of a long-distance mi-
55:2917–2932. gratory species. Ecosystem Services 31:255–264.
La Sorte, F. A., D. Fink, W. M. Hochachka, A. Farnsworth, Semmens, D. J., J. E. Diffendorfer, L. López-Hoffman, and
A. D. Rodewald, K. V. Rosenberg, B. L. Sullivan, D. W. Winkler, C. D. Shapiro (2011). Accounting for the ecosystem services of
C. Wood, and S. Kelling (2014). The role of atmospheric condi- migratory species: Quantifying migration support and spatial
tions in the seasonal dynamics of North American migration subsidies. Ecological Economics 70:2236–2242.
flyways. Journal of Biogeography 41:1685–1696. Shuford, W. D., G. W. Page, and J. E. Kjelmyr (1998). Patterns and
Marra, P. P., E. B. Cohen, S. R. Loss, J. E. Rutter, and C. M. Tonra dynamics of shorebird use of California’s Central Valley. The
(2015). A call for full annual cycle research in animal ecology. Condor 100:227–244.
Biology Letters 11. doi:10.1098/rsbl.2015.0552 Stanton, J., P. Blancher, K. Rosenberg, A. Panjabi, and W. Thogmartin
Meehan, T. D., S. Arthur, N. L. Michel, C. B. Wilsey, and G. M. Langham (2019). Estimating uncertainty of North American landbird
(2019). Trends in tricolored blackbird colony size: 2008 through population sizes. Avian Conservation and Ecology 14:4.
2017. The Journal of Wildlife Management 83:1237–1243. Stȩpniewska, K., A. El-Hallah, and P. Busse (2013). Migration dy-
Page, G. W., N. Warnock, T. L. Tibbitts, D. Jorgensen, namics and directional preferences of Passerine migrants in
C. A. Hartman, and L. E. Stenzel (2014). Annual migra- Azraq (E Jordan) in Spring 2008. The Ring 33:3–55.
tory patterns of Long-billed Curlews in the American Taylor, J. (1997). Introduction to Error Analysis: The Study of
West. The Condor 116:50–61. Uncertainties in Physical Measurements. University Science
Petrie, M. J., J. P. Fleskes, M. A. Wolder, C. R. Isola, G. S. Yarris, and Books, New York, NY, USA.
D. A. Skalos (2016). Potential effects of drought on carrying cap- Wilson, S., R. Schuster, A. D. Rodewald, J. R. Bennett, A. C. Smith,
acity for wintering waterfowl in the Central Valley of California. F. A. La Sorte, P. H. Verburg, and P. Arcese (2019). Prioritize di-
Journal of Fish and Wildlife Management 7:408–422. versity or declining species? Trade-offs and synergies in spatial
Pitt, J., E. Kendy, K. Schlatter, O. Hinojosa-Huerta, K. Flessa, planning for the conservation of migratory birds in the face of
P. B. Shafroth, J. Ramírez-Hernández, P. Nagler, and E. P. Glenn land cover change. Biological Conservation 239:108285.
Ornithological Applications 123:1–14, © 2021 American Ornithological SocietyYou can also read